1. Introduction
Light pollution occurs when excessive light caused by improper use of artificial lighting or light spillage from an illuminated area interferes with the healthy and comfortable lives of people or damages the environment. Light pollution is a man-made problem in modern society that values visual beauty and enjoys night life. The light pollution caused by quantitatively excessive light in areas adjacent to human living areas where light is needed is a huge social problem with broad social implications and, thus, is likely to garner sufficient attention that may result in comprehensive solutions. However, the light pollution caused by a small amount of light used as needed or that caused by the light required by a few specific users is controversial. Physical activity at night is of great significance in terms of human health and entertainment. Therefore, many sports facilities are regulated as exceptional facilities and are not subject to strict light pollution restrictions. However, the amount of light required by sports facilities far exceeds lighting standards’ requirements, which frequently results in light pollution. Furthermore, sports facilities are generally located near residential spaces and natural green ecosystems, so the harm caused by the light pollution is not negligible. This is not a matter of law and regulation.
Light pollution is typically assessed by measuring the amount of light trespass after building construction has been completed. To the best of our knowledge, there has not been any robust methodology to predict and prevent light pollution at the initial design stage before construction. Sports facilities are usually constructed by local governments and should emphasize the importance of sustainable lighting practices, particularly in areas where light pollution laws have been enacted; government at all levels must lead the way in complying with the law.
Although there are already established measurement methods to evaluate light pollution for residential buildings and decorative lighting, there are still areas where this crucial information is missing. For example, it is difficult to measure light pollution from media architecture and non-static, self-luminous LED displays [
1]. For sports facilities, they require various lighting methods, depending on their configuration and scale and the type of sports they are built to house. For example, the light required for night enjoyment of a tennis court differs from that needed for a running track, which differs again from that needed for a soccer pitch. Therefore, no technique to predict the light pollution caused by large-scale sports facilities has not yet been properly established. Moreover, the methods or techniques used to evaluate light pollution, in general, are based on the measurement of physical light quantities in existing facilities. Even in such cases, there is no established standardized method for conducting such measurements.
Recently, several local governments in Korea have made efforts to predict and prevent light pollution during the initial process of building large-scale sports facilities. This study presents a comprehensive methodology to quantify/evaluate light trespass and skyglow caused by stadium facilities and subsequently proposes design solutions for curbing/reducing said light trespass. Specifically, one technique analyzes the light trespass outside the stadium caused by excess light from the stadium’s tower lighting. Another methodology installed a virtual horizontal surface on top of the stadium design to analyze unnecessary upward light. A third method analyzes the degree of light pollution caused by the aesthetic outdoor lighting around a stadium. Finally, example cases were analyzed to extract the design elements that cause light pollution and derive an improvement plan to reduce it. The proposed methodology is useful to lighting designers who wish to assess the effectiveness, relevant to light pollution, of their lighting schemes at the planning stage of their projects, thus ensuring healthy lit environments. Moreover, it would also be useful to policymakers tasked to evaluate the appropriateness of lighting schemes relevant to light pollution policies.
2. Light Pollution
2.1. Risks of Light Pollution
Light pollution can be defined simply as excessive or misdirected artificial lighting. Scientifically, it has been defined as any change in outdoor light levels caused by artificial lighting [
2]. The International Dark-sky Association (IDA) defines light pollution as the inappropriate or excessive use of artificial lighting [
3].
Recently, light pollution has been noted as one of the most rapidly increasing forms of environmental degradation. In addition to the fundamental problems of sky glow caused by artificial lighting [
4], light pollution is also a cause of several known ecological problems [
5]. Of those known effects, human health problems that arise from exposure to artificial light at night (ALAN), particularly those arising from the use of new light sources (e.g., LEDs), are the most pressing [
6]. Increasing evidence draws potential negative links between ALAN and certain human health conditions.
In light emission allowance criteria, light pollution is measured using the luminance of a light-emitting surface. Some of that light is used for vision, but the rest of it mediates other human biological processes, such as synchronizing light and dark cycles. Image formation problems caused by artificial lighting are mostly associated with glare, which occurs in two types: discomfort and disability glare [
7].
The non-image forming effect of ALAN is primarily caused by disruption of the circadian rhythm, the internal clock that regulates most physiological systems in mammals [
8]. Melatonin is released in the dark at night, particularly between midnight and 4 a.m. [
9]. Exposure to light during that period can inhibit melatonin production, stopping the entire circadian cycle. Non-synchronization of the circadian rhythm is believed to be the cause of many clinical conditions in humans, including diabetes [
10] and various forms of cancer [
11].
Some of the most prevalent studies in this area are those linking breast cancer and artificial light exposure, especially at night. Leading research in the field has shown that women with visual impairments have a lower incidence of breast cancer than women with visual function, supporting a potential causal link between artificial lighting and breast cancer [
12,
13].
Similarly, several studies conducted in the United States (US) [
14,
15] have shown a correlation between a high risk of breast cancer and exposure to artificial light. Schernhammer et al. [
15] studied the relationship between night shift work and the risk of developing breast cancer and found that the risk of breast cancer correlates positively with longer periods of rotating shifts. In a similar study in men [
16], the incidence of prostate cancer was much higher in countries with high ALAN than in countries with low ALAN. In addition to the effects of ALAN, well-documented by Narisada and Schreuder [
17], and issues associated with astronomical activity disorders and the extinction of the natural sky, scientific research continues to reveal the potential link between ALAN and human health [
18].
As evidenced through the existing literature, light pollution could be linked with certain human health conditions. Therefore, legal disputes have arisen, due to concerns about light pollution. Many countries, including Korea [
17,
19], France, and Italy [
20], have begun to stipulate illumination limits, using regulations to reduce light pollution. In addition, organizations such as the International Lighting Commission (CIE) provide general recommendations for the proper and sustainable use of artificial lighting [
21].
2.2. Light Pollution Regulation in Korea
The rapid increase in awareness about the adverse effects of ALAN on humans and general interactions between ecosystems have led to legal actions against the improper use of light, especially at night [
22]. The purpose of light pollution laws is to allow the sensible use of artificial lighting for safety, utility, and security, while minimizing the degradation of the nighttime environment.
The involvement of governmental institutions, in the form of ordinances or laws against ALAN, has increased over the years [
18]. Light pollution laws, ordinances, and prescriptive measures are becoming common in some parts of Europe [
23], Asia [
19,
24], and America [
25]. Similar light pollution management laws have been established in many countries as national laws and regional ordinances. For example, Slovenia and many Italian and Spanish regions now have laws to prevent light pollution [
26]. In Asia, Taiwan [
24] and Chinese regions [
19] also have laws aimed at mitigating light pollution.
Although the effects of ALAN are the same in all areas, countries have taken diverse legal approaches to reduce light pollution. For example, as discussed by Martin-Taylor [
25], the United Kingdom has extended its previously existing law on air pollution to include light pollution. Many Italian regions have enacted individual ordinances to prevent or reduce specific, locally prevalent light-related issues [
27]. A variety of factors influence the type of light pollution laws used by a country or region. For instance, bolt-on laws are likely to be less expensive than stand-alone laws adopted for the specific issue of light pollution [
25]. In addition, ordinances are likely to provide better solutions in countries with cities or regions that experience diverse forms of light pollution [
27].
In terms of light pollution mitigations based on regulations, there are two main elements in common: classification of environmental lighting zones (for differentiation of limits according to area type) and establishment of regulatory frameworks [
28]. Efforts to develop regulations for light pollution reduction address questions about energy efficiency or urban landscape aesthetics [
29]. Light pollution regulation should be simple and understandable to anyone.
The Illuminating Engineering Society and the IDA have jointly enacted the Model Lighting Ordinance [
30], which provides comprehensive procedures to be used as a guideline for preventing light pollution. Their regulations recommend the consistent use of completely shielded outdoor lighting. In addition, IDA regulations recommend a time after which the total lumens from outdoor luminaires should be reduced by about 30% or at which point the lights should be turned off completely.
Korea has some of the most recently enacted laws about light pollution. In Korea, research on artificial lighting and its adverse effects on humans and ecosystems as a whole has gained momentum. The Korean government discussed measures to prevent light pollution caused by excessive ALAN from the time a light pollution bill was submitted to the National Assembly in September 2009 until the bill was passed in December 2011. In that process, light pollution was measured and quantified in various regions of Korea. As a result, the Light Pollution Prevention Act was enacted in February 2013.
Korean regulations define light pollution as “any situation where improper use of electric lighting could impair health and comfort or harm the ecosystem” [
31]. The Korean Light Pollution Prevention Act divides the area into four environmental management zones (E zones) [
32] that range from E1 (darkest areas) to E4 (brightest areas).
Table 1 shows the E zones established by the Light Pollution Prevention Act of Korea.
The lighting requirements specified in the Light Pollution Prevention Act were based on the CIE (2003), based on recommended lighting parameters to prevent light from entering the eye. Light is quantified in two ways: measuring the vertical illuminance caused by streetlights or security lights on residential building windows and measuring the luminance emitted from the light source. The former is used to control the intrusion or interference of light, and the latter is to control the brightness of the light source to manage glare.
2.2.1. Area Lighting
Space lighting includes any type of lighting installed to facilitate safe and pleasant nighttime activities and consists of security and road lighting. The Light Pollution Prevention Act of Korea specifies a maximum vertical illuminance value for space lighting used in each of the four light E zones. This facet of the ordinance mainly addresses light pollution in the form of light trespass into enclosed areas at night.
Table 2 shows the permissible luminance values dictated by the Light Pollution Prevention Act of Korea.
2.2.2. Advertisement Lighting
The Korean Light Pollution Prevention Act defines advertisement lighting as a lighting device installed outdoors for advertising purposes. The act provides legally permitted maximum luminance values for each lighting management area.
Table 3 shows the allowed luminance values for advertising lighting.
2.2.3. Decorative Lighting
Decorative lighting refers to outdoor lighting installed for decorative or recreational purposes. The Prevention Act provides lighting limits for decorative lighting in the form of average and maximum permissible luminance values.
Table 4 shows the acceptable lighting levels for decorative lighting.
3. Materials and Methods
3.1. Quantifying Existing Light Pollution
Quantifying light pollution is quite complex. Measurement and analysis methods play an important role in assessing a given environment for possible light pollution. The visually luminous environment is complex and involves factors such as light sources and luminous properties, so it must be measured accurately. The night view of a modern environment contains many illuminated objects, from building lights to reveal the architectural characteristics of high-rise buildings and bright advertising signs to security lights in residential areas and parks. Therefore, a lot of attention should be paid to how the lighting environment is measured, and the conditions in lighted areas should be evaluated regularly.
Until recently, there was no scientific method for obtaining quantitative light pollution data in Korea. The Korean Minister of the Environment is tasked with establishing and publicly announcing environmental pollution process test standards for the country to ensure uniformity and accuracy in measuring, analyzing, and evaluating environmental pollutants, environmental pollution status, and hazards. Accordingly, the National Institute of Environmental Research of Korea has enacted all matters necessary to maintain accuracy and uniformity in measuring light pollution caused by artificial lighting, in accordance with Article 6 of the Environmental Test and Inspection Act in 2013. The test standards specify light pollution measurement instruments and appliances, a method for measuring the illuminance of a vertical surface in a residential area, a method for measuring the luminance of a luminous surface under decorative lighting, a method for measuring the luminance of a luminous surface under general advertising lighting, and criteria for measuring the luminance from flashing and video all-light advertisements.
Several studies have used aerial night images to measure light pollution [
33]. However, that method is expensive and is generally reserved for large, sporadic research projects. Other studies have used various remote sensing techniques, such as night satellite imagery. However, until recently, those methods had problems with calibration and data acquisition [
26].
In general, luminance measurements can be done at a point using a luminance meter. However, that method has been neglected, because it is inaccurate when measuring the surface luminance emitted by a light source. Among existing technologies, high dynamic range imaging is recognized as the most efficient [
34]. Luminous tone mapping technology is gaining popularity, because it can be used to simulate accurate images that match the amount of light actually emitted in a particular environment. Advances in computer technology have provided a new way of using tone mapping technology to create images that accurately match what can be seen by the human eye [
35].
3.2. Predicting Light Trespass with Computer Simulations
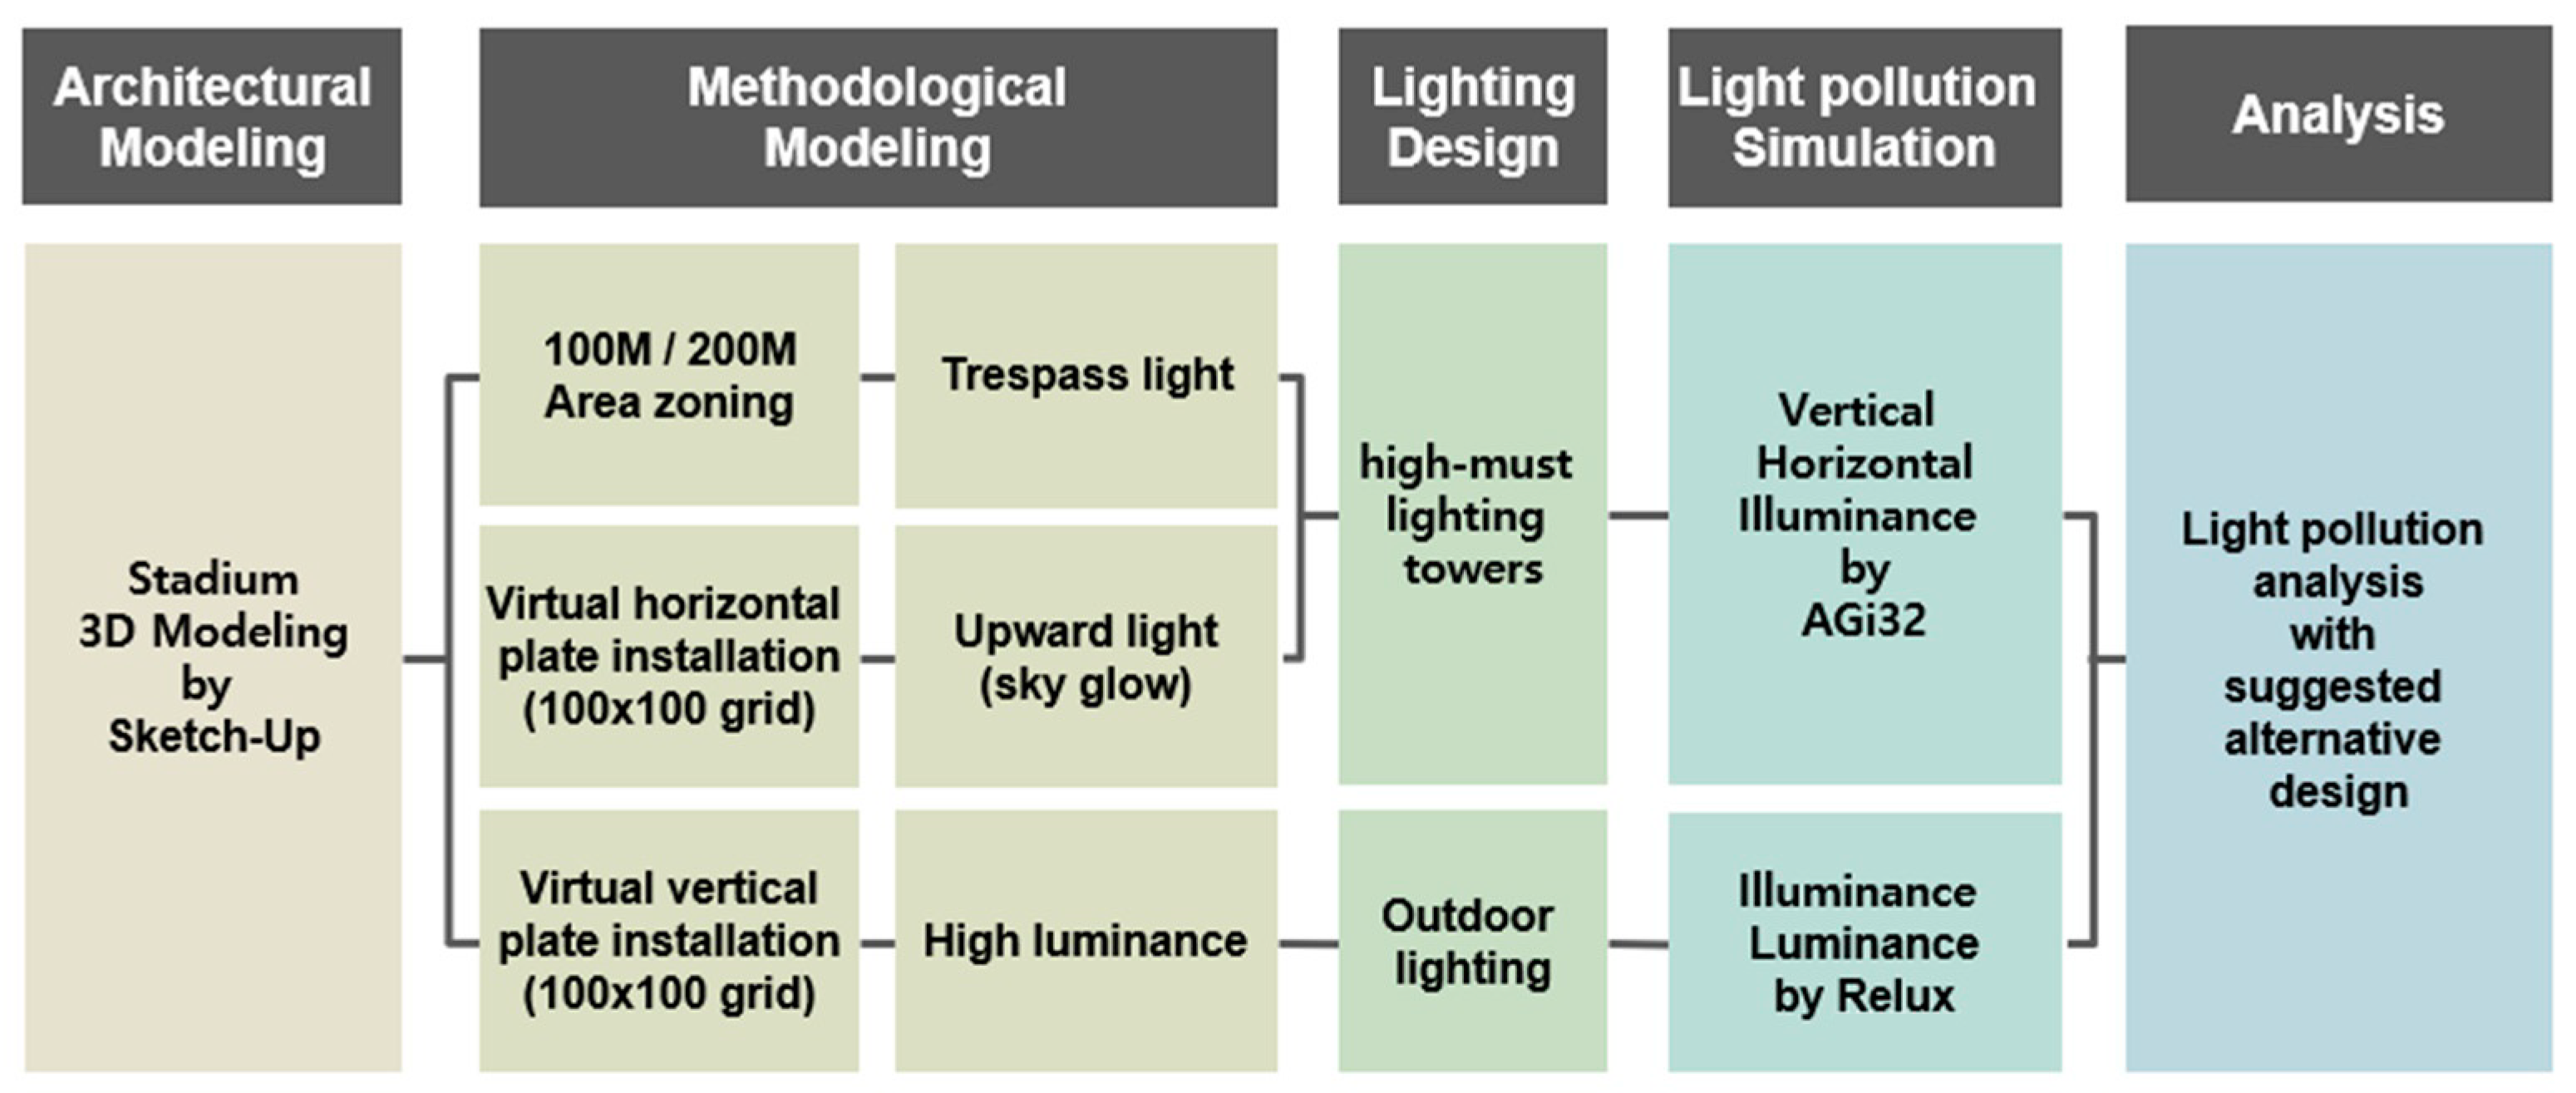
Conventional light pollution determination techniques measure artificial light in an existing environment. There is a great need to implement light pollution measurements using computer simulations to predict whether buildings being planned or constructed will produce light pollution. In this study (see
Figure 1), the Sketch-up (v.2017) program was used for modeling, and the lighting design program AGi32 (v.18.3) was used to analyze the light pollution caused by tower lighting in stadiums. The Relux program (v.20.1.6) was used for the design and analysis of outdoor lighting.
AGi32 is a computational program that performs numerical point-by-point calculations of incident direct or reflected light on any real surface or imaginary plane. Within that scope, it is used to predict or quantify the distribution of artificial or natural light in any environment. AGi32 is the tool of choice when quantifying the amount of light present in any architectural application. For the sports application used in this study, AGi32 computed horizontal, vertical, and variable meter-aiming illuminance and extracted data such as the CIE glare rating uniformity gradient and coefficient of variance [
36].
The Relux program simulates artificial light and daylight. It can calculate absolute values and national and international standards and is compatible with CAD and BIM systems [
37]. We used a 100 m × 100 m calculation grid, and the virtual plane was defined at 66 m high, considering the vertical height of the high-mast lighting towers. The reflectance of the stadium surfaces was set to 50%. The luminaires have a slightly asymmetric distribution (skewed to one side by 7 to 12 degrees). Moreover, the luminaire aiming was fixed at zero in the Z-axis plane but allowed to move freely in the
X-axis and
Y-axis planes.
Furthermore, our analysis is based on the lighting requirements provided by the Korean lighting standard, KS A 3705, for track and field, soccer field, and rugby field stadium facilities. The requirements are summarized below:
- (i).
Horizontal average illuminance for official games (300 lux–750 lux), non-official games (150 lux–300 lux), and recreation activities (100 lux–150 lux).
- (ii).
Uniformity ratio for official games (>0.50), non-official games (>0.40), and recreation activities (>0.25).
4. Case Analyses
This section presents the effectiveness of the suggested analysis method by analyzing the light pollution that could be produced by large-scale sports facilities that are actually being built by the local governments of M city and K city in the southern part of Korea. Using different techniques, the proposed method was validated by analyzing the occurrence of light pollution caused by the outdoor lighting and tower lights used in and around the stadiums.
4.1. M City Sport Complex
M city is the most developed residential area in the southern part of Korea, but residential areas account for only 27% of the total area, with green areas accounting for 54%. The site chosen for the construction of the M city stadium is in an area with a green area ratio of more than 80%. It is connected to the eastern slopes of the surrounding mountains. Because it will also be adjacent to residential areas, the project requires a detailed analysis and systematic management of light pollution.
If the M city stadium is built and used as an athletic park, it will probably be designated as an E2 light environment management zone. Therefore, it is necessary to form a night lighting environment with strict light distribution control that limits upward light emission, so that it will not negatively affect the natural ecosystem that surrounds it. Upward light and spillage from the tower lighting of the stadium would play an important role in any potential light pollution. Light pollution from brightly lit architectural surfaces in the vicinity of the stadium is quantified separately using luminance as an indicator.
4.1.1. High-Mast Lighting Tower and Light Pollution
The main stadium lighting will use tower-type lighting equipment. As expected, the amount of light trespass and the amount of upward light depend on the height of the light tower and the illumination angle of the lighting equipment. To analyze the light pollution on the residential area and natural green ecosystem adjacent to the stadium caused by light trespass from the tower lighting according to the tower height, the floor illumination inside the stadium was quantitatively analyzed.
In theory, no light should leak outside the stadium. To analyze how much light would, in fact, leak outside the stadium by changing the tower lighting scheme, the floor illuminance was quantitatively analyzed in zones 100 m and 200 m outside the stadium. The specification and luminaire types used in the conventional and alternative designs are summarized in
Table 5.
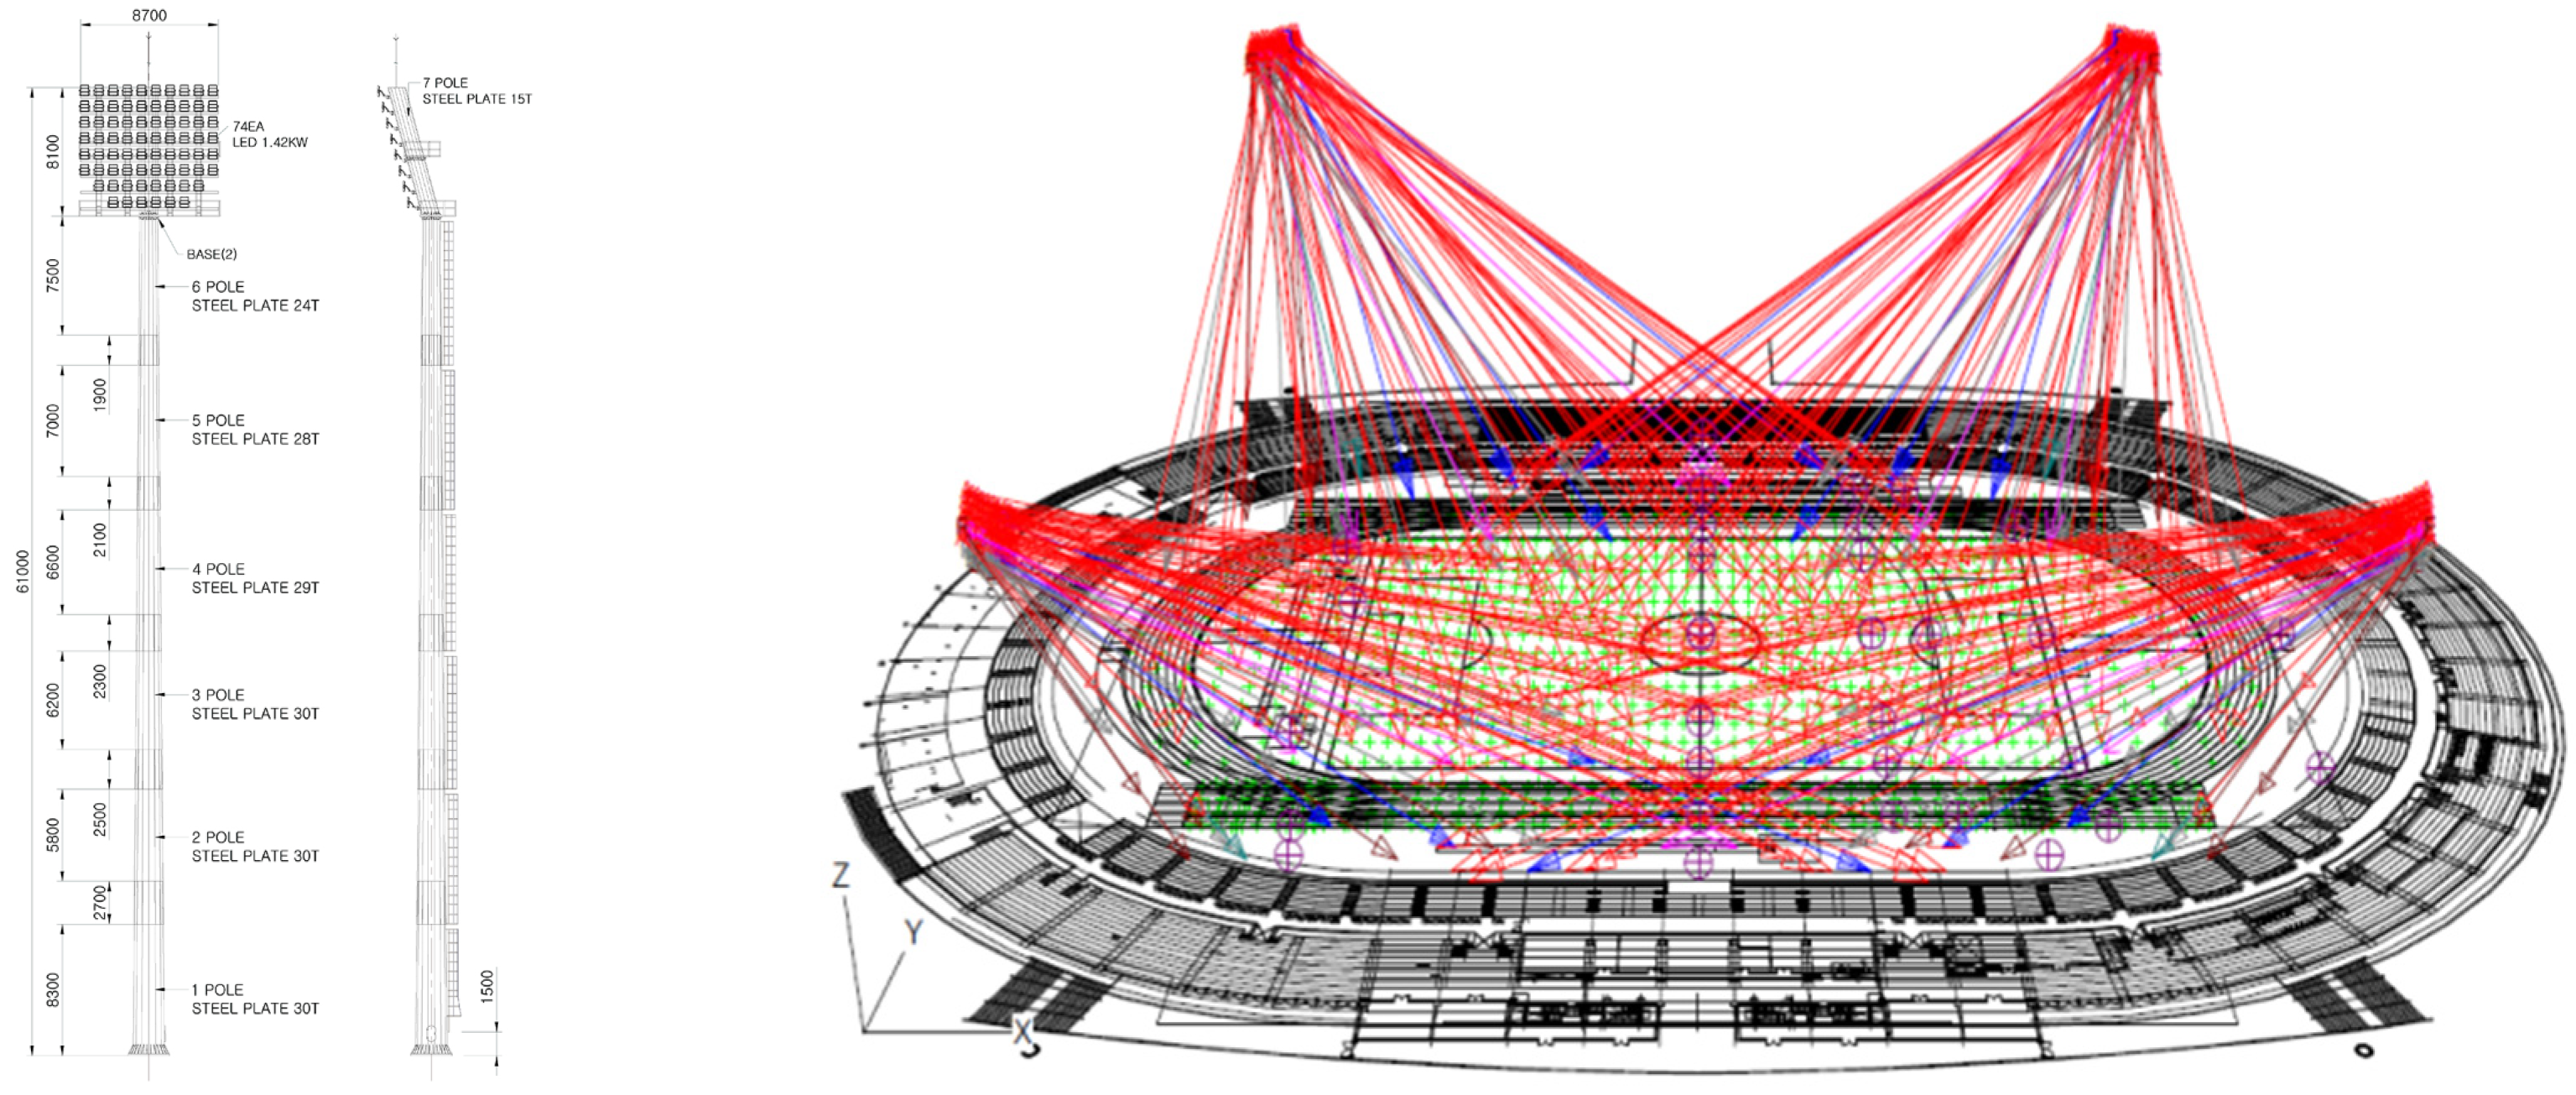
As shown in the arrangement in
Figure 2, the conventional lighting design for tower lighting uses 440 F type floodlights with a value of 154,438 lumens in four lighting towers with a height of 60 m.
Table 6 shows the results from analyzing the leakage and upward light produced by the conventional tower lighting scheme. The vertical surface illumination and horizontal surface illumination were analyzed separately. In the 100 m outer space, the maximum vertical surface illumination was 23.4 lux, and the maximum horizontal surface illumination was 6.8 lux. In the 200 m outer space, the maximum vertical surface illumination was 80.7 lux, and the maximum horizontal surface illumination was 13.3 lux. If vertical surface illumination exceeds 10 lux, it is desirable to attenuate it, because legal restrictions are applied at that level.
A virtual horizontal surface was installed above the stadium to analyze the upward light rising from the tower lighting. By parametrically simulating the light transmission angle and reach distance of the tower lighting fixtures, the virtual horizontal plate was placed at a vertical height of 66 m, and the illuminance of the horizontal plane projected upward was analyzed. In that analysis, the maximum horizontal surface illuminance was 516.8 lux, the minimum was 160.1 lux, and the average was 299.7 lux. There is no legal limit on upward light, but it is desirable to reduce it if possible.
An alternative plan was proposed to reduce the light pollution caused by the conventional design. The height of the high-mast lighting towers is the same as in the conventional design, but the type and number of lighting fixtures were changed, as shown in
Table 5.
Table 7 shows the results from analyzing the leakage and upward light of the improved tower lighting proposal. In the 100 m outer space, the maximum vertical surface illumination was reduced by about 70% to 7.2 lux, and the maximum horizontal surface illumination was reduced by about 66% to 2.3 lux. In the 200 m outer space, the maximum vertical surface illumination was reduced by about 75% to 20.6 lux, and the maximum horizontal surface illumination was reduced by about 72% to 3.7 lux.
With the improved tower lighting, the upward light was also reduced. The maximum horizontal illumination was reduced by about 65% to 181.3 lux; the minimum value was 85 lux, a reduction of about 47%; and the average value decreased by about 56% to 135 lux. Therefore, the improved tower lighting design significantly reduced the light pollution.
4.1.2. Outdoor Lighting and Light Pollution
The purpose of outdoor lighting at night is to highlight an aesthetic image, emphasizing visual presentation. For lighting at sports facilities, however, there is an additional goal of facilitating sports activities that are, perhaps, more important than general aesthetics. The specifications for the lighting equipment used in the conventional outdoor lighting scheme for this stadium are shown in
Table 8. They include different characteristics of the lighting equipment, including color temperature, which has been shown to have potential effects on light pollution [
4,
38].
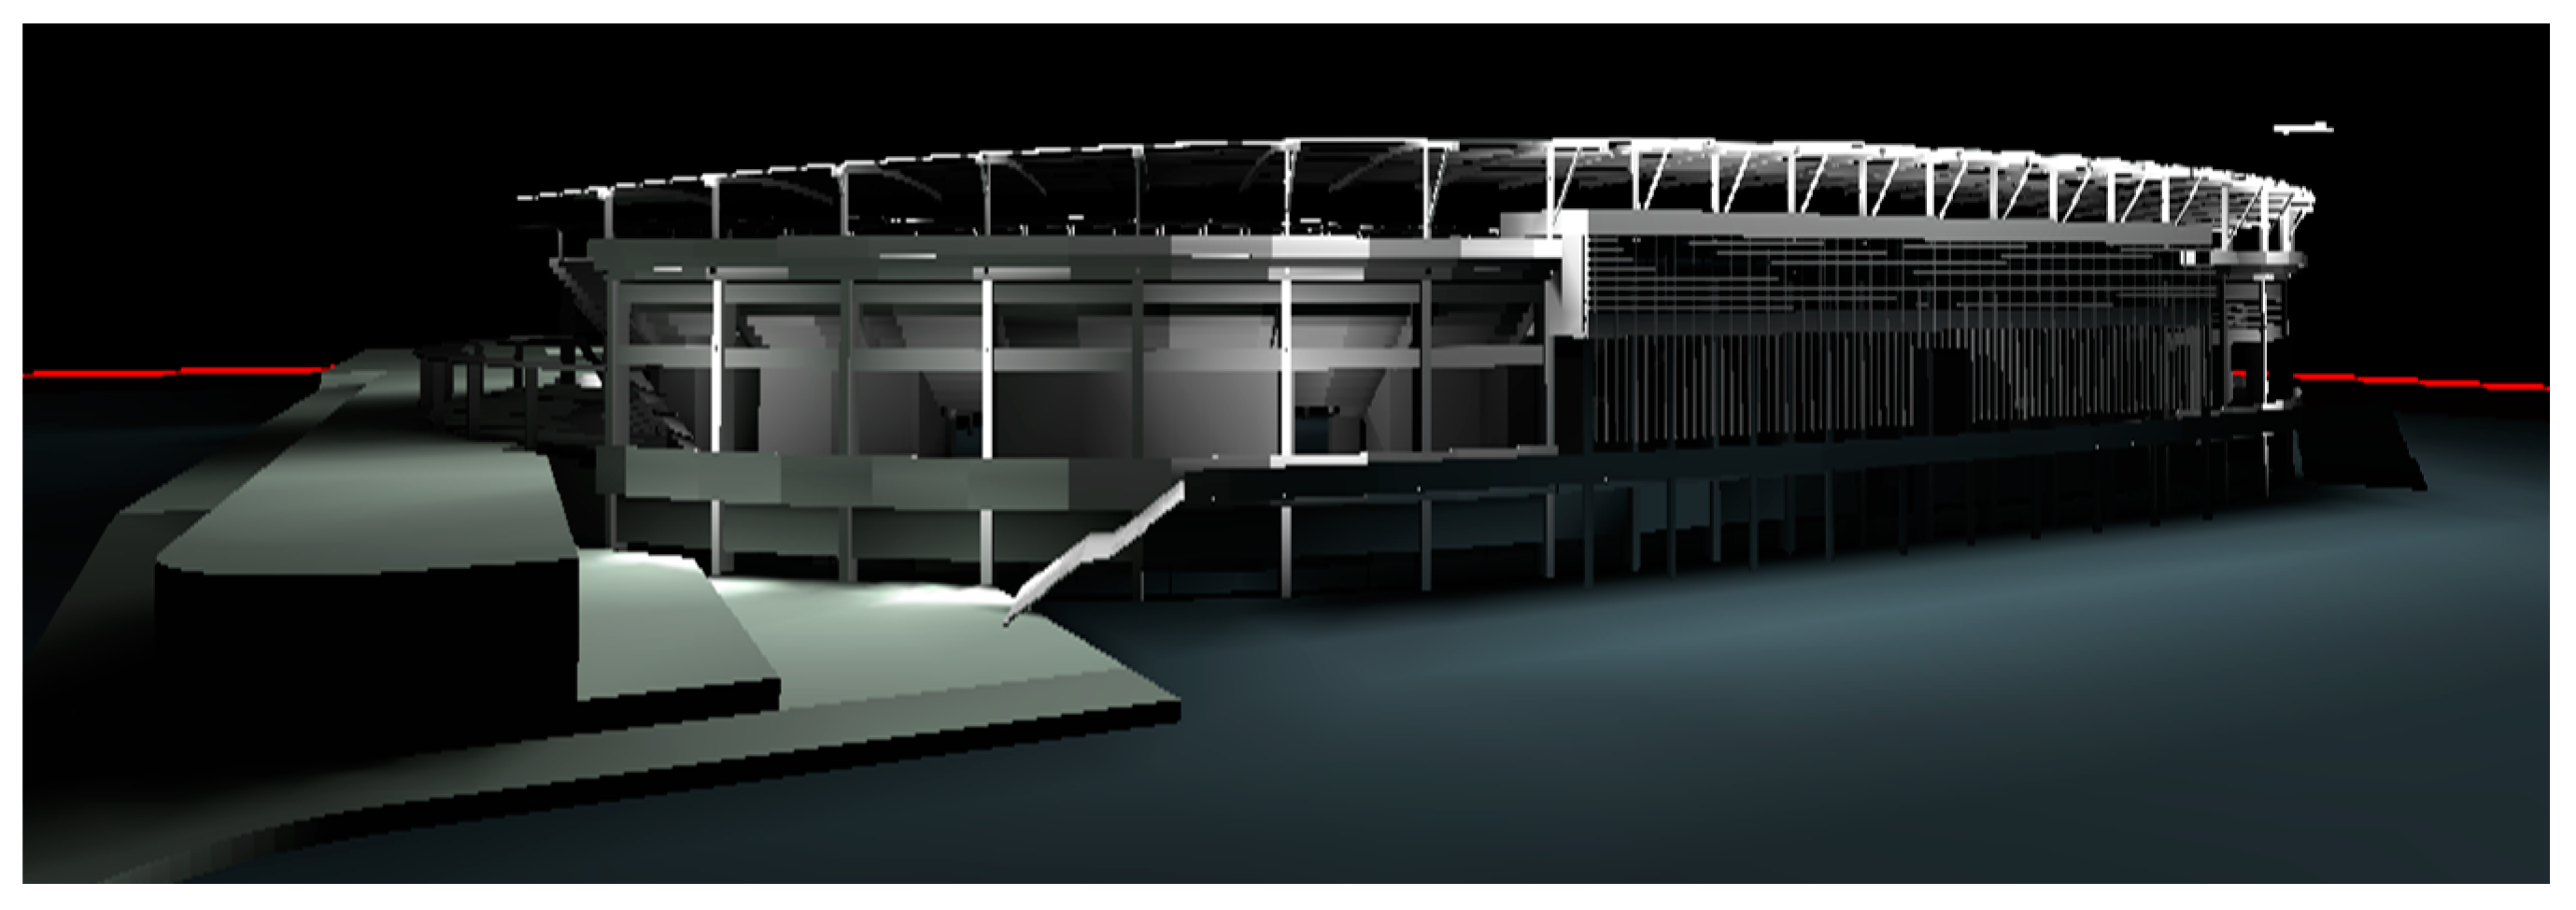
The conventional outdoor lighting design emphasized a vertical image by installing 44 LED 35 W floodlights on the high pillar. The picnic area and the entrance area each used 32 LED 48 W downlight lighting fixtures in a harmonious lighting method similar to that used for the high pillar. The design used 96 LED 90 W floodlights in the lower part of the stadium’s ceiling to highlight the shape of the stadium. In addition, 748 LED 12 W linear luminaires were installed on the outer side of the ceiling to highlight the line of the structure.
Figure 3 shows how the M city sport facility would look at night when lit by the conventional outdoor lighting scheme.
The alternative outdoor lighting design reduced the upward light by replacing the column lighting with 50 LED 24 W up-and-down lighting fixtures for the wall. For the stadium ceiling, the amount of light was increased with 32 LED 130 W floodlights, but the direction was changed to minimize upward light. The specifications of the lighting equipment used for the alternative outdoor lighting of this stadium are shown in
Table 9.
The outdoor lighting of the stadium was analyzed by focusing on the areas where light pollution was most likely to occur. The light pollution produced by the conventional and alternative outdoor lighting schemes for the M city sport facility is compared in
Table 10. The alternative scheme reduced light pollution by 12.9% for the maximum illumination and 13.4% for brightness.
4.2. K City Sport Complex
K city is a small provincial city with a population of 542,455 as of the end of December 2019. The sports facility that K city intends to build has a residential area nearby. Because the site is at a high altitude, it has relatively high recognition and visibility as a target of light pollution. Therefore, it is necessary to thoroughly establish a plan to prevent light pollution by controlling the distribution and amount of light to minimize upward light and illuminance of the vertical surfaces in the residential area near the stadium. After the K city stadium is built, it is highly likely to be designated as an E2 lighting zone. The proposed techniques just described for the M city sport facility were also applied to the K city stadium to determine the potential for light pollution and establish preventive measures.
4.2.1. Tower Lighting and Light Pollution
Tower lighting was also used to light the main stadium in K city. The light leakage generated by the stadium’s tower lighting should be analyzed in detail to protect the residential area and natural ecosystem adjacent to the stadium. As with the M city sports facility, the amount of light leaking to the outside of the stadium was divided into 100 m and 200 m outer areas, and the horizontal floor illuminance was quantitatively analyzed.
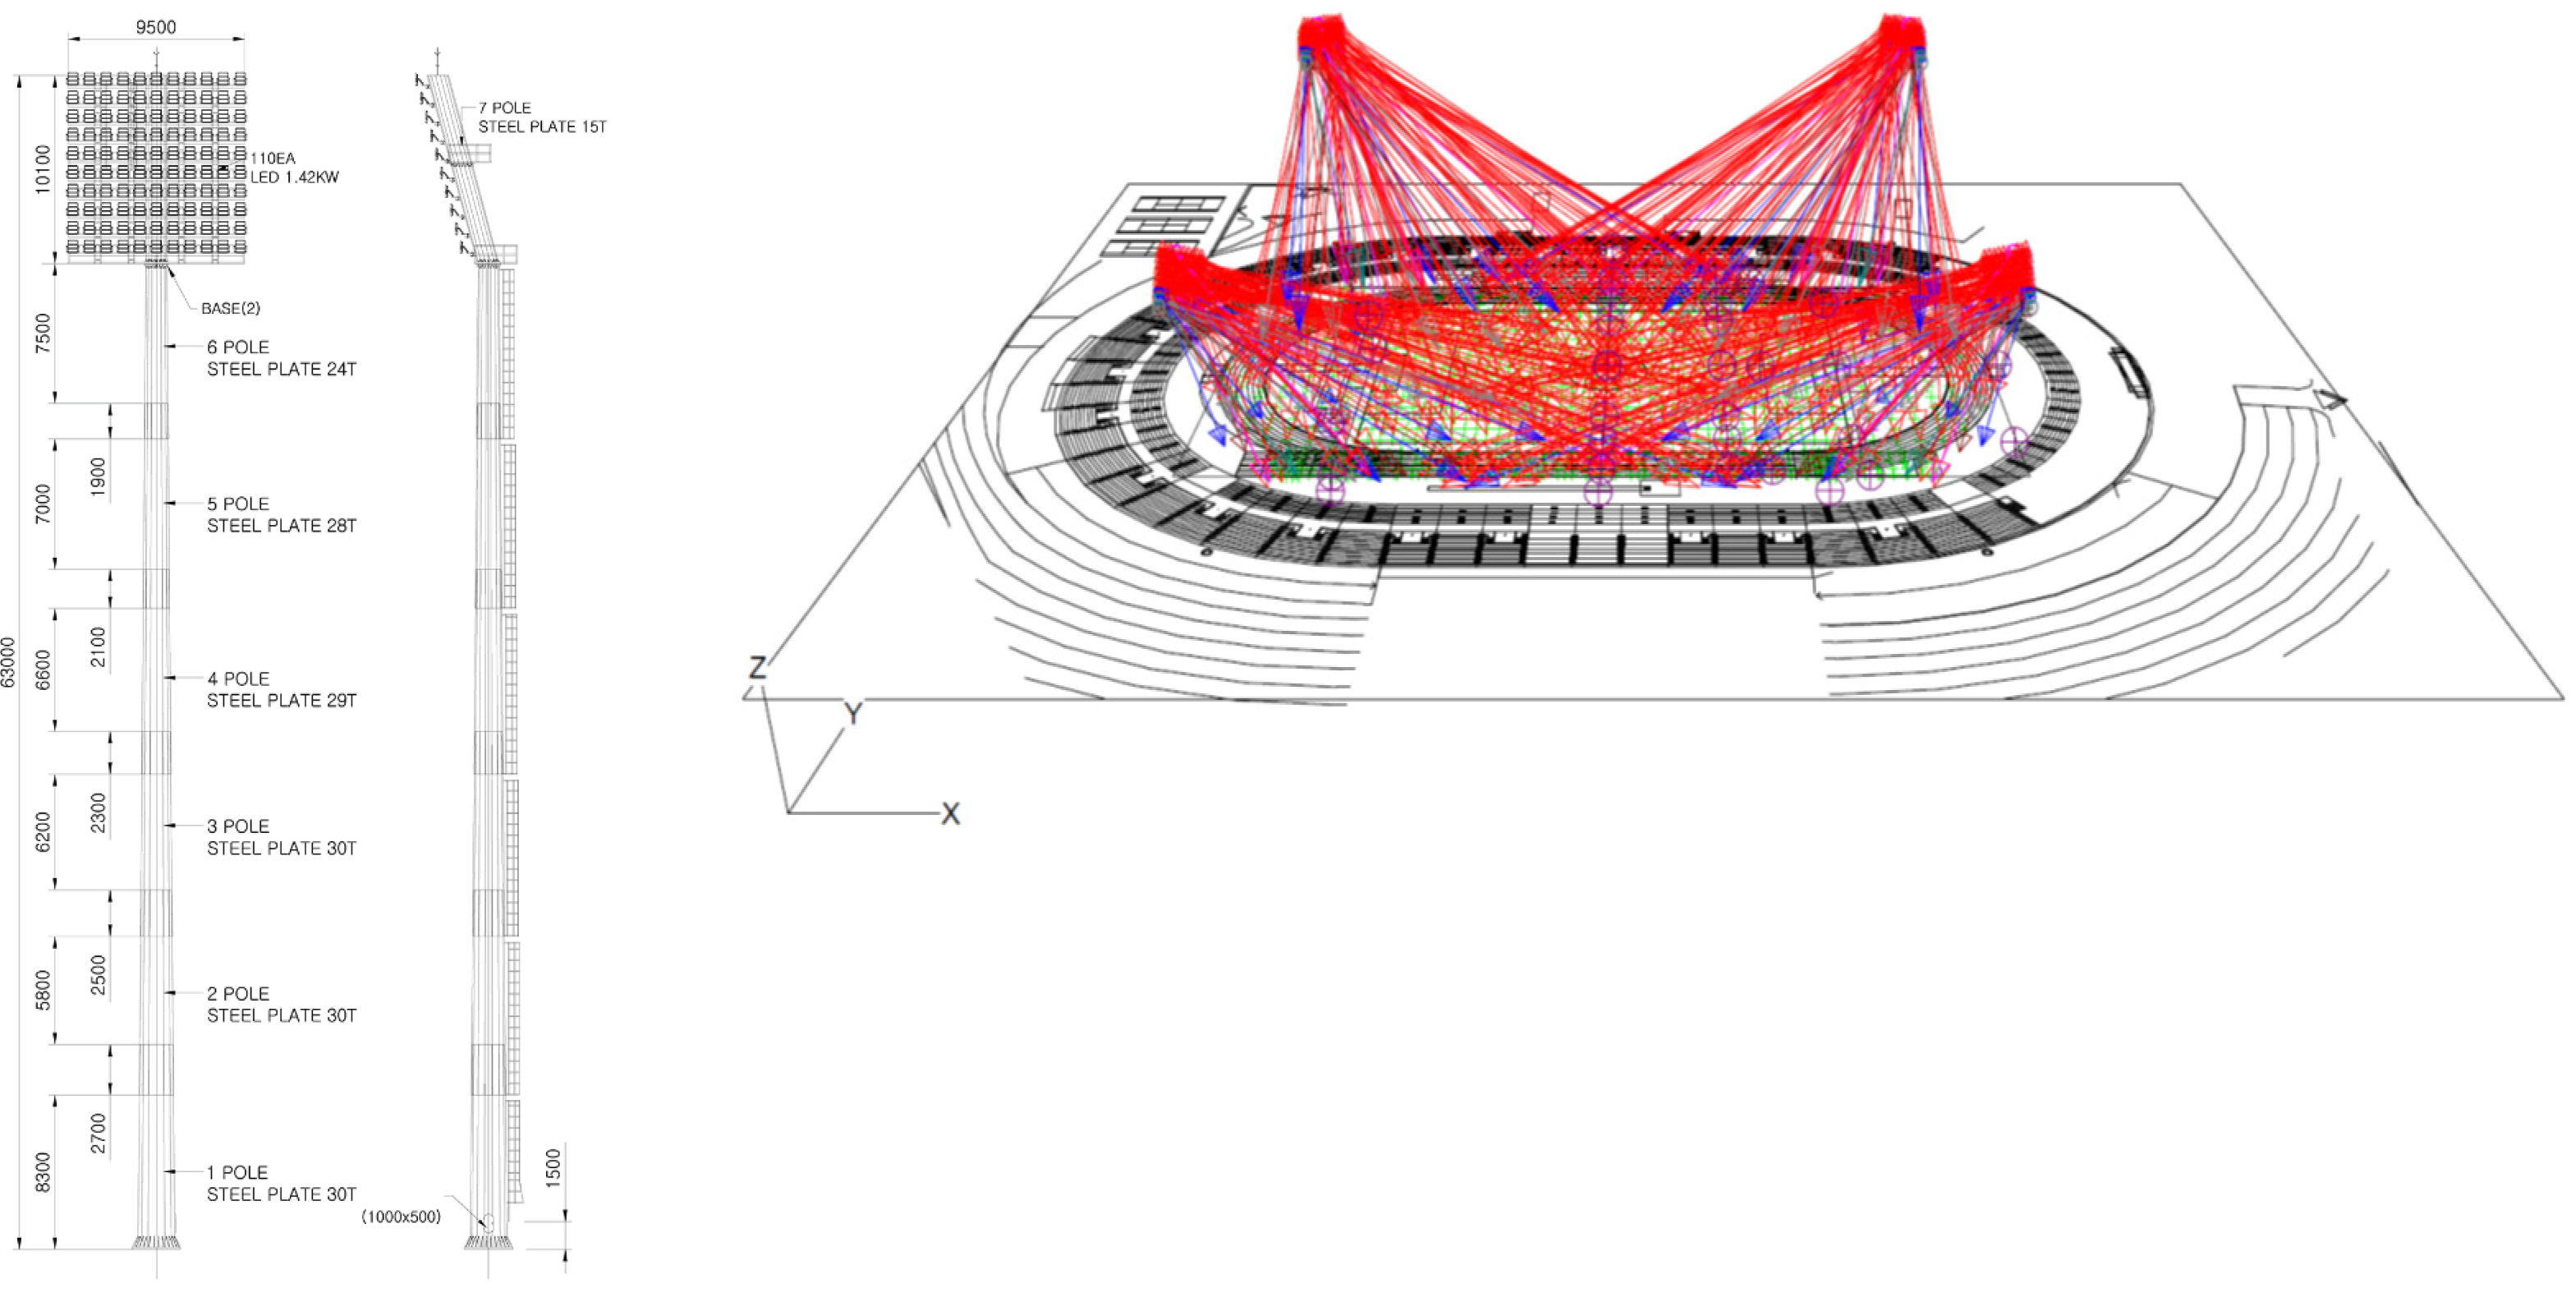
The layout of the tower lighting design for the K city stadium is shown in
Figure 4. The conventional lighting design called for four high-mast lighting towers from 47 m to 57 m high. The types, number, and lumen values of the lighting fixtures planned are summarized in
Table 11.
Table 12 shows the results from analyzing the leakage and upward light caused by the conventional tower lighting in K city stadium. Just as with the M city stadium, the vertical surface illumination and horizontal surface illumination were analyzed separately. In the 100 m outer space, the maximum vertical surface illumination was 29.7 lux, and the maximum horizontal surface illumination was 50.1 lux. In the 200 m outer space, the maximum vertical surface illumination was 94.9 lux, and the maximum horizontal surface illumination was 18.8 lux. A virtual horizontal plate was placed over the stadium at a vertical height of 66 m to analyze the upward light projecting from the tower lighting. The maximum horizontal surface illuminance was 539.1 lux, and the minimum was 255.8 lux.
As shown in
Table 13, the alternative design reduced light pollution in the 100 m outer space by about 18.3% for the maximum vertical surface illumination to 25.1 lux, and by about 29% for the maximum horizontal surface illumination to 38.6 lux. In the 200 m outer space, the maximum vertical surface illumination was reduced by about 30% to 72.9 lux, and the maximum horizontal surface illumination was reduced by about 30% to 14.4 lux.
The upward light was also improved by the alternative tower lighting design. The mean horizontal illumination was reduced by about 69% to 319.6 lux; the minimum value was 139.4 lux, a reduction of about 84%; and the average value decreased by about 75% to 241 lux.
4.2.2. Outdoor Lighting and Light Pollution
The conventional outdoor lighting design used 67 LED 15 W line luminaires on the girder under the railing to smoothly produce indirect lighting. In the interior space of the concourse, 25 LED floodlights were installed to emphasize the sense of mass. Safety lighting was also secured by arranging 24 LED 11 W step lights facing each other at the entrance staircase. The design used 82 LED 50 W power bars as indirect lighting on the inside of the front façade outside the stadium, and 10 LED 54.6 W floodlights were installed on one exterior façade to highlight the structure. The specifications of the lighting equipment used for the conventional outdoor lighting scheme for this stadium are shown in
Table 14.
The alternative outdoor lighting design used indirect lighting overall by removing the 1054.6 W lighting fixtures causing light pollution along the front facade lighting. The specifications of the lighting equipment used for the alternative outdoor lighting scheme for this stadium are shown in
Table 15.
In the outdoor lighting for K city stadium, virtual plates were defined in the two sectors where light pollution was most likely to occur to determine whether light pollution resulted from upward light or high luminance surfaces.
Table 16 specifies the conventional and alternative outdoor lighting schemes and light pollution data for the K city sport facility.
The conventional outdoor lighting design had relatively high upward light and leakage light, and a high luminance surface emerged. Therefore, the alternative design minimized light pollution by controlling the upward angle and amount of light. As shown in
Table 16, the alternative scheme minimized the occurrence of light pollution, reducing upward light and luminance by more than 50%, compared with the conventional outdoor lighting design.
5. Discussion
The negative effects of light pollution on humans and natural ecosystems are not controversial. Efforts to minimize the amount of light pollution are needed in urban areas where humans and night lighting must coexist. In this context, many countries and local governments have established and enforce various standards to prevent light pollution. Nevertheless, certain facilities, such as sports stadiums, might be allowed to produce light pollution, though such exceptions can become problems if the facilities are used often.
Most methods for determining light pollution involve retrospectively measuring illumination after a building is in use. However, if light pollution can be predicted in the early stages of building design, preventive measures can be applied, which would be beneficial to light pollution control. One good method for light pollution prediction is computer simulation. However, most light pollution measurement methods target vertical illuminance that trespasses into the windows of residential buildings or the surface luminance of billboards. However, large sports facilities use unique lighting methods and are larger than most urban buildings, so a more creative light pollution determination technique is required.
Therefore, this study has proposed a method to predict light pollution when constructing a large sports facility. A virtual horizontal surface was placed above the stadium to quantitatively predict upward light. To determine the amount of light flowing out of the stadium, zones 100 m and 200 m outside the stadium were made and analyzed. A method to analyze the amount of upward light spilled from the outdoor lights also used a virtual plate.
The techniques proposed in this study were then applied to the design of two large sports facilities planned in Korea to test the effectiveness of their light pollution determination. The techniques diagnosed the light pollution that would result from the conventional designs, and alternative designs that changed the angle and amount of light were proposed and shown to greatly reduce the amount of light pollution. This method thus opens the possibility of predicting the light pollution of not only sports facilities but any large facilities that require enormous amounts of light and preventing that pollution in advance by making changes at the design stage.
6. Limitations and Future Research
There is abundant space for future progress on the subject matter. For instance, only high-mast tower lights were studied; it would be worthwhile to investigate how the proposed evaluation method works with modern lighting techniques. Furthermore, future studies should assess the proposed approach on various projects as a means of validating its effectiveness and generalization in facilities of diverse functions. Moreover, the light quantities escaping beyond the virtual plan and how far they travel has not been quantified. Conducting such calculations (e.g., amount of light escaping beyond the virtual roof) would provide insights on how the proposed methodology can be improved and perhaps warrants exploration in the future.
Author Contributions
Conceptualization, K.-H.K. and G.K.; methodology, K.-H.K. and G.K.; software, K.-H.K.; validation, K.-H.K. and G.K.; formal analysis, K.-H.K. and G.K.; resources, K.-H.K. and G.K.; data curation, K.-H.K.; writing—original draft preparation, G.K.; writing—review and editing, K.-H.K. and G.K; visualization, K.-H.K.; supervision, G.K. All authors have read and agreed to the published version of the manuscript.
Funding
This research received no external funding.
Institutional Review Board Statement
Not applicable.
Informed Consent Statement
Not applicable.
Data Availability Statement
Not applicable.
Conflicts of Interest
The authors declare no conflict of interest.
References
- Zielinska-Dabkowska, K.M.; Xavia, K. Global Approaches to Reduce Light Pollution from Media Architecture and Non-Static, Self-Luminous LED Displays for Mixed-Use Urban Developments. Sustainability 2019, 11, 3446. [Google Scholar] [CrossRef]
- Hollan, J. What is light pollution, and how do we quantify it? 7th European Symposium for the Protection of the Night Sky—Light Pollution and Global Warming. In Proceedings of the Workshop Paper at Dark Sky 2007 Conference, Brno, Czech Republic, 5–6 October 2007. [Google Scholar]
- What is Light Pollution? Available online: http://www.darksky.org/light-pollution/ (accessed on 24 January 2018).
- Liu, M.; Zhang, B.; Li, W.; Guo, X.; Pan, X. Measurement and Distribution of Urban Light Pollution as Day Changes to Night. Light. Res. Technol. 2018, 50, 616–630. [Google Scholar] [CrossRef]
- Longcore, T.; Rich, C. Ecological Light Pollution. Front. Ecol. Environ. 2004, 2, 191–198. [Google Scholar] [CrossRef]
- Zielinska-Dabkowska, K.M. Make Light. Healthier. Nature 2018, 553, 274–276. [Google Scholar] [CrossRef] [PubMed]
- Vos, J.J. Reflections on Glare. Light. Res. Technol. 2003, 35, 163–175. [Google Scholar] [CrossRef]
- Touitou, Y.; Reinberg, A.; Touitou, D. Association between Light at Night, Melatonin Secretion, Sleep Deprivation, and the Internal Clock: Health Impacts and Mechanisms of Circadian Disruption. Life Sci. 2017, 173, 94–106. [Google Scholar] [CrossRef]
- Sugden, D. Melatonin Biosynthesis in the Mammalian Pineal Gland. Experientia 1989, 45, 922–932. [Google Scholar] [CrossRef]
- Hu, C.; Jia, W. Linking MTNR1B Variants to Diabetes: The Role of Circadian Rhythms. Diabetes 2016, 65, 1490–1492. [Google Scholar] [CrossRef]
- Bishehsari, F.; Levi, F.; Turek, F.W.; Keshavarzian, A. Circadian Rhythms in Gastrointestinal Health and Diseases. Gastroenterology 2016, 151, e1–e5. [Google Scholar] [CrossRef]
- Feychting, M.; OsterLund, B.; Ahlbom, A. Reduced Cancer Incidence among the Blind. Epidemiology 1998, 9, 490–494. [Google Scholar] [CrossRef]
- Kliukiene, J. Risk of Breast Cancer among Norwegian Women with Visual Impairment. Br. J. Cancer 2001, 84, 393–399. [Google Scholar] [CrossRef]
- Schernhammer, E.S.; Speizer, F.E.; Hunter, D.J.; Colditz, G.A. Rotating Night Shifts and Risk of Breast Cancer in Women Participating in the Nurses’ Health Study. J. Natl. Cancer Inst. 2001, 93, 6. [Google Scholar] [CrossRef]
- Schernhammer, E.S. Night Work and Risk of Breast Cancer. Epidemiology 2021, 17, 5. [Google Scholar] [CrossRef]
- Kloog, I.; Haim, A.; Stevens, R.G.; Portnov, B.A. Global Co-Distribution of Light at Night (LAN) and Cancers of Prostate, Colon, and Lung in Men. Chronobiol. Int. 2009, 26, 108–125. [Google Scholar] [CrossRef]
- Cha, J.; Lee, J.; Lee, W.; Jung, J.; Lee, K.; Han, J.; Gu, J. Policy and Status of Light Pollution Management in Korea. Light. Res. Technol. 2014, 46, 78–88. [Google Scholar] [CrossRef]
- Ko, T.; Kim, I.; Choi, A.; Sung, M. Quantitative Assessment Methods for Determining Luminous Environmental Zones in Korea. Light. Res. Technol. 2016, 48, 307–322. [Google Scholar] [CrossRef]
- Guanglei, W.; Ngarambe, J.; Kim, G. A Comparative Study on Current Outdoor Lighting Policies in China and Korea: A Step toward a Sustainable Nighttime Environment. Sustainability 2019, 11, 3989. [Google Scholar] [CrossRef]
- Zitelli, V. Local and National Regulations on Light Pollution in Italy; Cambridge University Press: Cambridge, UK, 2001. [Google Scholar]
- Pollard, N. Guide on the Limitation of the Effects of Obtrusive Light from Outdoor Lighting Installations. Symp. Int. Astron. Union 2001, 196, 77–80. [Google Scholar] [CrossRef]
- Zielińska-Dabkowska, K.M.; Xavia, K.; Bobkowska, K. Assessment of Citizens’ Actions against Light Pollution with Guidelines for Future Initiatives. Sustainability 2020, 12, 4997. [Google Scholar] [CrossRef]
- Morgan-Taylor, M.; Kim, J.T. Regulating Artificial Light at Night: A Comparison Between the South Korean and English Approaches. IJSL 2016, 18, 21–31. [Google Scholar] [CrossRef]
- Ho, C.; Lin, H. Analysis of and Control Policies for Light Pollution from Advertising Signs in Taiwan. Light. Res. Technol. 2015, 47, 931–944. [Google Scholar] [CrossRef]
- Taylor, M.M. Light Pollution and Nuisance: The Enforcement Guidance for Light as a Statutory Nuisance. JPL 2006, 8, 1114–1127. [Google Scholar]
- Morgan-Taylor, M. Regulating light pollution in Europe: Legal challenges and ways forward. In Urban Lighting, Light Pollution and Society; Routledge: Abingdon, UK, 2015. [Google Scholar]
- Ngarambe, J.; Kim, G. Sustainable Lighting Policies: The Contribution of Advertisement and Decorative Lighting to Local Light Pollution in Seoul, South Korea. Sustainability 2018, 10, 1007. [Google Scholar] [CrossRef]
- Vega, C.P.; Zielinska-Dabkowska, K.M.; Hölker, F. Urban Lighting Research Transdisciplinary Framework—A Collaborative Process with Lighting Professionals. Int. J. Environ. Res. Public Health 2021, 18, 624. [Google Scholar] [CrossRef]
- Hölker, F.; Moss, T.; Griefahn, B.; Kloas, W.; Voigt, C.C.; Henckel, D.; Hänel, A.; Kappeler, P.M.; Völker, S.; Schwope, A.; et al. The Dark Side of Light: A Transdisciplinary Research Agenda for Light Pollution Policy. Ecol. Soc. 2010, 15, 13. [Google Scholar] [CrossRef]
- Joint, I.D. Model Lighting Ordinance (MLO) with User’s Guide; Second Public Review; Illuminating Engineering Society: New York, NY, USA, 2010. [Google Scholar]
- Lee, Y.Y.; Kim, J.T.; Yun, G.Y. The Neural Network Predictive Model for Heat Island Intensity in Seoul. Energy Build. 2016, 110, 353–361. [Google Scholar] [CrossRef]
- Lim, H.; Ngarambe, J.; Kim, J.; Kim, G. The Reality of Light Pollution: A Field Survey for the Determination of Lighting Environmental Management Zones in South Korea. Sustainability 2018, 10, 374. [Google Scholar] [CrossRef]
- Kuechly, H.U.; Kyba, C.C.M.; Ruhtz, T.; Lindemann, C.; Wolter, C.; Fischer, J.; Hölker, F. Aerial Survey and Spatial Analysis of Sources of Light Pollution in Berlin, Germany. Remote Sens. Environ. 2012, 126, 39–50. [Google Scholar] [CrossRef]
- Cai, H.; Chung, T. Improving the Quality of High Dynamic Range Images. Light. Res. Technol. 2011, 43, 87–102. [Google Scholar] [CrossRef]
- Inanici, M. Evaluation of High Dynamic Range Photography as a Luminance Data Acquisition System. Light. Res. Technol. 2006, 38, 123–134. [Google Scholar] [CrossRef]
- Available online: https://lightinganalysts.com/wp-content/uploads/2020/04/AGI32_datasheet_v19.pdf (accessed on 15 February 2021).
- Available online: https://relux.com/en/relux-desktop.html (accessed on 11 January 2021).
- Schulte-Römer, N.; Meier, J.; Söding, M.; Dannemann, E. The LED Paradox: How Light Pollution Challenges Experts to Reconsider Sustainable Lighting. Sustainability 2019, 11, 6160. [Google Scholar] [CrossRef]
| Publisher’s Note: MDPI stays neutral with regard to jurisdictional claims in published maps and institutional affiliations. |
© 2021 by the authors. Licensee MDPI, Basel, Switzerland. This article is an open access article distributed under the terms and conditions of the Creative Commons Attribution (CC BY) license (https://creativecommons.org/licenses/by/4.0/).


