Article

Adaptive Capacity as Local Sustainable Development: Contextualizing and Comparing Risks and Resilience in Two Chilean Regions

by
Jonathan R. Barton
1,*,
Felipe Gutiérrez-Antinopai
2 and
Miguel Escalona Ulloa
3
1
Institute of Geography, Institute for Sustainable Development, CEDEUS, Pontificia Universidad Católica de Chile, Santiago 7820436, Chile
2
Institute of Geography, Pontificia Universidad Católica de Chile, Santiago 7820436, Chile
3
Department of Environmental Sciences, Universidad Católica de Temuco, Temuco 4813302, Chile
*
Author to whom correspondence should be addressed.
Sustainability 2021, 13(9), 4660; https://doi.org/10.3390/su13094660
Submission received: 9 February 2021 / Revised: 16 March 2021 / Accepted: 19 March 2021 / Published: 22 April 2021

Abstract

:
Regional resilience refers to an immanent condition for facing multiple risks on a permanent basis, both episodic and incremental. These risks are not only linked to natural disasters and climate change, but also to poverty and inequality of access to services such as health, and personal safety. This article considers the underlying conditions that shape regional resilience in Chile, based on inter-regional and intra-regional comparisons in the Metropolitan Region of Santiago and the Region of Araucanía. Instead of viewing resilience in terms of an ability to counter a single risk, the article highlights the fact that risks are multiple and overlapping over time and generated at different scales. Municipal level data on poverty, health, and public finances in the two regions reveal the contrasting underlying inequalities that point to regional mosaics of resilience rather than homogeneity. Different threats are superposed on these preexisting conditions of resilience. The article refers to three in particular: the 2010 Chilean earthquake (episodic); climate change (episodic and incremental); and the Covid-19 pandemic (episodic). The findings point to high levels of urban versus rural differentiation, and also high differentiation within the Santiago Metropolitan Area based on socio-economic conditions. This regional mosaic of underlying structural conditions suggests that regional resilience can be enhanced by engaging with structural socio-spatial inequalities rather than a focus on managing risks via siloed, threat-by-threat responses.

1. Introduction

Chile has lived with significant natural [1,2,3,4,5,6] and anthropogenic [7,8,9] risks throughout its history that have tested responses at institutional and community levels. These include the 1960 earthquake (the largest recorded, at 9.5 on the Richter scale) and the 2010 earthquake (8.8 magnitude Richter). However, these major episodic threats are not the only risks that are faced. There are also threats of a gradual, incremental nature, linked to anthropogenic impacts, that give rise to transformations in socio-ecological systems, and lead to demands for better water, energy, economic, and social infrastructure planning [10,11,12]; the persistently high levels of urban air contamination are a case in point. Added to these are exogenous and endogenous economic and health shocks and trends [13,14,15]. Risks are, therefore, widespread, both incremental and episodic, and are managed locally and regionally according to urgency and capacities. Perhaps the most important element to highlight is that they are almost never singular, managed one at a time [16,17]. They are almost always interconnected and multiple, with different degrees of intensity. Consequently, there cannot be resilience to one event, but rather resilience should be understood as a set of adaptive capacities that are established within the community to face risks of different intensities and (un)expected temporalities [18,19]; these adaptive capacities are embedded in the development of the localities where these threats, and consequently risks, appear [20,21,22]. Risk should be understood as omnipresent and multiple, and something that is intrinsic to community development.
The term adaptive capacity is a core concept within both development theory and conceptualizations of resilience [23] (in planning, engineering, ecological, and organizational literature [24], and is connected to underlying local and regional conditions [11]. Although development has a long history as a framework for understanding political and socio-economic transformations in the postwar period [25] and has been subject to criticism for its western, modern, imperial, and colonial roots [26,27], the concept of adaptive capacity emerged most strongly in the context of a response of socio-ecological systems to different forces: institutional, anthropogenic, and natural [28]. However, there is a need to reconnect development theory and the perspectives of socio-ecological systems. Amartya Sen [29,30,31,32], for example, provides an approach to development in which there is no capacity building when there is deprivation. In Sen’s words: “Development requires the removal of major sources of unfreedom: poverty as well as tyranny, poor economic opportunities as well as systematic social deprivation, neglect of public facilities as well as intolerance or overactivity of repressive state” [30] (p. 3) and “What people can positively achieve is influenced by economic opportunities, political liberties, social powers, and the enabling conditions of good health, basic education, and the encouragement and cultivation of initiatives” [30] (p. 5). Sen´s ideas of capabilities provide a more anthropocentric approach to adaptive capacities that have emerged from ecological and institutional traditions, such as panarchy [12], resilience, adaptive cycles [16,33], institutional change [34], vulnerability analysis [35,36], social capital [37], and adaptive educative system thinking (see Krasny [38]). These diverse approaches are by no means mutually exclusive. In fact, there are considerable overlaps; however, it is vital that these basal elements of poverty and deprivation are considered as structural constraints to effective development, and thus to adaptive capacity and resilience.
The plasticity with which the term adaptive capacity has been handled suggests the need for understanding diversity and heterogeneity in adaptive capabilities, of different groups and at different scales as communities respond in specific and non-linear ways to multiple risks [11,16,36,39]. The richness of these experiences in the face of risks can be found in local and regional contexts since it is part and parcel of the development history of communities [36,37]. For this reason, it is important to link local and regional resilience to development thinking, as in the capabilities framework of Sen [29,31,32,40], by bringing together the basic components of development and resilience concepts. By understanding resilience as a function or condition of development, it is then possible to explore manifestations of local and regional resilience, and intra-regional differentiation.
The question explored in this article is as follows: how important are underlying local and regional development conditions in shaping resilience to multiple risks? The discussion is based on a comparative study of two regions in Chile—the Santiago Metropolitan Region (RMS) and the Region of Araucanía and includes inter-regional comparisons and intra-regional differentiation. These two regions have been selected as they reflect the diversity, and inequalities of Chilean development: the RMS is the wealthiest region in the country, Araucanía the least wealthy; the RMS is the most urban region, Araucania one of the most rural; Araucania has the highest percentage of indigenous population, while the RMS has one of the lowest proportions. These three factors are not determinants of resilience, however, and the article highlights the importance of underlying socio-economic and cultural issues in shaping adaptive capacities in the face of multiple risks, both episodic and incremental.

2. Local and Regional Resilience and Development

When development capabilities are framed within the context of socio-ecological system dynamics (where the roots of contemporary resilience conceptualizations are to be found), the term local sustainable development is appropriate. This connection is important since adaptive capacities have to be understood in terms of cultural and institutional contexts, since these contexts shape perceptions and consequent actions [10,39,40,41]. This in turn removes the discussion of risks and resilience from the realm of socio-ecological systems and technical solutions, to the realm of communities, institutions, and justice, and the ways in which local sustainable development is generated, strengthened, or weakened [11,28]. In turn, regional resilience is a function of these multiple local sustainable development contexts operating within this larger spatial scale, including urban, rural, and other geographical spaces. A useful definition of regional resilience is provided by Foster (2007, 14, cited in Martin, (2012): “the ability of a region to anticipate, prepare for, respond to, and recover from a disturbance.” The variability in processes of anticipation, preparedness, response, and recovery are determined by the complexity of local sustainable development conditions within the region.
The traditions of regional development lie in understanding socio-economic transformations, with a strong basis in resources and production [42,43,44,45]. Economic geographers and regional science specialists have explored the nature of commodity regions, industrial districts, innovation clusters, and global production networks (GPN), and different configurations of public and private activity, since the nineteenth century [46,47,48,49]. What is common to these different conceptualizations of economic activity and localization is risk [50,51]. Indeed, risk has become central to public policy and considerations of local sustainable livelihoods since the 1990s as risk assessment and risk management have become widespread practices in public, private, and even community organizations (e.g., in their opposition to local projects) [13]. The term economic resilience, utilized by economic geographers and regional economists, has been used to refer to the ways in which regions evolve through time, such as upward transitional and downward transitional trends. For example, Fratesi and Perucca [52] refer to the importance of structural ‘territorial capital’, that includes public and private, material and immaterial assets, concluding that, in the case of European regions, those with more resilience have less mobile territorial capital assets, and a better mix of materiality and rivalry, which favors more urban economies (using Camagni´s [53] taxonomy of high to low materiality and private goods, club goods, and public goods). Other authors point to the importance, up to a point, of the local embeddedness of firms (the local interconnections between firms) and the importance of human capital and the skills base. Kitsos and others [54] use the term ‘external economies of complexity’ to highlight local embeddedness of firms and resilience, while Martin [55] employs the economic term ‘hysteresis’ (referring to system lags and nonlinear effects) to understand resilience to system-wide economic shocks and recessions. The main emphasis of much of this literature, however, is a focus on adaptive adjustment or evolutionary resilience which emphasize the adaptive capacities of local and regional economies [51]. Rose adds the element of managing these risks in terms of economic resilience, employing the concepts of static economic resilience versus dynamic economic resilience [24]. In the former, existing resources are redeployed following a disaster or shock, whereas in the latter there is active repair and reconstruction involving new resources to support a more rapid recovery. A similar analogy to static versus dynamic economic resilience can be employed here for local sustainable development, but as ongoing management of risk rather than post-disaster, involving long-term investment. It is likely that this type of dynamic, longer-term economic resilience investment will strengthen territorial capital and reduce socio-spatial inequalities.
A fundamental element of the concept of resilience is the likelihood of the consequences derived from specific hazards or threats (disturbances or stress) [36]. Consequently, there is a need to establish, a priori, the flexibility or adaptability of the affected system in the face of these threats. This condition is its resilience, and it refers to specific scales, whether local or regional; most importantly, and along the lines of development theory, this resilience also points to vulnerabilities, whether based on lack of capabilities, or underlying contexts of poverty and inequalities in different spatial contexts [56]. The differences between urban and rural communities provide stark evidence of these inequalities; however, they are also evident within larger metropolitan areas themselves.
The connection between resilience and local and regional development is relatively recent in the economic geography and regional science literature; however, it also enables the analysis of these spatial entities to make links with the climate change, and risk and disaster literatures and perspectives. Consequently, it serves to highlight local and regional sustainable development transitions and the role of resilience in these transitions [57]. Carpenter et al. [33] differentiate between resilience and sustainable development as follows: “Resilience can be desirable or undesirable. For example, system states that decrease social welfare, such as polluted water supplies or dictatorships, can be highly resilient. In contrast, sustainability is an overarching goal that includes assumptions or preferences about which system states are desirable.” (p. 766). Given the emphasis on socio-ecological systems and their resilience, which has emerged from climate change, and risk and disaster analysis and policies, the normative elements of sustainable development have been displaced to some extent. Instead of sustainable cities and regions, there has been a shift to a discussion of resilient cities and regions. However, resilience is a dimension of sustainable development and should not be understood as a replacement for it; as Carpenter et al. [33] note, it is important to understand what is being understood by resilience in systems terms, to ensure that more equitable sustainable development takes place. A focus on resilience should not replace the need for agency-driven, normative, prospective planning of socio-ecological systems at local and regional scales. Sustainability is a condition not only of well-being through the satisfaction of basic needs, but also the means for sustaining this process inter-generationally [36,58], in urban and rural spaces, and at local regional and national scales [59], reducing vulnerability in the face of exogenous or endogenous threats in the process.
Analysis of vulnerability, as in pressure and release models (PAR) or risk–threat models [60], reveals the layers of structural and physical conditions behind this vulnerability, hence the importance of unpacking the concept of resilience and connecting it to specific localities and communities [3,56]. For instance, in the case of the progression of a particular threat, such as resource or product substitution or obsolescence (e.g., synthetic nitrates that destroyed Chilean nitrate production in the 1920s or the shift of steel production from the US rustbelt to Asia from the 1970s), and local environmental conditions (e.g., the US Dustbowl of the 1930s or the 1970s Peruvian fisheries collapse), the specific localities and regions most affected can be clearly identified. Their high level of dependence on these products and activities lead to major impacts [61,62]. More generally speaking, anthropogenic factors such as economic activity, employment, and regional GDP, are cyclical and subject to diverse endogenous and exogenous risks [46]. These cycles also generate risks and are often interwoven with risks and disasters from natural phenomena, such as seismic activity, or anthropogenically-driven ‘natural’ risks, such as those from climate change. It is important to stress that these socio-economic and socio-ecological risks have high levels of variability as they are grounded in specific localities, and different adaptive capacities and capabilities are exposed or revealed. This is particularly evident in the differences between rural and urban settings, for example. This includes not only the dynamics between actors, and across systems and scales, but also in terms of structural conditions based on physical conditions, cultural conditions, and power relations. These all lead to socio-spatial disparities of risk and resilience.
Local and regional development—strategic planning in particular—has evolved to engage with these conditions and to enhance resilience to shocks, to create new development opportunities (e.g., promoting and supporting emerging economic sectors), and to increase adaptive capacities through education, access to employment, services and assets, and improved income generation and distribution. It is also highly sensitive to local physical conditions, and to social and cultural heritage, traditions, and norms. Regions and municipalities are not homogenous since they are most often ‘spikey’, with mosaics of rural and urban settlements, productive activities and infrastructures, and concentrations of wealth, and relative or absolute poverty. Risks and resilience are also ‘spikey’ as a consequence (e.g., Getis et al. [63], Forman [64], World Bank [65]). Rather than regional resilience being the median of the resilience of its constituent components, i.e., settlements or municipalities, the mosaic of risk and this diversity is the condition of regional resilience. Consequently, regional development is also a function of multiple nodes of weak and strong local sustainable development operating within that territory, which are connected as spatial hierarchies or mosaics of distances, densities, and administrative divisions. The diversity of places in which risks are experienced reveals the complexity of socio-spatial systems, with uncertain scenarios of change through the interaction of activities at different scales through time (panarchy)—potential risks—and local community activities for improving human conditions, resource management, and governance (see Berkes and Ross [21]). It is important to recognize community-level adaptive capacities, however the two scales addressed in the article—municipal and regional—do not allow for these to be discussed in detail, and are best addressed through further case study analysis at smaller scales. Another issue that should be highlighted, but is not the focus of this article, is the role of local business. Community resilience should be linked closely to economic activity at micro, meso, and macro scales, and this activity should be included in any assessment of community resilience, as noted by Rose and Kraussman [66], not only for post-shock recovery but also for resilience to multiple, immanent risks.
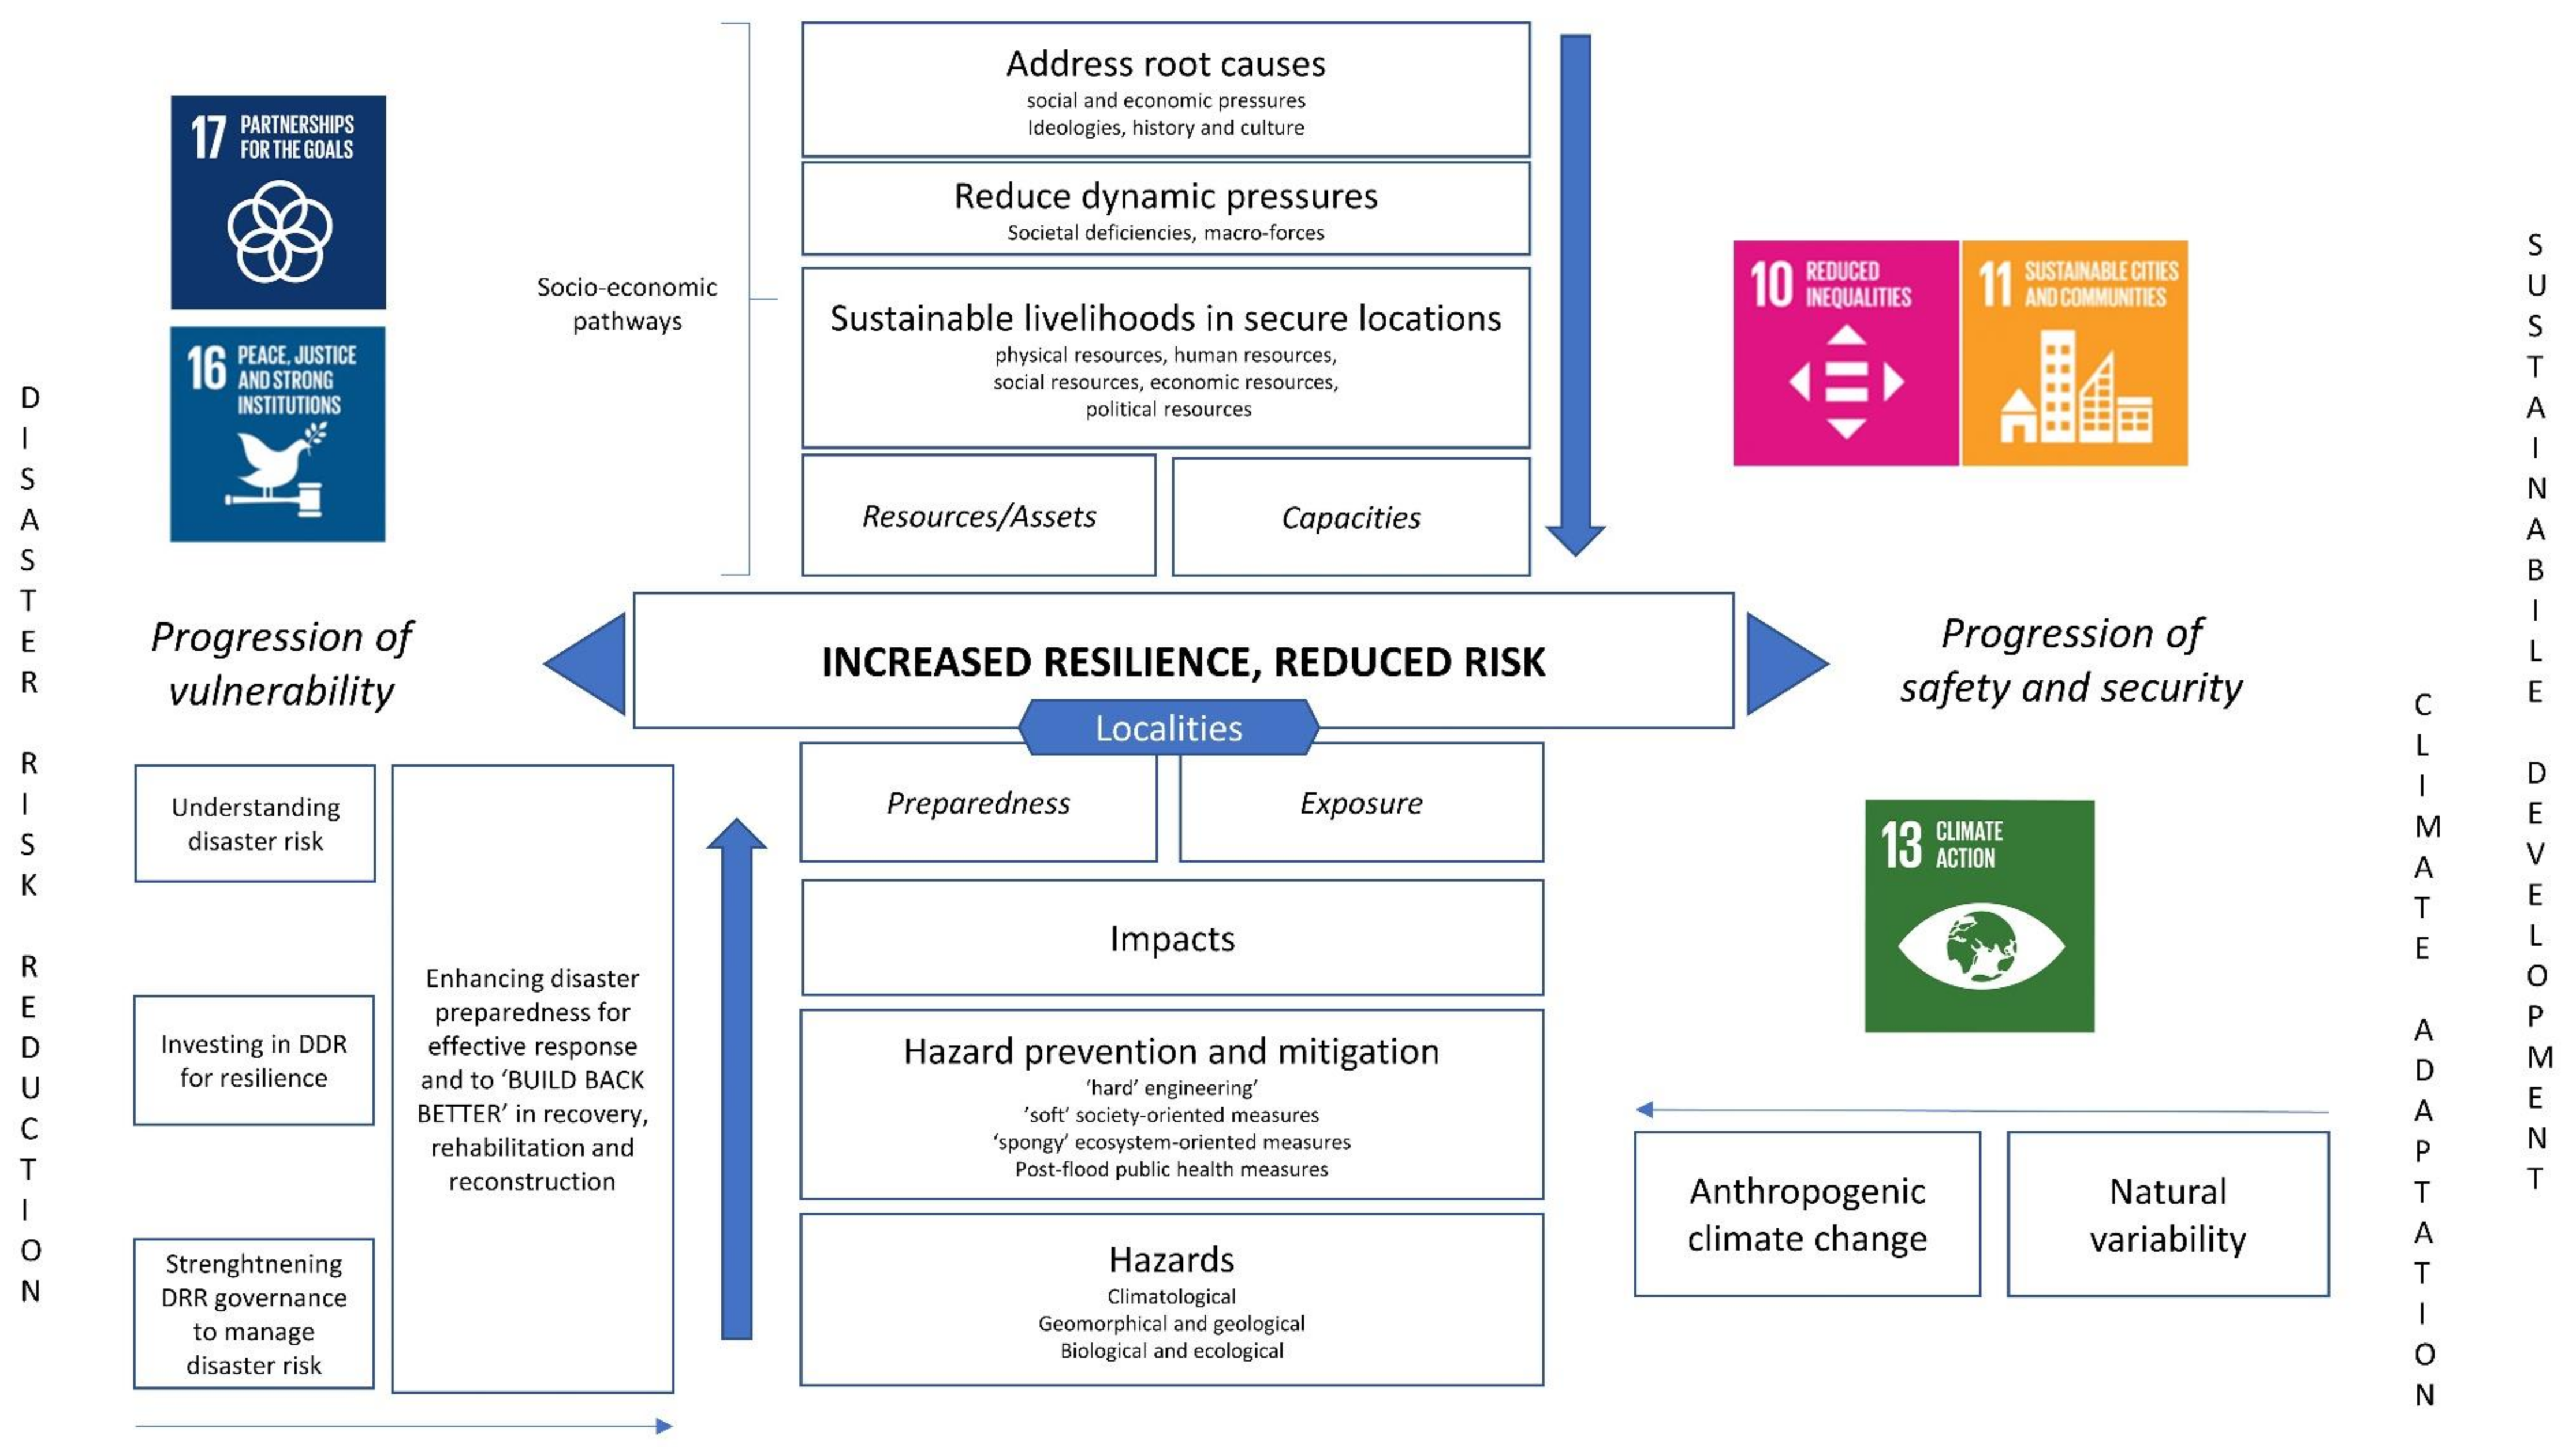
It is important to note that the risks associated with local and regional development are intertwined with others in the resilience framework provided below (see Figure 1), linking different objectives of sustainable development in the process. However, rather than putting more emphasis on climate change and disasters, as is the case in many socio-ecological systems analysis perspectives, a development focus puts more emphasis on socio-economic pathways and underlying socio-spatial conditions. There are also other risks that may arise that are not clearly identified in the figure, such as civil conflict, famine, and migratory pressures. Consequently, regional development is an outcome of a complex interplay of environmental, socio-cultural, and socio-economic conditions, overlaid by power relations and institutional agency, from the community to the regional government (and beyond, including extra-regional influences from globalized economic actors and national administrations, as seen in Global Production Network analysis [48]).
The ability to respond to the multiple risks to livelihoods and lives themselves, including daily access to income, safe water, and food, is a function of the capacities and assets that each household and community mobilizes, as highlighted by Sen. Therefore, for resilience to be a useful concept, it needs to connect to short-term responses to risks, and also to longer-term structural conditions that define the strengths and weaknesses of regional and local sustainable development. This brings up the relevance of time scales [24,67,68,69,70]. These are paramount for comparing and contrasting regions, and for understanding the organic and dynamic nature of changes in human development conditions in relation to environmental change. In terms of regional resilience, the ways in which the system is unbalanced by a shock or an incremental process, and returns to a new equilibrium as a result of decision-making and planning, depends on different time horizons (identified as a progression between vulnerability and safety and security, in Figure 1).
Different hazards and threats require different planning horizons, from the first 36-hour, critical period post-earthquake to a 5–10-year strategic regional development plan. Some risks may or may not be cumulative, and, hence, the terms episodic and incremental are used here. Turner et al. [36] describe these episodic events as ‘disturbances’ (e.g., hurricanes or earthquakes), and incremental processes as ‘stress’ (e.g., soil degradation). Rykiel [71] also makes this distinction with reference to the impact on the system, based on ecological criteria. He introduces classifications of ‘permanent’ (a deviation which is of a fixed magnitude over time, leading to a stable state different from the original) and ‘transient’ (a temporary deviation that becomes zero over time with a return to an approximate original steady-state). For municipalities and regions, unlike a predominantly ‘natural’ ecosystem, transformations are likely to tend towards the former rather than the latter, since rather than one risk being involved, the region is subject to multiple endogenous and exogenous risks of an incremental and episodic nature. This entails adaptive capacity for transformation, with a stronger focus on institutions and governance.
Figure 1. Towards a resilience framework for Latin America. Source: Barton, Canil, Cardoso, Canil, y Santa Cruz [72] based on Wisner et al. [60], IPCC [73] and UNISDR [74].
Sustainability 13 04660 g001

3. Methodology

The measurement of adaptive capacities under the umbrella of sustainability, and the different dimensions that are involved in these metrics, are derived from positivist and phenomenological (constructivist) epistemologies. For instance, community responses [75], evaluation of policies for extreme events [76], and post-threat experiences [77] are approaches that go beyond poverty and structural indicators but most often remain tied to quantitative assessment. However, other approaches are also important. These include experiences, such as perceptions of natural hazards [78], flooding awareness [79], and memories of disasters [80], which are most often based on visual tools and oral narratives. For this article, the focus is on the former, to contrast data on local sustainable development within regions, as well as between regions. There is a long tradition of quantitative local and regional development indicators, such as those for basic needs and poverty [11,14,15,17,28,31,39,81,82,83,84,85,86], health conditions [14,15,31,81,83,84], and institutional capacities [11,15,17,31,34,81,82,83,87], which are useful for comparative analysis over time. Change over time at different scales and for different types of community (rural-urban, indigenous-non-indigenous) is highly relevant for understanding institutional capacities and social agency in exposure to multiple risks, and preparation for, and management of them.
In order to simplify an understanding of adaptive capacities, in this article we consider disturbances and stresses of episodic events and incremental processes in relation to the underlying socio-spatial structural conditions of local and regional development. Although the selected three risks—climate change, pandemic, and earthquake—have different temporal sequences, what is important is how these impacts connect with existing vulnerabilities and capabilities in contexts of local sustainable development. The designation of temporal effects is also problematic. The case of a pandemic involves both the intense episode of contagion, but also the longer-term stress of economic instability and the health effects of ‘long-Covid’ [88]. Climate change can also involve intense events, such as flooding, and longer-term impacts, such as drought. An earthquake is simpler in the sense that it is purely an episodic event, of short duration (although accompanied by aftershocks of lesser intensity). Analysis of the three impacts in the two regions is provided by quantitative data on local and regional development conditions, as well as complementary sources such as national and local press that document the impacts themselves.
The regional data focus is on poverty (socio-economic conditions), with a particular breakdown in terms of two of the most relevant regional development dimensions of differentiation in Chile: rural–urban, and indigenous-non-indigenous. The sources for this data are provided in Table 1. The regions are also broken down into their constituent municipalities since it is in these localities that local sustainable development takes place and reveals the considerable intra-regional heterogeneity that exists. Following Turner et al. [36], our interest is in the underlying livelihoods and human conditions. The data are used descriptively here in terms of establishing the relative additional impacts generated by the three risks. As such, these threats are seen as part of a complex fabric of inter-related disturbances and stresses that affect localities, and not as single, siloed events.
At the regional level, an analysis of trends was undertaken. Equation (1) summarizes the trends according to the differences of each of the municipalities against the regional averages, which provides insights into how local areas compare against this regional standardization. This enables a view of socio-spatial differences and inequalities, particularly between urban and rural municipalities, but also within the large metropolitan region of Santiago. Understanding, generically, how local areas compare to the regional average does not imply an ideal threshold, but rather trends that will be subject to different influences, such as rurality and urbanity. This regional analysis has included both multidimensional poverty (MP) and sources of municipal income (SMI)
MP ,   SMI :   A ¯ m = 1 84 = i = X n m i R i ¯ n i
A: average of differences of MP and SMI, comparing municipal and regional averages per year. m: municipality. mi: municipal value. i: year. n: highest year according to indicators (see Table 1). R ¯ : regional average value.

4. Highlighting Regional Differences

At the national level, Chile has been characterized by steady economic growth since the return to democracy, despite a high susceptibility to external shocks due to its dependence on a limited number of exports, copper in particular [92]. Poverty levels have improved also, from 68% in 1990 to 14.4% in 2013 and 8.6% in 2017 [93,94], leading to a very high Human Development Index in continental terms [95].
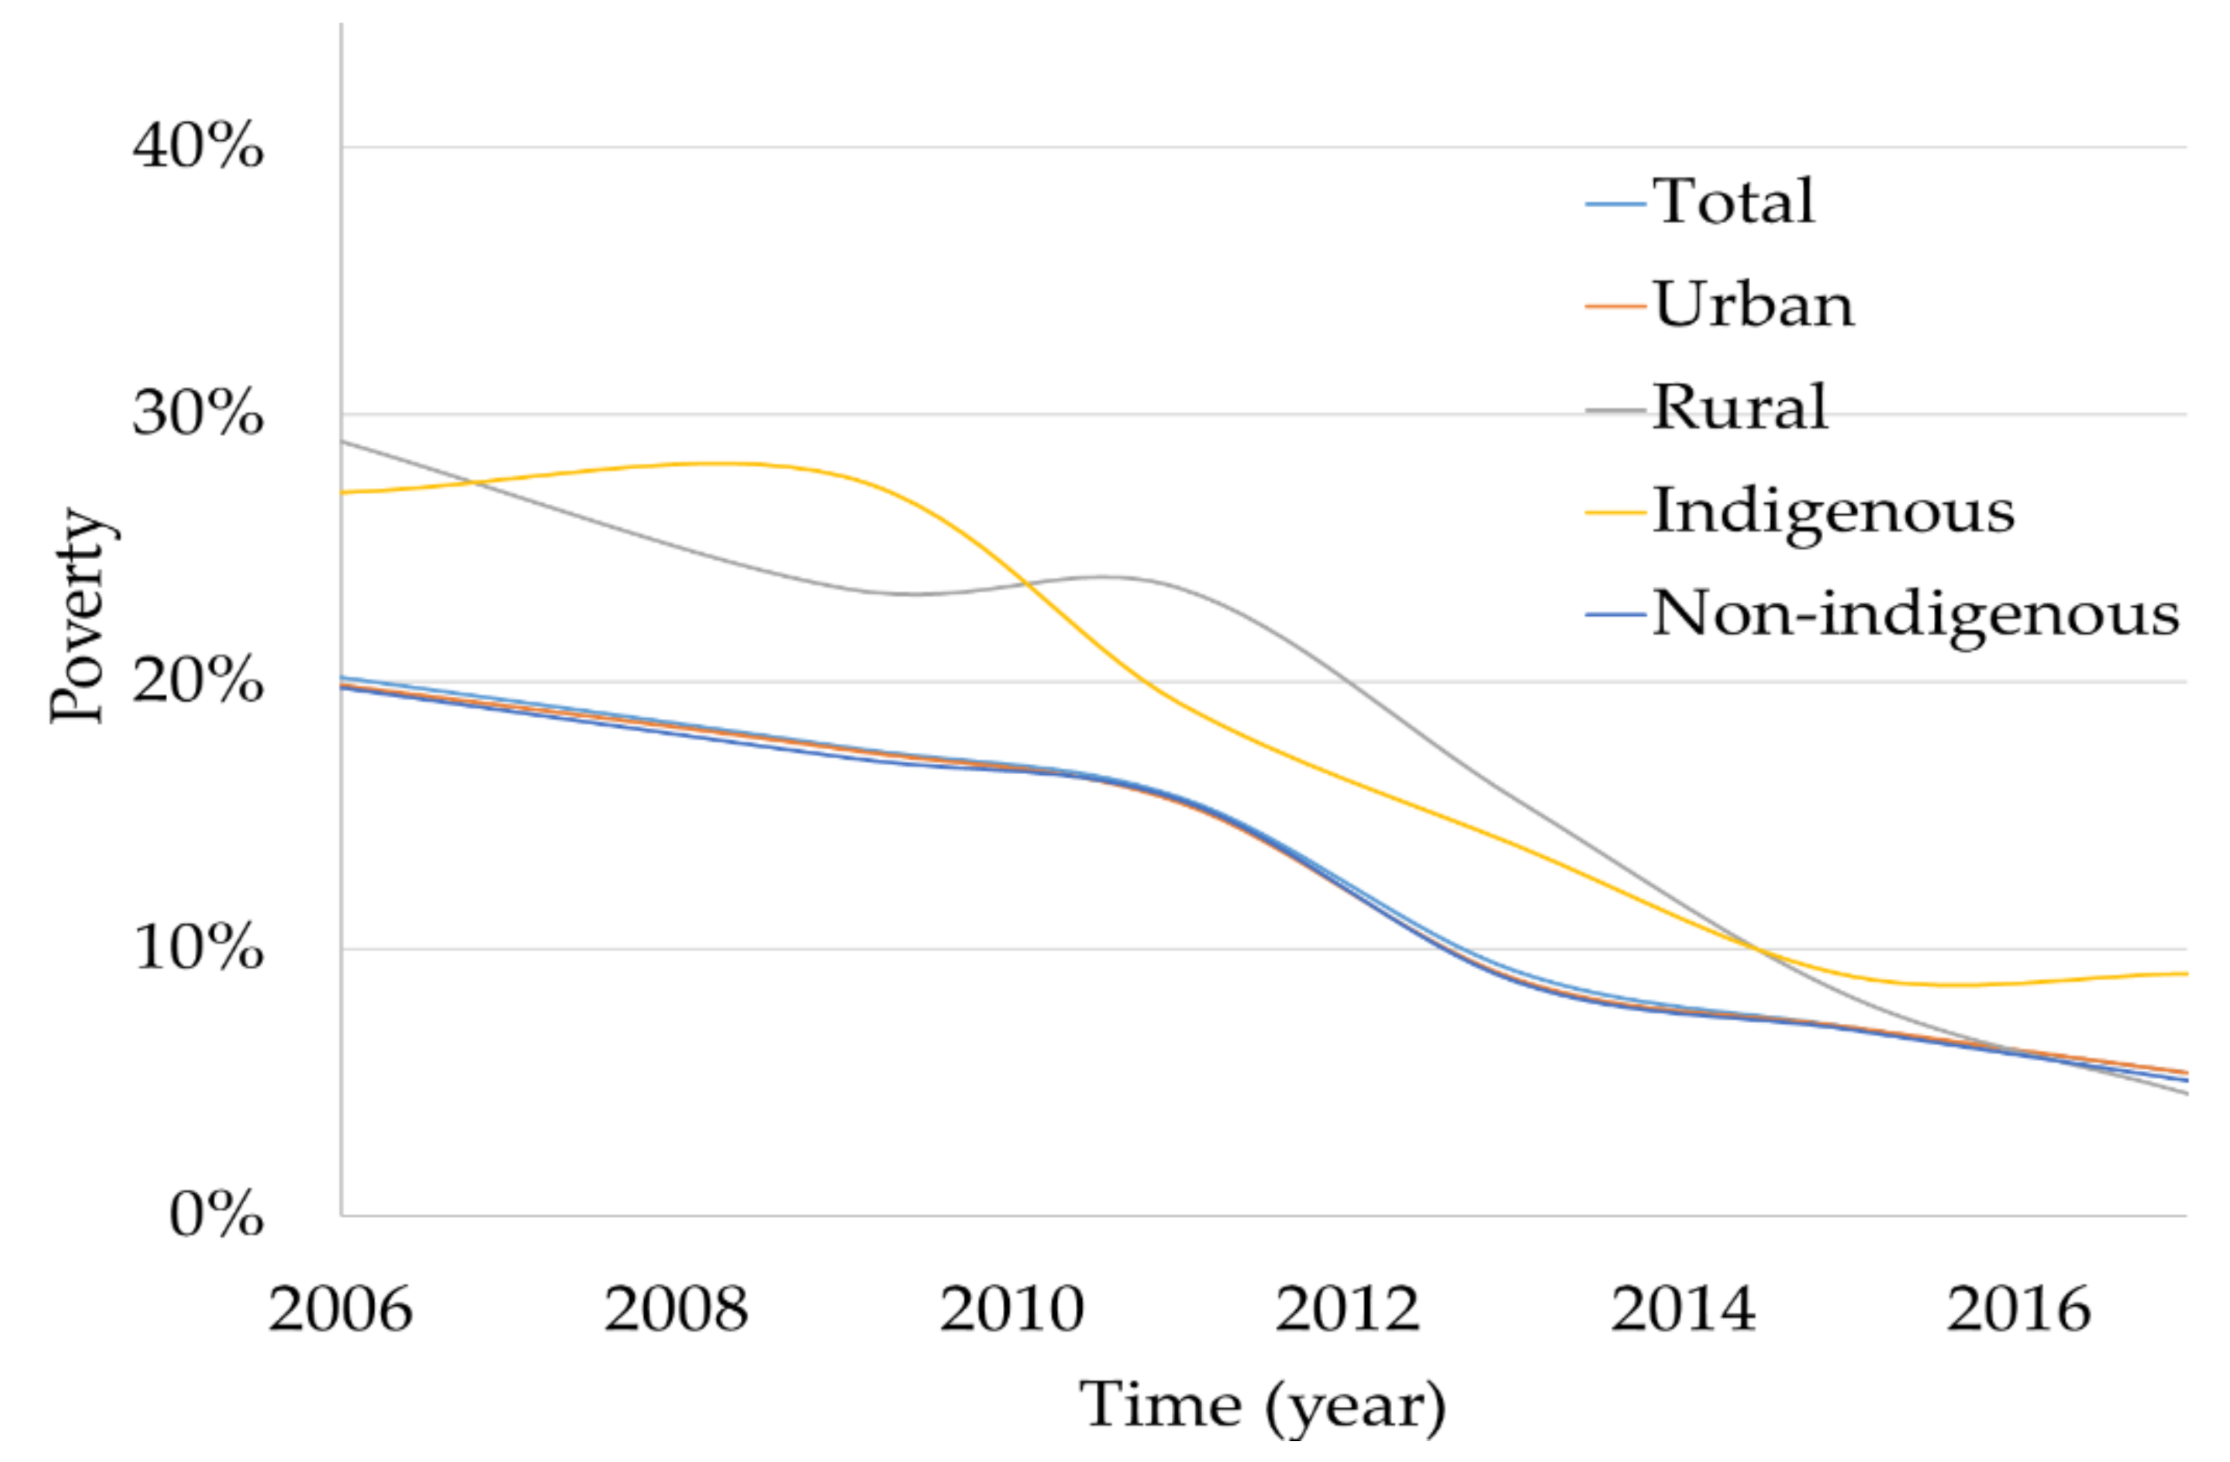
For the World Bank, Chile is considered a ‘high income’ country and it is also a member of the OECD; however, the principal weaknesses in the national socio-economy lie in its inequalities. These inequalities are highly evident in terms of regional and intra-regional differentiation. In 2018, the income shared nationally by the poorest 40% was 14.4%, leaving Chile 66th in the Human Development Index ranking [95]. It is at different spatial scales that inequalities become more apparent. For this reason, the analysis highlights intra-city, rural-urban, and indigenous–non-indigenous differences [62,93,96,97,98,99,100]. Generally speaking, the difference between the national and different sub-categories (urban, rural, indigenous, and non-indigenous) has been more favorable for the urban and non-indigenous. Although the gaps have narrowed in the latest CASEN surveys, indigenous communities have been inclined to a steady-state, while rural communities have moved closer to the national average (see Figure 2).
Although this national disaggregation reveals a reduction in socio-spatial differentiation, the situation is more nuanced when analyzing the regions more specifically. In 2017, the regions with the greatest differences of rural poverty against the national average were Ñuble (15%), Biobío (11%), and Araucanía (19%). These are also regions with a high indigenous population, 17%, 10%, and 18%, respectively. Magallanes, a more rural region (in the extreme south of Chile), was the only other one that remained below the national average. Regional trends from the poverty indicators indicate that poverty has fallen at both the urban–rural and indigenous community levels, although the urban–rural–indigenous differences still remain between 8% and 10%. It is these differences that provide some of the structural differences that shape adaptive capacities for diverse, multiple risks.

The Santiago Metropolitan and Araucania Regions

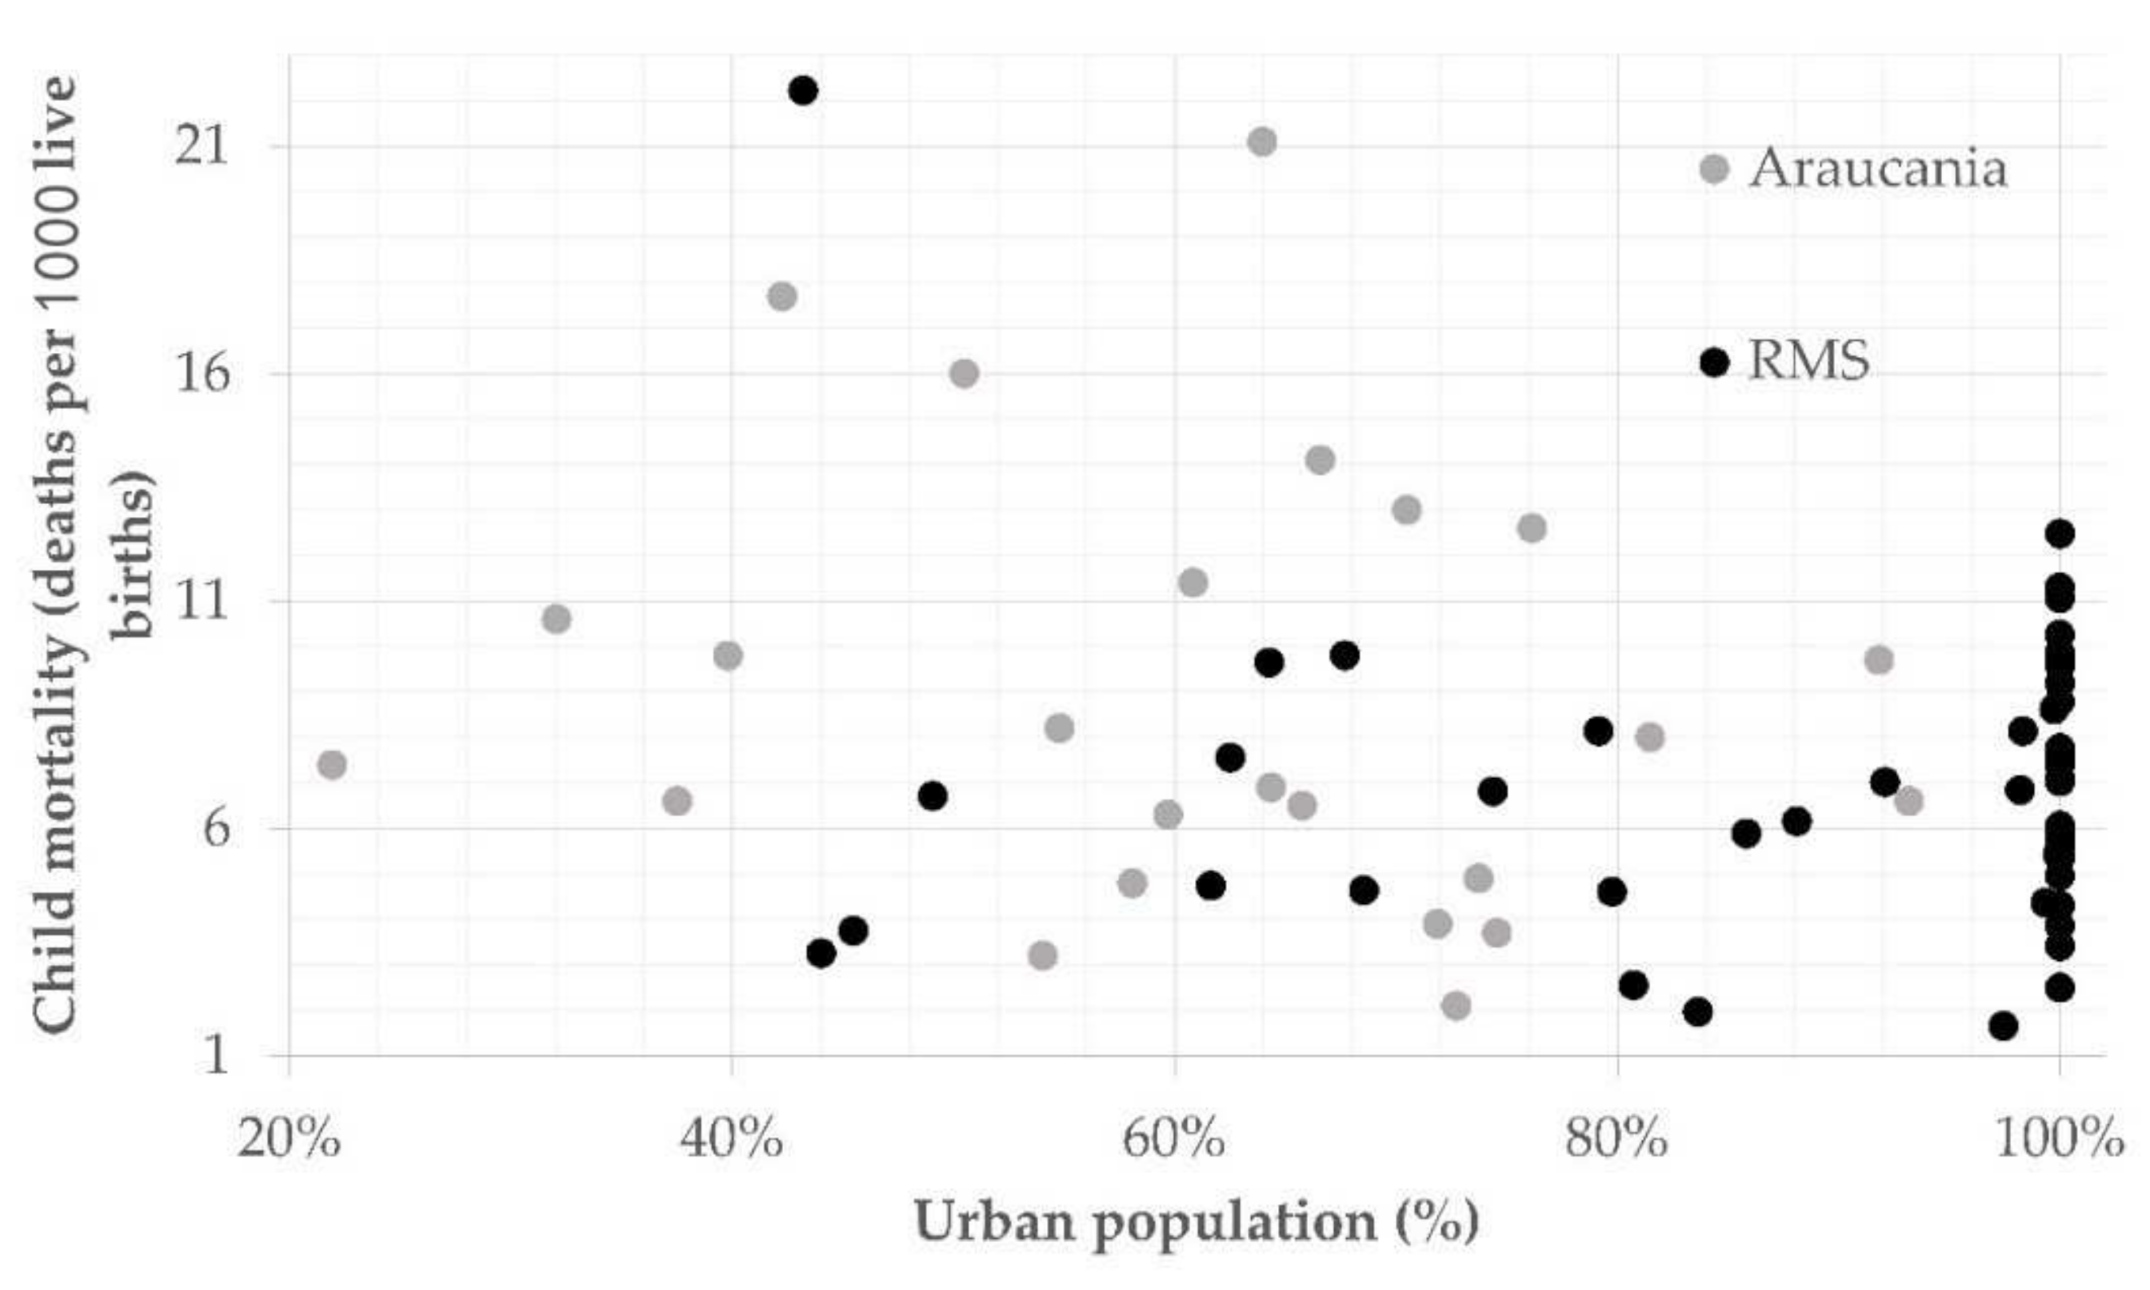
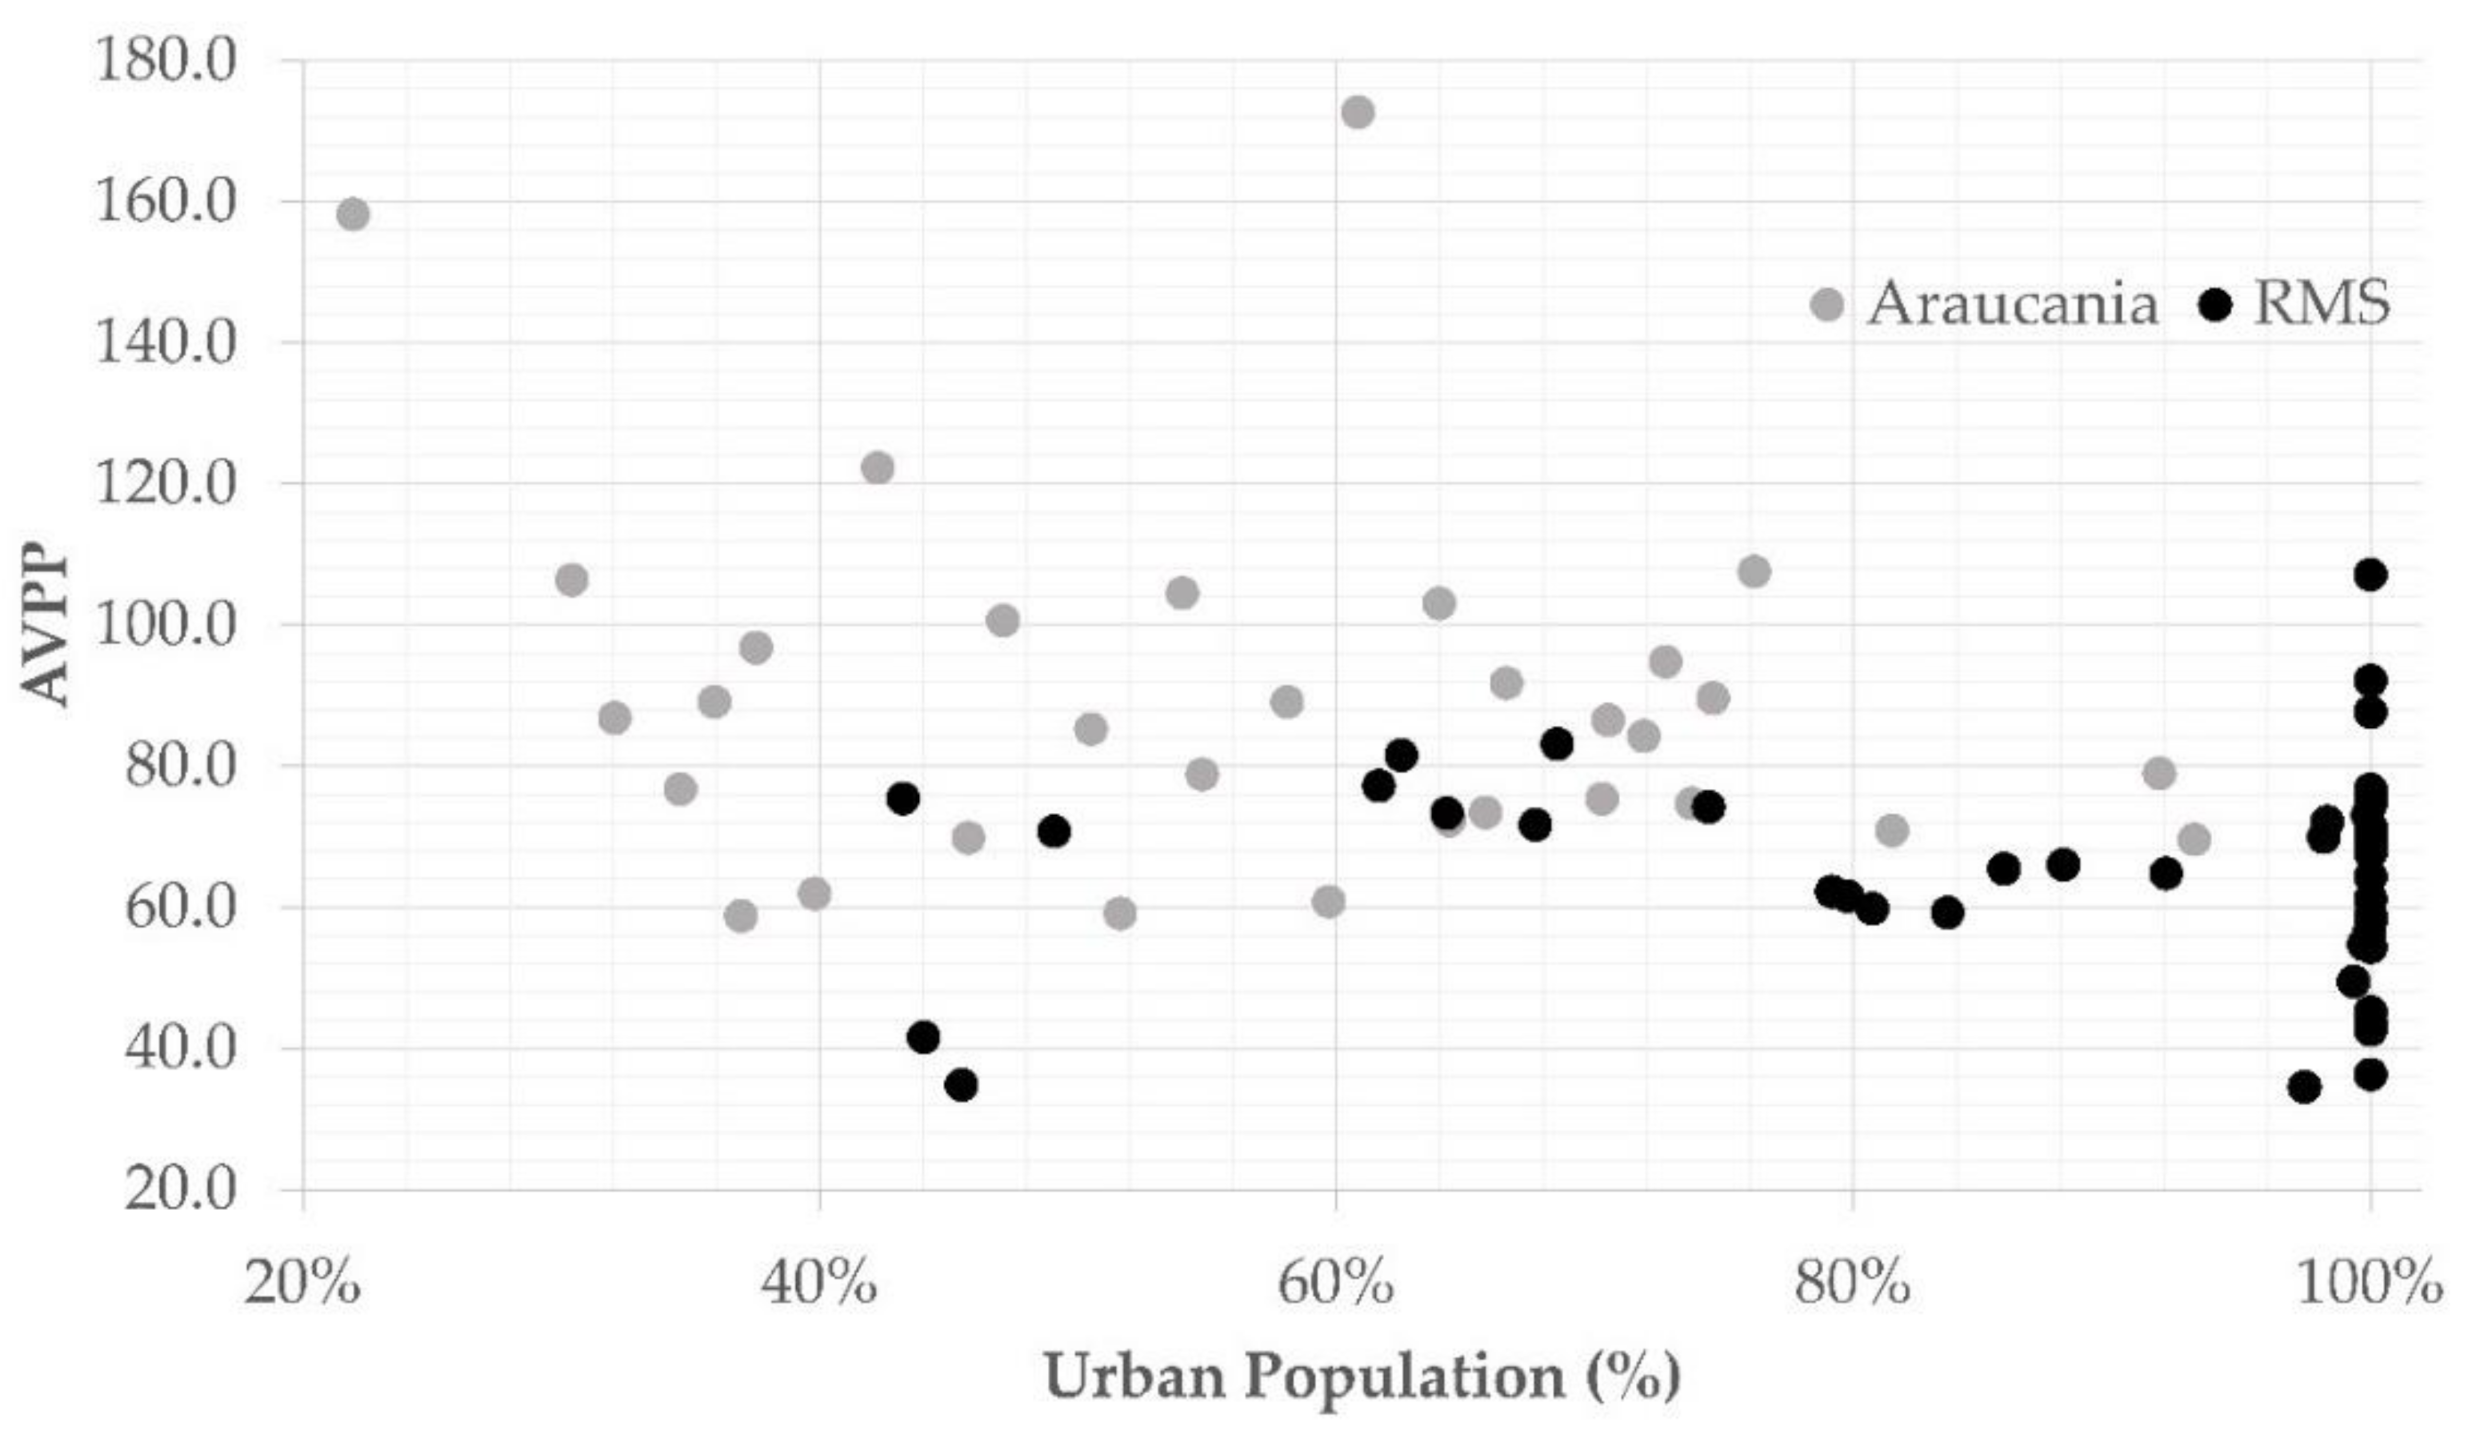
As has been pointed out in successive studies and is noted in the previous section, the Araucanía Region still maintains levels of poverty for almost a third of the population in rural areas and for indigenous communities. This is contrasted with the highly urbanized Santiago Metropolitan Region, which has certain factors (see Daher [101,102]) that make it more representative of the wider Chilean experience with its high levels of socio-spatial differentiation (see Gutiérrez-Antinopai and Barton [103]). This is not only because of its number of inhabitants (over 40% of the national population), but also because some municipal areas stand out in terms of their high human development indexes and low levels of poverty, in comparison with others. The Metropolitan Region has seen poverty fall from 20% to almost 5%; by 2017, the urban–rural gap was also minimal, unlike the experience of indigenous communities in the south (see Figure 3). This can be explained, to a certain extent, by a process of residential dispersion with households moving to the suburbs and rural plots (see [104,105]). The Araucanía Region also has this urban–rural differentiation, albeit with a much larger relative rural and smaller settlement population, and its indicators also show a decrease in the aforementioned categories of poverty (see Figure 4). Comparing regions, multidimensional poverty values have stagnated (although the data only correspond to a period of five years). The trends have been maintained in these regions, with the Araucanía Region having the highest multidimensional poverty, close to 35%, compared to 21% in the Metropolitan Region. The differences are also comparatively favorable for the Metropolitan Region in both AVPP (years of potential life lost), and for infant mortality based on the average between the years 2000–2016. This is also the case for the infant mortality interval ranges (SD), being lower in the Metropolitan Region, with a minimal tendency to decrease. Metropolitan Santiago municipalities with over 90% urban population show heterogeneity in the results; however, this is different for Araucanía in 2016, where municipalities with over 80% urban population had relatively similar results. The dispersion in Araucanía is greater than in the RMS, as is the average. In the Araucania Region, municipalities with higher urban population tend to have similar values, with much less in dispersion.
In AVPP and infant mortality, the differences are maintained, although the increase in the regional standard deviation of Araucanía is striking (see Table 2). It is important to note that in the Araucanía Region, unlike in the Metropolitan Region, the urbanized areas (with over 80% of the population living in urban areas), have similar rates. However, there are significant intra-urban differences in the Metropolitan Region, while a spectrum of diverse results is to be found in the municipalities of the region which have less than 60% urban population (see Figure 5 and Figure 6).
Another similar case can be found in the per capita income for each municipality. Although the search for equality in this area is complex given the diversity of municipalities and their respective physical, socio-economic and socio-ecological conditions, it is relevant to note that—in regional terms—the dispersion has been increasing. This favors higher-income municipalities (see the following section for more detail). In general, within the framework of an increase in the availability of monetary resources (average), the dispersion has also been increasing and it is much greater in the Metropolitan Region. It is important to note that, since 2008, resources have been greater on average in Araucanía.
The point to be made here is that regional resilience is shaped by adaptive capacities that are reflected in the diversity of local, municipal conditions of poverty, health, and municipal spending. Rather than adaptive capacities being constructed in the face of specific ‘natural’ hazards, such as seismic activity or extreme climate change events, the structural conditions that are revealed in the Human Development Index and in regional and municipal variations, limit local adaptive capacities. This is due to the fact that these communities are more dependent on public transfers rather than their own income or resources, hence revealing a lack of capabilities and entitlements, to use Sen’s terms.

5. Adaptive Capacity: The Role of Socio-Economic and Socio-Cultural Conditions

5.1. The Santiago Metropolitan Region

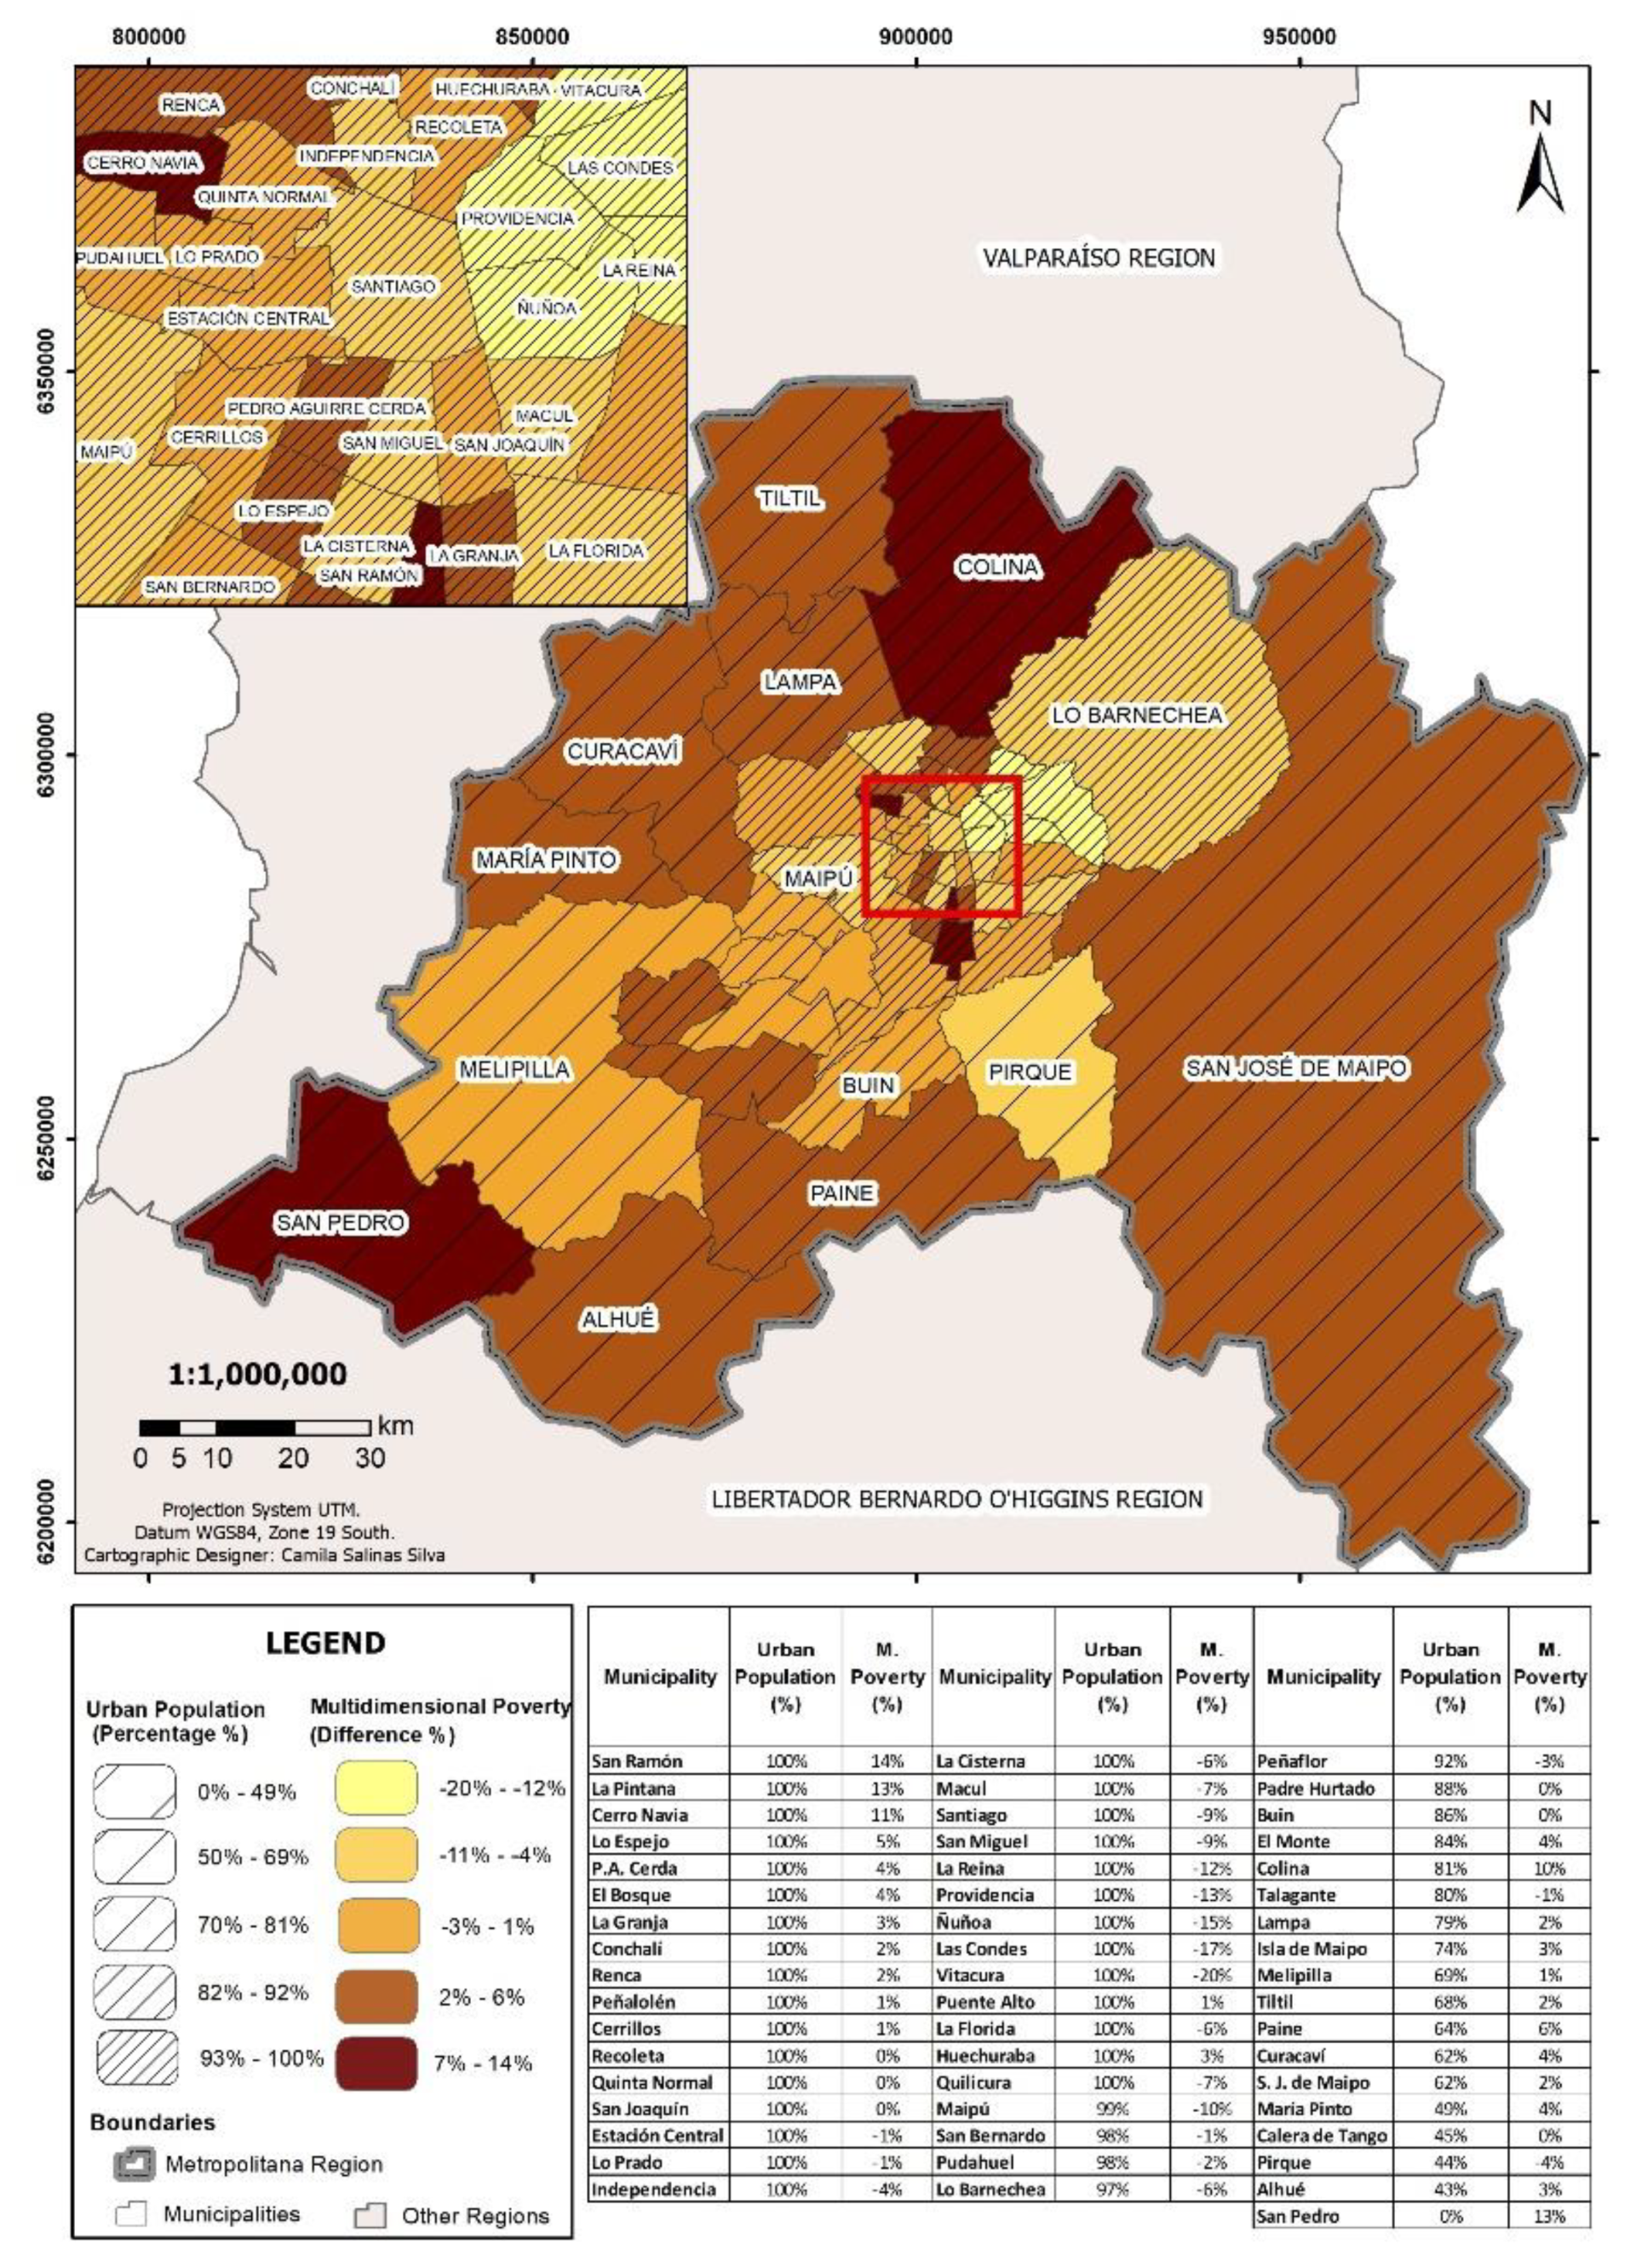
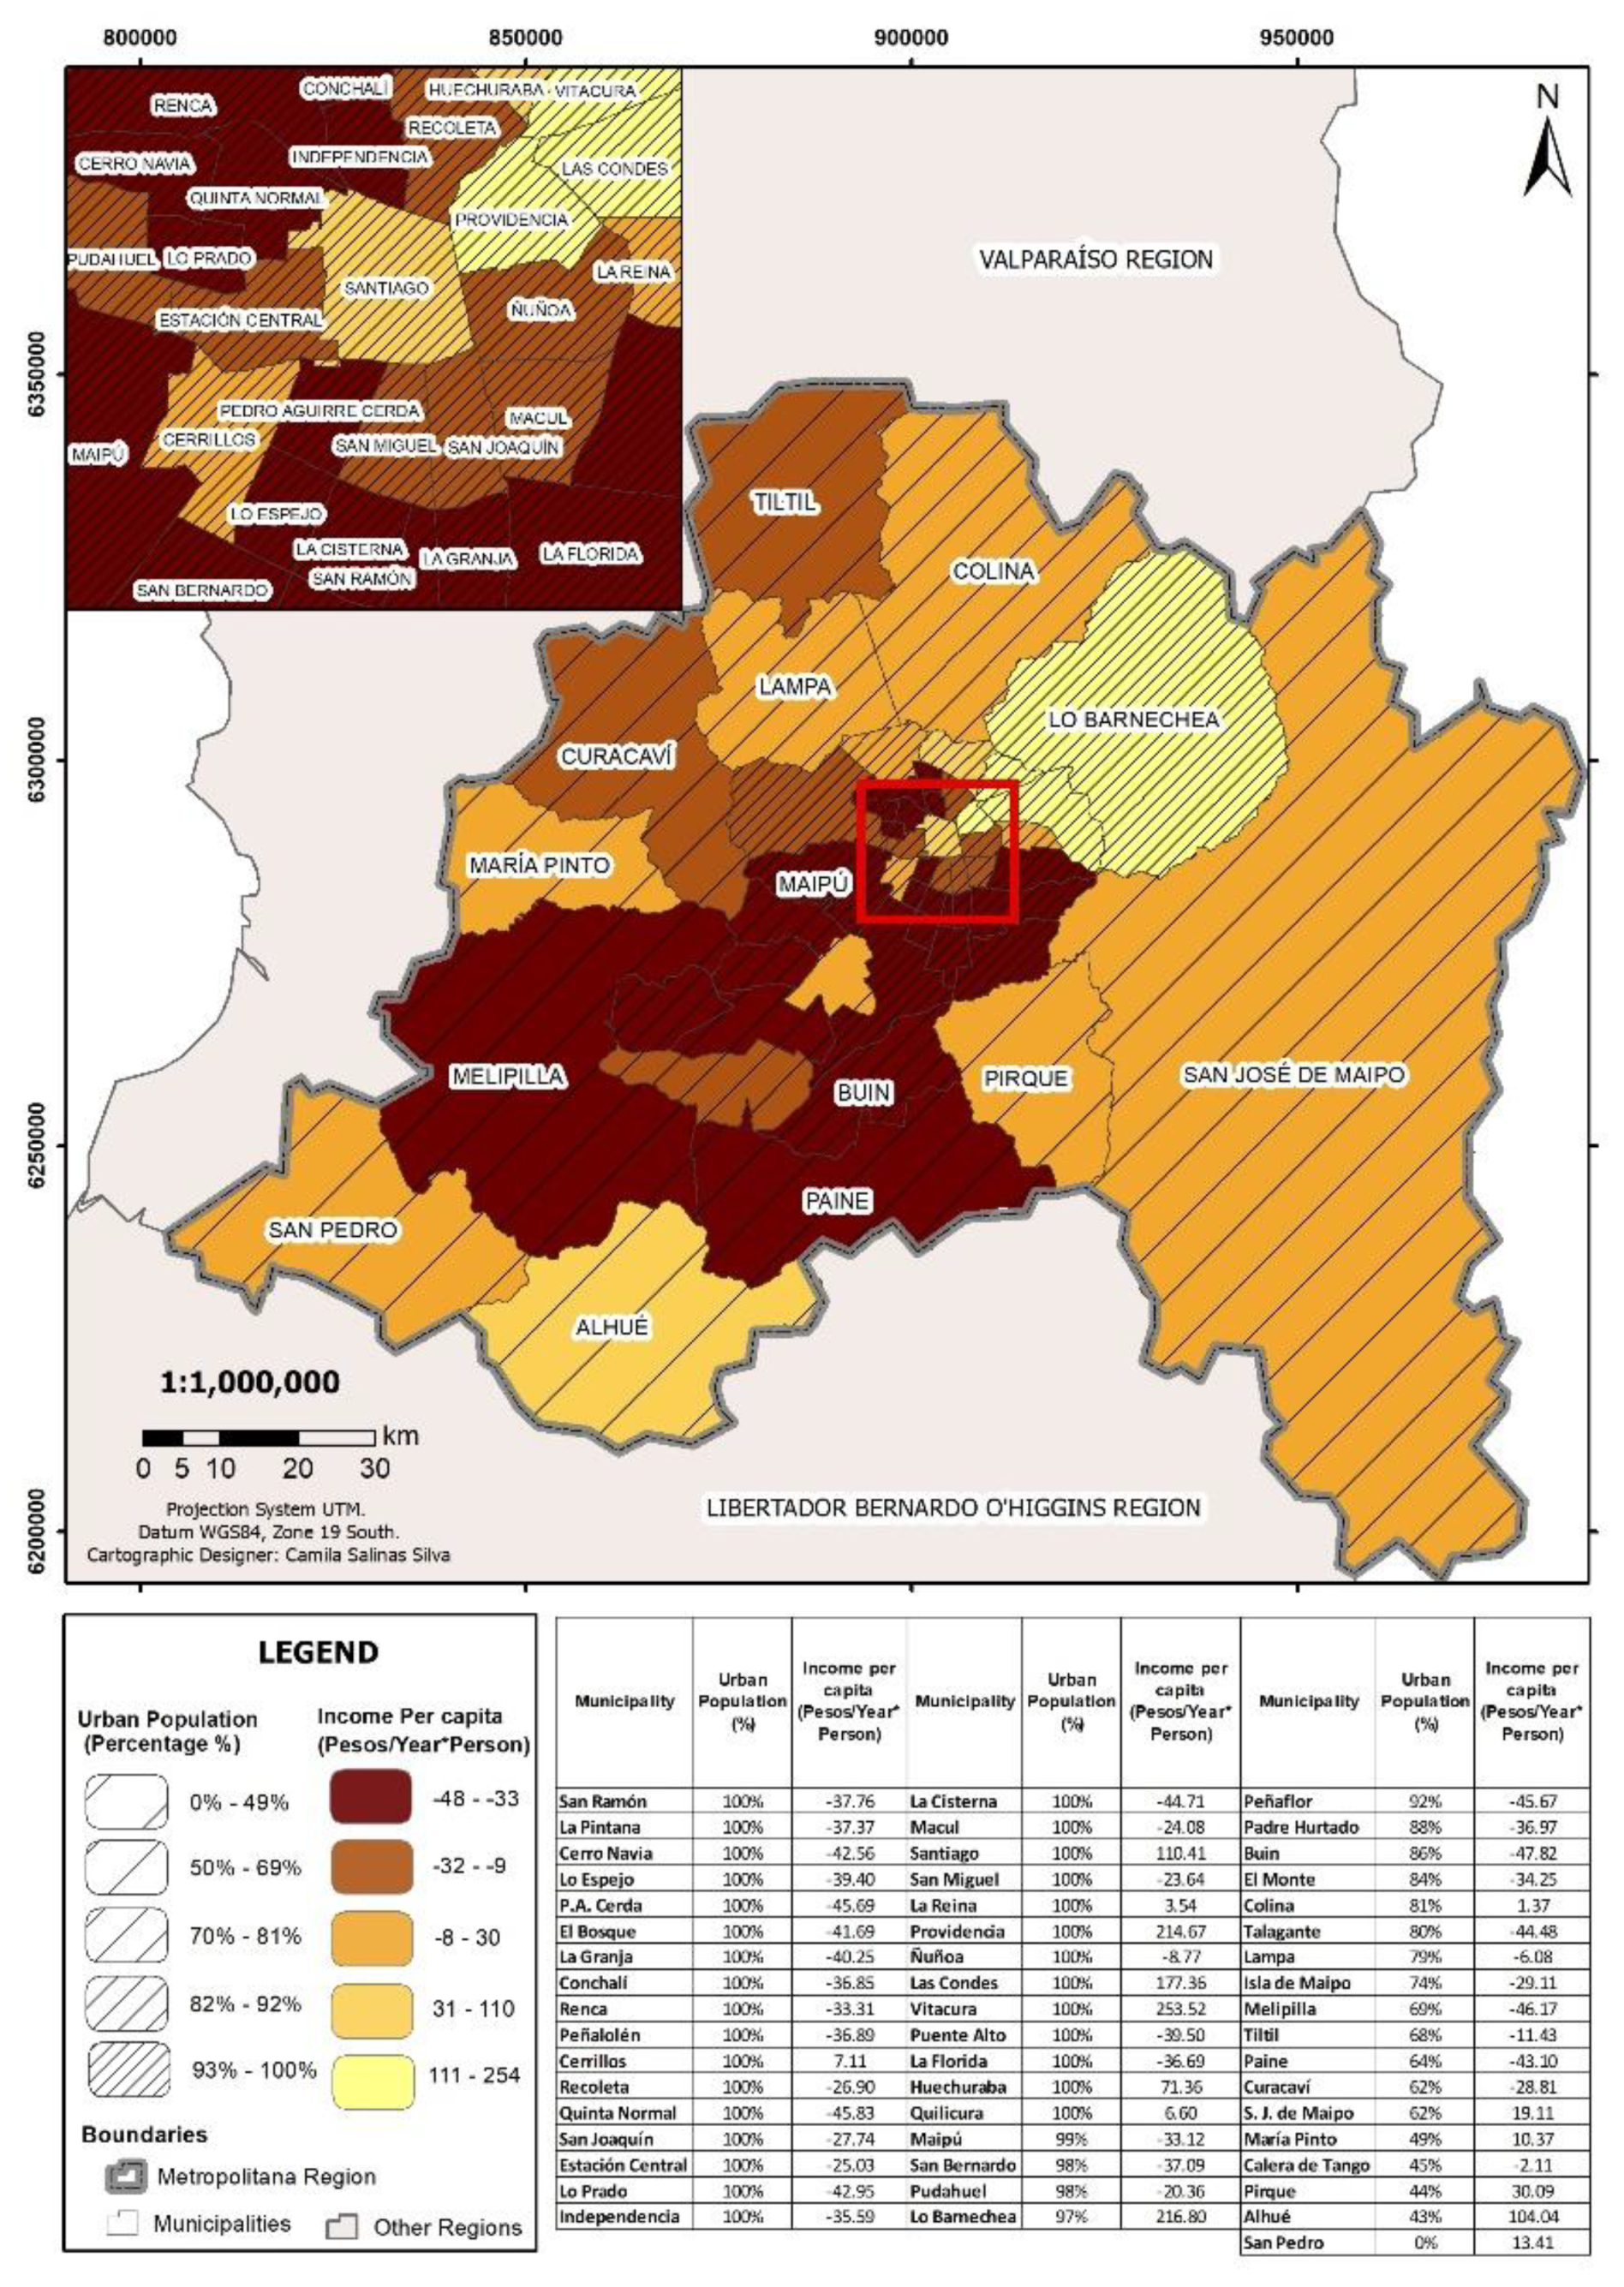
In this region, poverty is manifested in different communities with different outcomes, with evidence that urban vulnerability is equally as relevant as rural vulnerability. At the urban municipal level, the conditions of poverty in the Metropolitan Region are an anomaly compared to other regions. In fact, the highest poverty levels in 2017 were in the municipality of La Pintana, with an urban population of 100% [108,109,110], also in El Bosque and San Bernardo with 98%, Padre Hurtado with 92%, and El Monte and Independencia with 74% and 100%, respectively. All of them have a poverty rate between 8.5% and 14%, well above the regional average of 5.8% and more in line with some rural municipalities such as María Pinto (10.8%), San Pedro (9.3%), Curacaví (7.4%), Alhué (6.7%), and San José de Maipo (6%). Multidimensional poverty exhibits a similar trend. In 2017, Lo Espejo, Cerro Navia and El Monte, with an urban population of over 83%, were 50–70% higher than the regional average; the three municipalities with the lowest urban populations exceed it by between 20–50%. When the annual gaps against the regional average are analyzed for each municipality, the differences are not only at urban–rural levels, but also at intra-urban levels (see Figure 7).
With respect to health indicators, as observed in Figure 5 and Figure 6, the Metropolitan Region reveals considerable differences between intra-metropolitan urban areas. During the 2000–2016 period, there are urban and rural low-income municipalities that are above the regional average in infant mortality such as Buin, San Miguel, San Bernardo, Independencia, El Bosque, and Recoleta, also more rural areas where poverty is still above average: Alhué, San José de Maipo, San Pedro. However, with respect to AVPP, the municipalities with the greatest differences against the regional annual average are urban, among which are Independencia, Quinta Normal, San Joaquín, San Miguel, San Ramon, and Cerro Navia, all of which have 100% urban populations.
Although the trends, as noted above, are towards a decrease, a common denominator is the fluctuations that have occurred in some municipalities, where rural and urban communities have been affected, but with rural municipalities affected to a greater degree. For example, Alhué, Tiltil, and Curacaví with a high rural population, are municipalities that have not shown a notable downward trend during the period, and remain above the annual regional average.
The municipal income per inhabitant in the Metropolitan Region reveals high inequality, in both urban and rural areas. The most populous municipalities have been above the regional average: San Pedro with 0% (likely to be an institutional data error) to San José de Maipo with 62%, except for Calera de Tango, which on average has been slightly below the annual regional average (see Figure 8). The greatest differences are those in favor of the municipalities in the eastern sector of Santiago—the ‘cone of wealth’, although there are other outliers, such as Alhué, which is well above the regional average. At the urban level, a large percentage of the municipalities are below the average: 31 municipalities out of 41 are, on average, 3–5 times lower than the average of the 10 municipalities with higher incomes.
As with health indicators, these indicators of public institutional spending reveal the mosaic of socio-spatial differentiation that exists in the Metropolitan Region. The picture is not a simple one of rural versus urban, but rather a more complex pattern of high levels of differentiation within the urban space, as well as considerable variations among the rural municipalities, most of which have been affected by considerable suburbanization pressures since the 1990s [111]. In the face of disturbances and stresses, these underlying structural conditions are wholly relevant to the adaptive capacities of the communities involved. Consequently, it is baseline poverty and inequality that shapes the capacities for regional resilience, and, therefore, local sustainable development.

5.2. The Araucania Region

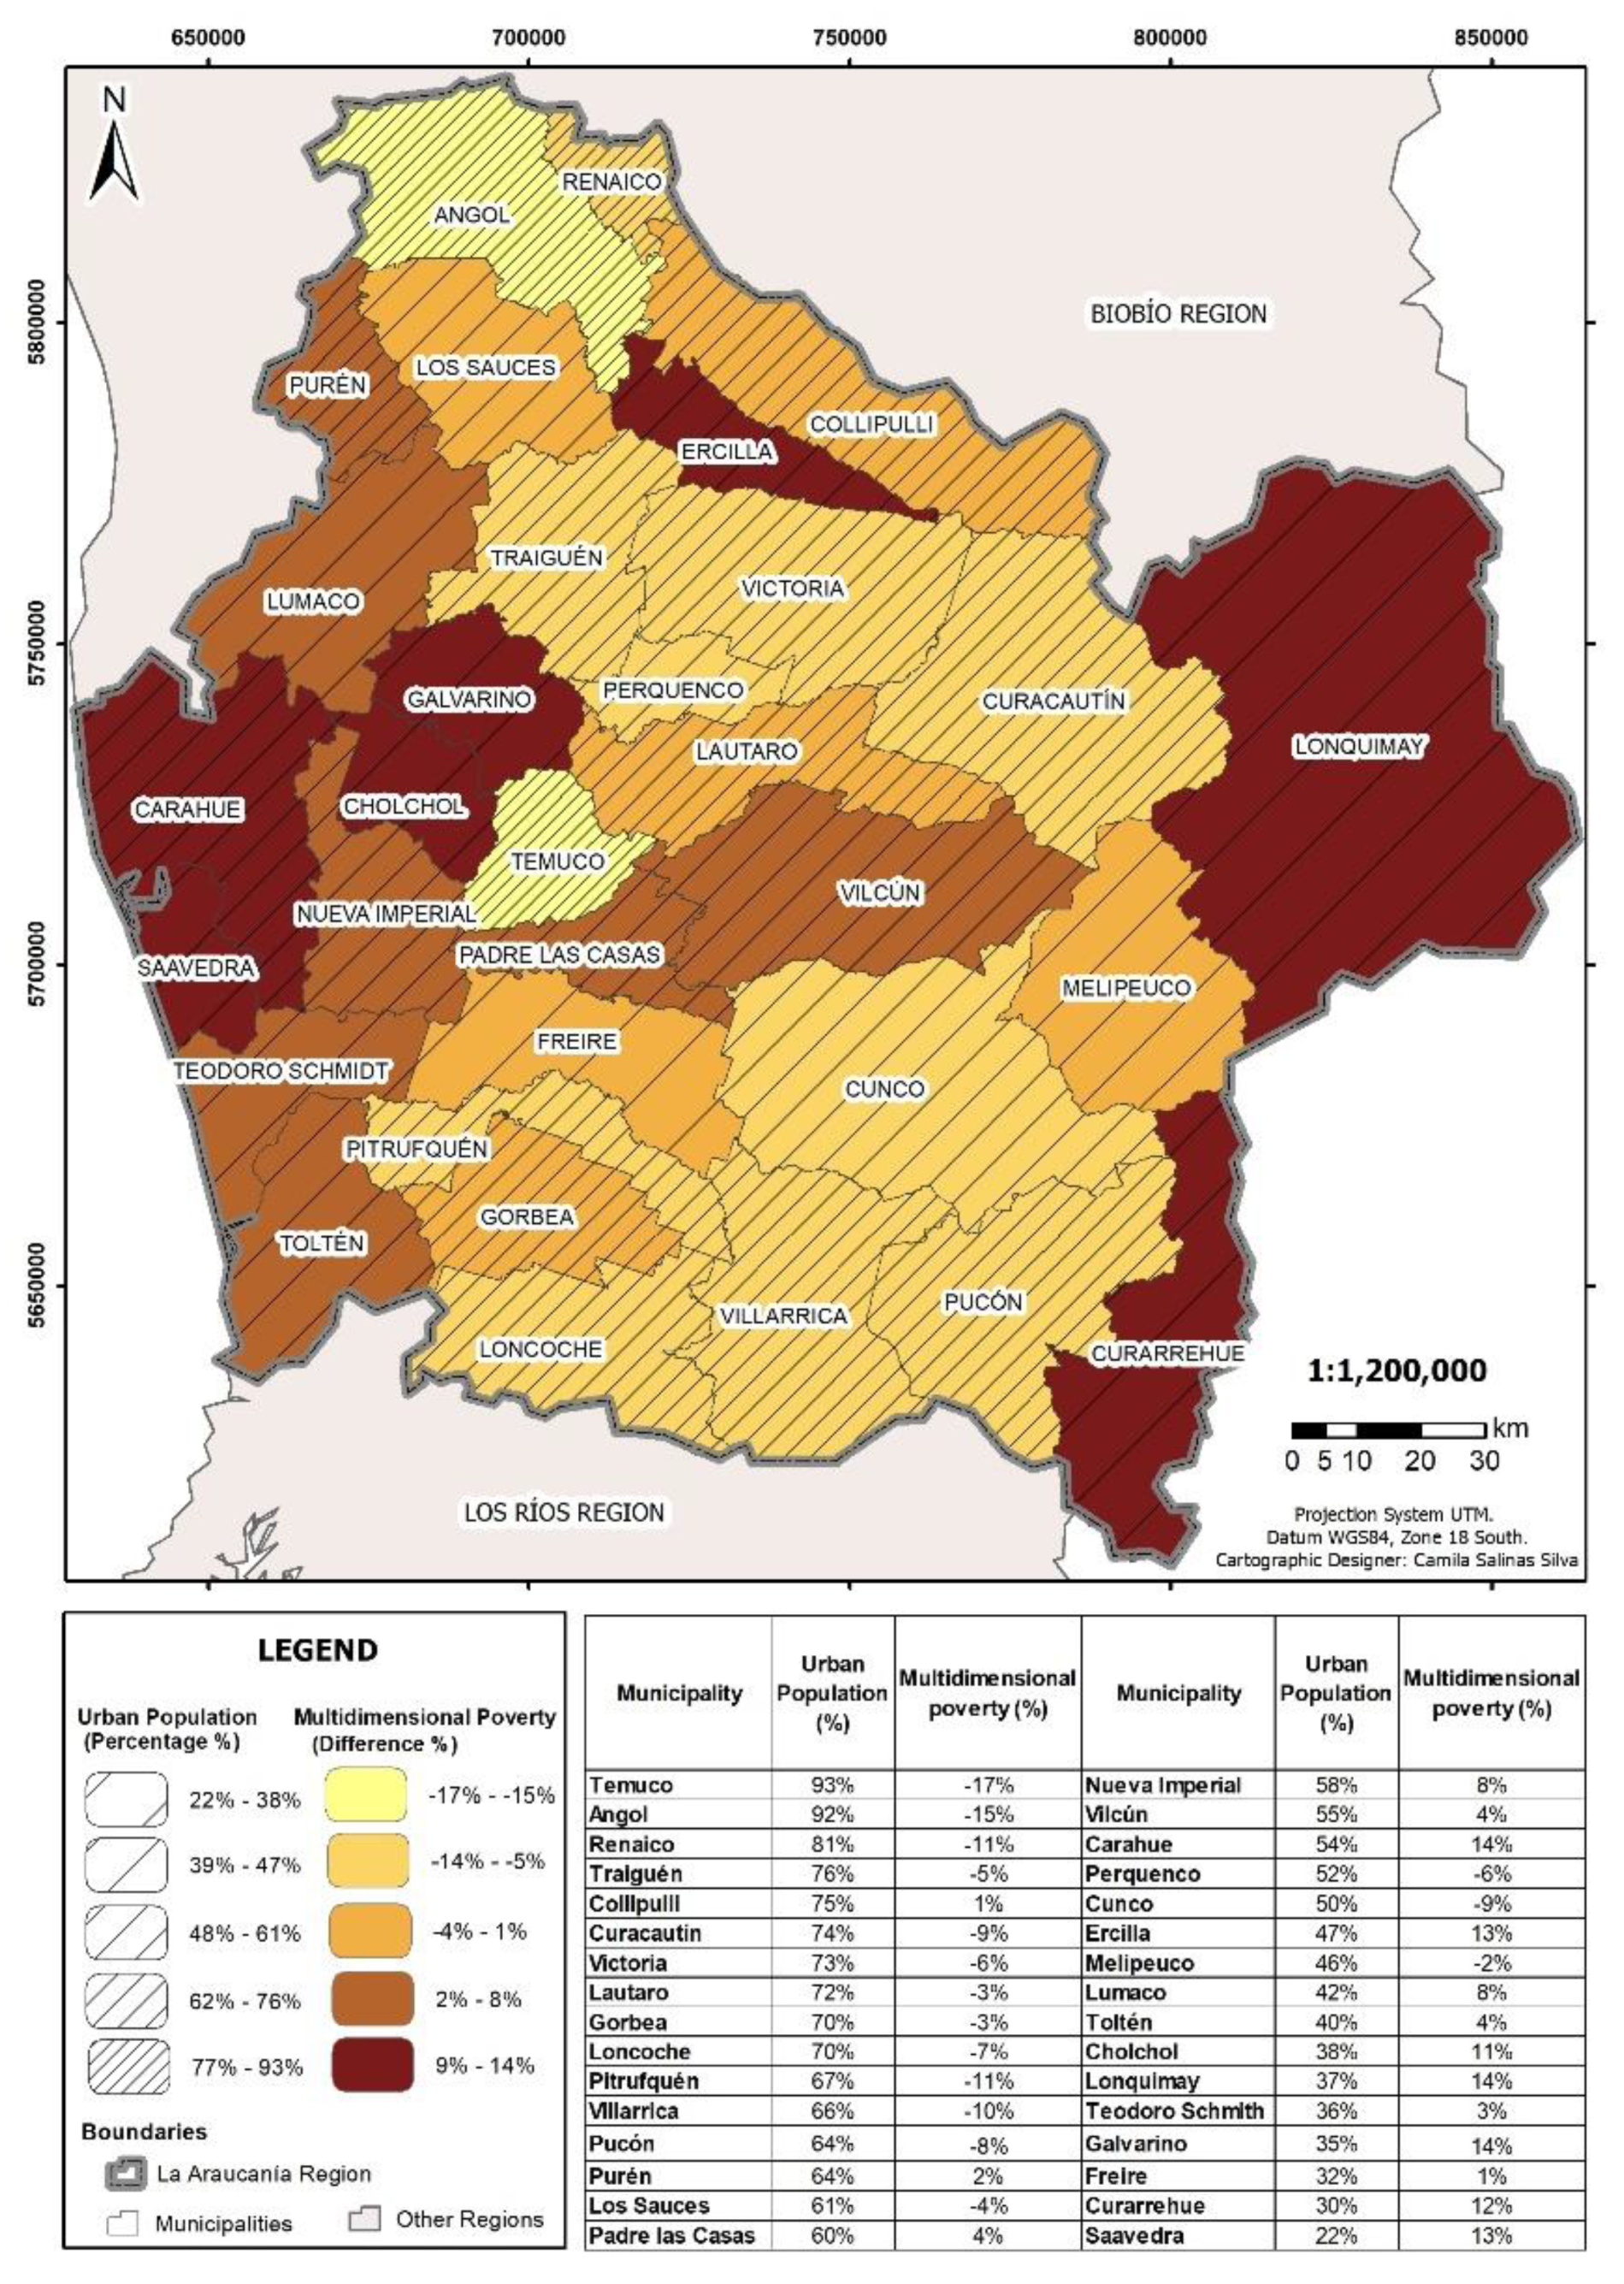
The Araucania Region had the highest national poverty rate recorded during the period 2011–2017. Rural and indigenous poverty were also the highest recorded at the national level. However, poverty reduced from 49% to 17%. The municipalities with the highest poverty rates in 2017 were Cholchol (41.6%), Galvarino (37.3%), Puerto Saavedra (35.4%), and Toltén (35.1%), all in the province of Cautín, with high rural populations of over 70%. It is important to bear in mind that, unlike the Metropolitan Region, there are no municipalities that have 100% urban populations. Of the 31 municipalities, 21 exceed 50% urban population but only three of them exceed 80%: Temuco, Angol, and Renaico. The intra-urban differences, against the regional average, are clearly in favor of the most urbanized municipal areas, rather than Collipulli (75%) or Los Sauces (61%), where poverty was slightly higher on average than the regional level. As for multidimensional poverty, there are municipalities that register a value higher than 50%, all of them with higher rural populations of 22–54%: Lonquimay (54.9%), Galvarino (54.4%), Saavedra (54.2%), Cholchol (54.2%), Curarrehue (54.1%), and Carahue (51.4%) for the year 2017. The average difference in values between the regional level and individual municipalities (2013–17) are clearly unfavorable for rural areas (see Figure 9).
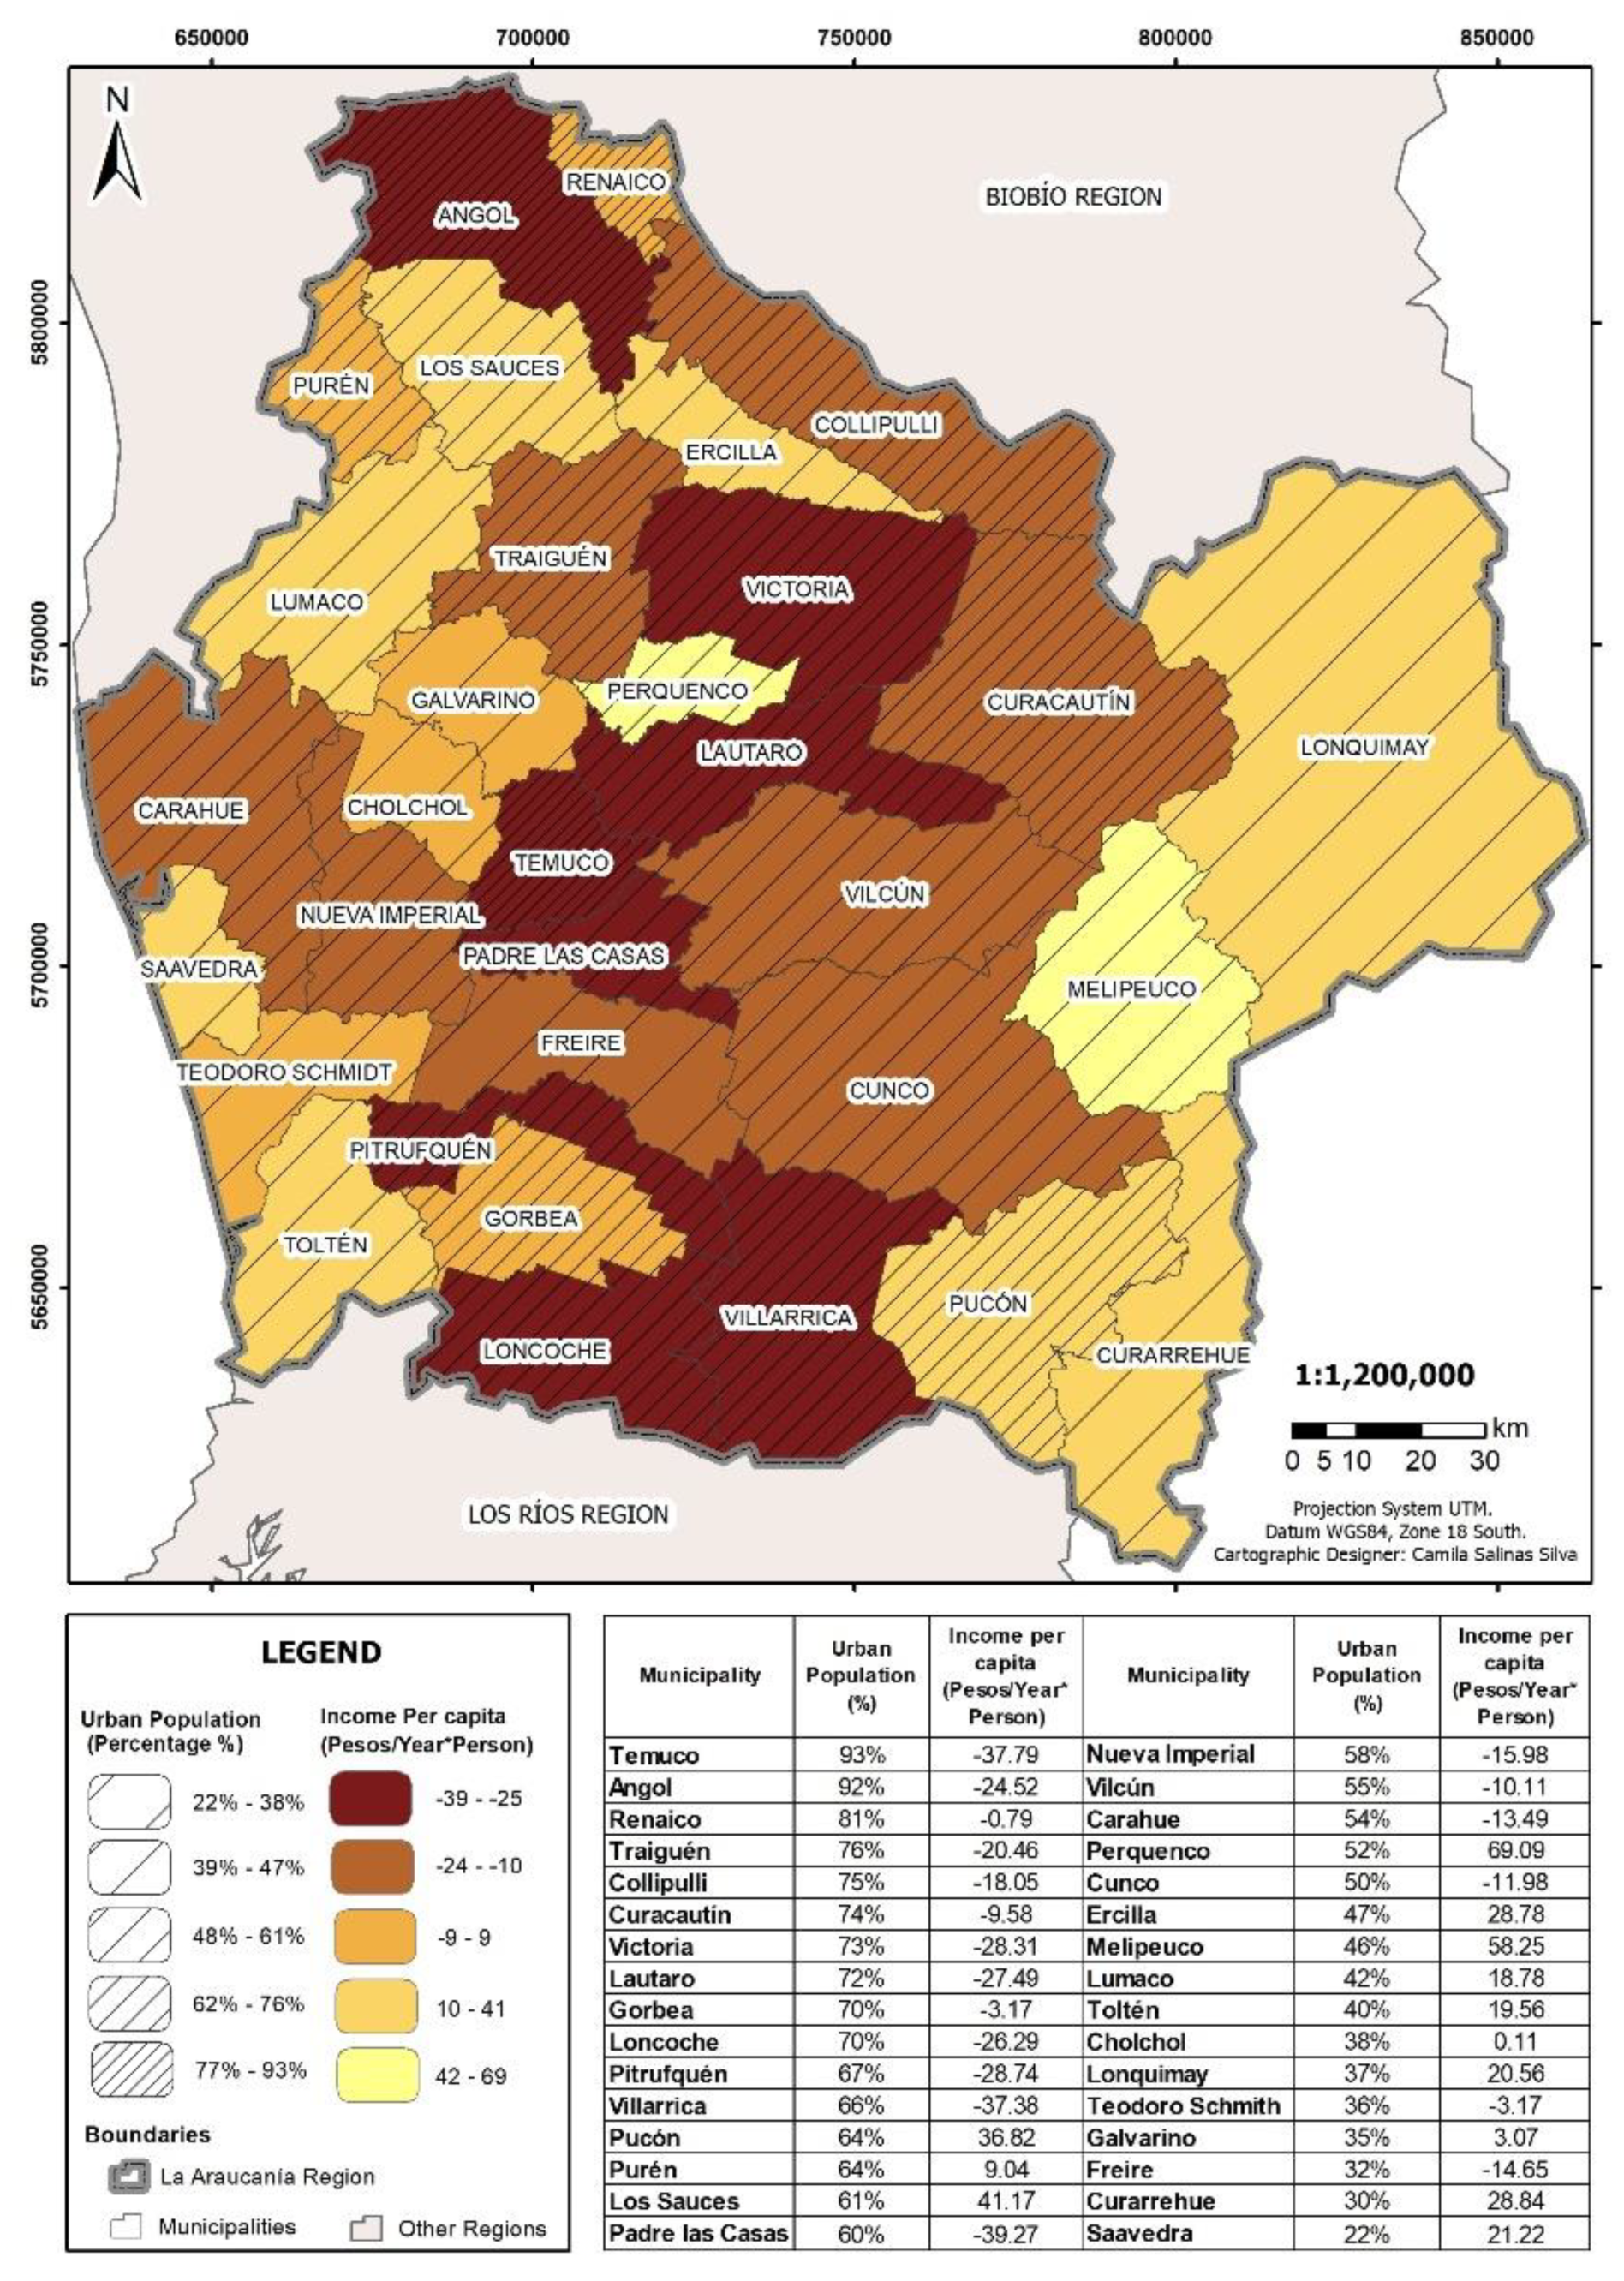
Municipal income, meanwhile, has a very similar trend to that of multidimensional poverty, which gives a clearer picture of the reductions in poverty that have taken place after the return to democracy (see Figure 10). However, it should be clear that there are still differences such as the ones that can be seen in Pucón and Perquenco, which are, on average, below the regional average of multidimensional poverty and above the average on municipal income.
With regards to mortality indicators (2016), as indicated in the previous section, the municipalities with the highest infant mortality rates were those with the greatest number of rural inhabitants; however, when comparing the evolving differences between municipalities and the regional average, there are nuances that are worth mentioning. Melipeuco, with 54% of its population living in rural areas, was well above the regional average in only three years (2000, 2010, and 2015), while the municipality of Los Sauces, with 61% of its population living in urban areas, was also above the average in three years. These cases highlight the point that the municipalities with an urban population equal to or over 50%, were mostly below the regional average. In fact, the 13 municipalities with the best performance are in this range. As for AVPP, although the urban-rural situation and infant mortality also have nuances, where it is possible to find good results in rural areas with respect to the regional average, the trends in urban areas over 80% do not differ significantly from each other, which is radically different from the dispersion that is generated in rural areas. A highly relevant issue mainly concerning rural differentiation, but also urban to some extent—in terms of these structural socio-economic conditions—is the dimension of indigeneity. The persistently low human development levels of these communities in national terms, and the ongoing conflicts that compound this situation, especially in more rural locations, due to new energy projects and plantation forestry in particular [112].

6. Episodic and Incremental Risks as a Feature of Regional Development

The comparison between the Metropolitan Region and the Araucanía Region is stark. Neither region has the same profile in terms of rural–urban differentiation, or the intra-urban or inter-rural variations. To speak of regional resilience is, therefore, to speak of diversity and the wide range of structural conditions in play that shape adaptive capacities. When incremental or episodic threats emerge and impact these localities, it is these underlying factors that are most relevant to the responses that ensue. For this same reason, resilience is a reflection of these vulnerabilities and capabilities to a wide range of risks and not a condition that arises in response to a single threat. This is most evident when the three particular examples of risks selected here are brought into the discussion.
Rather than risks appearing to impact regional development processes, they should be understood as part of that same development process. These risks are multiple and shape the underlying structural conditions as well as providing opportunities and obstacles for future development. Since these structural conditions shape adaptive capacities, and vulnerabilities (see Figure 1), what additional effects are generated from particular risks, such as a pandemic, climate change, or an earthquake? The key is to determine how these risks shape vulnerabilities at the local level, based on socio-economic, socio-ecological, and institutional factors [36,39]. What is known of these risks is that they have highly variable impacts, although these mostly affect lower-income groups due to their limited adaptive capacities, whether in terms of income and assets, public transfers, or their ability to influence decision-makers. For example, in the Atacama desert, the flash flooding of 2015 showed greater exposure of particular groups located in peri-urban and rural areas [113]; in Santiago, air contamination affects lower-income communities the most [114]; in Valparaiso, the lack of planning in informal settlements resulted in 10,000 homes being affected by the wildfire of 2014, mainly low- and middle-income families [115]; and in the valleys of the central and southern regions, there is a crisis in access to drinking water that affects mainly low-income farmers and their livelihoods [116,117,118]. These examples reveal the diversity of threats that are experienced, often simultaneously, across the national territory. However, it is more common for the impacts to be more severely felt in lower-income communities, where indigenous peoples are overly represented [119,120,121]. This vulnerability not only refers to conditions of material poverty, but also health and access to educational opportunities, and financial support from public sector agencies such as local governments [122], as can be seen in the data in Section 4 and Section 5. In the following three sub-sections, the risks of Covid-19, the 2010 earthquake, and climate change are discussed in order to understand how they also exacerbate these current inequalities and vulnerabilities, and how they should be seen as part of a wider panorama of multiple risks rather than ‘one-off’ events, conceptualized and managed in isolation.

6.1. The Covid-19 Pandemic in Chile

The first signs of Covid-19 in Chile were recorded during the month of March 2020, with the return of a Talca man from abroad. By the end of that month, cases had reached 1142 and the first quarantine zones were declared. During these early months, most infections were concentrated in the central regions and in southern Chile. By the months of June and July, the number of infected people had reached its first peak, reaching 6938 new cases and 279 deaths on 27 July, which meant that the country, together with Peru, led Latin America in deaths per million inhabitants: 530 and 645 respectively [123,124]. During this period, the main regional impacts were concentrated in the Metropolitan Region, and the Valparaiso, Antofagasta, and Biobío regions [125]. Though the number of infected had fallen to 1566 and 30 deaths per day by August 11, the aforementioned regions already had 248,218, 16,081, 13,450, and 9792 accumulated cases. Meanwhile, the rate between the number of inhabitants and deaths was 895,143 in the Metropolitan Region and 25,655, 15,346, 13,627, 11,532, and 11,120 for the regions of Los Ríos, Los Lagos, Atacama, Araucanía, and Biobio. Of these, most were concentrated in the 50+ age range, accounting for 90% of the total number of deaths.
Given the exponential tendencies of infection, a matter that was anticipated between January and February of 2020 [126], the proposed measures were centered on the strengthening of the hospital system both in the availability of mechanical ventilators and critical care beds [127]. This kept the death rate low during the second half of the year.
The vulnerability of different regions can be seen in the provision of these hospital facilities, with more rural areas benefiting from the reduction in potential contagion by contact, but also suffering from a relative lack of critical care beds and ventilators. The pandemic aggravated existing inequalities in terms of the division between public sector care and private-sector care, and the concentration of the latter in the largest regional centers: Temuco in Araucanía and Santiago in the Metropolitan Region. This situation exposed the underlying problems not only of socioeconomic differentiation, whereby higher income groups access private care, but also the rural–urban divisions and the relative lack of healthcare in rural municipal areas. Even in the public health system, there is considerable variability in terms of specialists in Santiago compared with other regions in the country. In the face of the need for specialist care and equipment, the high levels of centralization in Chile, based on Santiago, were further exposed [128].
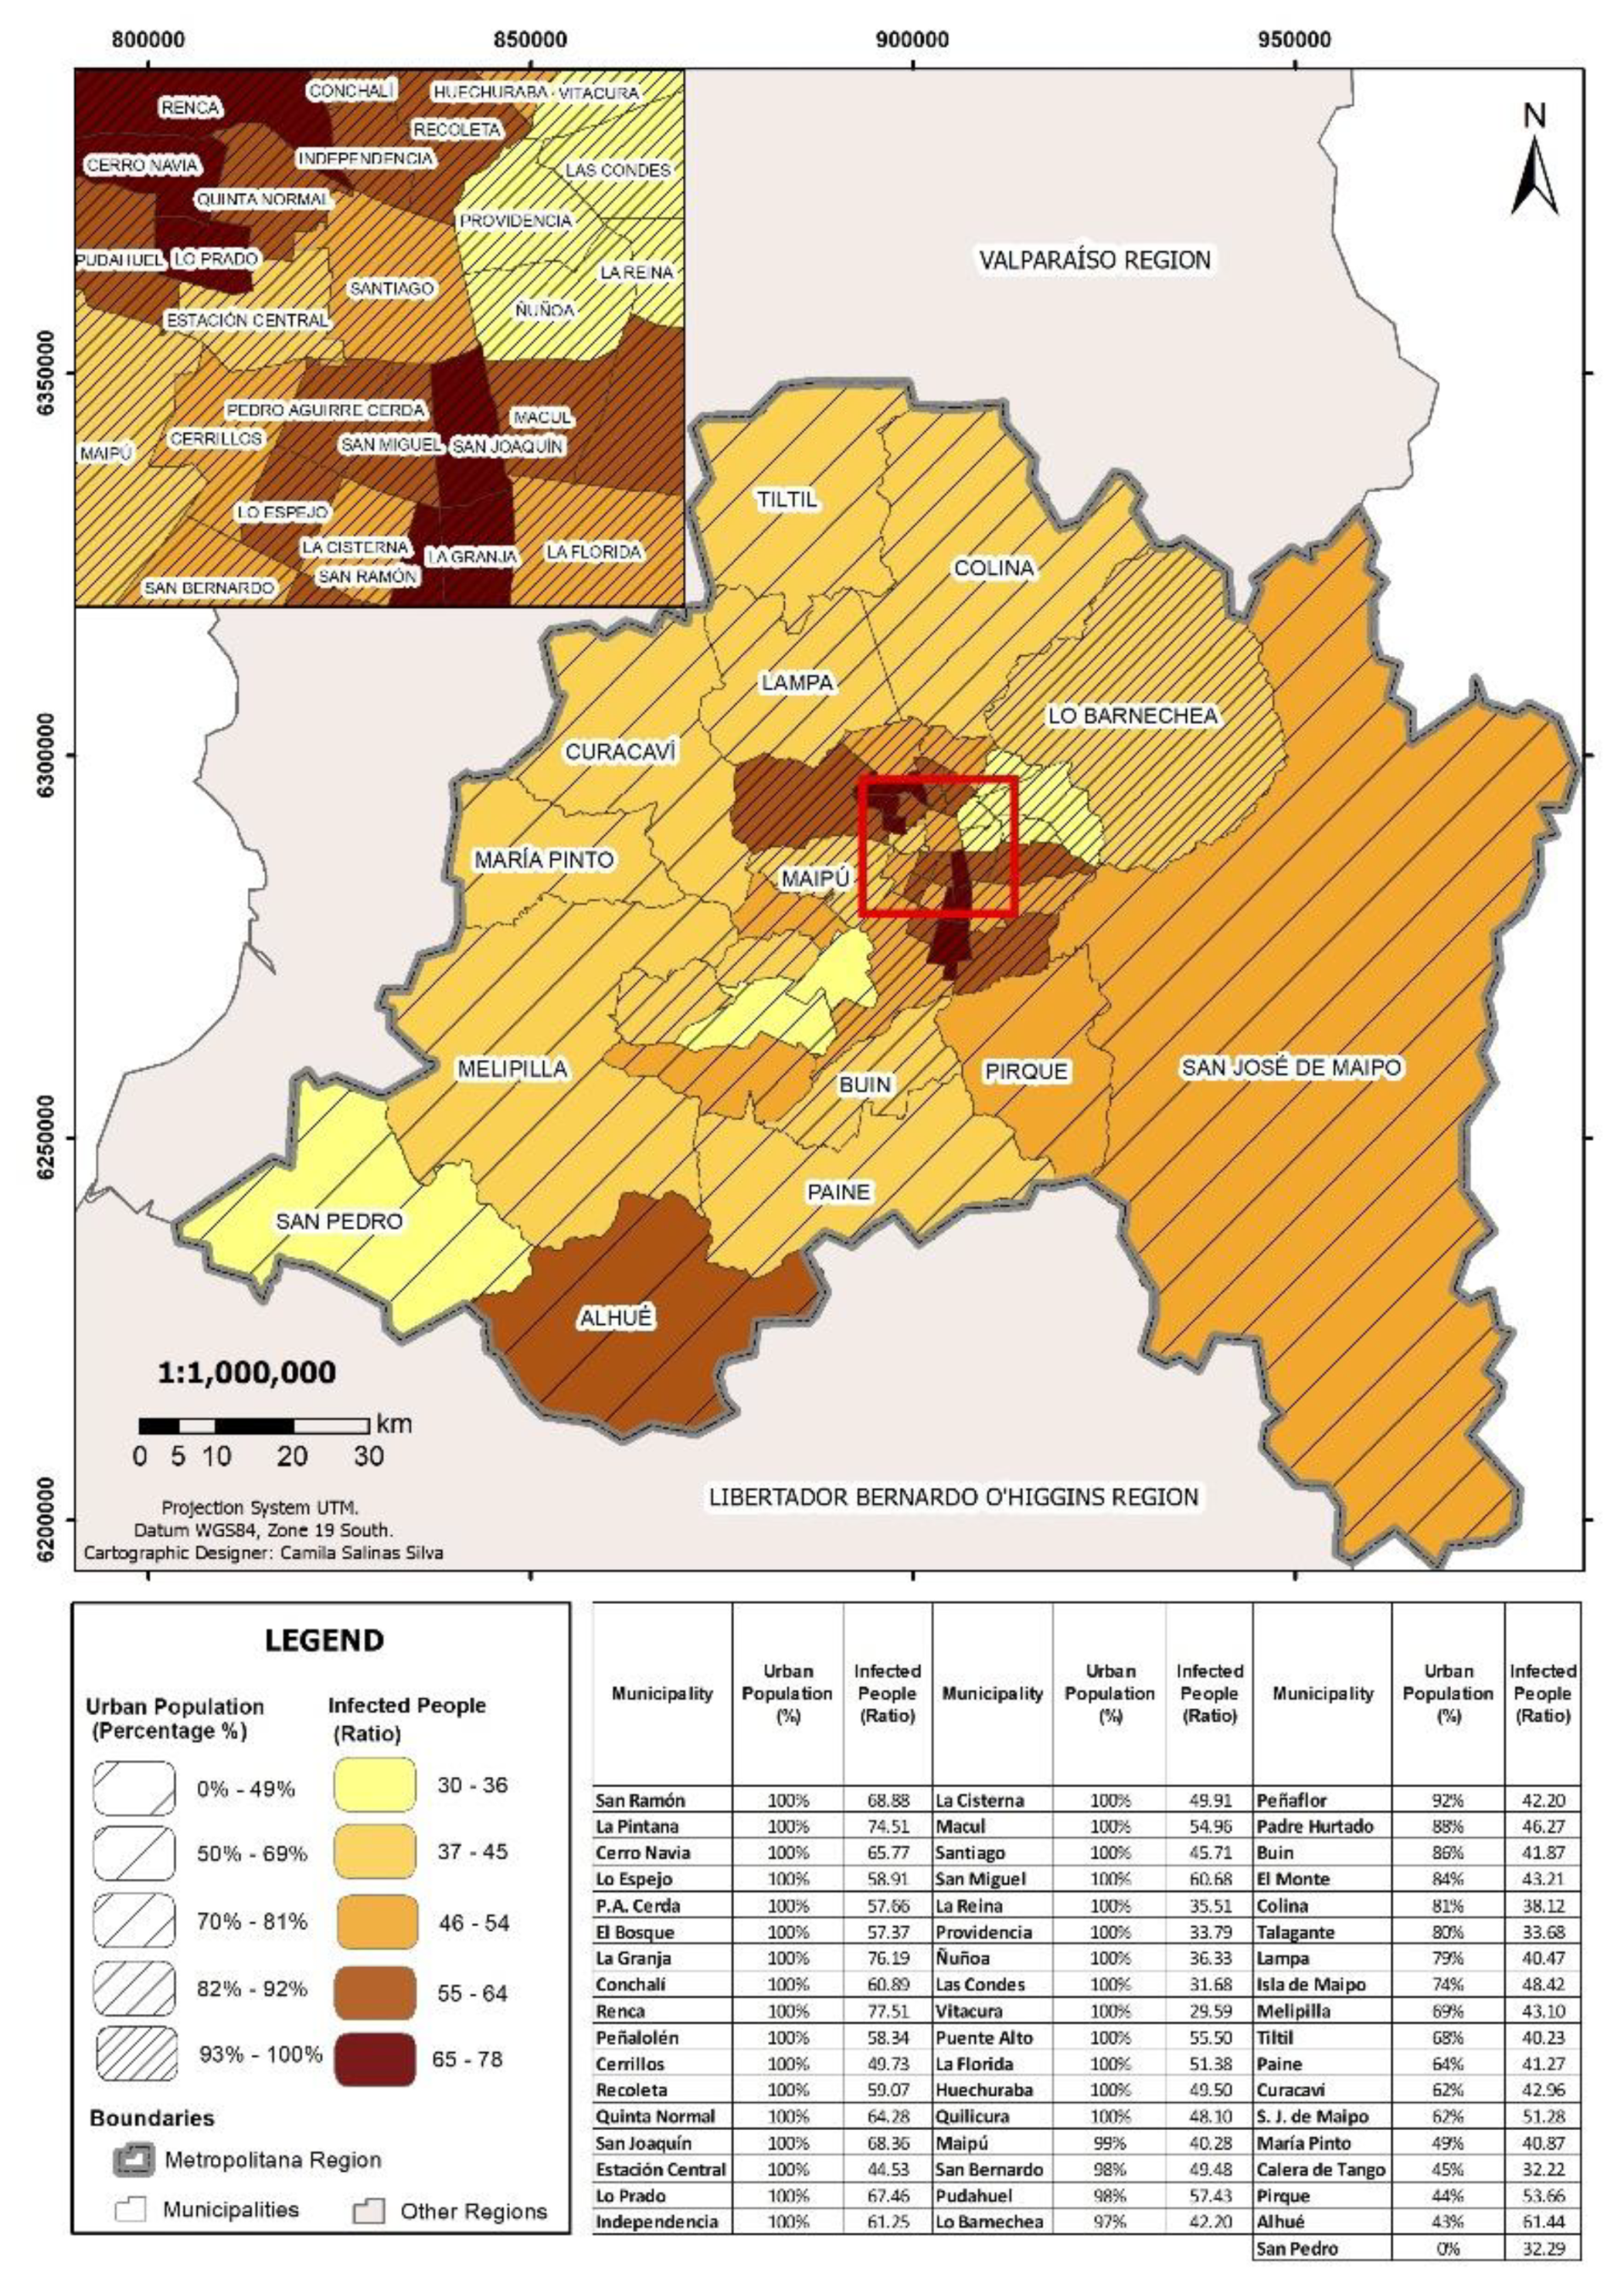
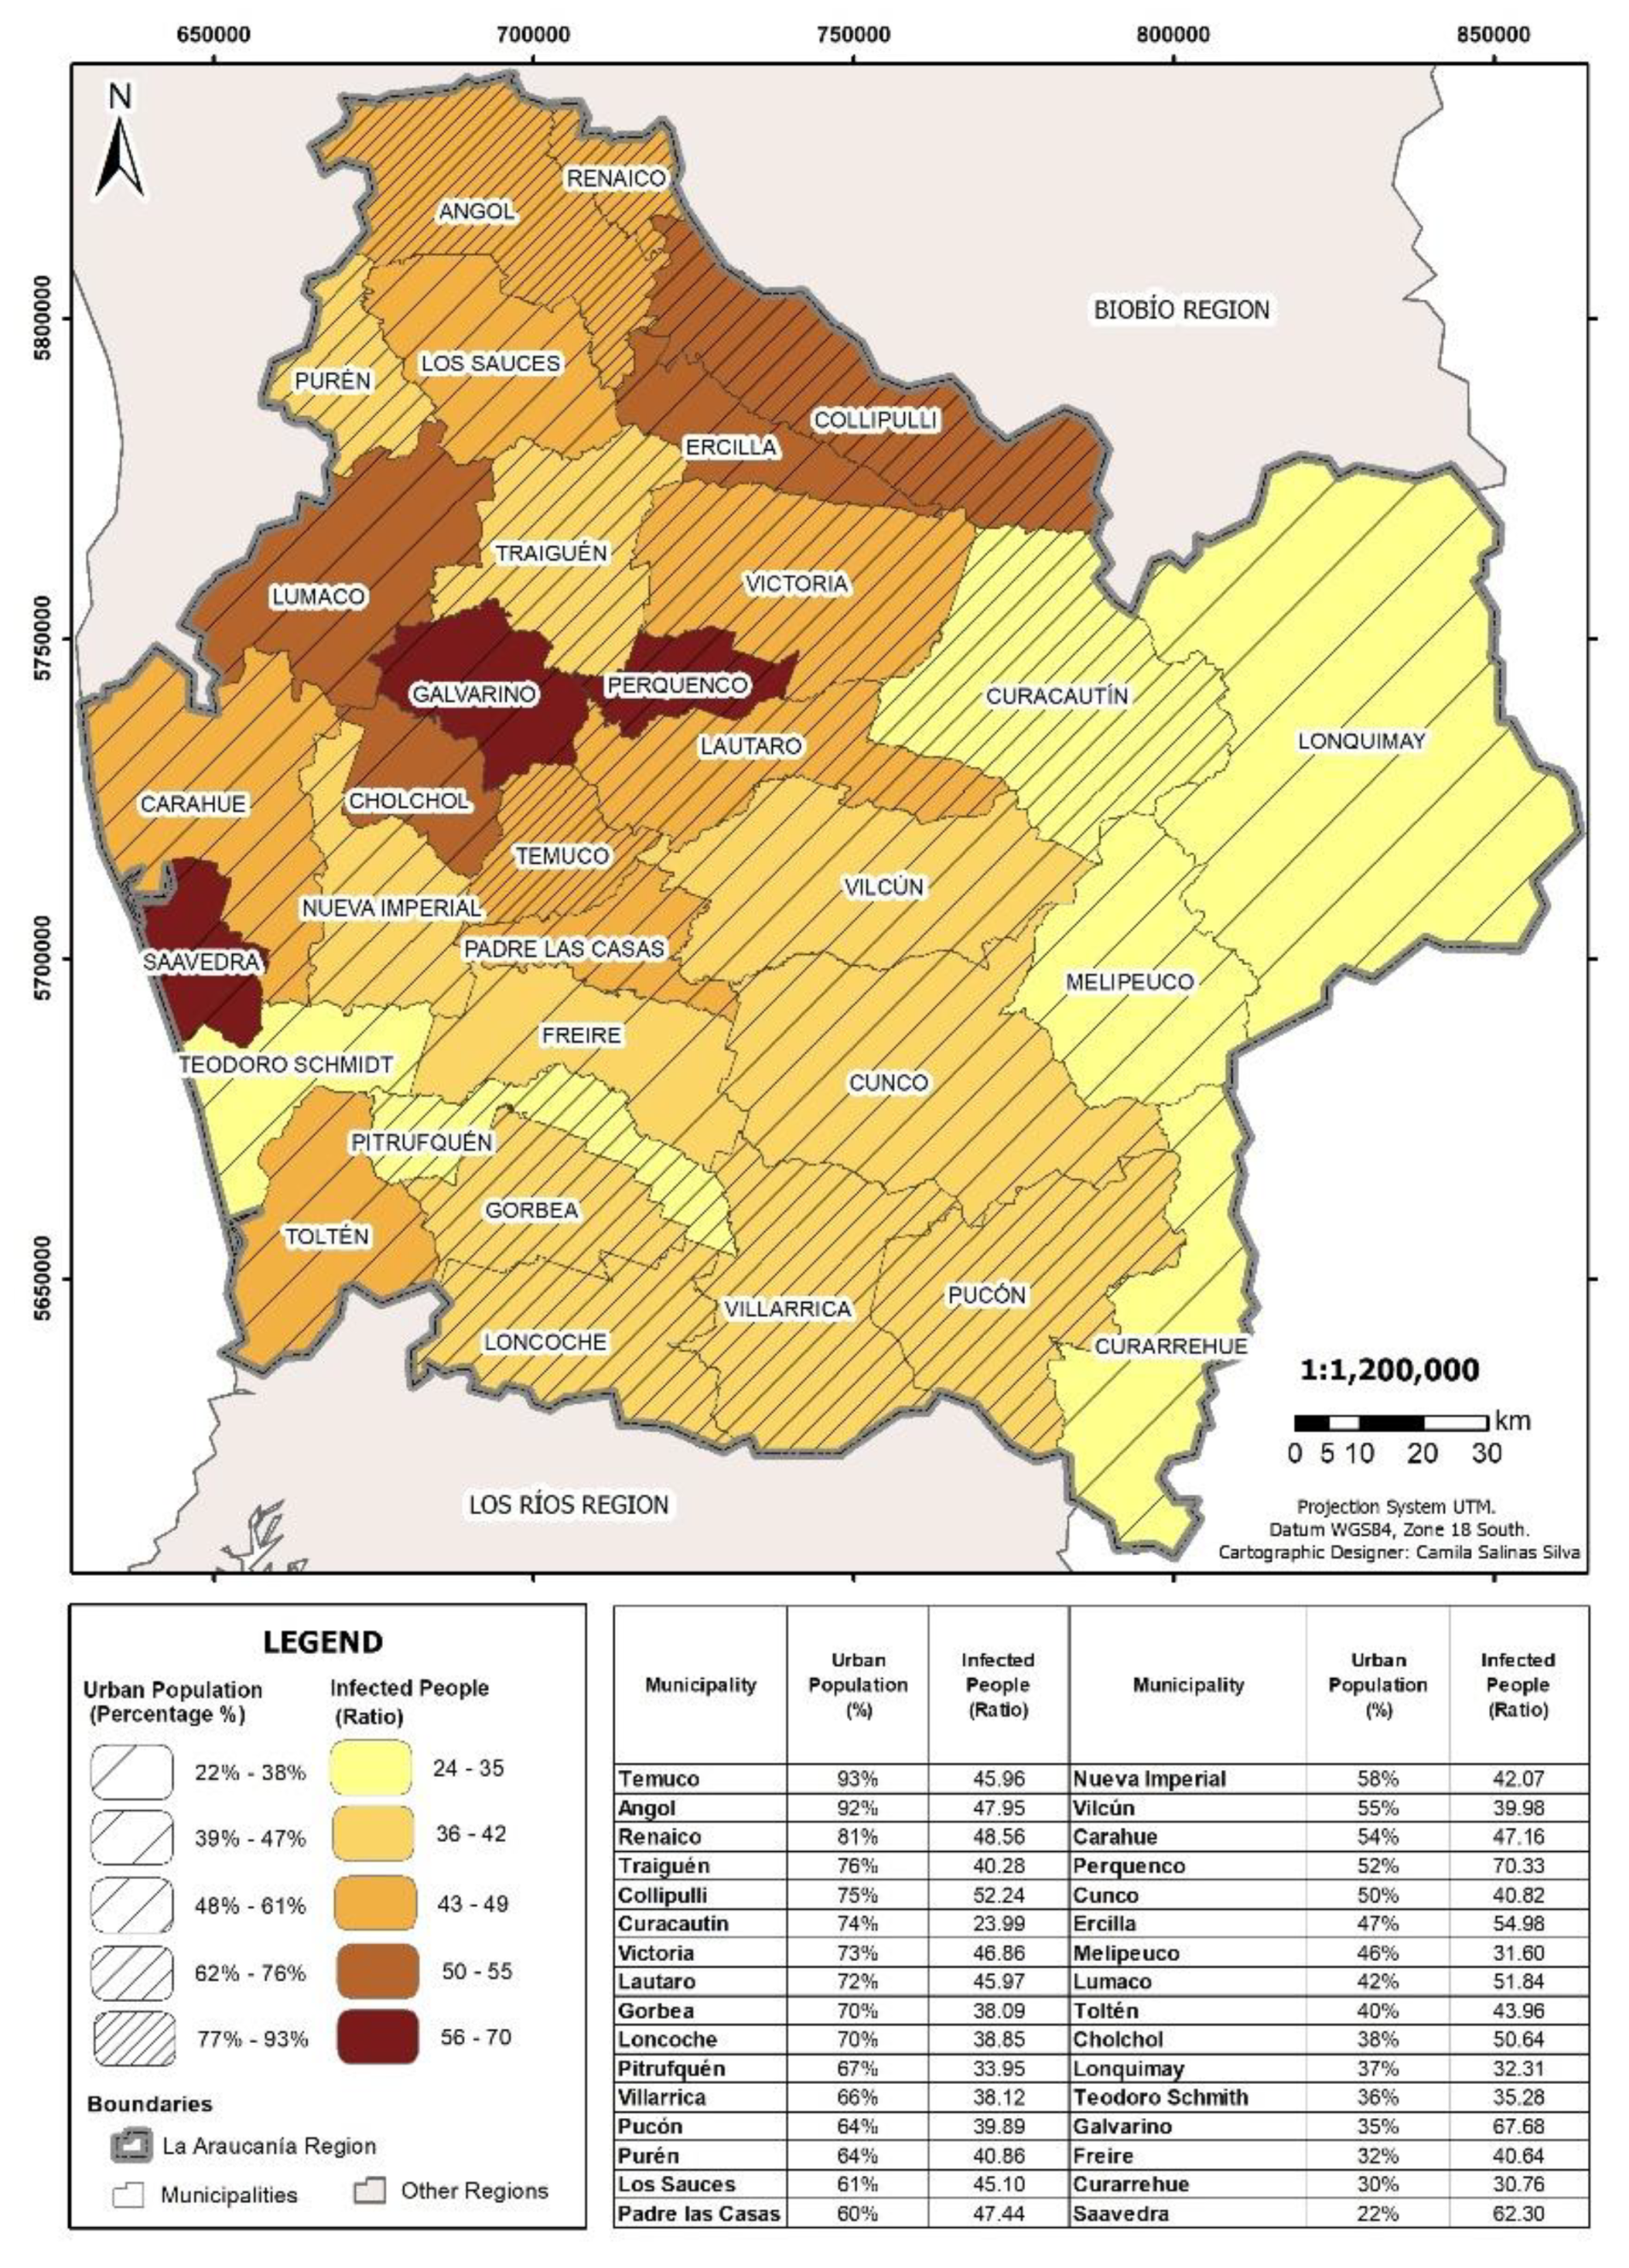
In the RMS, infections were concentrated in urban areas, unlike in Alhué and Pirque, which only had 61.44 and 53.66 infections per 1000 inhabitants. In Araucanía, on the other hand, the most affected areas have been municipalities with a high concentration of rural areas. As of 5 March 2021, the four most affected municipalities in terms of the ratio of infected persons were Perquenco (48% rurality), Galvarino (65% rurality), Saavedra (78% rurality), and Ercilla (53% rurality). However, it may be the case that these infections were concentrated in the urban areas of each of these municipalities. Municipalities with over 80% urban population, such as Angol, Temuco, and Renaico, remained above average, (with a minimal difference between them: 48.56, 47.95, and 45.96 for Renaico, Angol, and Temuco, respectively). Others ranged from 70.33 (Perquenco 52% urban population) to 23.99 (Curacautín 74% urban population).
Comparing both regions, the extent of the ranges was similar, although in the RMS the values remained above those of Araucanía (see Table 3). In the former, although the highest values were generally maintained in urban areas, the lowest infection rates were in the higher-income municipalities of the eastern sector, providing a contrast with the municipalities of the central-southern and north-western sectors of the city (see Figure 11). In the Araucanía Region, the geographically more distant areas (eastern sector) had the fewest infections (see Figure 12).
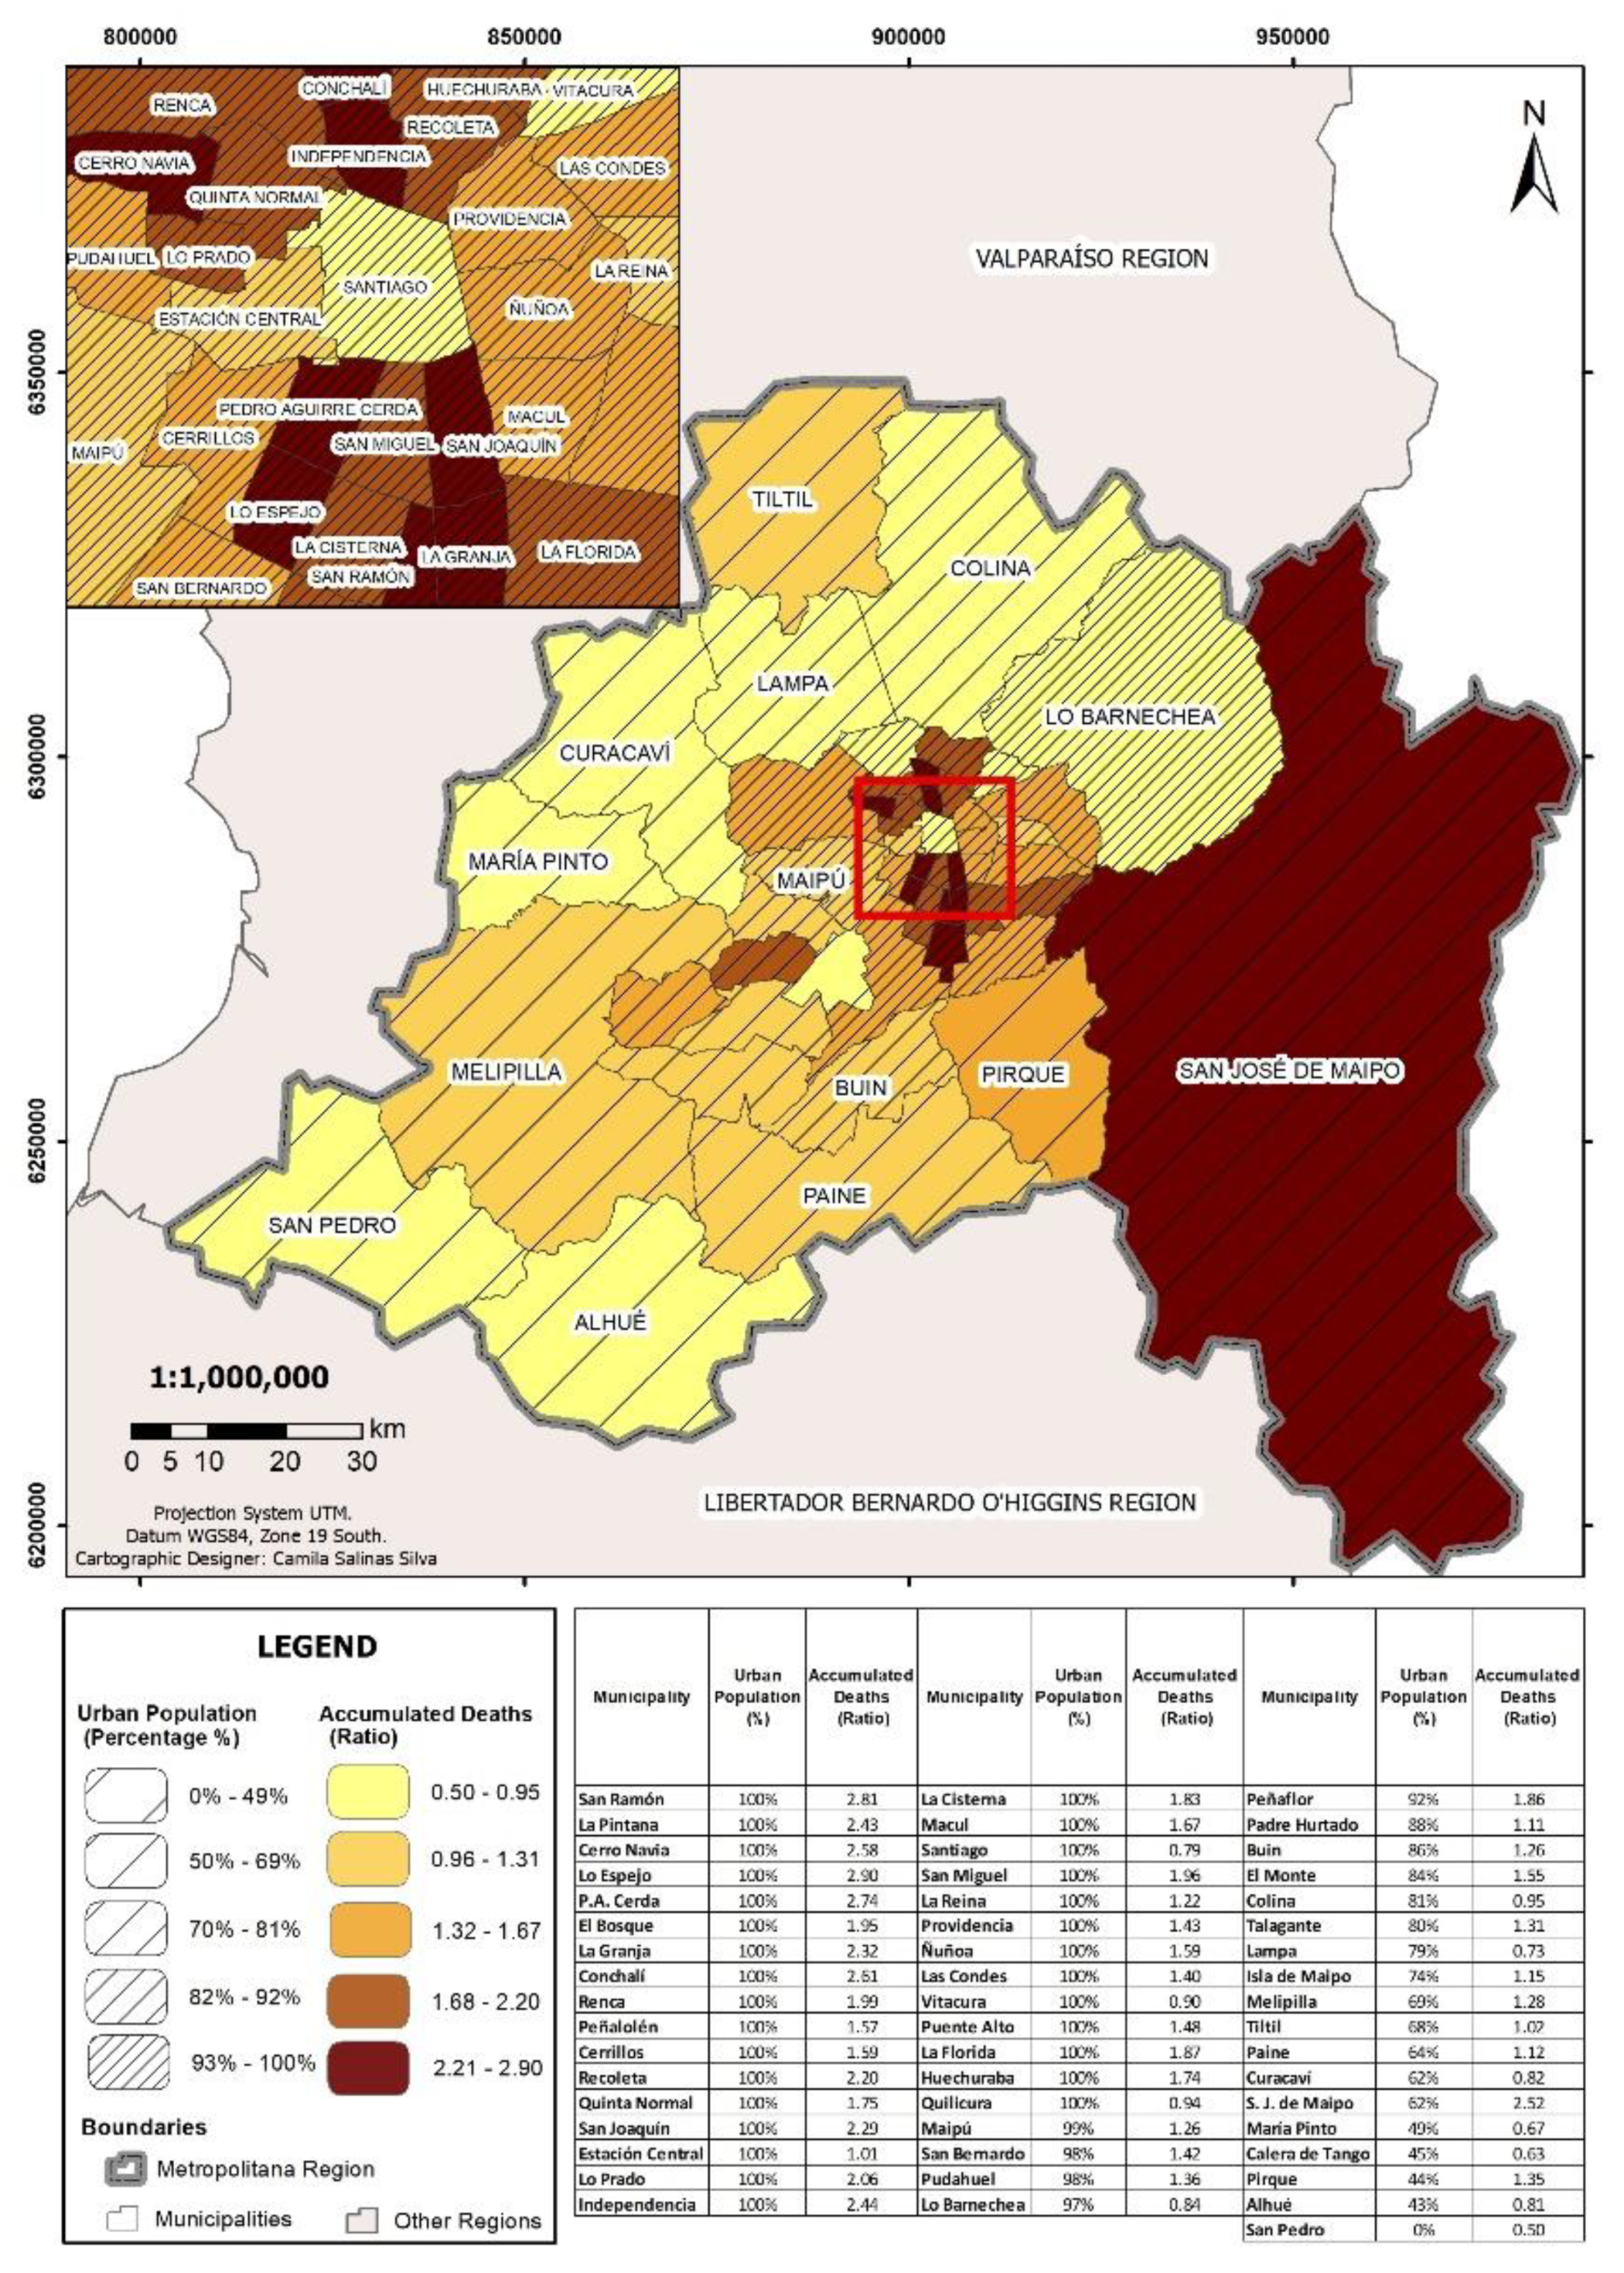
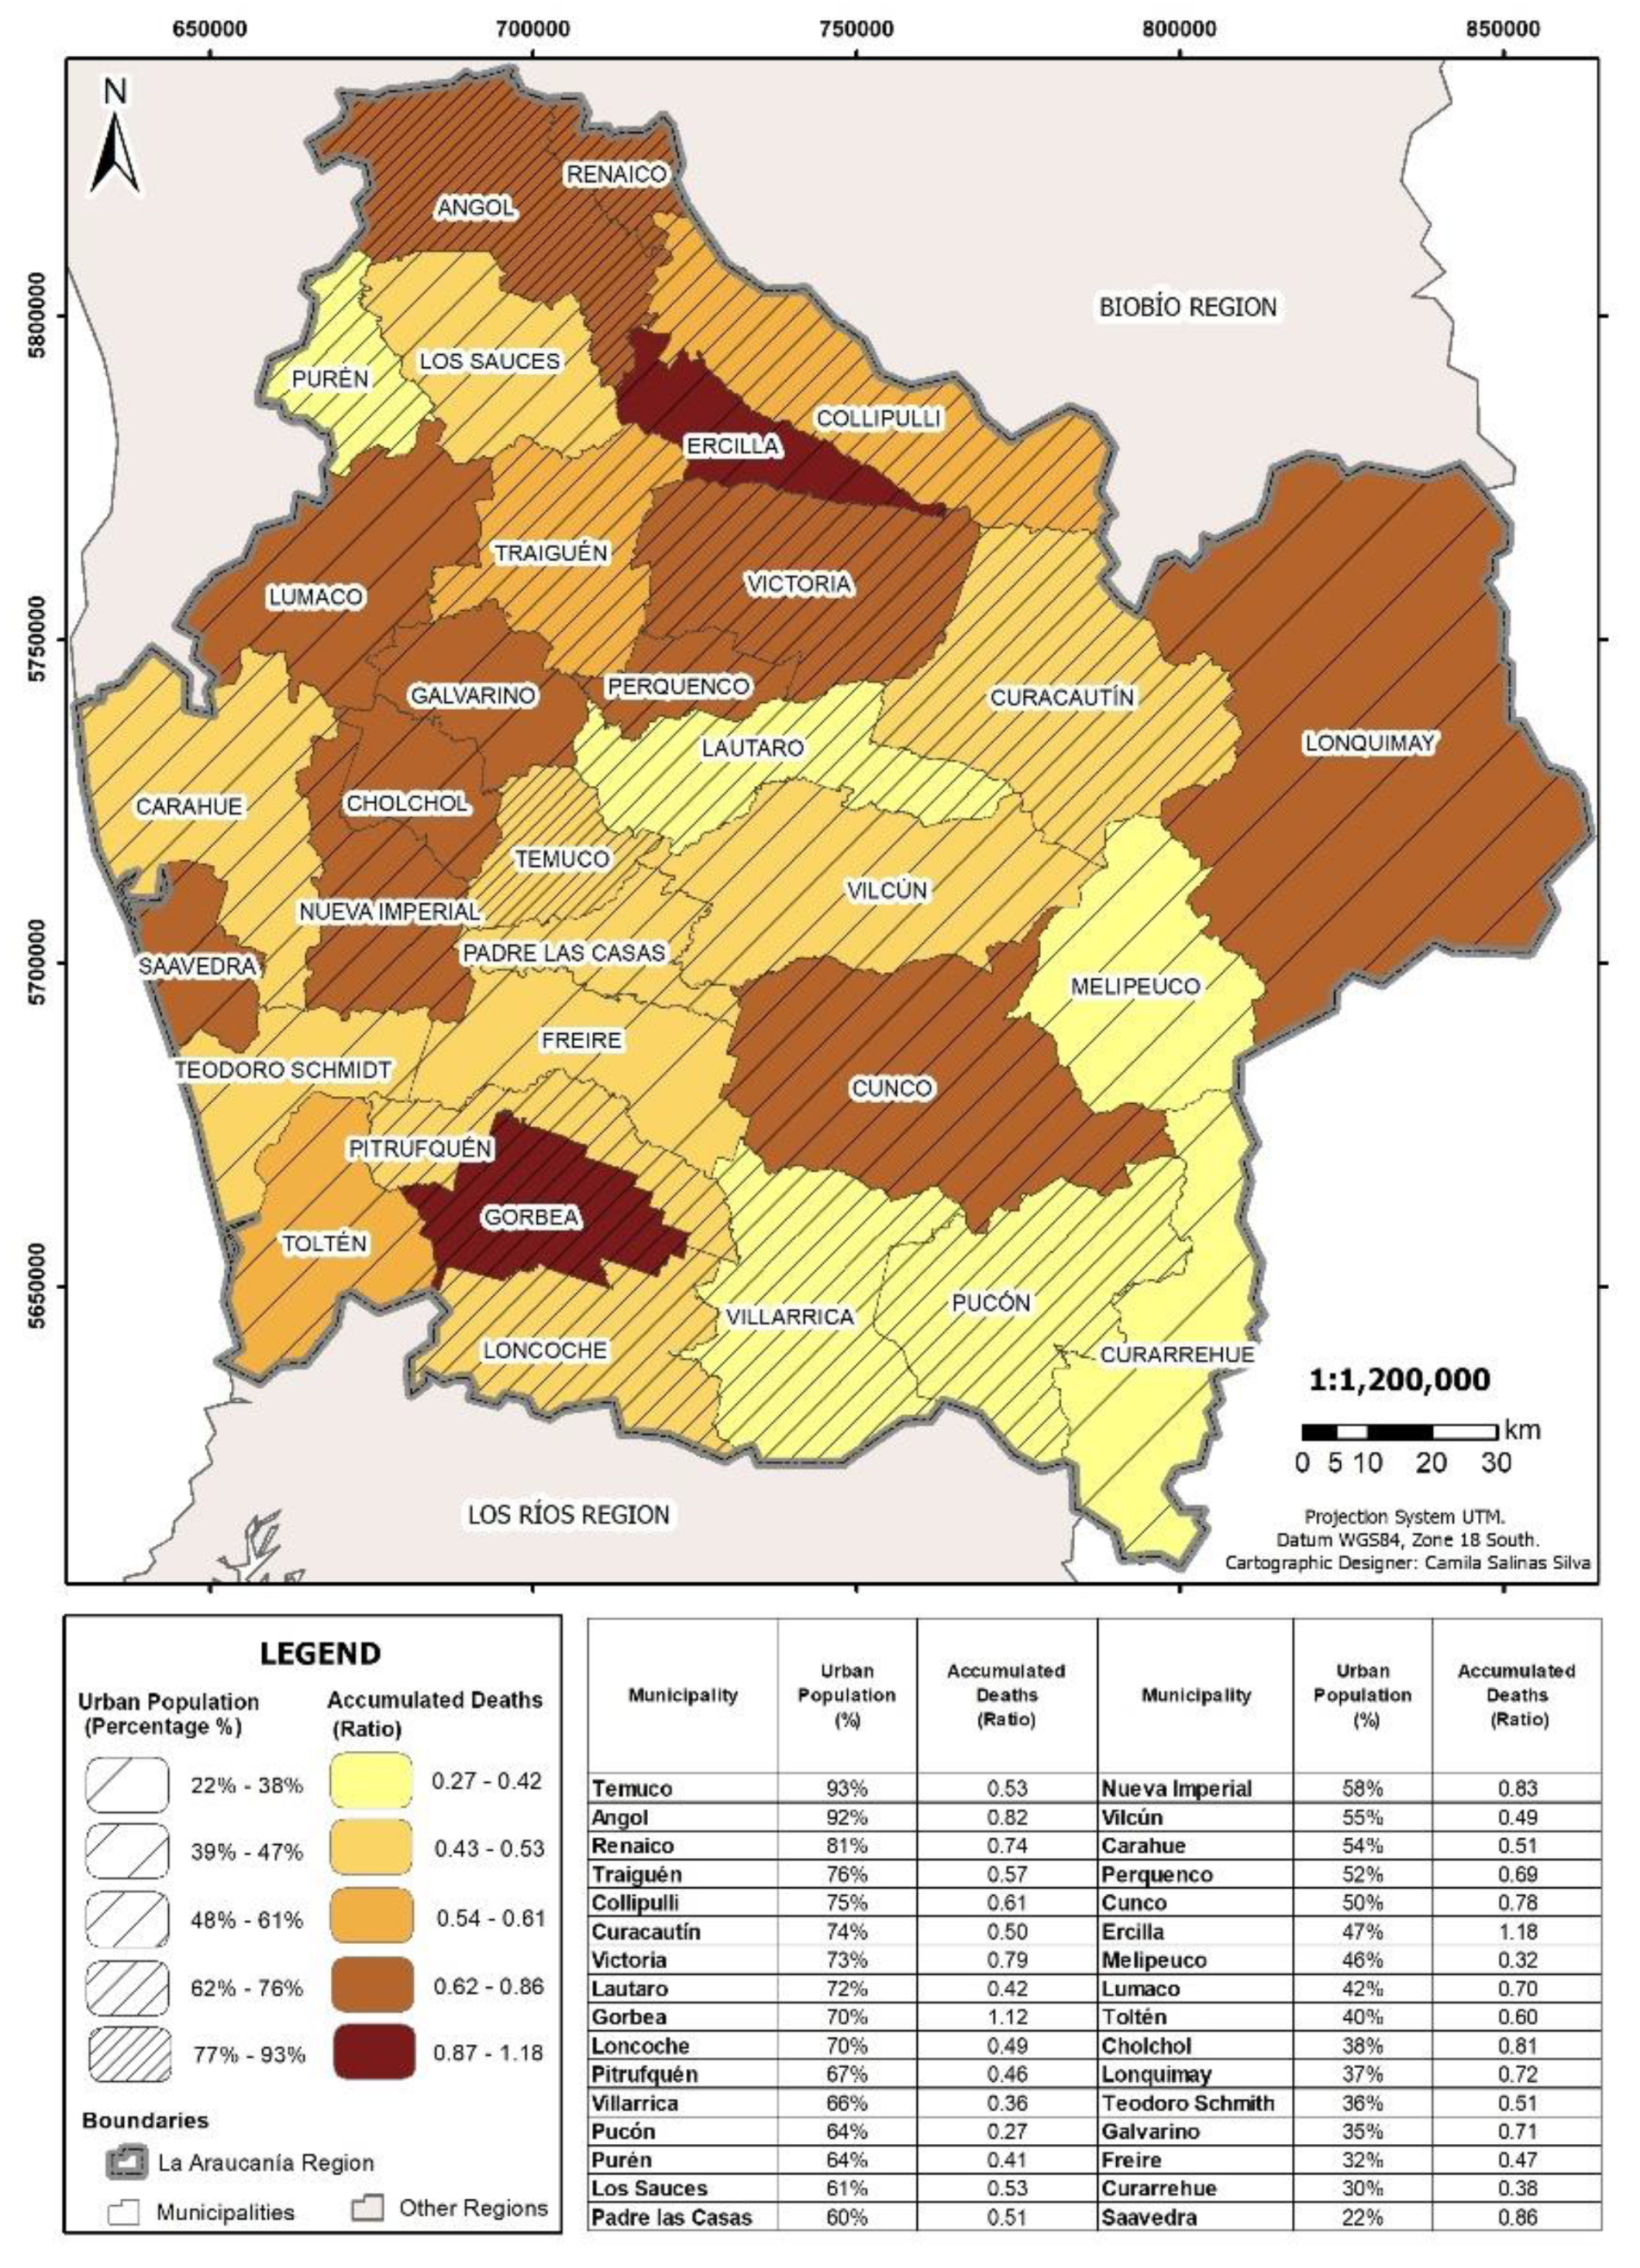
The regional mortality data for the RMS compared to Araucanía show that it had higher rates. If we compare the data at the global level, the RMS is at a similar value to Spain, while the most affected municipalities are above the highest rates of the Czech Republic, Belgium, Slovenia, and the United Kingdom (between 1.8 and 2.1 deaths per 1000 inhabitants, see Statista [130]). These municipalities are almost 100% urban (except for San José de Maipo with 62%). Lo Espejo, San Ramón, Pedro Aguirre Cerda, Conchalí, Cerro Navia, Independencia, La Pintana, La Granja, San Joaquín, and Recoleta have rates of between 2.9 and 2.2 deaths per 1000 inhabitants respectively, which far exceed the experience in the Araucanía Region (see Figure 13 and Figure 14). In the Araucanía Region, mortality on average represented approximately 40% of the RMS and one-third of the deviation (see Table 3). The most affected cities, equal to or above 70% urban population, were Gorbea, Angol, Victoria, and Renaico, which are quite distant from each other, except for Angol-Renaico (see Figure 14). The north-central sector, with the exception of Purén, had the highest rates with the exception of Guerbea, Cunco, and Lonquimay.
In terms of resilience to the pandemic, the advantages of more rural locations due to reduced contact compared with high-density living and public transport systems (such as the metro and bus systems in Santiago) are offset by the distances and access to healthcare in the larger urban municipalities where equipment is available. Rather than the pandemic being a risk that is particular in and of itself, generating a new series of threats and institutional response challenges, it is more the case that it reinforces existing inequalities and exposes vulnerabilities. The pandemic created a divide in terms of adaptive capacities, between those who could work from home, and those who had no option other than to work outside home when quarantine allowed (and often in disregard of this limitation). Adaptive capacities in this case refer to the same adaptive capacities associated with poverty, such as the need to access informal sector activities such as street-selling, or to formal activities such as delivery services. The concentration of symptomatic infections that required hospitalization among older age groups meant that the health impacts were concentrated in this group while many other age groups were affected by formal unemployment and the need to access more informal employment opportunities. Since agricultural activities remained active throughout, rural communities retained their access to income in many cases; however, the urban poor, often involved in more precarious employment in retail and services, were affected more significantly.
In conclusion, the pandemic has had two associated risks: the first to health, the second to economic survival. Each of these has different geographies, in terms of rural–urban differentiations, and in terms of intra-urban dynamics (e.g., ‘home work’ versus essential services/’exposed work’). Each of these risks exacerbates the underlying vulnerabilities in each region, whether it be intra-urban inequalities and economic security in the Santiago Metropolitan Region, or poor coverage and access to healthcare in rural municipalities of the Araucanía Region. Consequently, the risks of the pandemic are not separate from local and regional development considerations that are well-known and can be seen in the data from earlier sections. The response to the pandemic, in terms of access to healthcare and access to employment, are structural problems embedded in the Chilean socio-economic system and with different features in different municipalities and regions. For this reason, the ‘disturbance’ of the pandemic, as an episodic risk, should not be understood as a health risk per se, or siloed as such, but rather as a systemic risk since it aggravates existing socio-spatial inequalities. Regional resilience to the pandemic is not simply a response of health provision, but also of private versus public healthcare, and of the vulnerabilities of unemployment, underemployment, and the large informal sector in both low-income urban areas, as well as in rural activities.

6.2. The 2010 Earthquake

The earthquake of 27 February 2010 was the eighth most intense ever recorded, with a magnitude of 8.8 Mw. According to the Seismological Service of Chile, the epicenter was just off the coast of the current Ñuble Region (formerly Biobío Region). The experience of the impact of the earthquake, and subsequent tsunami and aftershocks, extended from the Region of Valparaiso to the Region of Araucanía covering between 600 and 800 km from north to south. The event affected 74% of the population of Chile and resulted in 525 deaths and 800,000 people affected by displacement or damage to housing [131,132,133,134]. Of the total number of deaths, a large number were recorded among the elderly: 22.64 (80+), 7.74 (70–79), 5.53 (60–69), and 3.66 (29–50) deaths per 100 thousand inhabitants respectively [135]. The number of deaths in the Metropolitan and Araucanía regions was very low compared to the regions closer to the epicenter and the tsunami (1.49 and 0.75 per 100,000 inhabitants, compared with 26.75 in the Maule Region, and 7.03 and 6.40 in the Biobío and O’Higgins regions [135]. Most of the deaths were linked to the tsunami and errors in the institutional warning systems of the Navy and the National Emergency Office (ONEMI) [136]. Financial losses were experienced across different sectors. Among these, the fishing and tourism sectors stand out: US$ 5.3 billion million (linked to private activities); US$ 3.9 million in housing (mostly linked to the public sector); and US$ 3.0 billion in education (public and private sector). On 21 May 2010, President Sebastián Piñera reported that the losses had reached US$30 billion, 18% of GDP [134,137].
In the Metropolitan and Araucanía regions, the overall impact was significantly lower compared to the most affected regions. The damage was concentrated on road infrastructure, hospitals and educational infrastructure, the availability of drinking water (especially in rural areas), and electricity supply. In particular, the Metropolitan Region was affected by damage to historical buildings, such as Divina Providencia, the Museum of Contemporary Art and the Equestrian Club [138]. The Felix Bulnes hospital located in the municipality of Quinta Normal was the most affected public building, losing 450 beds, evacuating 217 patients, and later requiring new infrastructure works [139,140]. A total of five hospitals were affected, which led to the construction of two emergency hospitals in the lower-income municipalities of Puente Alto and Cerro Navia, with a total of 50 beds [132]. There were 46 deaths and 9.391 other people were directly affected [135]. The municipalities that were most impacted in terms of the percentage of homes damaged, were Macul, Conchalí, Huechuraba, Quinta Normal, Renca, and San Joaquín, where older homes built of adobe were most susceptible [141].
The number of people affected in the Araucanía Region amounted to 3.338, with Angol (to the north of the region, closer to the epicenter) concentrating most of the impacts. In Angol, the local population was without water and electricity for two days and damage to the hospital led to a loss of 195 beds [131,138]. In total, 13 deaths were recorded in this region and a total of 12 public buildings experienced major damage. This situation led to it being one of the most affected regions in terms of health infrastructure damage, alongside the Biobío Region [132]. The most important hospital in the region, located in Temuco (with more than 90% of the Araucanía Sur healthcare network beds) had to reduce its capacity from 704 to 302 beds [131,142]. Considering both healthcare networks, Araucanía Sur and Norte bed losses totaled 615, which represented 15% of the total reduction nationwide.
Both the Metropolitan Region and the Araucanía Region were also heavily impacted in terms of rural drinking water systems. Unlike centralized water systems, rural drinking water supply systems in the Araucanía Region accounted for 53% (51% in the Metropolitan Region) of damaged infrastructures. This directly affected 31.092 people in the Araucania Region and 84.456 in the Metropolitan Region [131]. This total of 115.448 affected consumers between both regions (73% Metropolitan and 27% Araucanía) reveals the high level of vulnerability of rural communities who rely on these self-managed Rural Potable Water systems, which are effectively common property systems but with severe problems of financing and efficiency.
In the case of a major episodic event such as this particular earthquake and its related tsunami, the epicenter has significant implications in terms of the most severe impacts. However, in the case of the regional resilience in the two selected regions, the direct earthquake impacts were principally related to damage to older housing stock (in lower-income municipalities) and to water supply from rural drinking water systems (many of them also antiquated and poorly maintained). Regional resilience with respect to this type of major event was clearly better for higher-income areas with more modern housing stock and infrastructure. The vulnerability of communities and the lack of adaptive capacities, in this case, were related to poor infrastructure, both in urban and rural settings.
While this particular hazard impacted different elements of the regional landscape, in comparison with the pandemic (health facilities and economic activity), such as housing and services infrastructure, they both share the comparative vulnerability of the health system: the former (Covid-19) in terms of capacity and quality, and, in the latter (earthquake), the physical infrastructure itself. The conclusions that can be drawn from the 2010 earthquake in terms of local and regional resilience is that significant inequalities in terms of age, materiality, and maintenance of infrastructure were the principal factors that came to light. In this respect, community adaptive capacities are not only limited to the capabilities of the people themselves, but also include more significant community or public investments in resilient infrastructure (the ‘territorial capital’ defined by Fratesi and Perucca). With an increasing gap between the quality and modernity of private versus public infrastructure and services (most evident in a comparison between the Araucanía and Metropolitan regions), and also between rural and urban facilities (in both regions), the need for regional development to ensure good coverage and quality of basic infrastructure for health, education, mobility, and housing becomes increasingly evident for improved resilience.

6.3. Climate Change

The diversity of Chile’s ‘crazy geography’ [143], stretching from the Atacama Desert to Antarctica, and from the Andes mountain range to one of the longest national coastlines, and extending to Rapa Nui (Easter Island), has generated a wide range of possible impacts from climate change. The CONAMA report of 2006 identified these clearly by region, and they formed the basis of the National Action Plan of 2008–12 [144], including an assessment of the economic impacts [145]. However, the vulnerability of the country had already been determined in one of the earliest assessments following the signing of the UN Framework Convention on Climate Change. The 1996 National Climate Change Committee report noted that the country met 7 of 9 vulnerability criteria of Article 4.8 of the Convention [146], including drought, intense storm events, sea level rise, loss of glaciers, and forest fires. Twenty-five years later, has this vulnerability been reduced? Two major events—one incremental, the other episodic—point to the answer: Chile is experiencing a decade-long ‘mega-drought’ [147], while many thousands of acres were lost to forest fires in 2017, and many properties were also consumed by the flames, including the whole town of Santa Olga with over 500 houses [148].
The vulnerability has increased in spite of outlines for action in two national adaptation plans (2013 and 2017), linked to a series of sectoral adaptation plans (e.g., fisheries, biodiversity, agriculture, water resources). The Nationally Determined Contribution of 2015, following the Paris Agreement [149], was weak on adaptation in comparison with mitigation, but pointed to this persisting problem and the need to strengthen the implementation and evaluation of these sectoral plans. Nevertheless, during the period 1996–2019 (including the last COP meeting in December 2019, hosted by Chile, but which took place in Madrid), the conclusion is that progress in adaptation has been slow. Adaption has focused on protecting productive sectors from climate change principally, but there has been little or no wider consciousness-raising or integration into planning instruments and urban development activities; for example, the sectoral plan for cities, approved in early 2018, has yet to be implemented.
Since 90% of Chileans live in towns and cities, this gap between identifying criteria or conditions of vulnerability, and the actions required to reduce this vulnerability and build resilience is highly relevant. This is not to suggest there are no initiatives, but that they are fragmented and have received little national financial support. They include the work of the NGO AdaptChile in the creation of the Municipal Network for Climate Change, the Santiago Metropolitan Region Strategy Santiago Humano y Resiliente of 2017, and the creation of Regional Climate Change Councils (CORECC) in 2018. The diversity of impacts by region leads to wide-ranging risks and the need for localized responses, hence the importance of the Municipal Network and the work of the new regional councils.
The RMS and Araucanía regions present highly contrasting experiences, but in both cases there is currently no regional strategy being implemented. While Araucanía has no strategy, the RMS has had two strategies that have been developed and not implemented: The Climate Adaptation Santiago (CAS) adaptation plan in 2014 [150], and the Rockefeller Foundation-funded Santiago Humano y Resiliente (Human and Resilient Santiago) in 2017 (the latter lost impetus following a change of government in 2018). This lack of implementation of a strategy does not mean that different measures have not taken place, such as increasing the number of water storage sites in rural areas or campaigns for reducing water use. However, it does suggest a lack of integrated planning for climate change [151].
The Metropolitan Region, with its high number of urban municipalities (34) relative to rural ones (18) has been particularly concerned with urban water supply and the long-term effects of the heat island effect and the prolonged number of days over 30 °C in summer. However, the 18 rural municipalities, grouped under AMUR (Association for Rural Municipalities) have struggled with water deficits in the context of the mega-drought, but also due to competing demands between agriculture and urban expansion with consequent new demands for groundwater extraction for residential supply, and industrial installations moving to the urban periphery [152]. There is a contrast between urban water systems, provided by a small number of water companies (Aguas Andinas being the principal provider), and rural demand, which is met by individual boreholes or cooperative, community Rural Potable Water systems [153]. With rights to access surface water suspended due to decreasing availability, the reliance on groundwater (and falling water tables) has increased the gap between water security in urban versus rural areas. In terms of resilience, the connection to a mains water system, with a subsidy available for the lowest income households [154], ensures access to this basic need. However, rural livelihoods have become more precarious due to the constant need to bore deeper for water, or simply boreholes drying up and requiring emergency supply from municipal or private water tankers [155]. If resilience through adaptive capacity is understood as guaranteed access to basic needs, the rising gap between urban and rural access to water reveals that regional resilience is also a function of uneven intraregional development.
The same conditions apply in Araucanía, but with a different distribution of vulnerabilities given the relatively larger rural population in comparison with urban areas in this region. Despite having relatively high precipitation levels in national terms, Araucanía has also been seriously affected by the mega-drought, which has been compounded by other water demands. As a region with one of the highest number of Rural Potable Water systems, the effects of climate change are experienced when boreholes run dry and have to be deepened. There are also other factors that influence the loss of groundwater, however, such as the widespread plantation forestry in the region, with exotic species that generate considerable water demand, such as eucalyptus and Oregon pine. Where urban settlements have centralized water supplies and security of supply as a consequence, the decentralized systems are increasingly vulnerable to climate change and to a lack of community investment in their maintenance (or to afford deeper boreholes). Despite the fact that there is considerably more precipitation in the Araucanía Region in comparison with the Metropolitan Region, water insecurity as a consequence of climate change (and other intensive uses) is greater for communities in Araucanía where more people are dependent on these self-managed rural systems [153,155]. The localities most affected are indigenous communities, which are also subject to climate change-driven extreme events, such as the ‘white earthquakes’ (a local reference to severe snowstorms) which can isolate communities for several days at a time [156].
The case of climate change, and water (in)security in particular, is very much one of regional resilience divided between centralized, but high-cost urban systems and fragile decentralized systems. Climate change does not affect all socio-economic groups equally. The costs of water supply rise with scarcity in centralized systems, while rural water rights owners have to find their supply at deeper levels (thus increasing their costs). However, the principal difference is that rural communities rely on water not only for personal use but also for crops and animals. This difference in water security between rural and urban areas, and who bears the costs of climate change, provides an example of a risk that is incremental (drought) as well as episodic (flood events and ‘white earthquakes’). However, although climate change is the driver of this insecurity and associated costs, it should not be taken in isolation. The fragility of rural potable water systems has been documented for decades. Climate change merely exacerbates this vulnerability and exposes the underlying differences that have emerged in Chile in its rush to urbanization over the past fifty years.
Regional development has been marked by these urban poles of modernization and ‘development’ while rural areas have become either dominated by agribusiness firms (which have accumulated water rights), or have become marginal spaces, with ageing farmers supplying principally horticulture products to urban markets. The resilience of both regions is marked by urban–rural inequalities that are exacerbated by different risks but are not a consequence of one in particular. It is precisely due to the combination of risks in play, rather than a focus on singular risks that a better understanding of how communities in specific localities juggle different hazards and risks, whether incremental or episodic, exogenous or endogenous.

7. Conclusions: Risk as Immanent, Resilience as Adaptive Capacity, and Transformation as Sustainable Local Development

The recent focus on resilience in socio-ecological systems has arisen in line with concerns for climate change and wider issues of planetary boundaries. However, this resilience literature with its more ecological roots tends to focus on system dynamics with less attention to agency. Since regional development involves socio-ecological systems and dynamics, socio-economic dimensions, and institutional issues, a focus on system dynamics is useful only in terms of how the agency of development, i.e., governance, shapes these multi-scalar systems in terms of localities and regions. Rather than the promotion of local and regional resilience, the objective has to be normative: planning for sustainable development, in which resilience refers to the obstacles and opportunities generated by a wide range of risks emerging from different sources over time (see Figure 2, Figure 3, Figure 4, Figure 5, Figure 6, Figure 7, Figure 8, Figure 9, Figure 10 and Figure 11).
When development capabilities are framed within the context of socio-ecological system dynamics, the term local sustainable development is appropriate. This connection is important since adaptive capacities have to be understood in terms of cultural and institutional contexts, shaping perceptions and consequent actions [10,39,40,41]. This in turn removes the discussion of risks and resilience from the realm of socio-ecological systems and technical solutions, to the realm of justice and (in)equality across communities and institutions, and the ways in which local sustainable development is generated, strengthened, or weakened [11,28]. Although they have not been highlighted in this article, there is a wide diversity of community initiatives to confront multiple risks. However, the emphasis here is on aggregated socio-spatial differentiation at municipal and regional levels. It is most likely that the scaling-up of effective community-level adaptive capacities will provide opportunities for demonstration effect replication elsewhere, but it should also be stressed that these initiatives are generated despite structural inequalities. Consequently, the focus should not only be on community initiatives but also on changes to these underlying conditions of territorial capital, incorporating factors of economic activity.
Communities do not manage these risks in singular ways. Instead, they manage them synergistically, according to different time horizons, priorities, and available resources. Some are expected, while others appear with little or no awareness or preparation, as in the case of Covid-19. When the examples of climate change, the Covid-19 pandemic, and the 2010 earthquake are assessed in terms of their regional impacts, and local and regional resilience to them, the structural factors that shape resilience become more apparent. As with Sen’s ideas of development capabilities and entitlements, the question regarding resilience returns to the capacities and assets that a community can mobilize in the face of multiple risks that are immanent or latent. We have seen how different the impacts of different risks have been between the two regions. For the RMS, its large urban area makes it more complex and diverse in terms of the access opportunities of its inhabitants, e.g. to employment or health. The northwestern area of the region has been the most affected from a material point of view, as well as from the pandemic; this appears to be linked to the availability of both household and public institution resources. The experiences in these urban areas, however, are far removed from rural dynamics. In rural areas, the impacts of natural hazards are felt more strongly, as in the cases of drought and the damage to Rural Potable Water systems in 2010.
Despite the rural-urban imbalances, there are indicators that question (or affirm) community concerns over basic services, economic opportunities, and identity and cultural issues. For example, in the case of the municipality of Padre las Casas, although those in material poverty (multidimensional in this case) are heavily affected in terms of several health indicators, they have remained above the regional average. Belonging to a conurbation probably helps to augment resilience given this urban access to basic services. On the other hand, the more rural areas of eastern and western Araucanía have remained below the regional average of multidimensional poverty, with variable incomes and also Covid-19 infection and death rates. This implies that although there are trends that exhibit health fragilities due to multidimensional poverty, there are factors that require further research at the community level.
It is important to highlight the nuances of local sustainable development and the diversity that exists between and within these two regions. Municipal data in Araucanía that reveals a good performance within the region are weak when compared to the national level. This is also the case when the municipalities of the eastern sector of the RMS are compared with others in the region. This diversity suggests that high levels of socio-spatial inequality give rise to risks that are immanent, in the sense that the vulnerabilities of different communities are manifested by different threats and hazards. They are latent in the sense that they may be triggered at any time. Risks are, therefore, omnipresent and never singular. While one risk may be prioritized at one particular moment in time, and have greater connotations, such as the pandemic or the earthquake, these impacts are often subsumed with other structural vulnerabilities and deficits in adaptive capacities. The example of the fragility of rural potable water systems is one such example. Another is the general quality and access to healthcare (including the physical infrastructure of these facilities in the case of the 2010 earthquakes).
For regional resilience, understood as both highly differentiated at the local level—according to urban and rural, indigenous and non-indigenous, and other factors—to be strengthened, adaptive capacities have to be reinforced. These adaptive capacities are dependent on structural factors, including territorial capital and access to health and employment, and are linked to capacities and entitlements, such as education, training, and property rights. Consequently, the ability to manage multiple risks is dependent on these basic factors of development. Transformations to more sustainable development require increased resilience to diverse risks. These risks are not singular and cannot be addressed in silos. It is only through integrated understandings of development, livelihoods, and risks, and—in the case of Chile—direct engagement with inter-regional and intra-regional inequalities, that enhanced resilience for more sustainable development is likely to emerge.

Author Contributions

Conceptualization, J.R.B. and F.G.-A.; methodology, F.G.-A.; validation, F.G.-A.; formal analysis, J.R.B. and F.G.-A.; investigation, F.G.-A.; resources, J.R.B.; data curation, F.G.-A.; writing—original draft preparation, J.R.B., F.G.-A., M.E.U.; writing—review and editing, J.R.B., F.G.-A., M.E.U.; visualization, F.G.-A.; supervision, J.R.B.; project administration, J.R.B.; funding acquisition, J.R.B. All authors have read and agreed to the published version of the manuscript.

Funding

This research was funded by ANID Fondecyt Regular 1191239, Fondecyt de Iniciación 11200188, and CEDEUS (ANID/Fondap/15110020).

Institutional Review Board Statement

Not applicable.

Informed Consent Statement

Not applicable.

Data Availability Statement

The data used in this study is available directly from the public institutions cited in each case.

Acknowledgments

The authors are grateful to the Chilean research and development agency (ANID) for supporting this research.

Conflicts of Interest

The authors declare no conflict of interest. The funders had no role in the design of the study; in the collection, analyses, or interpretation of data; in the writing of the manuscript, or in the decision to publish the results.

References

  1. Cecioni, A.; Pineda, V. Geology and geomorphology of natural hazards and human-induced disasters in Chile. Dev. Earth Surf. Process. 2009, 13, 379–413. [Google Scholar]
  2. Moreno Romero, J.A. Natural Disasters and Community Resilience: The Case of El Morro, Chile; University of Nottingham: Nottingham, UK, 2016. [Google Scholar]
  3. Moreno, J. The role of communities in coping with natural disasters: Lessons from the 2010 Chile Earthquake and Tsunami. Procedia Eng. 2018, 212, 1040–1045. [Google Scholar] [CrossRef]
  4. Sandoval, V. Discussing the Aftermath of Two Disasters in Chile: The Question of Scale. In Coping with Disasters Climate Extremes-Challenges & Cooperation Potential; Cologne University of Applied Sciences: Cologne, Germany, 2014; Volume 1, p. 22. [Google Scholar]
  5. Rojas, O.; Mardones, M.; Rojas, C.; Martínez, C.; Flores, L. Urban growth and flood disasters in the coastal river basin of south-central Chile (1943–2011). Sustainability 2017, 9, 195. [Google Scholar] [CrossRef] [Green Version]
  6. Atallah, D.G. Toward a decolonial turn in resilience thinking in disasters: Example of the Mapuche from southern Chile on the frontlines and faultlines. Int. J. Disaster Risk Reduct. 2016, 19, 92–100. [Google Scholar] [CrossRef]
  7. Sandoval, V.; Voss, M. Disaster governance and vulnerability: The case of Chile. Politics Gov. 2016, 4, 107–116. [Google Scholar] [CrossRef] [Green Version]
  8. Hojman, D. Chile: The Political Economy of Development and Democracy in the 1990s; Springer: Berlin, Germany, 1993. [Google Scholar]
  9. Gould, K.A.; Garcia, M.M.; Remes, J.A.C. Beyond “natural-disasters-are-not-natural”: The work of state and nature after the 2010 earthquake in Chile. J. Political Ecol. 2016, 23, 93–114. [Google Scholar] [CrossRef] [Green Version]
  10. Watson, R.T.; Zinyowera, M.C.; Moss, R.H.; Dokken, D.J. The Regional Impacts of Climate Change; IPCC: Geneva, Switzerland, 1998. [Google Scholar]
  11. Walker, B.; Holling, C.S.; Carpenter, S.R.; Kinzig, A. Resilience, adaptability and transformability in social--ecological systems. Ecol. Soc. 2004, 9. [Google Scholar] [CrossRef]
  12. Gunderson, L.H. Panarchy: Understanding Transformations in Human and Natural Systems; Island Press: Washington, DC, USA, 2001. [Google Scholar]
  13. Fiksel, J.; Polyviou, M.; Croxton, K.; Pettit, T. From risk to resilience: Learning to Deal With Disruption. In Resilient by Design; Springer: Berlin, Germany, 2015; pp. 19–34. [Google Scholar]
  14. Hammer, C.C.; Brainard, J.; Innes, A.; Hunter, P.R. (Re-) conceptualising vulnerability as a part of risk in global health emergency response: Updating the pressure and release model for global health emergencies. Emerg. Themes Epidemiol. 2019, 16, 2. [Google Scholar] [CrossRef]
  15. Zabaniotou, A. A systemic approach to resilience and ecological sustainability during the COVID-19 pandemic: Human, societal, and ecological health as a system-wide emergent property in the Anthropocene. Glob. Transit. 2020, 2, 116–126. [Google Scholar] [CrossRef]
  16. Anderies, J.M.; Folke, C.; Walker, B.; Ostrom, E. Aligning key concepts for global change policy: Robustness, resilience, and sustainability. Ecol. Soc. 2013, 18, 8. [Google Scholar] [CrossRef] [Green Version]
  17. Brooks, N. Vulnerability, Risk and Adaptation: A Conceptual Framework; Working Paper No. 38; Tyndall Centre for Climate Change Research: Norwich, UK, 2003; pp. 1–16. [Google Scholar]
  18. Endress, M. The social constructedness of resilience. Soc. Sci. 2015, 4, 533–545. [Google Scholar] [CrossRef] [Green Version]
  19. Duchek, S. Organizational resilience: A capability-based conceptualization. Bus. Res. 2020, 13, 215–246. [Google Scholar] [CrossRef] [Green Version]
  20. Berkes, F.; Colding, J.; Folke, C. Navigating Social-Ecological Systems: Building Resilience for Complexity and Change; Cambridge University Press: Cambridge, UK, 2008. [Google Scholar]
  21. Berkes, F.; Ross, H. Community resilience: Toward an integrated approach. Soc. Nat. Resour. 2013, 26, 5–20. [Google Scholar] [CrossRef]
  22. Folke, C. Resilience: The emergence of a perspective for social--ecological systems analyses. Glob. Environ. Chang. 2006, 16, 253–267. [Google Scholar] [CrossRef]
  23. Manyena, S.B. The concept of resilience revisited. Disasters 2006, 30, 434–450. [Google Scholar] [CrossRef] [PubMed]
  24. Rose, A. Economic resilience to natural and man-made disasters: Multidisciplinary origins and contextual dimensions. Environ. Hazards 2007, 7, 383–398. [Google Scholar] [CrossRef]
  25. Rist, G. The History of Development: From Western Origins to Global Faith; Zed Books Ltd.: London, UK, 2019. [Google Scholar]
  26. Zed Books. The Development Dictionary; Sachs, W., Ed.; Zed Books: London, UK, 1991. [Google Scholar]
  27. Escobar, A. Encountering Development: The Making and Unmaking of the Third World; Princeton University Press: Princeton, NJ, USA, 1995. [Google Scholar]
  28. Gallopín, G.C. Linkages between vulnerability, resilience, and adaptive capacity. Glob. Environ. Chang. 2006, 16, 293–303. [Google Scholar] [CrossRef]
  29. Sen, A. Rights and capabilities. In Morality and Objectivity; Honderich, T., Ed.; Routledge: London, UK, 1985. [Google Scholar]
  30. Sen, A. Development as Freedom; Oxford University Press: Oxford, UK, 1999. [Google Scholar]
  31. Sen, A. Human rights and capabilities. J. Hum. Dev. 2005, 6, 151–166. [Google Scholar] [CrossRef]
  32. Sen, A.K. The Idea of Justice; Harvard University Press: Cambridge, MA, USA, 2009. [Google Scholar]
  33. Carpenter, S.; Walker, B.; Anderies, J.M.; Abel, N. From metaphor to measurement: Resilience of what to what? Ecosystems 2001, 4, 765–781. [Google Scholar] [CrossRef]
  34. Gupta, J.; Termeer, C.; Klostermann, J.; Meijerink, S.; van den Brink, M.; Jong, P.; Nooteboom, S.; Bergsma, E. The adaptive capacity wheel: A method to assess the inherent characteristics of institutions to enable the adaptive capacity of society. Environ. Sci. Policy 2010, 13, 459–471. [Google Scholar] [CrossRef] [Green Version]
  35. Adger, W.N.; Brooks, N.; Bentham, G.; Agnew, M.; Eriksen, S. New Indicators of Vulnerability and Adaptive Capacity; Tyndall Centre for Climate Change Research Norwich: Norwich, UK, 2005. [Google Scholar]
  36. Turner, B.L.; Kasperson, R.E.; Matson, P.A.; McCarthy, J.J.; Corell, R.W.; Christensen, L.; Eckley, N.; Kasperson, J.X.; Luers, A.; Martello, M.L.; et al. A framework for vulnerability analysis in sustainability science. Proc. Natl. Acad. Sci. USA 2003, 100, 8074–8079. [Google Scholar] [CrossRef] [Green Version]
  37. Pelling, M.; High, C. Understanding adaptation: What can social capital offer assessments of adaptive capacity? Glob. Environ. Chang. 2005, 15, 308–319. [Google Scholar] [CrossRef]
  38. Krasny, M.E. Advancing Environmental Education Practice; E-book; Cornell University: Ithaca, NY, USA, 2020. [Google Scholar]
  39. Smit, B.; Pilifosova, O. Adaptation to Climate Change in the Context of Sustainable Development and Equity. In Climate Change 2001: Impacts, Adaptation, and Vulnerability; IPCC: Ginebra, Switzerland, 2001; pp. 887–912. [Google Scholar]
  40. Smith, K. Environmental Hazards: Assessing Risk and Reducing Disaster; Routledge: London, UK, 2013. [Google Scholar]
  41. Kais, S.M.; Islam, M.S. Community capitals as community resilience to climate change: Conceptual connections. Int. J. Environ. Res. Public Health 2016, 13, 1211. [Google Scholar] [CrossRef] [Green Version]
  42. Hirschman, A.O. The Strategy of Economic Development; Yale University Press: London, UK, 1958. [Google Scholar]
  43. Storper, M. The Regional World: Territorial Development in a Global Economy; Guilford Press: New York, NY, USA, 1997. [Google Scholar]
  44. Sunkel, O. Desarrollo e Integración Regional: ¿Otra Oportunidad Para una Promesa Incumplida? Naciones Unidas Comisión Económica para América Latina y el Caribe (CEPAL): Santiago, Chile, 1998. [Google Scholar]
  45. Storper, M. Explaining regional growth and change. In Handbook of Regions and Competitiveness; Edward Elgar Publishing: Cheltenham, UK, 2017. [Google Scholar]
  46. Daher, A. Regiones-commodities: Crisis y contagio en Chile. EURE 2003, 29, 89–108. [Google Scholar] [CrossRef]
  47. Hudson, R. Resilient regions in an uncertain world: Wishful thinking or a practical reality? Camb. J. Reg. Econ. Soc. 2010, 3, 11–25. [Google Scholar] [CrossRef]
  48. Coe, N.M.; Yeung, H.W.-C. Global Production Networks: Theorizing Economic Development in an Interconnected World; Oxford University Press: Oxford, UK, 2015. [Google Scholar]
  49. Porter, M. Clusters and the New Economics of Competition; Harvard Business Review Boston: Boston, MA, USA, 1998; Volume 76. [Google Scholar]
  50. Bristow, G.I.; Healy, A.; Norris, L.; Wink, R.; Kafkalas, G.; Kakderi, C.; Espenberg, K.; Varblane, U.; Sepp, V.; Sagan, I.; et al. ECR2. Economic Crisis: Regional Economic Resilience. Available online: https://www.researchgate.net/publication/332241916_ECR_2-Economic_crisis_Resilience_of_regions (accessed on 10 March 2021).
  51. Martin, R.; Sunley, P. On the notion of regional economic resilience: Conceptualization and explanation. J. Econ. Geogr. 2015, 15, 1–42. [Google Scholar] [CrossRef] [Green Version]
  52. Fratesi, U.; Perucca, G. Territorial capital and the resilience of European regions. Ann. Reg. Sci. 2018, 60, 241–264. [Google Scholar] [CrossRef]
  53. Camagni, R. Towards a Concept of Territorial Capital. In Modelling Regional Scenarios for the Enlarged Europe; Capello, R., Camagni, R., Chizzolini, B., Fratesi, U., Eds.; Springer: Berlin, Germany, 2008. [Google Scholar]
  54. Kitsos, A.; Carrascal-Incera, A.; Ortega-Argilés, R. The role of embeddedness on regional economic resilience: Evidence from the UK. Sustainability 2019, 11, 3800. [Google Scholar] [CrossRef] [Green Version]
  55. Martin, R. Regional economic resilience, hysteresis and recessionary shocks. J. Econ. Geogr. 2012, 12, 1–32. [Google Scholar] [CrossRef]
  56. Cutter, S.L.; Ash, K.D.; Emrich, C.T. Urban-rural differences in disaster resilience. Ann. Am. Assoc. Geogr. 2016, 106, 1236–1252. [Google Scholar] [CrossRef]
  57. Meerow, S.; Newell, J.P.; Stults, M. Defining urban resilience: A review. Landsc. Urban Plan. 2016, 147, 38–49. [Google Scholar] [CrossRef]
  58. Meadowcroft, J. Sustainable development: A new (ish) idea for a new century? Political Stud. 2000, 48, 370–387. [Google Scholar] [CrossRef]
  59. Acselrad, H. Sustentabilidad y ciudad. EURE 1999, 25, 36–46. [Google Scholar] [CrossRef]
  60. Wisner, B.; Blaikie, P.; Blaikie, P.M.; Cannon, T.; Davis, I. At Risk: Natural Hazards, People’s Vulnerability and Disasters, 2nd ed.; Psychology Press: New York, NY, USA, 2004. [Google Scholar]
  61. Rehner, J.; Baeza, S.A.; Barton, J.R. Chile’s resource-based export boom and its outcomes: Regional specialization, export stability and economic growth. Geoforum 2014, 56, 35–45. [Google Scholar] [CrossRef]
  62. Daher, A. Cluster minero sin cluster social: Antofagasta-Chile. Rev. Urban. 2015, 26–36. [Google Scholar]
  63. Getis, A.; Getis, J. Christaller’s central place theory. J. Geog. 1966, 65, 220–226. [Google Scholar] [CrossRef]
  64. Forman, R. Land mosaics: The ecology of landscapes and regions 1995. In The Ecological Design and Planning Reader; Island Press: Washington, DC, USA, 2014; pp. 217–234. [Google Scholar]
  65. World Bank. World Development Report 2009: Reshaping Economic Geography. Available online: https://openknowledge.worldbank.org/handle/10986/5991 (accessed on 4 January 2021).
  66. Rose, A.; Krausmann, E. An economic framework for the development of a resilience index for business recovery. Int. J. Disaster Risk Reduct. 2013, 5, 73–83. [Google Scholar] [CrossRef]
  67. Simmie, J.; Martin, R. The economic resilience of regions: Towards an evolutionary approach. Camb. J. Reg. Econ. Soc. 2010, 3, 27–43. [Google Scholar] [CrossRef] [Green Version]
  68. Egeland, B.; Carlson, E.; Sroufe, L.A. Resilience as process. Dev. Psychopathol. 1993, 5, 517–528. [Google Scholar] [CrossRef]
  69. Giacometti, A.; Teräs, J.; Perjo, L.; Wøien, M.; Sigurjonsdottir, H.; Rinne, T.; Giacometti, A.; Teräs, J.; Perjo, L.; Wøien, M.; et al. Regional Economic and Social Resilience: Conceptual Debate and Implications for Nordic Regions. Available online: https://www.nordregio.org/wp-content/uploads/2018/02/Regional-Economic-and-Social-Resilience-Conceptual-Debate-and-Implications-for-Nordic-Regions-1.pdf (accessed on 10 March 2021).
  70. Sensier, M.; Devine, F. Understanding regional economic performance and resilience in the UK: Trends since the global financial crisis. Natl. Inst. Econ. Rev. 2020, 253, R18–R28. [Google Scholar] [CrossRef]
  71. Rykiel, E., Jr. Towards a definition of ecological disturbance. Aust. J. Ecol. 1985, 10, 361–365. [Google Scholar] [CrossRef]
  72. Barton, J.R.; Cardoso, A.C.; Canil, K.; Santa Cruz, J.C. Towards a resilience framework for Latin America. In Climate Resilience: Case Studies from Europe and Latin America; Paneque, P., Ed.; Springer: Berlin/Heidelberg, Germany, 2021. [Google Scholar]
  73. IPCC. Managing the Risks of Extreme Events and Disasters to Advance Climate Change Adaptation: Special Report of the Intergovernmental Panel on Climate Change; Cambridge University Press: Cambridge, UK, 2012. [Google Scholar]
  74. The United Nation Office for Disaster Risk Reduction. Annual Report 2015; The United Nation Office for Disaster Risk Reduction: Geneva, Switerland, 2015. [Google Scholar]
  75. Wright, R.A.; Boudet, H.S. To act or not to act: Context, capability, and community response to environmental risk. Am. J. Sociol. 2012, 118, 728–777. [Google Scholar] [CrossRef] [Green Version]
  76. Giordono, L.; Boudet, H.; Gard-Murray, A. Local adaptation policy responses to extreme weather events. Policy Sci. 2020, 53, 609–636. [Google Scholar] [CrossRef]
  77. Howe, P.D.; Boudet, H.; Leiserowitz, A.; Maibach, E.W. Mapping the shadow of experience of extreme weather events. Clim. Chang. 2014, 127, 381–389. [Google Scholar] [CrossRef]
  78. Bernales, M.; Repetto, P.; McIntyre, A.; Vasquez, A.; Drury, J.; Sullivan, G.B.; Castañeda, J. Experiences and perceptions of natural hazards among international migrants living in Valparaiso, Chile. Int. J. Disaster Risk Reduct. 2019, 34, 116–128. [Google Scholar] [CrossRef]
  79. Cubelos, C.; Kularathna, A.H.T.; Bruno Valenzuela, V.P.; Iliopoulos, N.; Quiroz, M.; Yavar, R.; Henriquez, P.; Bacigalupe, G.; Onuki, M.; Mikami, T.; et al. Understanding community-level flooding awareness in remote coastal towns in northern Chile through community mapping. Geosciences 2019, 9, 279. [Google Scholar] [CrossRef] [Green Version]
  80. Tidball, K.G.; Krasny, M.E.; Svendsen, E.; Campbell, L.; Helphand, K. Stewardship, learning, and memory in disaster resilience. Environ. Educ. Res. 2010, 16, 591–609. [Google Scholar] [CrossRef]
  81. Christopherson, S.; Michie, J.; Tyler, P. Regional resilience: Theoretical and empirical perspectives. Camb. J. Reg. Econ. Soc. 2010, 3, 3–10. [Google Scholar] [CrossRef]
  82. Maru, Y.T. Others resilient regions: Clarity of concepts and challenges to systemic measurement. CSIRO Sustain. Ecosyst. 2010, 4, 26–40. [Google Scholar]
  83. Bristow, G.; Healy, A. Building resilient regions: Complex adaptive systems and the role of policy intervention. Raumforsch. Raumordn. Spat. Res. Plan. 2014, 72, 93–102. [Google Scholar] [CrossRef] [Green Version]
  84. Woolcock, M. Social capital and economic development: Toward a theoretical synthesis and policy framework. Theory Soc. 1998, 27, 151–208. [Google Scholar] [CrossRef]
  85. Burton, I.; Smith, J.B.; Lenhart, S. Adaptation to climate change: Theory and assessment. In Handbook on Methods for Climate Change Impact Assessment and Adaptation Strategies; Feenestra, J., Burton, I., Smith, J., Tol, R., Eds.; United Nations Environment Programme and Institute for Environmental Studies Vrije Universiteit Amsterdam: Amsterdam, The Netherlands, 1998; pp. 5.1–5.24. [Google Scholar]
  86. Kates, R.W. Cautionary tales: Adaptation and the global poor. Clim. Chang. 2000, 45, 5–17. [Google Scholar] [CrossRef]
  87. Clark, J.; Huang, H.-I.; Walsh, J.P. A typology of ‘innovation districts’: What it means for regional resilience. Camb. J. Reg. Econ. Soc. 2010, 3, 121–137. [Google Scholar] [CrossRef]
  88. Bento, F.; Couto, K.C. A Behavioral Perspective on Community Resilience during the COVID-19 Pandemic: The Case of Paraisópolis in São Paulo, Brazil. Sustainability 2021, 13, 1447. [Google Scholar] [CrossRef]
  89. Ministerio de Desarrollo Social Informe: Desarrollo Social. 2019. Available online: https://www.desarrollosocialyfamilia.gob.cl/storage/docs/Informe_de_Desarrollo_Social_2019.pdf (accessed on 3 October 2020).
  90. Ministerio de Desarrollo Social. La Medición de Pobreza Multidimensional, una Mirada Comprehensiva a la Pobreza y Desigualdad en Chile. Importancia de Variables Territoriales y Sociales. Available online: http://www.desarrollosocialyfamilia.gob.cl/pdf/upload/Heidi_Berner_MDS.pdf (accessed on 15 July 2020).
  91. Ministry of Health Government of Chile. Indicadores Básicos de Salud Chile. 2017. Available online: https://repositoriodeis.minsal.cl/Deis/indicadores/IBS2017.pdf (accessed on 10 March 2021).
  92. Gamboa, R.; Segovia, C. Chile 2015: Falla política, desconfianza y reforma. Rev. Cienc. Política 2016, 36, 123–144. [Google Scholar] [CrossRef] [Green Version]
  93. Larrañaga, O.; Rodrígues, M.E. Desigualdad de Ingresos y Pobreza en Chile 1990 a 2013; Programa de las Naciones Unidas para el Desarrollo-Chile, Área Pobreza y Desigualdad: Santiago, Chile, 2015. [Google Scholar]
  94. Ministry of Social Development and Family. CASEN Indicators. Available online: http://observatorio.ministeriodesarrollosocial.gob.cl/inicio (accessed on 15 November 2020).
  95. United Nations. Human Development Reports: Human Development Index. Available online: http://hdr.undp.org/en/content/human-development-index-hdi (accessed on 26 October 2020).
  96. Agostini, C.A.; Brown, P.H.; Roman, A.C. Poverty and inequality among ethnic groups in Chile. World Dev. 2010, 38, 1036–1046. [Google Scholar] [CrossRef] [Green Version]
  97. Oyarzún, E.; Miranda, B. La economía rural en Chile: Entre la pobreza y el desarrollo. Estud. Econ. Apl. 2011, 29, 31–55. [Google Scholar]
  98. Foster, W.; Anríquez, G.; Melo, O.; Yupanqui, D.; Ortega, J. Geographic disparities in rural land appreciation in a transforming economy: Chile, 1980 to 2007. Land Use Policy 2016, 57, 655–668. [Google Scholar] [CrossRef]
  99. Rasse, A. Segergación Residencial Socioeconómica y Desigualdad en las Ciudades Chilenas; United Nations Development Programme: Santiago, Chile, 2016. [Google Scholar]
  100. Oyarzún, J.d.D. Tensions between Education and Development in Rural Territories in Chile: Neglected Places, Absent Policies. In Handbook on Promoting Social Justice in Education; Papa, R., Ed.; Springer Nature: Basingstoke, UK, 2020. [Google Scholar]
  101. Daher, A. La capital: El capital. EURE 1989, XV, 17–28. [Google Scholar]
  102. Daher, A. Territorios de la financiarización urbana y de las crisis inmobiliarias. Rev. Geogr. Norte Gd. 2013, 56, 7–30. [Google Scholar] [CrossRef]
  103. Gutiérrez-Antinopai, F.; Barton, J.R. ¿Cuánto consumo supone el Bienestar? Una geografía urbana basada en un Índice de Sustentabilidad comunal en Chile (forthcoming). Rev. Geogr. Norte Gd. 2021. [Google Scholar]
  104. Pozo, V.; Reyes, C. Buin, la Comuna que Apuesta por Transformarse en el “Nuevo Chicureo”. Available online: https://www.latercera.com/noticia/buin-la-comuna-que-apuesta-por-transformarse-en-el-nuevo-chicureo/ (accessed on 3 January 2021).
  105. Pizarro, C. El Auge de las Zonas Periféricas de Santiago la Nueva Tendencia Inmobiliaria Que Generó la Pandemia. Available online: https://www.latercera.com/pulso/noticia/el-auge-de-las-zonas-perifericas-de-santiago-la-nueva-tendencia-inmobiliaria-que-genero-la-pandemia/OHXN25TY2JFBHEKD4L4X4HYYUE/ (accessed on 3 January 2021).
  106. DEIS. Ministry of Health Defunciones. Available online: https://public.tableau.com/profile/deis4231#!/vizhome/Anuario_Defunciones/Defunciones (accessed on 12 March 2021).
  107. SINIM Government of Chile Datos Municipales. Available online: http://datos.sinim.gov.cl/datos_municipales.php (accessed on 12 March 2021).
  108. Cornejo, C.A. Estigma territorial como forma de violencia barrial: El caso del sector El Castillo. Rev. INVI 2012, 27, 177–200. [Google Scholar] [CrossRef] [Green Version]
  109. Ortega, T. Criminalización y concentración de la pobreza urbana en barrios segregados: Síntomas de guetización en La Pintana, Santiago de Chile. EURE 2014, 40, 241–263. [Google Scholar] [CrossRef] [Green Version]
  110. Álvarez, A.M.; Cavieres, H. El Castillo: Territorio, sociedad y subjetividades de la espera. EURE 2016, 42, 155–174. [Google Scholar] [CrossRef]
  111. Barton, J.R.; Ramírez, M.I. The Role of Planning Policies in Promoting Urban Sprawl in Intermediate Cities: Evidence from Chile. Sustainability 2019, 11, 7165. [Google Scholar] [CrossRef] [Green Version]
  112. Escalona Ulloa, M.; Muñoz Pedreros, A.; Figueroa, D. (Eds.) Gobernanza Ambiental: Reflexiones y Debates Desde la Araucanía; Ril Editores: Santiago, Chile, 2020. [Google Scholar]
  113. Astudillo Pizarro, F.; Sandoval Diaz, J. Justicia espacial, desastres socionaturales y políticas del espacio: Dinámicas sociopolíticas frente a los aluviones y proceso de recuperación en Copiapó, Chile. Cuad. Geogr. Rev. Colomb. Geogr. 2019, 28, 303–321. [Google Scholar] [CrossRef]
  114. Romero Aravena, H.; Fuentes, C.; Smith, P. Ecología Política de los Riesgos Naturales y de la Contaminación Ambiental en Santiago de Chile: Necesidad de Justicia Ambiental. Available online: http://repositorio.uchile.cl/bitstream/handle/2250/117839/ScriptaNova.pdf?sequence=1&isAllowed=y (accessed on 10 November 2020).
  115. Reszka, P.; Fuentes, A. The great Valparaiso fire and fire safety management in Chile. Fire Technol. 2015, 51, 753–758. [Google Scholar] [CrossRef] [Green Version]
  116. Budds, J. Power, nature and neoliberalism: The political ecology of water in Chile. Singap. J. Trop. Geogr. 2004, 25, 322–342. [Google Scholar] [CrossRef]
  117. Azócar, G.; Torres, R.; Gallardo, R.; Félez, J. Pueblo mapuche y crisis hídrica: Cuenca hidrográfica del río Chol-Chol, región de la Araucanía, Chile. In América Latina en las Últimas Décadas: Procesos y Retos; Universidad de Castilla-La Mancha: Ciudad Real, Spain, 2018; pp. 945–964. [Google Scholar]
  118. Roose, I.; Panez, A. Social Innovations as A Response to Dispossession: Community Water Management in View of Socio-Metabolic Rift in Chile. Water 2020, 12, 566. [Google Scholar] [CrossRef] [Green Version]
  119. Valenzuela, R. Inequidad, Ciudadanía y Pueblos Indígenas en Chile Cepa; CEPAL: Santiago, Chile, 2003. [Google Scholar]
  120. Agostini, C.A. Estimando Indigencia y Pobreza Indígena Regional con Datos Censales y Encuestas de Hogares. Cuad. Econ. 2010, 47, 125–150. [Google Scholar] [CrossRef] [Green Version]
  121. Figueiredo, A.; Rocha, C.; Montagna, P. Data collection with indigenous people: Fieldwork experiences from Chile. In Researching Peace, Conflict, and Power in the Field; Springer: Berlin, Germany, 2020; pp. 105–127. [Google Scholar]
  122. Valenzuela, M.S.; Toro, S.Y.; ROJO-MENDOZA, F. Equal in Poverty, Unequal in Wealth: Ethnic Stratification in C hile, the M apuche Case. Bull. Lat. Am. Res. 2017, 36, 526–541. [Google Scholar] [CrossRef]
  123. Catholic University of Chile Data. Available online: https://coronavirus.mat.uc.cl/ (accessed on 5 November 2020).
  124. European Centre for Disease Prevention and Control Data, Infographics and Videos. Available online: https://www.ecdc.europa.eu/en (accessed on 1 October 2020).
  125. Irarrazaval, F. La no tan loca geografía de la Covid-19 en Chile. J. Lat. Am. Geogr. 2020, 19, 248–252. [Google Scholar] [CrossRef]
  126. Government of Chile. Presidente Piñera anuncia Plan de Acción por Coronavirus. Available online: https://prensa.presidencia.cl/discurso.aspx?id=137702 (accessed on 12 May 2020).
  127. Ministry of Health Government of Chile. Minsal Refuerza Capacidad Hospitalaria por Aumento de Casos COVID-19 e Insta Cumplir Cuarentenas. Available online: https://www.minsal.cl/minsal-refuerza-capacidad-hospitalaria-por-aumento-de-casos-covid-19-e-insta-cumplir-cuarentenas/ (accessed on 22 September 2020).
  128. Sepúlveda, N.; Miranda, B. La Batalla de las Camas Críticas: Las Cifras Que Alertaron al Minsal Sobre el Escaso Aporte de las Clínicas. Available online: https://www.ciperchile.cl/2020/05/20/la-batalla-de-las-camas-criticas-las-cifras-que-alertaron-al-minsal-sobre-el-escaso-aporte-de-las-clinicas/ (accessed on 15 November 2020).
  129. DEIS. Ministry of Health COVID Estadísticas. Available online: https://github.com/MinCiencia/Datos-COVID19 (accessed on 3 June 2020).
  130. Statista COVID-19 Deaths Worldwide per Million Population as of 12 March 2021, by Country Published by Raynor de Best, Mar 12, 2021 Based on a Comparison of Coronavirus Deaths in 201 Countries Relative to Their Population, Czechia Had the Most Losses to COVID-19. Available online: https://www.statista.com/statistics/1104709/coronavirus-deaths-worldwide-per-million-inhabitants/ (accessed on 3 December 2020).
  131. Government of Chile. Plan de Reconstrucción Terremoto y Maremoto del 27 de Febrero de 2010. Available online: https://www.preventionweb.net/files/28726_plandereconstruccinagosto2010.pdf (accessed on 2 October 2020).
  132. PAHO. El Terremoto y Tsunami del 27 de Febrero en Chile. Available online: https://www.paho.org/disasters/index.php?option=com_docman&view=download&category_slug=books&alias=1783-el-terremoto-y-tsunami-del-27-de-febrero-en-chile-cronica-y-lecciones-aprendidas-en-el-sector-salud&Itemid=1179&lang=en (accessed on 2 October 2020).
  133. Morales, R. Terremoto y tsunami del 27 de febrero de 2010. Efectos urbanos en localidades de la provincia de Arauco. Urbano 2010, 43–62. [Google Scholar]
  134. Brain, I.; Mora, P. Emergencia y Reconstrucción: El Antes y Después del Terremoto y Tsunami del 27F en Chile; Centro de Políticas Públicas UC: Santiago, Chile, 2015. [Google Scholar]
  135. Lastra, J.; Guzmán, G.; Conejeros, C.; Suárez, G.; Chávez, O. Características epidemiológicas de los fallecidos durante el terremoto y maremoto de Chile 2010. Rev. Med. Chil. 2012, 140, 732–739. [Google Scholar] [CrossRef] [Green Version]
  136. Ramírez, P.; Sandoval, J. Tsunami Paso a Paso: Los Escandalosos Errores y Omisiones del SHOA y la ONEMI. Available online: https://www.ciperchile.cl/2012/01/18/tsunami-paso-a-paso-los-escandalosos-errores-y-omisiones-del-shoa-y-la-onemi/ (accessed on 5 October 2020).
  137. Siembieda, W.; Johnson, L.; Franco, G. Rebuild fast but rebuild better: Chile’s initial recovery following the 27 February 2010 earthquake and tsunami. Earthq. Spectra 2012, 28, 621–641. [Google Scholar] [CrossRef]
  138. ECLAC Terremoto en Chile: Una Primera Mirada al 10 de Marzo de 2010; Publicación de las Naciones Unidas: Santiago, Chile, 2010.
  139. UPI. Chile Senadores Analizan Situación Que Afecta a Hospitales de Temuco y Angol. Available online: https://www.elmostrador.cl/ahora/2010/03/22/senadores-analizan-situacion-que-afecta-a-hospitales-de-temuco-y-angol/ (accessed on 28 September 2020).
  140. Hospital Félix Bulnes Conmemoración 27F: A 10 Años del Terremoto. Available online: https://felixbulnes.cl/2020/02/27/conmemoracion-27f-a-10-anos-del-terremoto/ (accessed on 2 October 2020).
  141. Tapia Zarricueta, R. Terremoto 2010 en Chile y Vivienda Social: Resultados y Aprendizajes para Recomendación de Políticas Públicas; Universidad Politécnica de Madrid: Madrid, Spain, 2015. [Google Scholar]
  142. El Diario de la Araucanía. Diario de la Hospital: El Gran Herido del Terremoto. Available online: https://www.australtemuco.cl/prontus4_noticias/site/artic/20100314/pags/20100314000337.html (accessed on 7 October 2020).
  143. Subercaseaux, B. Chile o una Loca Geografía; Editorial Universitaria: Santiago, Chile, 2005. [Google Scholar]
  144. CONAMA. Plan de Acción Cambio Climático. Available online: https://www.conaf.cl/cms/editorweb/GEF-BM/Apendice-7_02-Plan_Nacional_Cambio_Climatico.pdf (accessed on 10 October 2020).
  145. ECLAC. La Economía del Cambio Climático en Chile; Economic Commission for Latin America and the Caribbean: Santiago, Chile, 2012. [Google Scholar]
  146. Barton, J.R. Climate Change Adaptive Capacity in S antiago de C hile: Creating a Governance Regime for Sustainability Planning. Int. J. Urban Reg. Res. 2013, 37, 1916–1933. [Google Scholar] [CrossRef]
  147. Center for Climate and Resilience Research. The 2010–2015 Mega-Drought: A Lesson for the Future. Available online: http://www.cr2.cl/wp-content/uploads/2015/11/Megadrought_report.pdf (accessed on 21 November 2020).
  148. Fernández, O. Santa Olga: La Reconstrucción a Tres Años de los Incendios. Available online: https://www.latercera.com/nacional/noticia/santa-olga-la-reconstruccion-tres-anos-los-incendios/987712/ (accessed on 10 October 2020).
  149. Government of Chile. Contribución Nacional Tentativa de Chile (INDC) para el Acuerdo Climático Paris 2015; Government of Chile: Santiago, Chile, 2015.
  150. Krellenberg, K.; Hansjürgens, B. Climate Adaptation Santiago; Springer: Berlin, Germany, 2014. [Google Scholar]
  151. Bonelli, S.; Vicuña, S.; Meza, F.J.; Gironás, J.; Barton, J. Incorporating climate change adaptation strategies in urban water supply planning: The case of central Chile. J. Water Clim. Chang. 2014, 5, 357–376. [Google Scholar] [CrossRef]
  152. Ruiz, D. Paine, Hacia una Tragedia Común. Un Análisis a las Presiones Socio-Ambientales Que Afectan las Aguas Subterráneas del Sector de Aprovechamiento Común Paine; Pontifical Catholic University of Chile: Santiago, Chile, 2017. [Google Scholar]
  153. Amulén. Pobres de Agua. Radiografía del Agua Rural de Chile: Visualización de un Problema Oculto; Centro UC Derecho y Gestión de Agua, Centro UC Camnbio Global: Santiago, Chile, 2019. [Google Scholar]
  154. Durán, G. Agua y pobreza en Santiago de Chile: Morfología de la inequidad en la distribución del consumo domiciliario de agua potable. EURE 2015, 41, 225–246. [Google Scholar] [CrossRef] [Green Version]
  155. Riveros, D. Respuesta Municipal Ante Escasez de Agua Potable: Una Mirada Desde la Ecología Política; Pontifical Catholic University of Chile: Santiago, Chile, 2015. [Google Scholar]
  156. Parraguez-Vergara, E.; Barton, J.R.; Raposo-Quintana, G. Impacts of climate change in the Andean Foothills of Chile: Economic and cultural vulnerability of indigenous Mapuche livelihoods. J. Dev. Soc. 2016, 32, 454–483. [Google Scholar] [CrossRef]
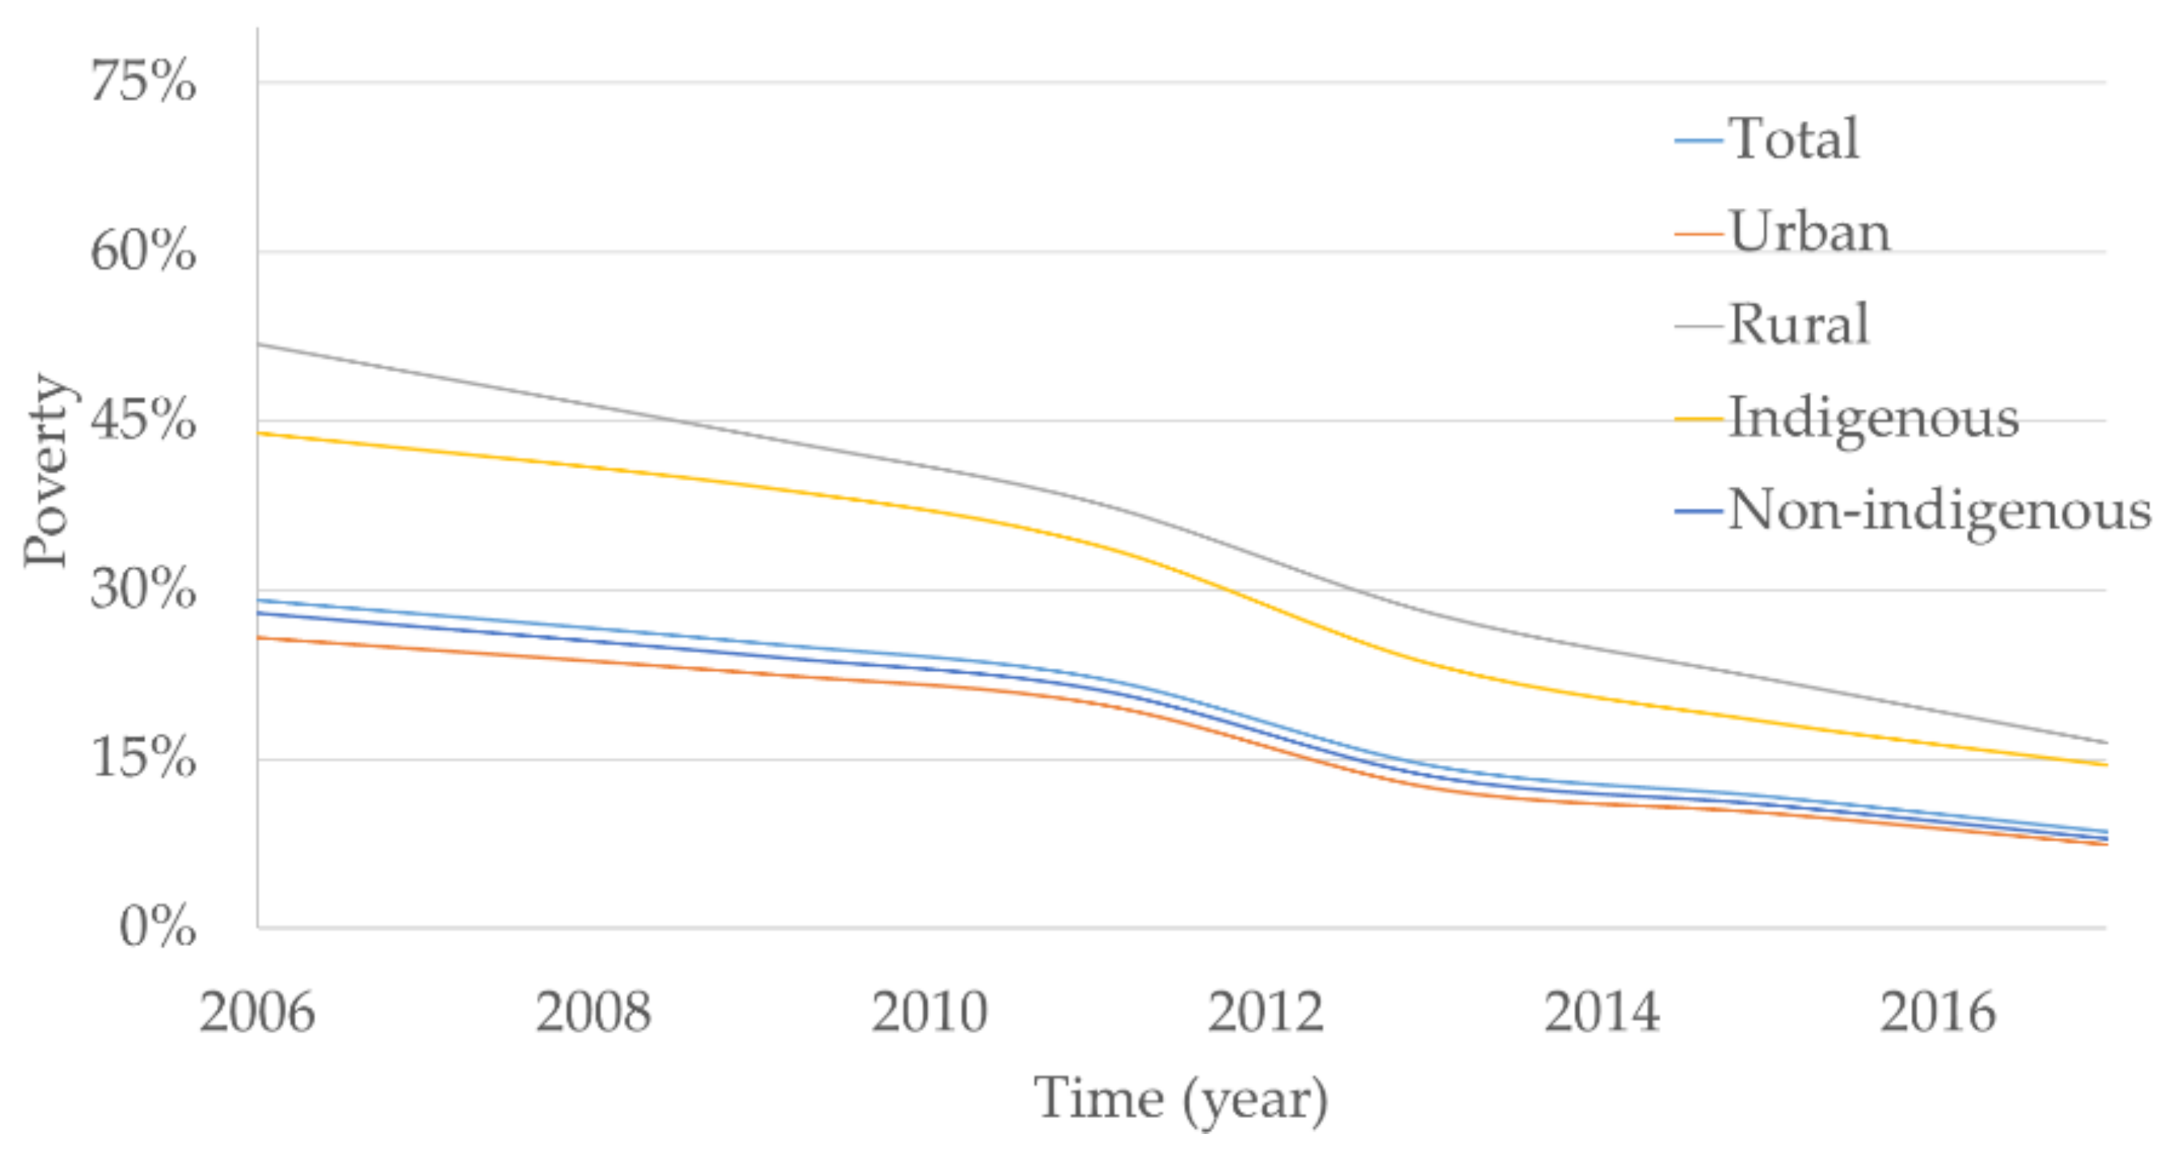
Figure 2. Poverty levels based on CASEN data [94]. Source: Authors.
Sustainability 13 04660 g002
Figure 3. Metropolitan Region (RMS) poverty, based on CASEN [94]. Source: Authors.
Sustainability 13 04660 g003
Figure 4. Araucania Region poverty, based on CASEN [94]. Source: Authors.
Sustainability 13 04660 g004
Figure 5. Infant mortality 2016, based on DEIS [106]. Source: Authors.Each data point represents one municipality.
Sustainability 13 04660 g005
Figure 6. AVPP 2016, based on DEIS [106]. Source: Authors. Each data point represents one municipality.
Sustainability 13 04660 g006
Figure 7. Differences in municipal multidimensional poverty against regional averages per year (2013–2017) in the Santiago Metropolitan Region, based on CASEN [94]. Source: Authors.
Sustainability 13 04660 g007
Figure 8. Differences in municipal income per capita against regional averages per year (2001–2017) in the Santiago Metropolitan Region, based on SINIM [107]. Source: Authors.
Sustainability 13 04660 g008
Figure 9. Differences in municipal multidimensional poverty against regional averages per year (2013–2017) in the Araucanía Region, based on CASEN [94]. Source: Authors.
Sustainability 13 04660 g009
Figure 10. Differences in municipal income per capita against regional averages per year (2001–2017) in the Araucanía Region, based on SINIM [94]. Source: Authors.
Sustainability 13 04660 g010
Figure 11. Covid-19 infections in the Santiago Metropolitan Region, based on DEIS [129]. Source: Authors.
Sustainability 13 04660 g011
Figure 12. Covid-19 infections in the Araucanía Region, based on DEIS [129]. Source: Authors.
Sustainability 13 04660 g012
Figure 13. Covid-19 mortality in the Santiago Metropolitan Region, based on DEIS [129]. Source: Authors.
Sustainability 13 04660 g013
Figure 14. Covid-19 mortality in the Araucanía Region, based on DEIS [129]. Source: Authors.
Sustainability 13 04660 g014
Table 1. Chilean data sources for municipal and regional comparisons. Source: Authors.
IndicatorUnitScaleSourcePeriodCalculation
Poverty% low-income people in the total populationRegional and municipalCASEN (National Socio-Economic Characterization Survey), Ministry of Social Development and FamilyRegional 2006–2017Poverty by income [89]
Multidimensional Poverty% multidimensional poverty experienced in the total populationRegional and municipalCASEN2013–2017Contemplates five dimensions: (1) education, (2) health, (3) work and social security, (4) housing and environment, and (5) networks and social cohesion (thus covering some cultural aspects of the community) [90]
AVPP (Years of potential life lost)RatioRegional and municipalDEIS (Department of Health Statistics and Information), Ministry of Health2001–2016Loss suffered as a result of premature death (before age 80). The AVPP rate is reported per 1000 population aged 0–79 years [91]
Infant mortalityRatioRegional and municipalDEIS2001–2016Ratio of deaths of children under one year of age per thousand live births [91]
Municipality spendingChilean pesos per capita, annualRegional and municipal SINIM (Municipal Information System) and INE (National Institute for Statistics)2001–2017Ratio between self-generated income and FCM transfers (Common Municipal Fund) by capita of the municipal population, according to INE 2002–2012–2017.
Covid—InfectedRatioRegional and municipalDEISMarch 2020–March 2021Ratio of infected population to total population (per 1000)
Covid—DeathsRatioRegional and municipalDEISJune 2020–March 2021 Ratio of deaths to total population (per 1000)
Table 2. Regional comparisons, 2000–2016, based on DEIS [106] and SINIM [107]. Source: Authors.
Data AnalysisReg.2000200320052006200920102011201320152016
Child M.—SDRMS3.53.33.33.13.22.92.72.12.83.4
Ara7.58.16.35.76.17.55.85.25.95.4
Child M.—Average
(1000 live births)
RMS8.58.08.18.07.97.38.16.86.66.9
Ara12.712.29.79.610.811.710.09.19.08.0
AVPP—SDRMS16.721.818.919.425.728.824.614.815.714.4
Ara19.923.417.920.023.421.118.115.320.925.4
AVPP—AverageRMS74.273.672.472.876.878.876.768.066.465.7
Ara94.799.196.588.792.693.791.085.385.389.1
M. Inc.—SDRMS-----43.947.050.057.858.269.880.4122.4106.4
Ara-----14.018.426.925.524.328.031.136.442.9
M. Inc.—Average
(M$ per capita)
RMS-----66.171.578.797.999.0110.9125.7186.7165.4
Ara------56.965.774.3102.1104.3117.0134.4168.1184.2
Table 3. Regional statistical comparison of Covid-19 infections and mortality based on DEIS [129]. Source: Authors.
RatioFunctionUnitRMSAraucania
InfectedAverageN° affected per 1000 people50.3144.26
Median49.4943.01
DS12.3210.12
Range25.59–77.5123.99–70.33
DeathsAverage1.570.61
Median1.450.55
DS0.640.21
Range 0.50–2.900.27–1.18
Publisher’s Note: MDPI stays neutral with regard to jurisdictional claims in published maps and institutional affiliations.