Article

Conceptual Model of Ecosystem Service Flows from Carbon Dioxide to Blue Carbon in Coastal Wetlands: An Empirical Study Based on Yancheng, China

Research Institute of Huai River Eco-Economic Belt, School of Urban and Environmental Sciences, Huaiyin Normal University, Huai’an 223300, China
Sustainability 2021, 13(9), 4630; https://doi.org/10.3390/su13094630
Submission received: 10 March 2021 / Revised: 17 April 2021 / Accepted: 20 April 2021 / Published: 21 April 2021

Abstract

:
Large amounts of blue carbon exist in the ecosystems of coastal wetlands. Accurate calculations of the stocks and economic value of blue carbon in various plant communities can facilitate vegetation rehabilitation. Based on this objective, first, a blue carbon estimation model was constructed by combining a Carnegie-Ames-Stanford Approach (CASA) model, and second, the distribution pattern of blue carbon and flow direction of ecosystem services (carbon sequestration) in a coastal wetland in China was analyzed utilizing a combination of field surveys, remote sensing data, and laboratory analysis techniques. Finally, the wetland carbon sequestration value and its income-expenditure status were measured using the carbon tax method. The results show that the aboveground net primary productivity of coastal wetland vegetation exhibits a non-zonal distribution in the south-north direction, whereas it presented a three-level gradient distribution, characterized as “low (200–300 g/m2∙y)–intermediate (300–400 g/m2∙y)–high (400–500 g/m2∙y)”, in the east-west direction. The accumulation of carbon gradually increased from the ground surface to the underground (litter < underground roots < soil) in Spartina alterniflora and Phragmites australis. On the type scale, Spartina alterniflora and Phragmites australis wetlands were of the “blue carbon” net outflow type (supply type), with mean annual outflow carbon sequestration values of 3272.3 $/ha and 40.9 $/ha, respectively. The Suaeda glauca wetland was of the “blue carbon” net inflow type (benefit type), with a mean annual inflow carbon sequestration value of 190.7 $/ha.

1. Introduction

Natural ecosystems have the function of providing food, water, air, habitat, and a series of ecological products or services for human beings and other natural organisms (referred to as ecosystem service function). An ecosystem service function can be directly or indirectly used by human beings to form ecosystem services [1,2]. An ecosystem service function depends on the maintenance and flow of ecological processes and their attributes in a specific time and space scale [3,4]. Therefore, a concept called ecosystem service flow has been proposed to represent the spatiotemporal relationship between ecosystem service supply areas and benefit areas [5,6], or it can be used to represent the number of ecosystem services used by beneficiaries [7]. The generation of ecosystem service flow is a biophysical process of multi-factor interaction [8,9,10]. A deep understanding of the concept and connotations of ecosystem service flow is helpful to further understand the spatiotemporal transfer process of ecosystem services [11,12], and it can provide a theoretical basis for coordinating human demand and management of ecosystem services [13,14,15].
Accurate calculations of the stocks and economic value of blue carbon in various plant communities can facilitate vegetation rehabilitation, which has the potential to mitigate increases in atmospheric carbon dioxide concentration. Given the increasingly prominent uncertainty of global climate change [16], the quantitative assessment of “blue carbon” storage capacity and the associated changes in coastal ecosystems have received increasing attention [17,18]. However, ecosystem service flows, such as blue carbon, with societal relevance may in practice be neglected or selectively addressed; many of them are related to sediment and the subsurface part of ecosystems [10]. According to the concept of ecosystem service flow, the process of vegetation absorbing carbon dioxide to form carbon sequestration value runs through the ecosystem service supply area and surrounding benefit area, so this process belongs to omnidirectional ecosystem service flow [19]. Currently, approximately 50% of the carbon on Earth is stored in the oceans. Thus, oceans and coastal zones play important roles in the global carbon cycle and realm of ecosystem services. Mangroves, salt marshes, and seagrass beds are typical coastal wetland ecosystems, in which the vegetation and soil store a considerable amount of “blue carbon” [20,21]. In certain conditions, such “blue carbon” may be released again into the atmosphere, making these ecosystems an important component of the land–sea carbon cycle [22]. Coastal wetlands are subjected to multiple effects from the site condition and land cover; their capacity for “carbon sequestration” and mutual conversion between “carbon source–carbon sink” exhibit complexity and uncertainty [23]. Thus, for the accurate quantification of “blue carbon” stocks in a given ecosystem, a necessary prerequisite is to clearly define the scope of the ecosystem and the depth of the sediment carbon pool, but the lack of relevant data is a major obstacle facing relevant work. A previous report, [24], conducted a quantitative analysis of the carbon pool and flux in “blue carbon” systems and noted substantial differences in the mean annual “carbon sequestration” rate among mangrove, salt marsh, and seagrass bed ecosystems. Based on further obtaining the carbon density data of seagrass beds, the dynamics of “blue carbon” sequestration in North America were estimated more rigorously in 2013, but the lack of accurate geospatial data is still the biggest obstacle in driving the market-oriented operation of “blue carbon” in this region.
Many studies have documented the spatial differences in the supply and demand of ecosystem services and proposed the concept of ecosystem service flows [5,6]. However, few empirical studies investigate the importance of abiotic flows on service provision [8]. Therefore, this paper aims to quantify the contribution of carbon sequestration ecosystem service flows for ambient areas based on plant community scale: a blue carbon estimation model was constructed by combining the Carnegie-Ames-Stanford Approach model [25,26], and we chose the Yancheng coastal wetlands, China, as an example to analyze the distribution pattern and flow direction of “blue carbon” in a coastal wetland parallel to the coastline, perpendicular to the coastline, and perpendicular to the ground surface. This paper’s main objective is to take the “carbon sequestration function-carbon sequestration value” transformation process of the coastal wetland as an example, further exploring the concept connotation and essence of ecosystem service flows. This paper’s secondary objective is to take the natural wetlands of Spartina alterniflora (S. alterniflora), Phragmites australis (P. australis), and Suaeda glauca (S. glauca) in the different zones as a reference and promote the continuous improvement of the awareness of plant diversity protection. These objectives were achieved based on the estimation models of vegetation net primary productivity (NPP), using a combination of remote sensing data and field sampling data.

2. Materials and Methods

2.1. Sampling Process

The boundary of the Yancheng National Nature Reserve, established in 1983, was regarded as the range of the study area of this paper (Figure 1). This area’s general ranges are bound by the seawall highway to the west, a 3 m isobath to the east, the Guanhe River to the north, and Dongtai County to the south. The study area is 45.33 × 10⁴ ha and consists of three basic functional zones as follows: the central core zone (CZ), whose landscape type was primarily coastal wetland plants such as Spartina alterniflora, Suaeda glauca, and Phragmites australis; a buffer zone (Southern Buffer Zone, SBZ; Northern Buffer Zone, NBZ) adjacent to each of the south and north wings of the core zone, whose landscape type was primarily river and freshwater lake; and an experimental zone (Southern Experimental Zone, SEZ; Northern Experimental Zone, NEZ) in each of the southern and northern parts of the buffer zone, whose landscape type was primarily constructed wetlands such as salt pans and paddy fields.
According to the blue carbon standard protocol, blue carbon soil is commonly sampled down to min of 100 cm [27]. The sampling process of this paper does not follow the standard protocol for blue carbon in assessing blue carbon, which consists of sampling the sediment and designing the plots, etc., before jumping into NPP analysis. The reason for this is that, considering the great interference of vegetation types caused by human activities since 2002 in the study area, it is difficult to determine the blue carbon source of columnar soil samples more than 30 cm from the surface. Therefore, this paper referred to the previous research results and, according to the modern deposition rate of less than 2 cm per year in the study area [28], developed the sampling method.
In a direction perpendicular to the ground surface, the distribution of “blue carbon” in different plant communities of a coastal wetland was obtained by vegetation and soil surveys. Field samples were collected (August 2017) as follows: a relatively continuous succession sequence of S. alterniflora-S. glauca-P. australis-rice was selected in the NEZ, NBZ, SBZ, and SEZ (Figure 1d), and five transects (T1, T2, T3, T4, and T5) were set up at random. According to the plant community type, four plots were set in each transect using a 1 m × 1 m sampling frame (from sea to land: bare mudflat without vegetation, S. alterniflora, S. glauca, and P. australis); the geographical coordinates and altitudes of the sampling points were recorded using a satellite positioning system. After the number of plants in each plot was recorded, the litters in the sampling frame were collect and the plants were harvested from the ground level; the plant heights and wet weights were then measured (five plants were harvested in the center and the four corners of each plot to minimize the destruction of vegetation). The roots and soils were dug up with a sampling shovel (the depth is 30 cm), and the samples were sealed in sampling bags, labeled, and delivered to the laboratory for analysis.
Samples of pretreated soils (500 g) were sent to a professional organization for testing (volume weight and total organic carbon content of soil), and the remaining samples were stored in a refrigerator at 4 °C until use. The shoots, litters, and roots were naturally dried until there were no changes in the weight, and then shoot biomass and root biomass of different plant types were measured using an electronic balance. Finally, the model parameters are calculated according to the measured values, and the results are shown in Table 1.

2.2. Analysis Methods

At present, ecosystem service flow has been proposed as an important concept [5,6]. In this paper, we use it to refer to the transmission of services from ecosystems to people, for example: from carbon dioxide to blue carbon in coastal wetlands, a complete carbon sequestration ecosystem service flow should begin with the photosynthesis of plants, so the net primary productivity of vegetation should be included in the concept of ecosystem service flow; at the same time, it is assumed that the accumulation of soil organic carbon (SOC) in the surface soil of the community comes from dry matter formed by the decomposition of plant litter and underground roots inside and outside the community. Based on the above two hypotheses, the following model is constructed:
First, remote sensing data were used to estimate the aboveground NPP of vegetation in directions parallel and perpendicular to the coastline. A modified light use efficiency model [26] was used to estimate the aboveground NPP of vegetation, with a combination of climate (mean monthly temperature and rainfall data derived from http://data.cma.cn/, (accessed on 1 September 2017) and vegetation (Vegetation Classification and Normalized Difference Vegetation Index (NDVI), Landsat data derived from www.gscloud.cn, (accessed on 1 September 2017) characteristics in the study area:
NPPa(x,t) = APAR(x,t) × ε(x, t)
where NPPa is the mean of the NPPa in August (the biomass was highest at this time; g∙m−2∙y−1); t is the time; x is the spatial unit; APAR(x, t) is the photosynthetically active radiation adsorbed by unit x at time t; and ε(x, t) is the actual light use efficiency in unit x at time t.
Next, according to the photosynthetic reaction equation, green plants can sequestrate 0.44 g of “blue carbon” for every 1 g of dry matter produced, whereas they need to absorb 1.62 g of CO2. On this basis, we calculated the coastal wetland “carbon sequestration” value using the carbon tax factor:
WCD = NPP × 1.62
WBC = WCD × 0.27
VC = WCD × c
where WCD is the carbon dioxide sequestration capacity (g∙m−2∙y−1); WBC is the “blue carbon” accumulation (g∙y−1); c is the carbon tax rate and unit conversion factor (in this paper, $136∙t−1 according to the latest carbon tax issued by the World Bank); and VC is the carbon sequestration value ($∙ha−1∙y−1).
In addition, the vegetation and soil data acquired by the field survey were used to estimate the surface and underground dry mass of different community types in a direction perpendicular to the ground surface in addition to the mean annual accumulation of “blue carbon” in the soil using the following equations; then, the blue carbon circulation of a closed carbon pool is judged:
NPPs = NPPa × (Ws/Wa)
NPPu = NPPa × (Wu/Wa)
BC_flow = a × (NPPs + NPPu) − SOC
SOC = soc × ρ × a × h
where NPPs and NPPu are the simulated values of the surface and underground dry mass of plants, respectively (g∙m−2∙y−1); Ws is the measured value of the surface litter weight; Wa is the measured value of the aboveground dry weight of plants; Wu is the measured value of the underground dry weight of plants (g∙m−2, measured underground/aboveground dry weight, i.e., root-shoot ratio); BC_flow represents the amount of blue carbon in (BC_flow < 0) or out (BC_flow > 0) of the carbon pool (g∙m−2∙y−1); SOC is the annual accumulation of soil organic carbon (g∙y−1); soc is the carbon sequestration capacity (g∙kg−1); ρ, a, and h are the soil bulk density (kg∙m−3), area (m2), and depth (m, assuming a uniform distribution of organic carbon in the soil surface), respectively.
This paper also tested the visualizing multivariate spatial correlation between NPP and NDVI by Arc GIS 10.0; the Bivariate Moran’s I statistic is represented as the values of NDVI across all neighboring units and plotted against NPP in each unit [29]; if the slope on the scatter plot is significantly different to zero then there is an association between NPP and NDVI.

3. Results

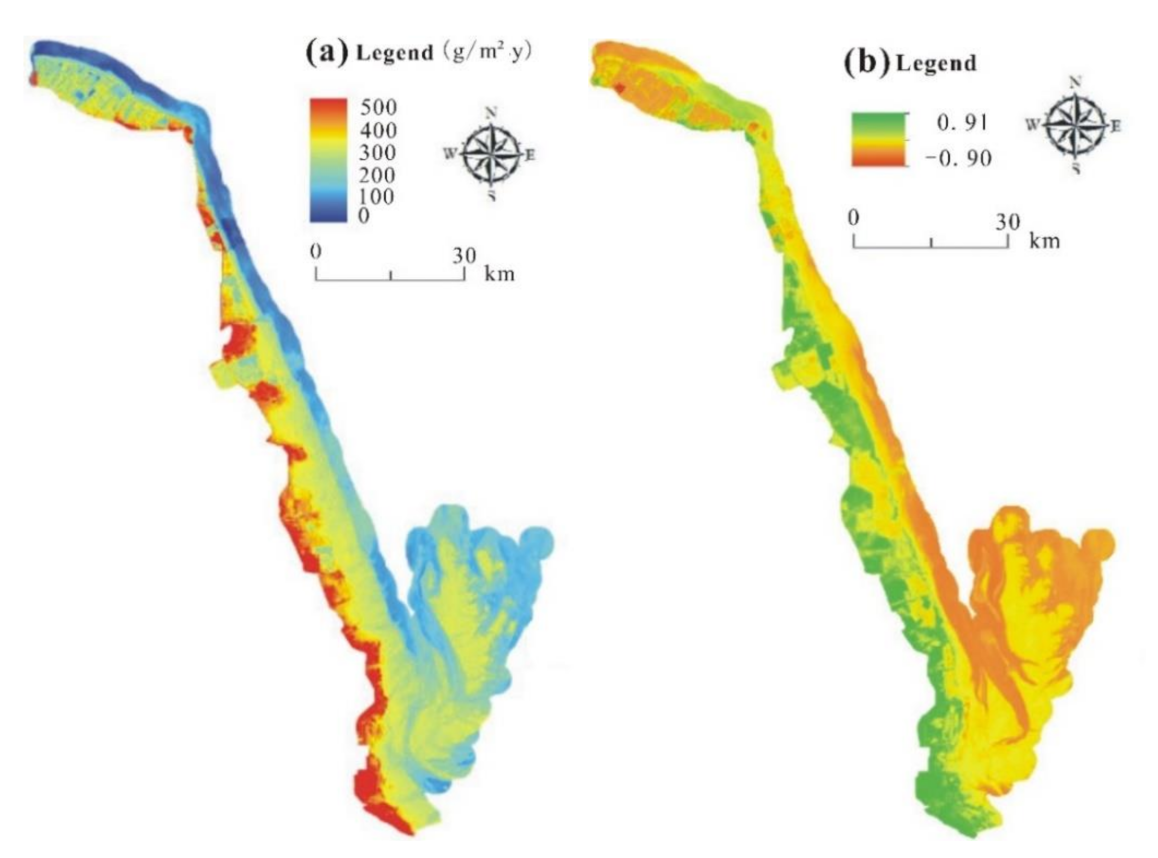
3.1. The Horizontal Distribution Pattern of Aboveground Vegetation NPP in the Study Area

As Figure 2a shows, in the direction perpendicular to the coastline (east-west), the two-dimensional distribution of vegetation NPP in the study area presents three belts that gradually decrease from the landside (overall between 400 and 500 g∙m−2∙y−1) to the seaside (generally between 200 and 300 g∙m−2∙y−1).
By comparing vegetation NPP and NDVI (Figure 2b), we found a significant (p < 0.01) spatial correlation (Bivariate Morans’ Index = +0.9803) between their two-dimensional distribution patterns in the horizontal direction. In the study area, the low-NDVI zone was primarily distributed on the seaside, with minimum values between −0.90 and −0.48; the high-NDVI zone was primarily located on the landside, which, overall, is consistent with the spatial locations of paddy fields, with maximum values between 0.51 and 0.91. There was a mean-value zone between the low-value and high-value zones, wherein the vegetation type was dominated by S. alterniflora, P. australis, and S. glauca. Figure 2a presents minor differences in the aboveground NPP among these communities (between 300 and 400 g/m2∙y). With regard to the direction parallel to the coastline (south-north), the south-north differentiation was significantly lower than the east-west difference in all three gradients. This suggests that vegetation cover type played a leading role in influencing NPP compared with mean monthly rainfall and temperature (the three basic parameters in Equation (1) were the mean August rainfall, mean August temperature, and NDVI).

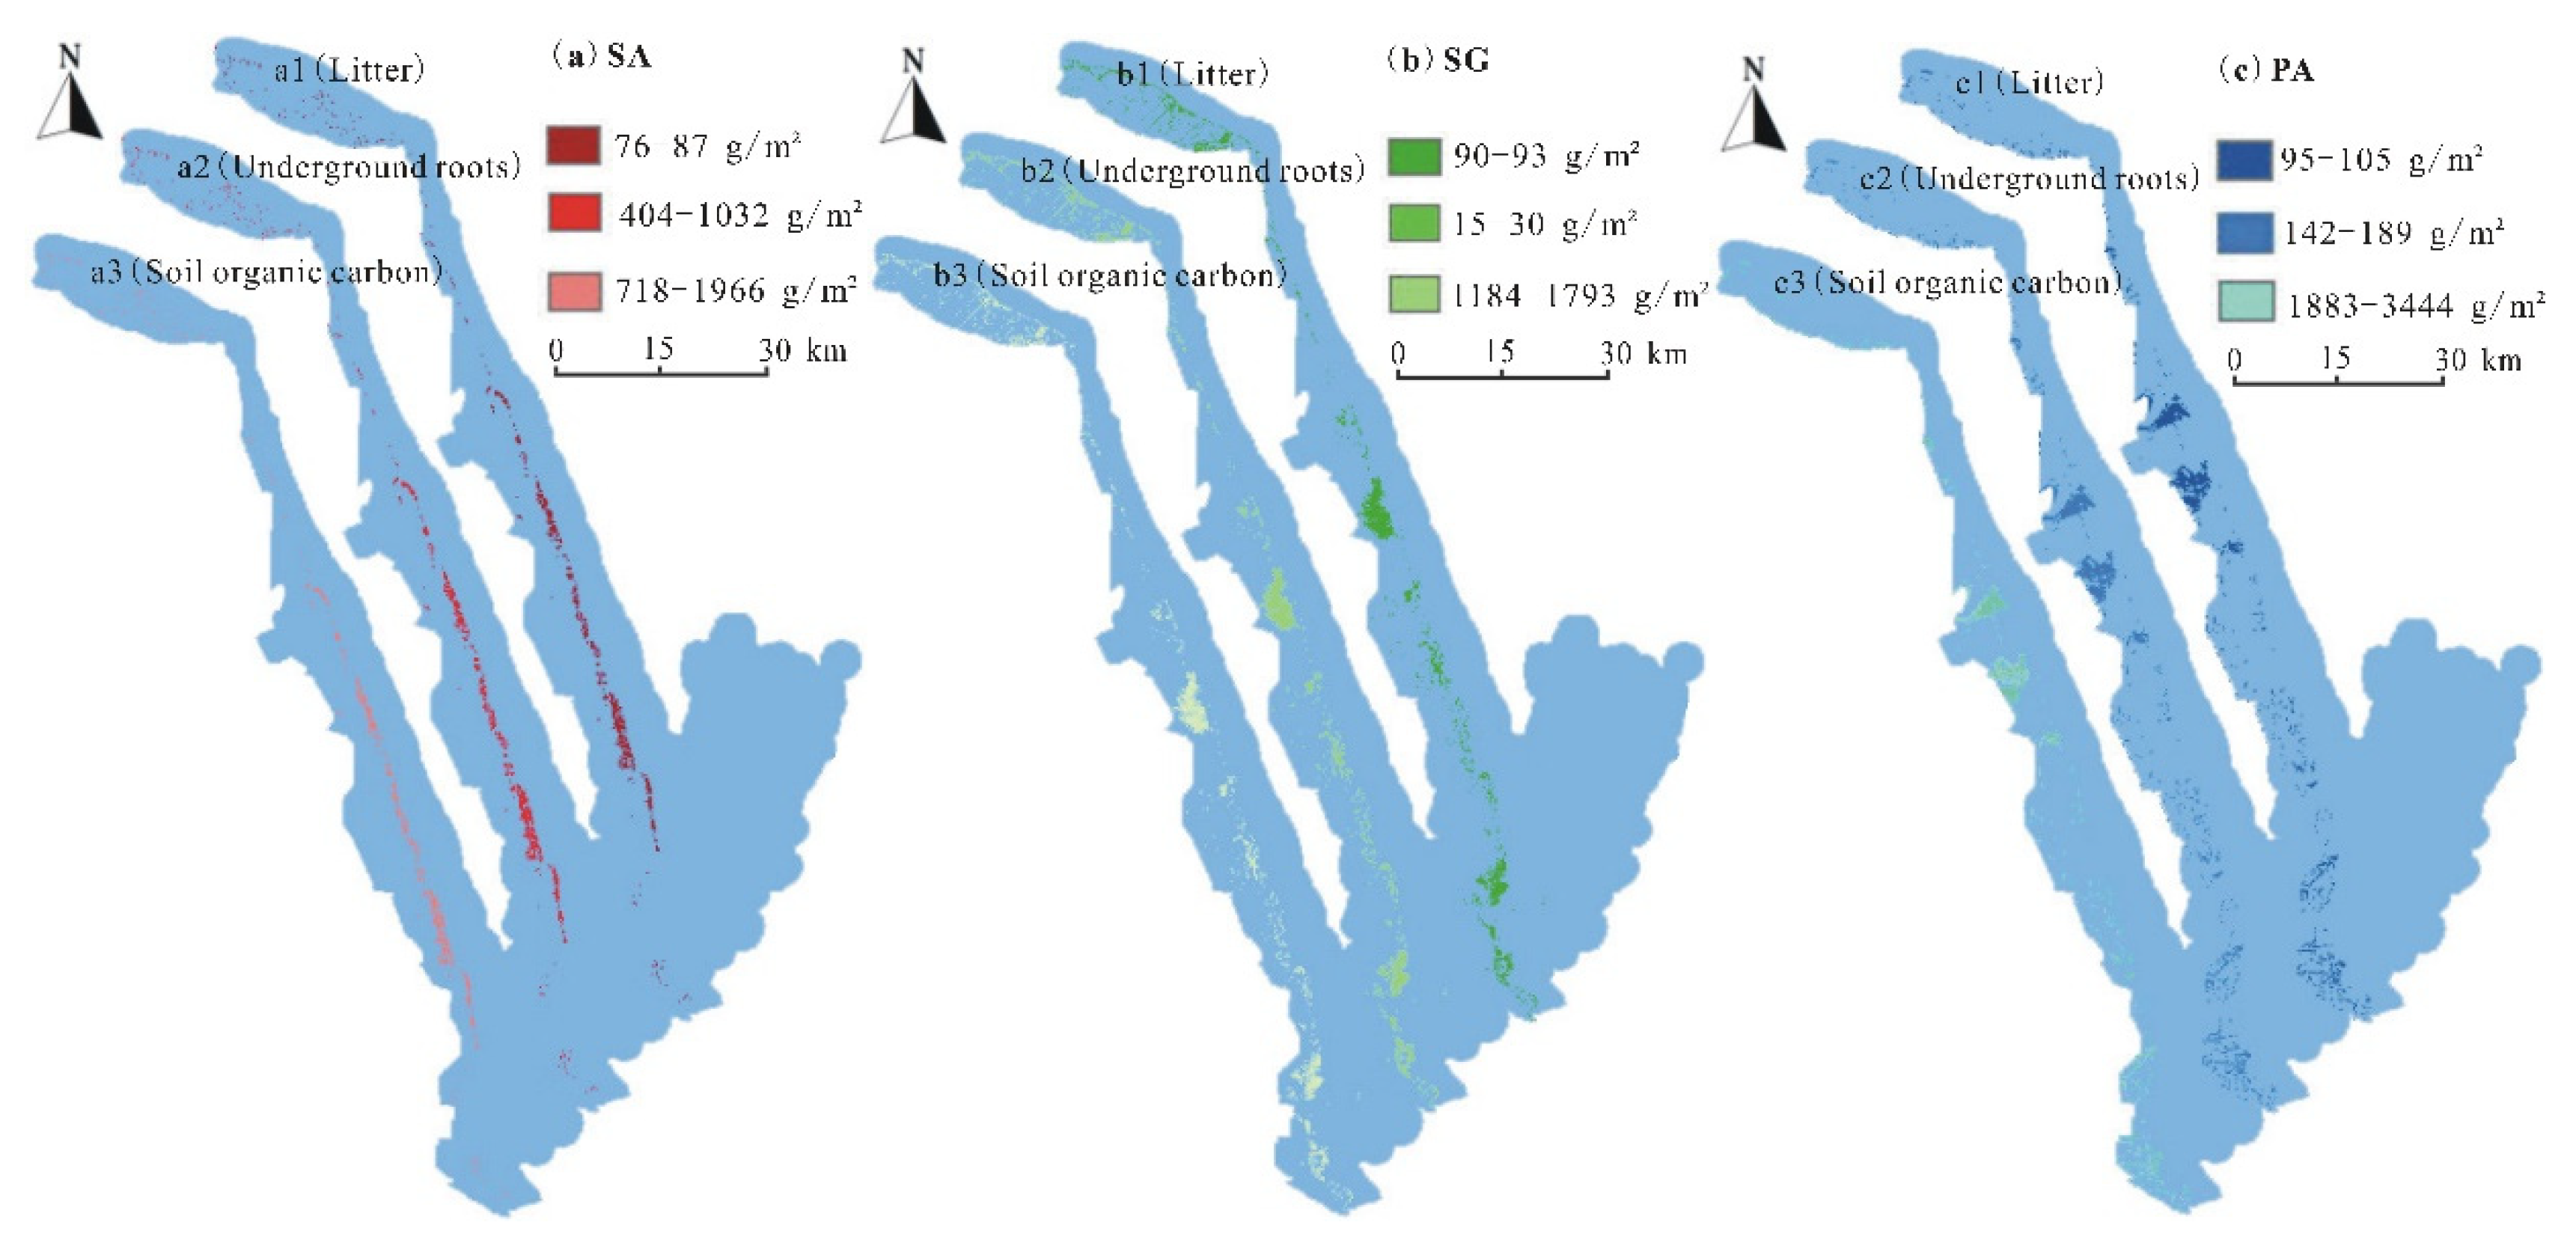
3.2. The Perpendicular Distribution Pattern of Blue Carbon in the Study Area

Figure 3 shows the three-dimensional distribution pattern of “blue carbon” in S. alterniflora, S. glauca, and P. australis. The carbon contents in plant litter and underground roots and the carbon accumulation in the surface soil successively increased in the S. alterniflora and P. australis communities. However, in the S. glauca community, the carbon content in the litter was higher than that in the underground roots. In terms of the carbon content in the litter, S. glauca and P. australis ranked higher than S. alterniflora. This may be attributable to the relatively low water content in S. glauca and P. australis plants (given the relatively low frequency of tidal intrusion in the S. glauca and P. australis communities, their aboveground parts are more likely to fall compared with those of S. alterniflora). In terms of the carbon content in the underground roots, S. alterniflora communities ranked higher than S. glauca and P. australis communities. This may also be related to the life history of S. alterniflora, which are submerged in water long term. To improve root stability, S. alterniflora has more developed lateral roots. Among the different communities, the carbon accumulation in surface soil was significantly higher than the carbon contents in plant litter and underground roots. Regarding the within-community difference, S. alterniflora (718–1966 g∙m²) and S. glauca (1184–1793 g∙m²) exhibited lower differences, whereas P. australis (1883–3444 g∙m²) exhibited higher differences.

3.3. Carbon Sequestration Capacity and Carbon Sequestration Value

Figure 4 shows the annual profit and loss of carbon pools of different vegetation communities: S. alterniflora and P. australis belong to the net blue carbon outflow wetland, where the blue carbon supply from the community is higher than the annual SOC accumulation, and the annual carbon sink outflow value is 3272.3 $/ha, 40.9 $/ha and 1947.2 $/ha, respectively. In contrast, S. salsa belongs to the blue carbon net inflow wetland. The blue carbon supply from the community is lower than the average annual SOC accumulation, and the average annual carbon sink inflow value is 190.7 $/ha.
The above results indicated that there were differences in carbon sequestration function and carbon sequestration value among different communities, which were not only related to the biomass allocation proportion of different parts of plants but also the hydrodynamic conditions and the closure degree of carbon pools in communities. For example, the roots of Spartina alterniflora in a relatively humid environment are more easily decomposed into organic carbon and transferred to the surrounding communities under the action of higher tidal invasion frequency, especially into bare beaches with a close niche. On the contrary, the frequency of Phragmites australis and Suaeda salsa were relatively low, so the relatively closed carbon pool was not conducive to litter transfer, resulting in a relatively low blue carbon exchange capacity between the two and the surrounding communities.

4. Discussion

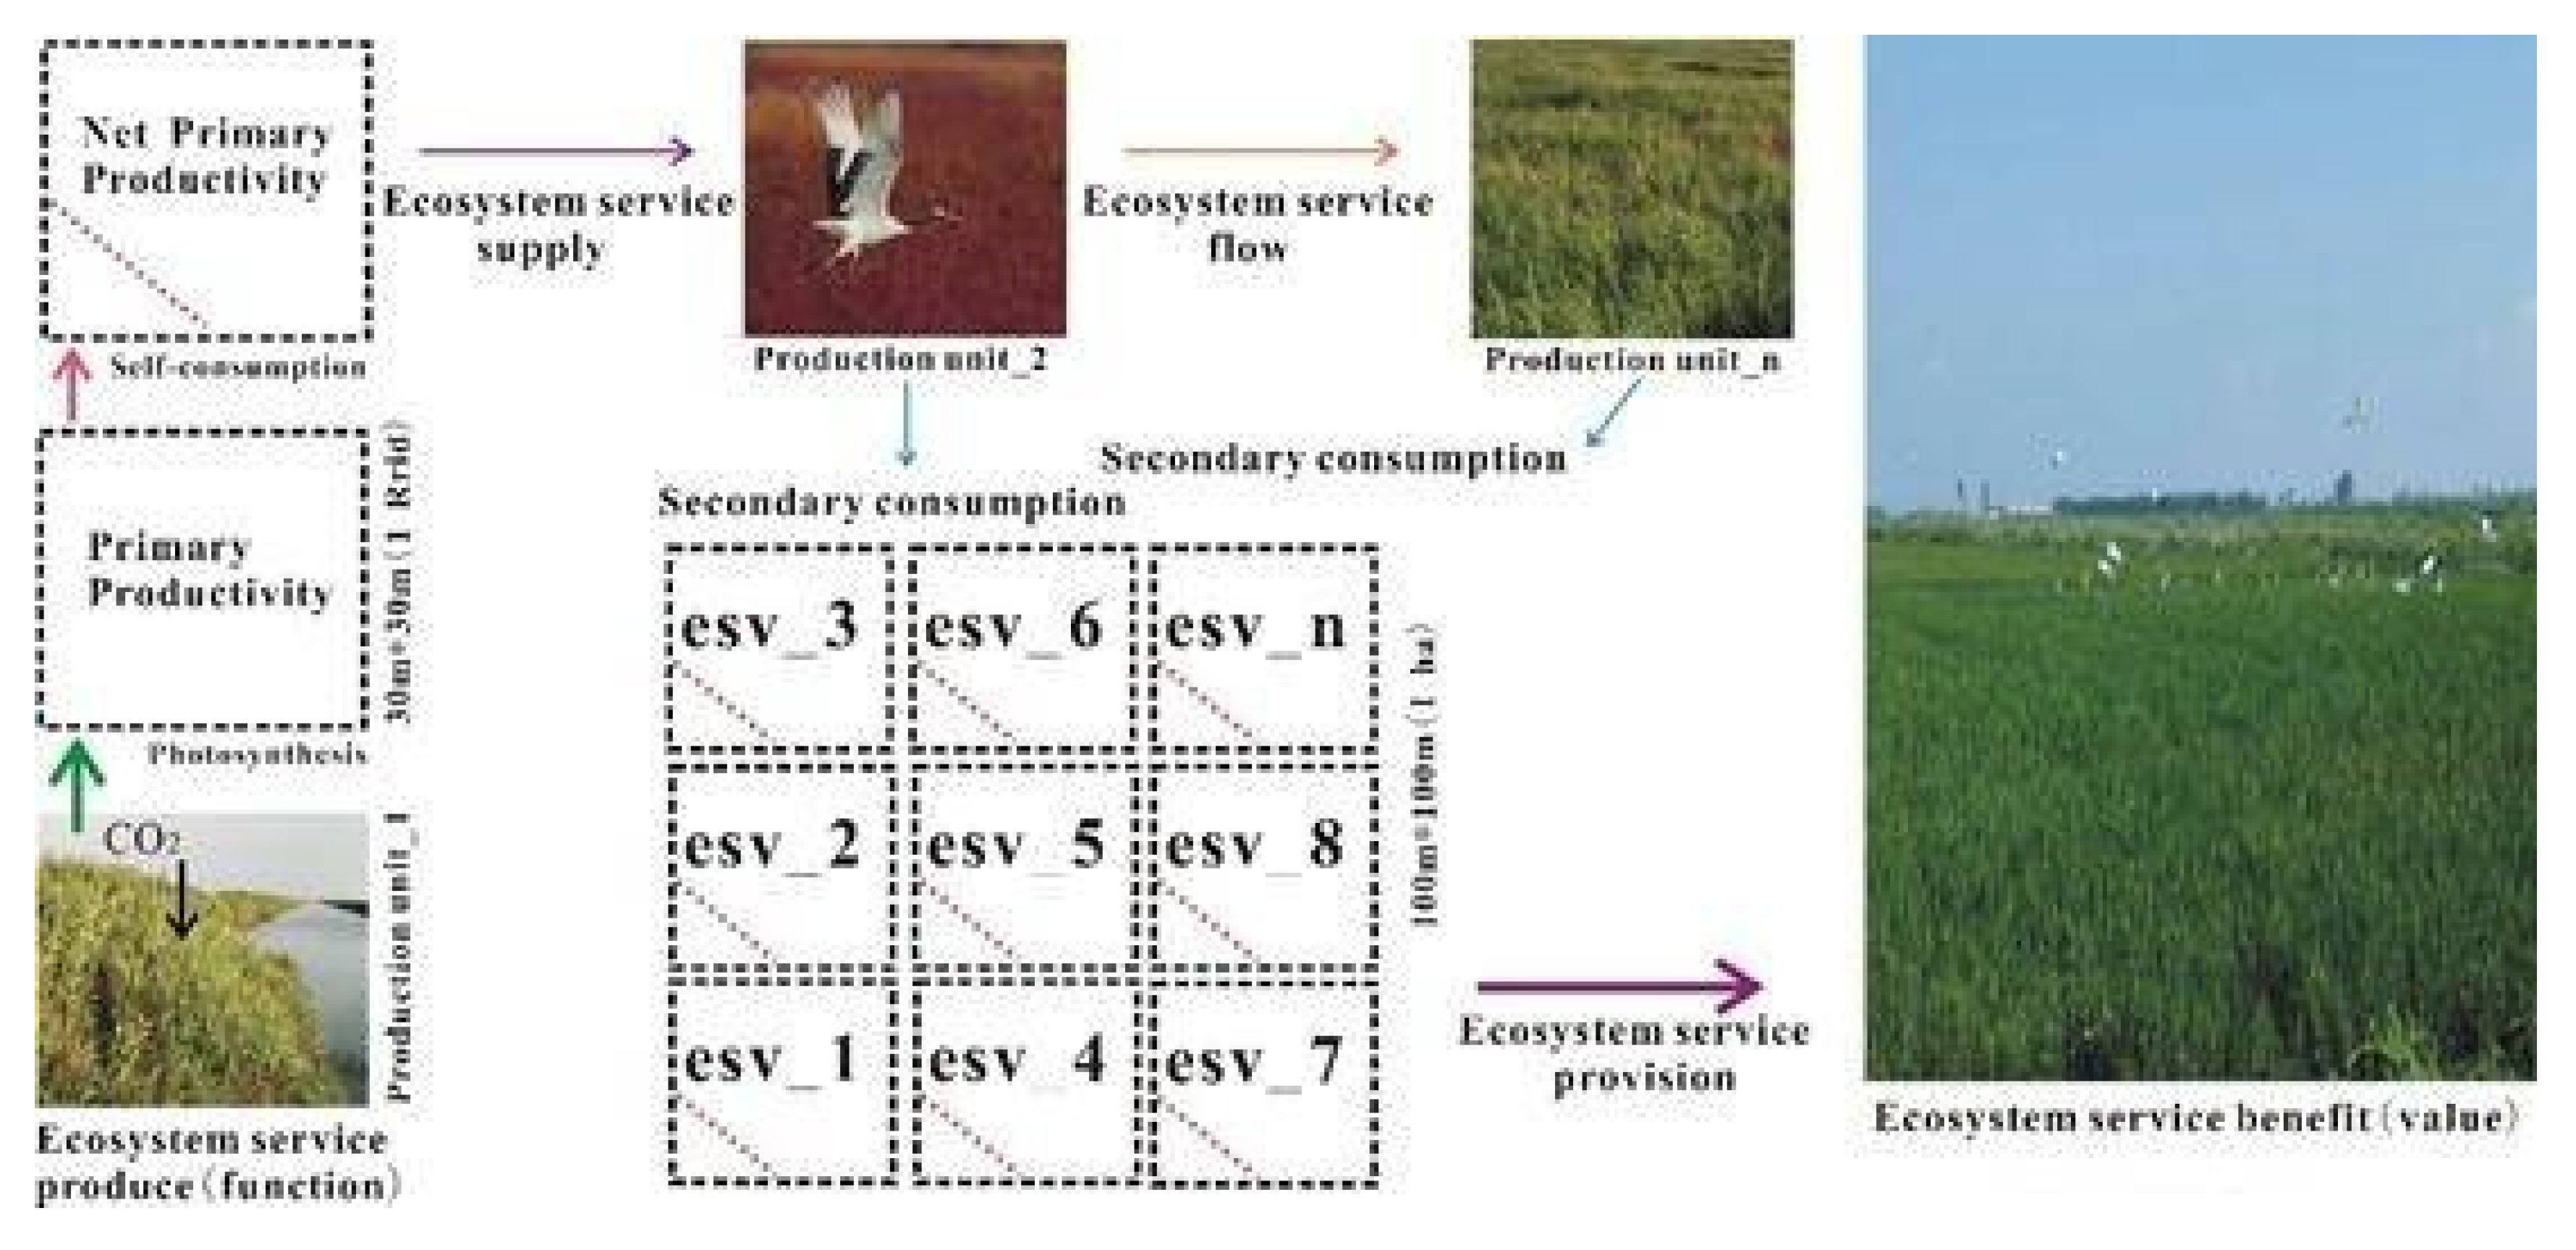
4.1. The Conversion Process of the “Ecosystem Services Function-Ecosystem Services Value”

Beneficiaries are largely disregarded or only mentioned in ecosystem service assessments related to protected areas [11]. Thus, we propose an analytical framework for identifying potential beneficiaries on the community level, focusing on carbon sequestration ecosystem services. This paper further integrates the concept of ecosystem service flow into the “production supply benefit process of ecosystem services”. Its essence is the value transformation process of ecosystem service function in the natural human complex ecosystem, as shown in Figure 5.
Vegetation net primary productivity (NPP) is the difference between the total primary productivity of green plants acquired by photosynthesis and consumption by autotrophic respiration, which indicates the material production capacity of plants in natural conditions. In Figure 5, each plant community can be regarded as an independent system consisting of many production units. The vegetation performs primary production through photosynthesis, and NPP is produced after subtraction of self-consumption by individual components. Subsequently, the energy produced by each production unit through vegetation NPP circulates in different units in the form of ecosystem service value, and some of the energy is consumed again by the plants in other units. Eventually, the residual energy following secondary consumption is consumed and utilized by humans, achieving regional microclimate regulation of the coastal wetland.
Vegetation NPP is a basic guarantee for the energy required for plant growth, development, and reproduction; it is also a material basis for the survival and reproduction of other biological components in the ecosystem and provides energy for different ecosystem types to implement their service functions. In this paper, the value of blue carbon is the monetary expression of coastal wetland’s “carbon fixation” function, so this process is also the embodiment of ecosystem service function and its value of the “production supply benefit” path, implying the regional contribution of coastal wetland microclimate regulation in response to global climate change. Concerning the spatial process of the formation of a “carbon sequestration value”, it is a comprehensive process formed by continuous accumulation. Before the contribution of “carbon sequestration” reaches an extreme value the following year (here, we assume the maximum value is achieved in August every year), the “blue carbon” in vegetation, on the one hand, transfers from the ground to the underground (Self-Consumption), and on the other hand, transfers in different vegetation units and communities (Supply and Consumption), eventually forming a three-dimensional distribution pattern of the coastal wetland carbon sequestration value in horizontal and perpendicular directions.
The ecosystem services concept, at its very foundation, is human-centric: if ecosystem services are not directly received by people, they simply cannot be valued. Yet artificial land use does not equate to ecosystem service provisioning [30]. Therefore, we are still dealing with nature-based solutions for the ecological services of coastal wetlands. What needs to be pointed out is even if a landscape is maintained in a semi-pristine state, there are several presumed ecosystem services that it does not provide: e.g., we still cannot confirm with any confidence that P. australis ecosystems serve as long-term carbon sinks. Therefore, before considering how the research results support the formulation and implementation of ecosystem services policies, we must consider the following two issues: repeating the research at annual intervals, taking into account the average weather conditions for a given location, would extend the horizon of the considered carbon sequestration; additionally, the Carnegie-Ames-Stanford Approach (CASA) model has been widely used for terrestrial ecosystems but not for wetlands. The study area of this paper has high vegetation coverage and rich vegetation types. Therefore, we try to use the CASA model to carry out empirical research, and this method is supported by the results presented in the previous studies [25]. Although the research results have reference value to the vegetation restoration policies of analogous coastal wetlands, it needs long-term monitoring. However, this requires a longer time perspective for the research. In the future, we will continue to carry out more in-depth research work around this area.

4.2. Uncertainty Analysis of Carbon Cycle in Coastal Wetland

In this paper, we only discuss the transformation process on the carbon sequestration capacity of coastal wetland vegetation and its value from the spatial perspective of ecosystem service flow. It should be noted that an ecosystem is composed of organisms and their surrounding environment. The respiration of the ecosystem and the gas exchange process between organisms and their external environment are complex [23,31,32]. Spatial differentiation in tidal intrusion frequency, wetland flooding duration, plant density and cover, and soil physical and chemical properties [33] could result in uncertainty in a wetland’s carbon cycle process. Therefore, the quantitative evaluation results of the “carbon sequestration” capacity of different vegetation types presented in this study may deviate from the actual situation.
First, with reference to the mean NPP across the study area (the average value of the raster in the study area was calculated using the map algebra function of Arc GIS 10.0), our results ranged from 282.45 to 350 g/m2∙y, which were lower than the mean level of vegetation NPP in the coastal wetlands of China during 1989–1993 (375.4 g/m2∙y), as estimated by [26] using the same model. Overall, our results were also slightly lower than the mean levels of vegetation NPP in Yancheng during the same period (742.2–896.1 g/m2∙y), as estimated by [34]. This may be attributed to the inclusion of a bare flat with relatively low NPP in our study area.
Secondly, the aboveground NPP exhibited non-zonal distribution in the south-north direction. At the global or regional scale, the zonal distribution patterns of vegetation and soil are primarily influenced by solar radiation (temperature) and land-sea location (rainfall) [35,36]. The results presented in Figure 2 show that at medium-to-small scales (time or space), land use and cover change (LUCC) might influence vegetation NPP more significantly. Human activities such as paddy field cultivation and aquaculture could lead to a drastic change in the “blue carbon” pattern of coastal wetlands.
Additionally, the carbon accumulation in surface soil was lower overall in the S. alterniflora and S. glauca communities compared with the P. australis communities. First, this may be directly related to the aboveground NPP of plant communities, since the higher aboveground NPP of P. australis communities more easily promote the transfer of carbon into the soil. Second, this may be attributed to the influence of a low altitude and steep slope (S. alterniflora and S. glauca on the seaside), as well as frequent human disturbance (P. australis on the landside), and this may be associated with the degree of depletion of the carbon pools in the communities [37]. For example, the S. alterniflora community is located in the low-tide zone, where a high frequency of tidal intrusion contributes to the loss of carbon in the soil.

5. Conclusions

Vegetation NPP has an indicative effect on LUCC, the global environment, and climate change. The restoration and expansion of coastal wetland vegetation are important approaches to cope with sea-level rise. In this paper, we analyzed the aboveground NPP of coastal wetland vegetation in Yancheng, China, based on the geographic information system and remote sensing models. The three-dimensional distribution pattern of “blue carbon” in a coastal wetland was revealed using field survey data of soil and vegetation. The carbon sequestration value of different wetland types was calculated using the carbon tax method. On this basis, we defined and discussed the “carbon sequestration capacity–carbon sequestration value” conversion process and the potential influence of LUCC on the coastal wetland carbon cycle. The conclusions are as follows:
  • The aboveground NPP of coastal wetland vegetation exhibited gradient changes from low to high or from high to low in a direction perpendicular to the coastline. Using the light use efficiency model, we obtained an aboveground NPP of coastal wetland vegetation that ranged between 200 and 500 g/m2∙y in Yancheng, China.
  • The “blue carbon” in coastal wetland vegetation showed a three-dimensional distribution pattern. The “blue carbon” content of P. australis and S. alterniflora communities gradually increased from the ground surface to the underground area (litter < underground roots < soil) in Yancheng, China. The surface soil of each plant community contained a higher content of “blue carbon” compared with the aboveground shoots, litter, and underground roots.
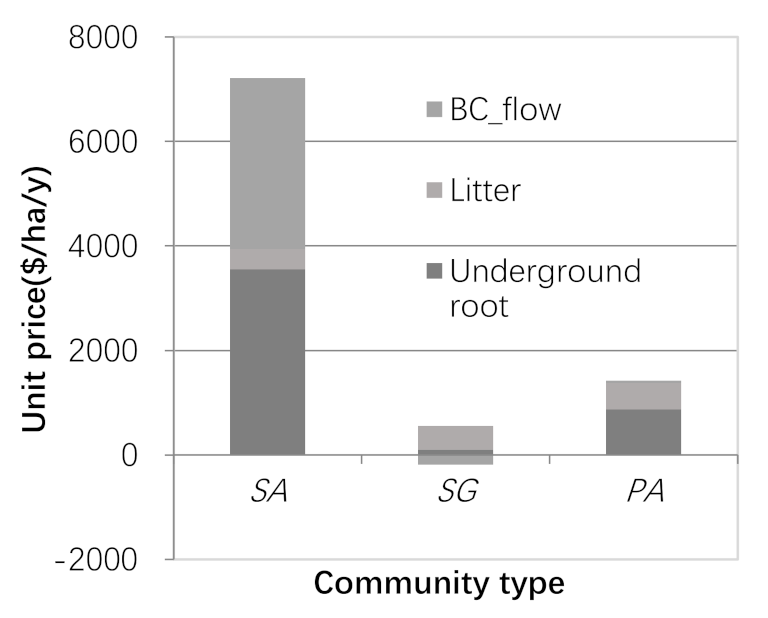
  • Coastal wetlands absorb carbon dioxide and convert black carbon to blue carbon, which is of great significance to the regulation of regional microclimates. This process reflects the conceptual essence of ecosystem service flow from ecosystem service function to ecosystem service value. In Yancheng, China, Phragmites australis and Spartina alterniflora belong to the blue carbon supply type coastal wetland, with an average annual outflow carbon sequestration value of 40.9 $∙ha−2 and 3272.3 $∙ha−2, while Suaeda salsa (8024 $∙ha−2∙y−1) belongs to the blue carbon benefit coastal wetland, and the annual inflow carbon sequestration value is 190.7 $∙ha−2.

Funding

The study was supported by the Project of Philosophy and Social Science Research Foundation in Colleges and Universities in Jiangsu Province (2020SJA1785).

Institutional Review Board Statement

Not applicable.

Informed Consent Statement

Not applicable.

Data Availability Statement

Please contact the corresponding author.

Acknowledgments

The author would like to thank Muhammad Adnan and Yuqing Zhang for their English language editing work on this paper.

Conflicts of Interest

The author declares no conflict of interest.

References

  1. Sun, C.Z.; Wang, S.; Zou, W. Chinese marine ecosystem services value: Regional and structural equilibrium analysis. Ocean Coast. Manag. 2016, 125, 70–83. [Google Scholar] [CrossRef]
  2. Zang, Z.; Zou, X.Q.; Zuo, P.; Song, Q.C.; Wang, C.L.; Wang, J.J. Impact of landscape patterns on ecological vulnerability and ecosystem service values: An empirical analysis of Yancheng Nature Reserve in China. Ecol. Indic. 2017, 72, 142–152. [Google Scholar] [CrossRef]
  3. Hillebrand, H.; Matthiessen, B. Biodiversity in a complex world: Consolidation and progress in functional biodiversity research. Ecol. Lett. 2009, 12, 1405–1419. [Google Scholar] [CrossRef]
  4. Díaz, S.; Cabido, M. Vive la différence: Plant functional diversity matters to ecosystem processes. Trends Ecol. Evol. 2001, 16, 646–655. [Google Scholar] [CrossRef]
  5. Bagstad, K.J.; Johnson, G.W.; Voigt, B.; Villa, F. Spatial dynamics of ecosystem service flows: A comprehensive approach to quantifying actual services. Ecosyst. Serv. 2013, 4, 117–125. [Google Scholar] [CrossRef]
  6. Serna-Chavez, H.M.; Schulp, C.J.; Bodegom, P.M.; Bouten, W.; Verburg, P.H.; Davidson, M.D. A quantitative framework for assessing spatial flows of ecosystem services. Ecol. Indic. 2014, 39, 24–33. [Google Scholar] [CrossRef] [Green Version]
  7. Jones, L.; Norton, L.; Austin, Z.; Browne, A.L.; Donovan, D.; Emmett, B.A. Stocks and flows of natural and human-derived capital in ecosystem services. Land. Use Policy 2016, 52, 151–162. [Google Scholar] [CrossRef]
  8. Mitchell, M.G.; Bennett, E.M.; Gonzalez, A. Linking landscape connectivity and ecosystem service provision: Current knowledge and research gaps. Ecosystems 2013, 16, 894–908. [Google Scholar] [CrossRef]
  9. Luck, G.W.; Harrington, R.; Harrison, P.A. Quantifying the contribution of organisms to the provision of ecosystem services. BioScience 2016, 59, 223–235. [Google Scholar] [CrossRef]
  10. van der Meulen, E.S.; Braat, L.C.; Brils, J.M. Abiotic flows should be inherent part of ecosystem services classification. Ecosyst. Serv. 2016, 19, 1–5. [Google Scholar] [CrossRef]
  11. Schirpke, U.; Scolozzi, R.; De Marco, C.; Tappeiner, U. Mapping beneficiaries of ecosystem services flows from Natura 2000 sites. Ecosyst. Serv. 2014, 9, 170–179. [Google Scholar] [CrossRef]
  12. Gopal, B. A conceptual framework for environmental flows assessment based on ecosystem services and their economic valuation. Ecosyst. Serv. 2016, 21, 53–58. [Google Scholar] [CrossRef]
  13. Villamagna, A.M.; Angermeier, P.L.; Bennett, E.M. Capacity, pressure, demand, and flow: A conceptual framework for analyzing ecosystem service provision and delivery. Ecol. Complex. 2013, 15, 114–121. [Google Scholar] [CrossRef]
  14. Baró, F.; Palomo, I.; Zulian, G. Mapping ecosystem service capacity, flow and demand for landscape and urban planning: A case study in the Barcelona metropolitan region. Land. Use Policy 2016, 57, 405–417. [Google Scholar] [CrossRef] [Green Version]
  15. Lukas, E.V.; Daniel, D.; Paulo, P. Mapping the ecosystem service delivery chain: Capacity, flow, and demand pertaining to aesthetic experiences in mountain landscapes. Sci. Total Environ. 2017, 574, 422–436. [Google Scholar]
  16. Ullman, R.; Bilbao-Bastida, V.; Grimsditch, G. Including Blue Carbon in climate market mechanisms. Ocean Coast. Manag. 2013, 83, 15–18. [Google Scholar] [CrossRef]
  17. Macreadie, P.I.; Hughes, A.R.; Kimbro, D.L. Loss of ‘blue carbon’ from coastal salt marshes following habitat disturbance. PLoS ONE 2013, 8, e69244. [Google Scholar] [CrossRef]
  18. Gao, Y.; Yu, G.R.; Yang, T.T.; Jia, Y.L.; He, N.P.; Zhuang, J. New insight into global blue carbon estimation under human activity in land-sea interaction area: A case study of China. Earth Sci. Rev. 2016, 159, 36–46. [Google Scholar] [CrossRef]
  19. Fisher, B.; Turner, R.K.; Morling, P. Defining and classifying ecosystem systems service for decision making. Ecol. Econ. 2009, 68, 643–653. [Google Scholar] [CrossRef] [Green Version]
  20. Mcleod, E.; Chmura, G.L.; Bouillon, S.; Salm, R.; Björk, M.; Duarte, C.M. A blueprint for blue carbon: Toward an improved understanding of the role of vegetated coastal habitats in sequestering co2. Front. Ecol. Environ. 2011, 9, 552–560. [Google Scholar] [CrossRef] [Green Version]
  21. Grimsditch, G.; Alder, J.; Nakamura, T.; Kenchington, R.; Tamelander, J. The blue carbon special edition—Introduction and overview. Ocean Coast. Manag. 2013, 83, 1–4. [Google Scholar] [CrossRef]
  22. Chmura, G.L.; Anisfeld, S.C.; Cahoon, D.R.; Lynch, J.C. Global carbon sequestration in tidal, saline wetland soils. Glob. Biogeochem. Cycles 2003, 17. [Google Scholar] [CrossRef]
  23. Pendleton, L.; Donato, D.C.; Murray, B.C.; Crooks, S.; Jenkins, W.A.; Sifleet, S.; Craft, C.; Fourqurean, J.W.; Kauffman, J.B.; Marba, N.; et al. Estimating global “blue carbon” emissions from conversion and degradation of vegetated coastal ecosystems. PLoS ONE 2012, 7, e43542. [Google Scholar] [CrossRef] [PubMed] [Green Version]
  24. Sifleet, S.; Pendleton, L.; Murray, B.C. State of the Science on Coastal Blue Carbon: A Summary for Policy Makers. Nicholas Institute for Environmental Policy Solutions. Ph.D. Thesis, Duke University, Durham, NC, USA, 2011. [Google Scholar]
  25. Bian, J.H.; Li, A.N.; Deng, W. Estimation and analysis of net primary productivity of Ruoergai wetland in China for the recent 10 years based on remote sensing. Procedia Environ. Sci. 2010, 2, 288–301. [Google Scholar] [CrossRef] [Green Version]
  26. Zhu, W.Q.; Pan, Z.Y.; He, H.; Yu, D.Y.; Hu, H.B. Simulation of maximum light use efficiency for some typical vegetation types in China. Chin. Sci. Bull. 2006, 51, 457–463. [Google Scholar] [CrossRef]
  27. Howard, J.; Hoyt, S.; Isensee, K.; Pidgeon, E.; Telszewski, M.E. Coastal Blue Carbon: Methods for Assessing Carbon Stocks and Emissions Factors in Mangroves, Tidal Salt Marshes, and Seagrass Meadows; Conservation Int.; Intergovernmental Oceanographic Commission of UNESCO; Int. Union for Conservation of Nature: Rome, Italy, 2014; p. 181. [Google Scholar]
  28. Zang, Z. Analysis of intrinsic value and estimating losses of “blue carbon” in coastal wetlands: A case study of Yancheng, China. Ecosyst. Health Sustain. 2019, 5, 216–225. [Google Scholar] [CrossRef]
  29. Hu, Z.Y.; Baker, E. Geographical Analysis of Lung Cancer Mortality Rate and PM2.5 Using Global Annual Average PM2.5 Grids from MODIS and MISR Aerosol Optical Depth. J. Geosci. Environ. Prot. 2017, 5, 183–197. [Google Scholar] [CrossRef] [Green Version]
  30. McHale, M.R.; Beck, S.M.; Pickett, S.T.A.; Childers, D.L.; Cadenasso, M.L.; Rivers, L., III; Swemmer, L.; Ebersohn, L.; Wayne, T.; Bunn, D.N. Democratization of ecosystem services—A radical approach for assessing nature’s benefits in the face of urbanization. Ecosys. Health Sustain. 2018, 4, 115–131. [Google Scholar] [CrossRef] [Green Version]
  31. Dang, H.Y.; Jiao, N. Perspectives of the microbial carbon pump with special references to microbial respiration and ecological efficiency. Biogeosciences 2014, 11, 3887–3898. [Google Scholar] [CrossRef] [Green Version]
  32. Jiao, N.; Robinson, C.; Azam, F.; Thomas, H.; Baltar, F.; Dang, H.; Hardman-Mountford, N.J.; Johnson, M.; Kirchman, D.L.; Koch, B.P.; et al. Mechanisms of microbial carbon sequestration in the ocean-future research directions. Biogeosciences 2014, 11, 7931–7990. [Google Scholar] [CrossRef] [Green Version]
  33. Bianchi, T.S.; Allison, M.A.; Zhao, J.; Li, X.; Comeaux, R.S.; Feagin, R.A. Historical reconstruction of mangrove expansion in the Gulf of Mexico: Linking climate change with carbon sequestration in coastal wetlands. Estuar. Coast. Shelf Sci. 2013, 119, 7–16. [Google Scholar] [CrossRef]
  34. Li, C.; Wang, R.H.; Tan, M.L. Spatio-Temporal Changes in Vegetation Net Primary Productivity and Its Responses to Climatic Factors in Jiangsu Province, Eastern China. Sains Malays. 2019, 48, 2317–2324. [Google Scholar] [CrossRef]
  35. Ma, T.; Zhou, C.H.; Pei, T.; Xie, Y.C. A comparative analysis of changes in the phasing of temperature and satellite-derived greenness at northern latitudes. J. Geogr. Sci. 2013, 23, 57–66. [Google Scholar] [CrossRef]
  36. Mu, S.J.; Yang, H.F.; Li, J.L.; Chen, Y.Z.; Gang, C.C.; Zhou, W.; Ju, W.M. Spatio-temporal dynamics of vegetation coverage and its relationship with climate factors in Inner Mongolia, China. J. Geogr. Sci. 2013, 23, 231–246. [Google Scholar] [CrossRef]
  37. Rezaei, S.A.; Gilkes, R.J. The effects of landscape attributes and plant community on soil chemical properties in rangelands. Geoderma 2005, 125, 167–176. [Google Scholar] [CrossRef]
Figure 1. Location of the study area (ac) and sampling transects (d).
Sustainability 13 04630 g001
Figure 2. Horizontal distribution pattern of vegetation net primary productivity (a) and normalized difference vegetation index (b) in the study area.
Sustainability 13 04630 g002
Figure 3. The perpendicular distribution pattern of blue carbon in the study area (Spartina alterniflora, (a); Suaeda glauca, (b); Phragmites australis, (c)).
Sustainability 13 04630 g003
Figure 4. The carbon sequestration value in the study area (Spartina alterniflora, SA; Suaeda glauca, SG; Phragmites australis, PA).
Sustainability 13 04630 g004
Figure 5. The schematic diagram showing the “carbon sequestration capacity-carbon sequestration value” conversion of vegetation in a coastal wetland.
Sustainability 13 04630 g005
Table 1. Experimental data and main model parameters.
QuadratPlant Height (cm)Plant Weight (g)Litter ProportionCrown-Root Proportion
SASGPASASGPASASGPASASGPA
NEZ123.2142.02172.5535.323.2252.360.4690.7260.6740.1816.8120.830
NBZ128.1345.13156.2338.533.3549.650.4530.7080.6210.1856.8030.838
CZ135.0053.25155.4039.123.1845.660.4250.7210.6070.4638.3720.907
SBZ127.9242.61162.0840.153.2350.020.4390.7350.6720.1854.3100.838
SEZ125.6544.45172.8636.623.4151.270.4880.7190.6570.3005.9001.100
Notes: Southern Experimental Zone, SEZ; Northern Experimental Zone, NEZ; Core Zone, CZ; Southern Buffer Zone, SBZ; Northern Buffer Zone, NBZ; Spartina alterniflora, SA; Suaeda glauca, SG; Phragmites australis, PA.
Publisher’s Note: MDPI stays neutral with regard to jurisdictional claims in published maps and institutional affiliations.

