1. Introduction
Electric Vehicles (EVs) are considered a promising option to reduce pollution and the greenhouse effect. However, there are still some technological barriers that obstacle the success of electric vehicles on the market. The driving range of EVs is still limited compared to combustion engine vehicles. Yet, there is ongoing research on how to improve performance and energy efficiency. This issue can be addressed by improving battery technology or developing optimal driving strategies that maximise energy efficiency. Electric vehicles with independent drivetrains offer great potential: due to the actuation redundancy, the total torque request of the vehicle can be achieved with an infinite number of front-to-rear wheel torque combinations. Therefore, the torque demand can be distributed among the multiple motors while meeting various criteria, including efficiency.
Several publications examine the opportunity to increase the efficiency of over-actuated electric vehicles by energy-optimal torque distributions, also called control allocation schemes [
1].
Such studies differ in many aspects—the considered sources of power losses, the drivetrain layout with in-wheel [
2,
3,
4] or on-board motors [
5,
6,
7], the proposed optimal torque distribution configurations. For instance, [
4,
5] focus on the motor power losses, while [
2,
8] also consider losses in the drive. References [
3,
7,
9,
10] look at the whole powertrain, including tyre power losses. Especially regarding the drivetrain, power losses are defined through efficiency maps [
5], experimental measurements [
11], or loss/efficiency mapping [
2,
6].
Other papers [
9,
12] point out the importance of including tyre slip in the power loss computation. Although effective, they are based on relatively complex estimation algorithms, which are quite difficult to implement in practice at industrial level.
An interesting study is conducted in [
5], where the possibility of energy saving via control allocation is investigated for three different motor technologies. Reductions in motor power losses are achieved using an optimisation scheme based on motor efficiency maps, obtained by manufacturers’ experimental measurements. The paper also infers that a quadratic cost function for representing motor power losses is not an effective approach, and more complex functions are needed. However, simulation tests are limited to straight-line driving and a ramp steer manoeuvre, both at constant longitudinal acceleration, which are simple for representing a real usage.
A noteworthy contribution is [
7], which continued the work presented in [
11] with a more detailed study based on data collected from a vehicle prototype with four identical on-board drivetrains. The paper discusses computationally efficient torque distribution strategies aimed at minimising drivetrain power loss while providing the required overall force and yaw moment.
With respect to the optimality of different torque distribution strategies, it is possible to come upon some differences in the literature. References [
2,
4] suggest that the total torque should be evenly distributed among the four motors in all conditions to maximise energy efficiency. This conclusion seems to be in contrast to those reached later by other studies [
5,
7,
11] that suggest the use of one axle only at low torque demands. This is likely due to many different factors—the type of motors used, the driving pattern at which tests are performed and the method used to express power losses. Specifically, in some case studies [
2,
5] the driving pattern used to assess the benefit of the strategies are simple manoeuvres, such as straight line driving at constant speed.
Accordingly, there is a need to test the torque allocation strategies over driving cycles that reproduce a real type of usage and allow relevant considerations on vehicle energy consumptions. Furthermore, a sensitivity analysis of the effect of optimal torque distribution strategies for the operational efficiency of the components of the electrical powertrain is missing. Especially for EVs, an optimised torque distribution strategy that improves vehicle economy is important, since it directly contributes to driving range extension and reduces the stress on crucial electrical and storage components. Thus, it is of interest to assess the benefit of different torque distribution schemes over the battery system.
In this paper, the relationship between drivetrain operational efficiency and vehicle motion is analysed and modelled. The main contributions are as follows:
A comprehensive model is built through Simulink-Simscape which describes the longitudinal vehicle dynamics. The model allows us to run any driving cycle and to the implement different torque distribution strategies in parallel.
The developed framework features the elements of the electrical powertrain, including the battery, thus being able to provide its State of Charge (SOC).
Simulation results allow us to compare and discuss the effect of different torque distribution strategies on the overall energy consumption and on the battery autonomy, including insightful analyses on the motor torque-speed operating points and their relationship with each torque distribution strategy.
The paper is organised as follows:
Section 2 formulates the energy efficient torque distribution problem,
Section 3 deals with modelling the elements of the electrical powertrain.
Section 4 is dedicated to the assessment of the torque distribution strategies. Simulations and results obtained for the considered case study are discussed in
Section 5.
Section 6 presents the main conclusions.
2. Energy Efficient Torque Distribution Strategies
This section introduces the methodology and main assumptions adopted for the development of the energy efficient torque distribution strategies.
2.1. Sources of Power Loss
Understanding power loss sources during driving is the basis for developing a control strategy to enhance energy efficiency. Vehicle power losses involve losses in the drivetrains and at the tyres. For an EV, drivetrain power losses include the contributions of the electronic power converters, the electric motors, and the transmissions. Tyre contributions are related to rolling resistance and tyre slip. In particular, for this study it is of interest to focus on power losses that are influenced by the torque distribution. Although the energy storage system introduces energy losses that influence the whole operational efficiency, this contribution is not considered as it is not directly affected by different torque allocations. Regarding the tyre, tyre slip losses are influenced by the wheel torque control strategy. However, as shown in [
12], this contribution is less significant than the drivetrain losses, especially in longitudinal motion.
Regarding the drivetrain, the electric power
available at the battery terminals is converted by the electric motors into mechanical power
to propel the wheels. Specifically, the power delivered by the battery is decreased by a certain amount according to the efficiency of the whole drivetrain, as
where
is the efficiency of the inverter,
is the efficiency of the electric motor,
is the efficiency of the transmission.
Power losses associated with the drivetrain represent the major contribution to vehicle power losses [
6,
8,
13].
2.2. Problem Formulation
The energy efficient torque control should result in an output torque distribution that guarantees the desired total longitudinal force, while ensuring that the drivetrains are operating in the most efficient region.
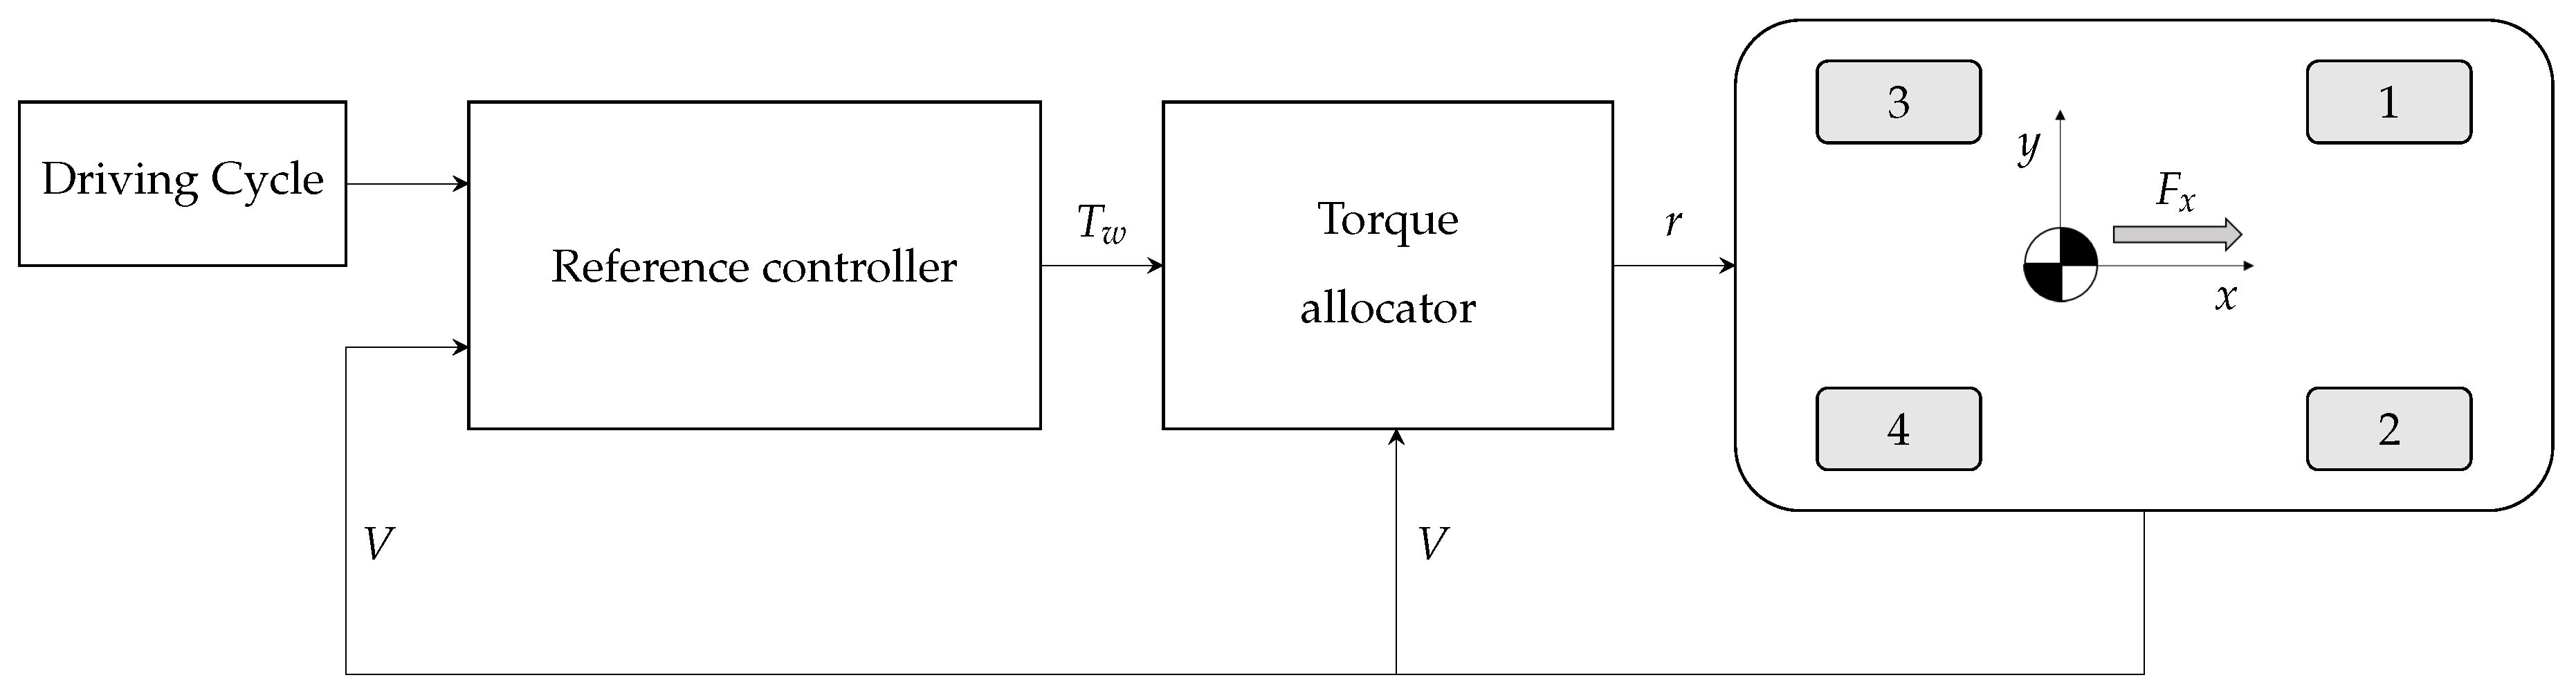
By using the notation in
Figure 1, the vehicle torque demand
can be expressed as the sum of the torques supplied at each wheel, as
where
are the torques at each wheel, while
and
are respectively the total desired traction/braking force and the wheel radius.
If the vehicle is equipped with an open differential, the torque demand at the left side,
, is equal to the torque demand at the right side,
, as
As a consequence, the torque distribution problem can be solved independently just for one side of the vehicle and replicated for the remaining side. In particular, the problem consists of defining the front-to-total ratio r of the side torque demand that minimises power losses.
If direct yaw moment techniques are used [
14], then the torque demands at the left and right sides are not the same [
15]:
where
is the yaw moment and
w is the track width. In this case, two values of front-to-total torque ratio are to be determined, one per vehicle side, with the same procedure.
The front-to-total ratio of the side torque can generally be written as
where
and
are respectively the wheel torque at the front and at the rear, for one side of the car. Accordingly, their sum returns the side torque
.
During driving, the drivetrains operate in different regions of the torque-speed plan, consequently the power losses vary under different operating conditions. The optimal front-to-total torque ratio can be achieved based on a suitable relationship that describes the side power losses as a function of torque demand and vehicle speed,
V. In this paper, it is assumed that each wheel is equipped with an independent powertrain, and that the power loss characteristics of the four drivetrains are identical. For one side of the vehicle, the power loss model can be expressed as
where
Notably, in Equation (
6) the vehicle speed
V is used as the speed of each vehicle corner, which is valid in straight-line motion with limited slips.
In the optimisation procedure the maximum torque that can be delivered by each motor,
, must be considered into the constraints of the problem. Being
the gear ratio of the transmission, the following constraints hold
The torque allocation control also considers the maximum transmissible torque related to tyre-road adhesion capability. Finally,
r is set to be greater than 0.5 (or equal) as it is preferable to avoid saturating the rear axle, to the benefit of vehicle stability [
11,
16].
2.3. Control Structure
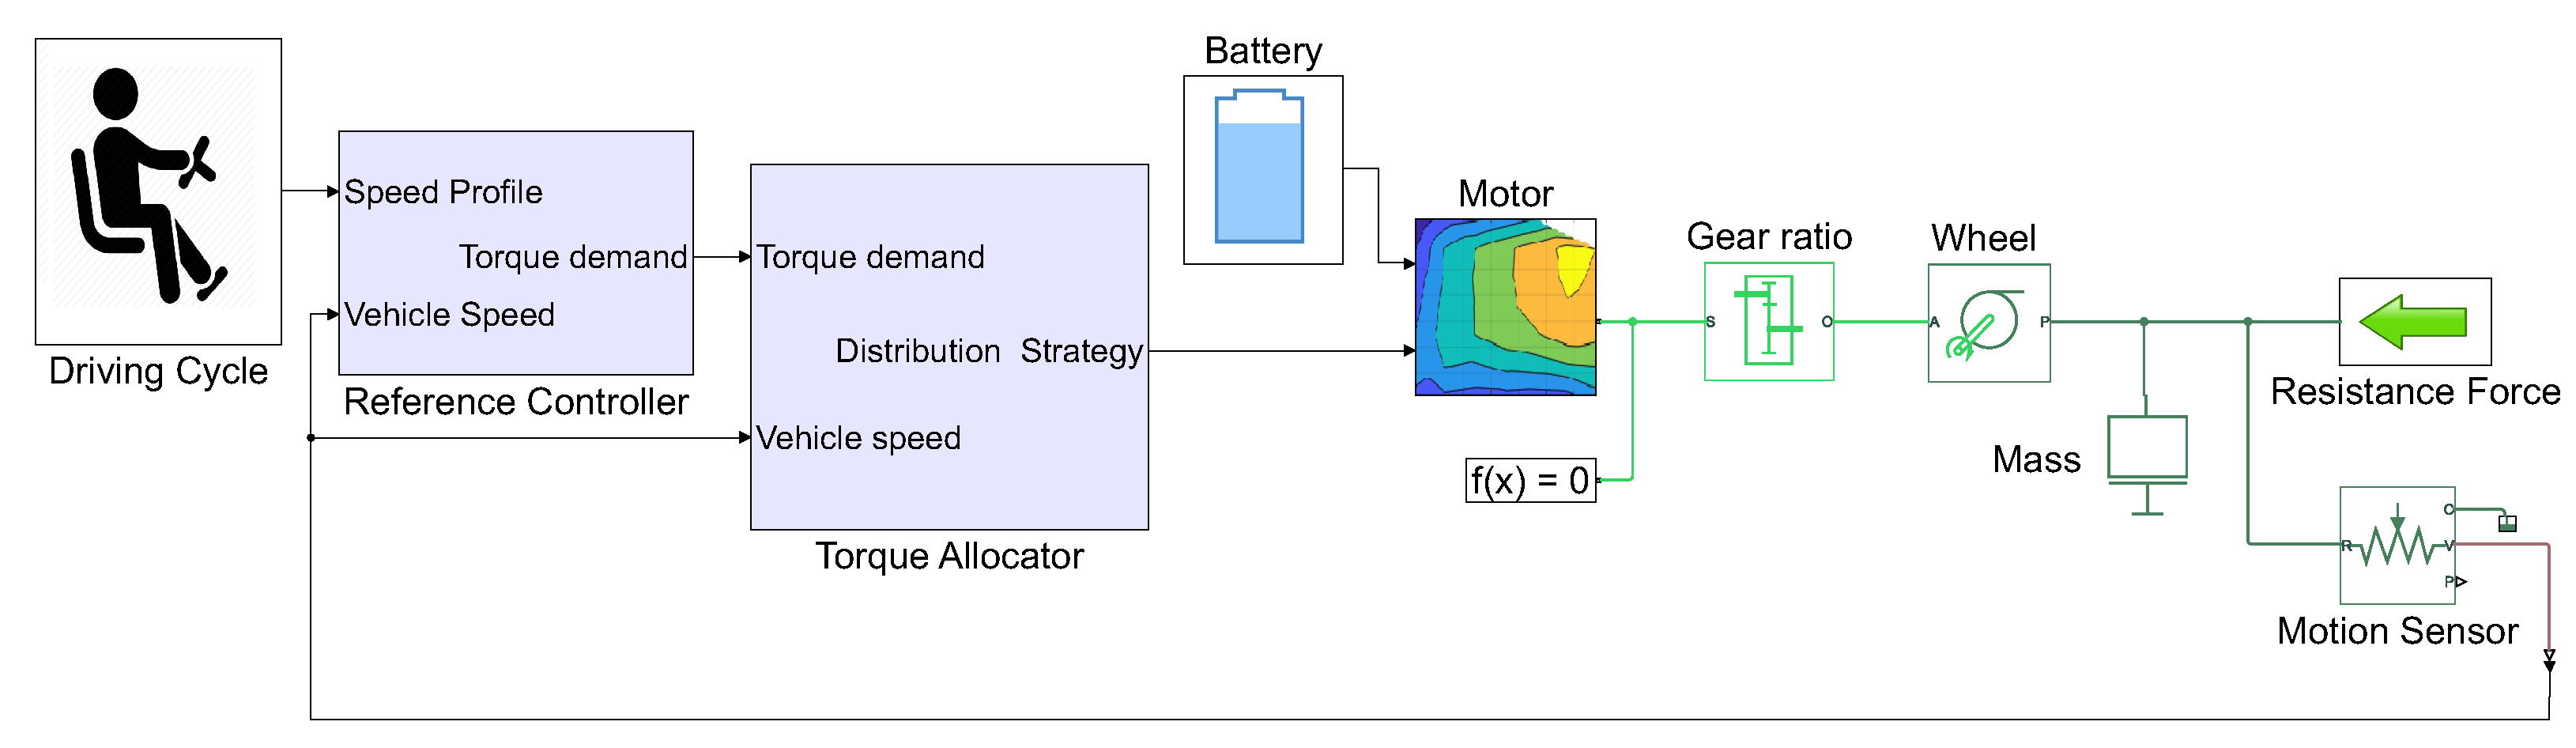
The scheme of the simplified vehicle control structure is reported in
Figure 1. The reference controller, through a speed feedback control, outputs the total torque demand to achieve the desired velocity profile (driving cycle). The torque allocator provides the front-to-total torque distribution for the different strategies, receiving vehicle speed and total drivetrain torque demand as inputs. For the case of the energy efficient torque distribution strategies, the online calculation is based on look-up tables obtained with an offline optimisation procedure. The use of look-up table allows online operation with minimum computational burden. Finally, a vehicle dynamics block is designed with input parameters such as road slope, mass, and drag coefficient necessary to compute the relevant output quantities, such as torque and speed at the wheel, power demand and energy consumption.
3. Electrical Powertrain Modeling
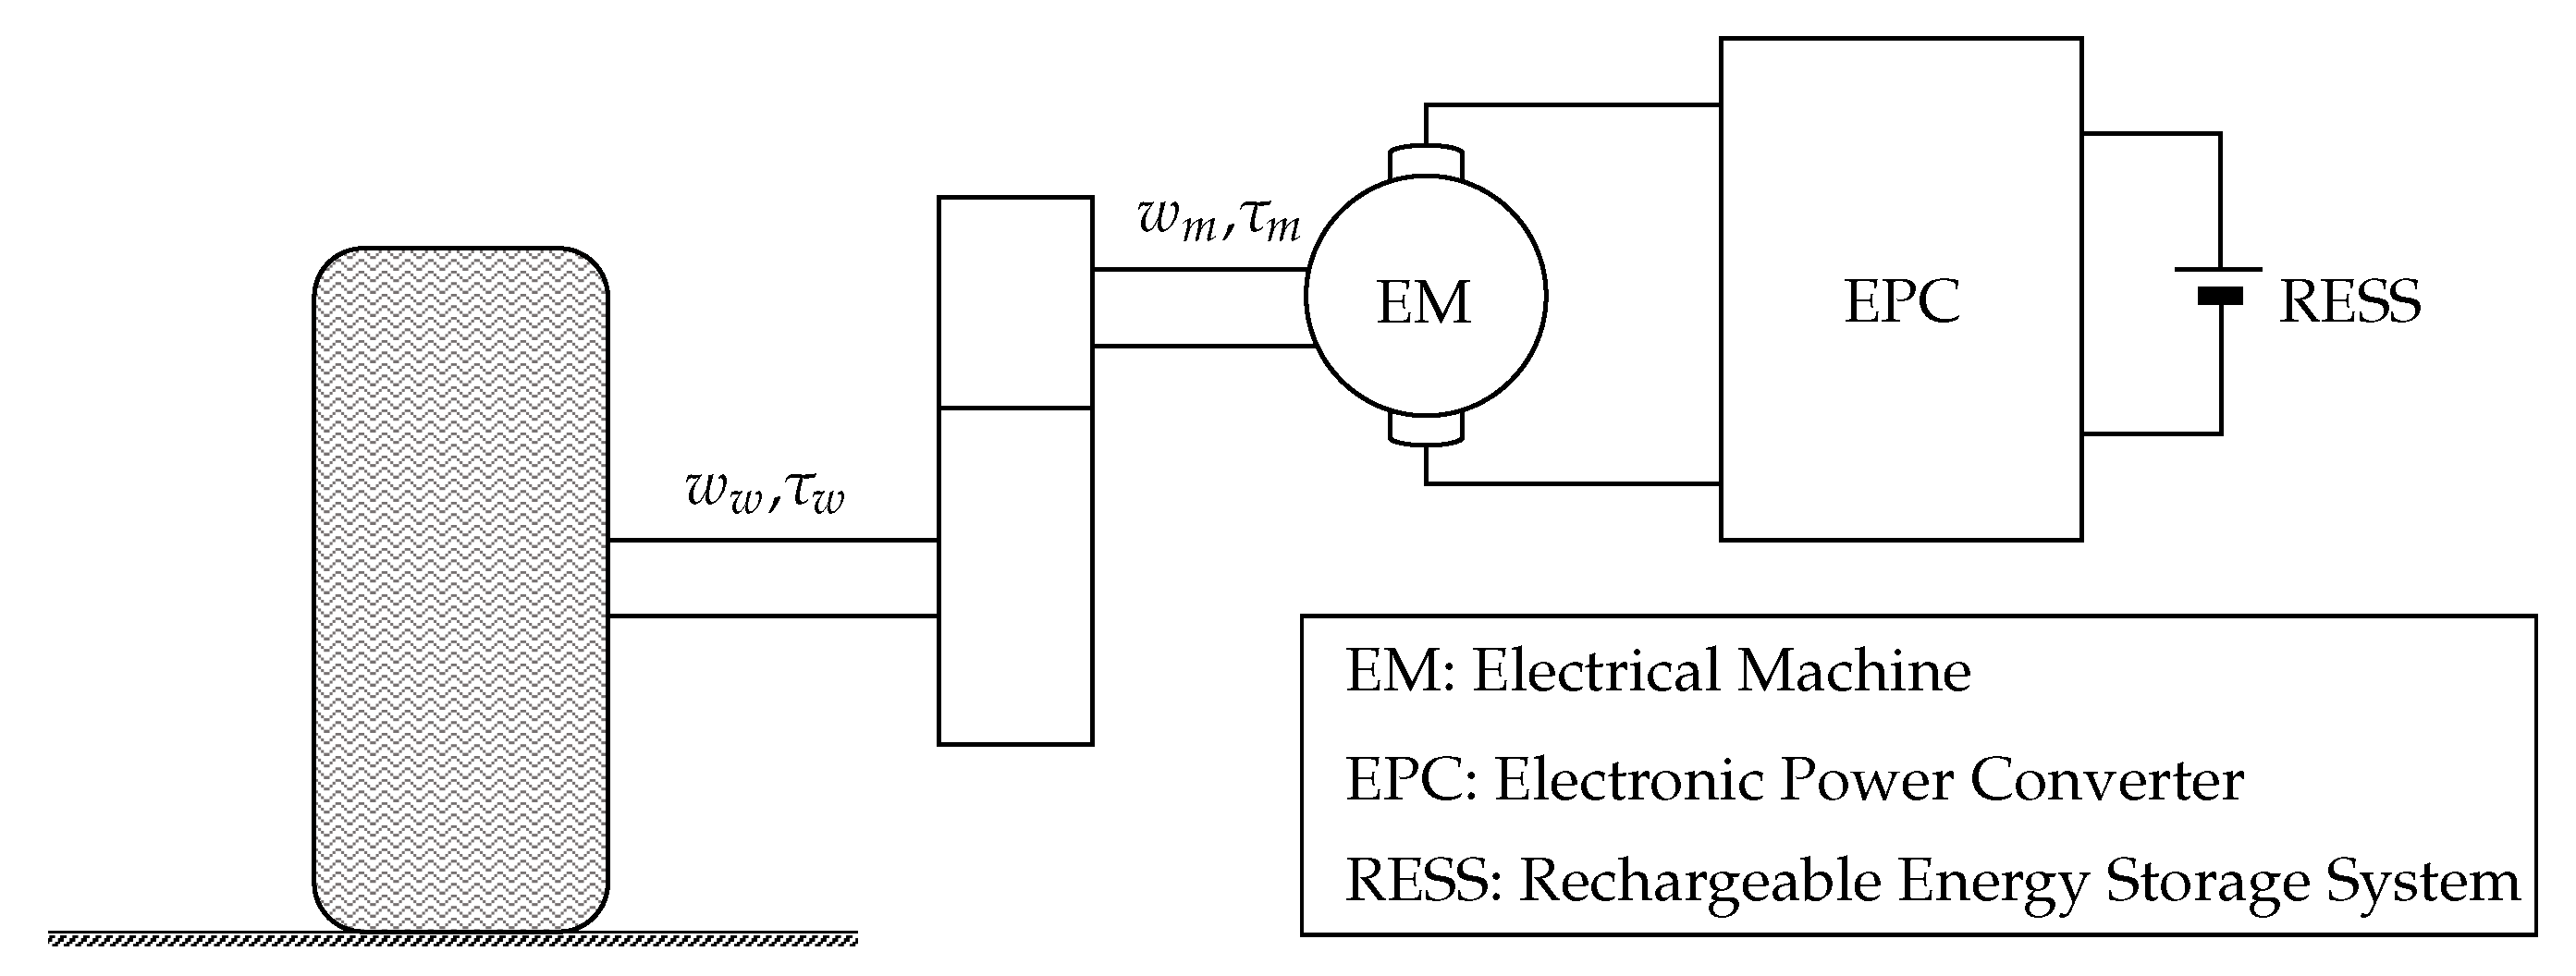
The powertrain of the present case study consists of four independent drivetrains and the energy storage system.
3.1. Drivetrain Efficiency Model
Each drivetrain consists of the electronic power converter (EPC), the electric motor (EM), a single-gear transmission (
Figure 2). The EPC is used to supply the electric motor with proper voltage and current to produce the desired torque and speed, according to the torque distribution strategy. The Electric Machine (EM) converts electric energy from the battery into mechanical energy to propel the vehicle, or vice-versa in case of regenerative braking. A transmission, with appropriate gear ratio, completes the drivetrain layout.
3.1.1. Electric Machine
In EVs, the electric machine is the core energy conversion component. Different motor types for vehicular applications have been introduced over the past few years. According to research conducted in [
17,
18,
19], state-of-the-art EVs are equipped with Induction Motors (IMs) and Permanent Magnet Synchronous Machines (PMSMs). In addition, Switched Reluctance Motors (SRM) have gained interest for traction applications [
20,
21,
22]. For the purpose of the present investigation, special attention is dedicated to energy efficiency and power losses as functions of the various speed-torque combinations. In certain traction conditions it may be more efficient to supply the total torque demand only via the front motors. However, depending on the motor technology, switching off the rear motor power supply still introduces no-load losses. Indeed, in PMSMs, the permanent magnets generate iron losses as long as the machine continues to rotate [
6]. Furthermore, at high speed, the phase-to-phase voltage of the dragged rear motors may become greater than the battery voltage and the PMSMs may deliver power to the battery through the anti-parallel diodes while the front motors are in traction condition. In practice, to avoid this uncontrollable rectifying operation, which may occur with the PMSM technology, a flux weakening current is needed. Nevertheless, this current necessarily leads to additional copper losses although the motor does not deliver torque to the wheels.
One solution to this problem, adopted in [
6,
23], consists of introducing a clutch between the rear motors and the tyre so that, when needed, the front motors can operate with high efficiency while the rear motors are disengaged, without generating any loss. However, this configuration adds additional elements to the vehicle structure and frequent clutch engagements/disengagements may have a negative impact on user comfort and the durability of components [
8]. To address this issue, another possibility is to use induction or synchronous reluctance motors [
7]. Induction motors have the advantages of high reliability, robustness and low cost. In terms of loss characteristics, the high efficiency region of an IM is often located in the high speed-low torque region, resulting in a convex power loss curve as a function of the motor torque. In this specific case, the optimal solution is the even distribution among the front and rear drivetrains [
4,
11]. For this reason, the IM technology is not interesting for the present investigation.
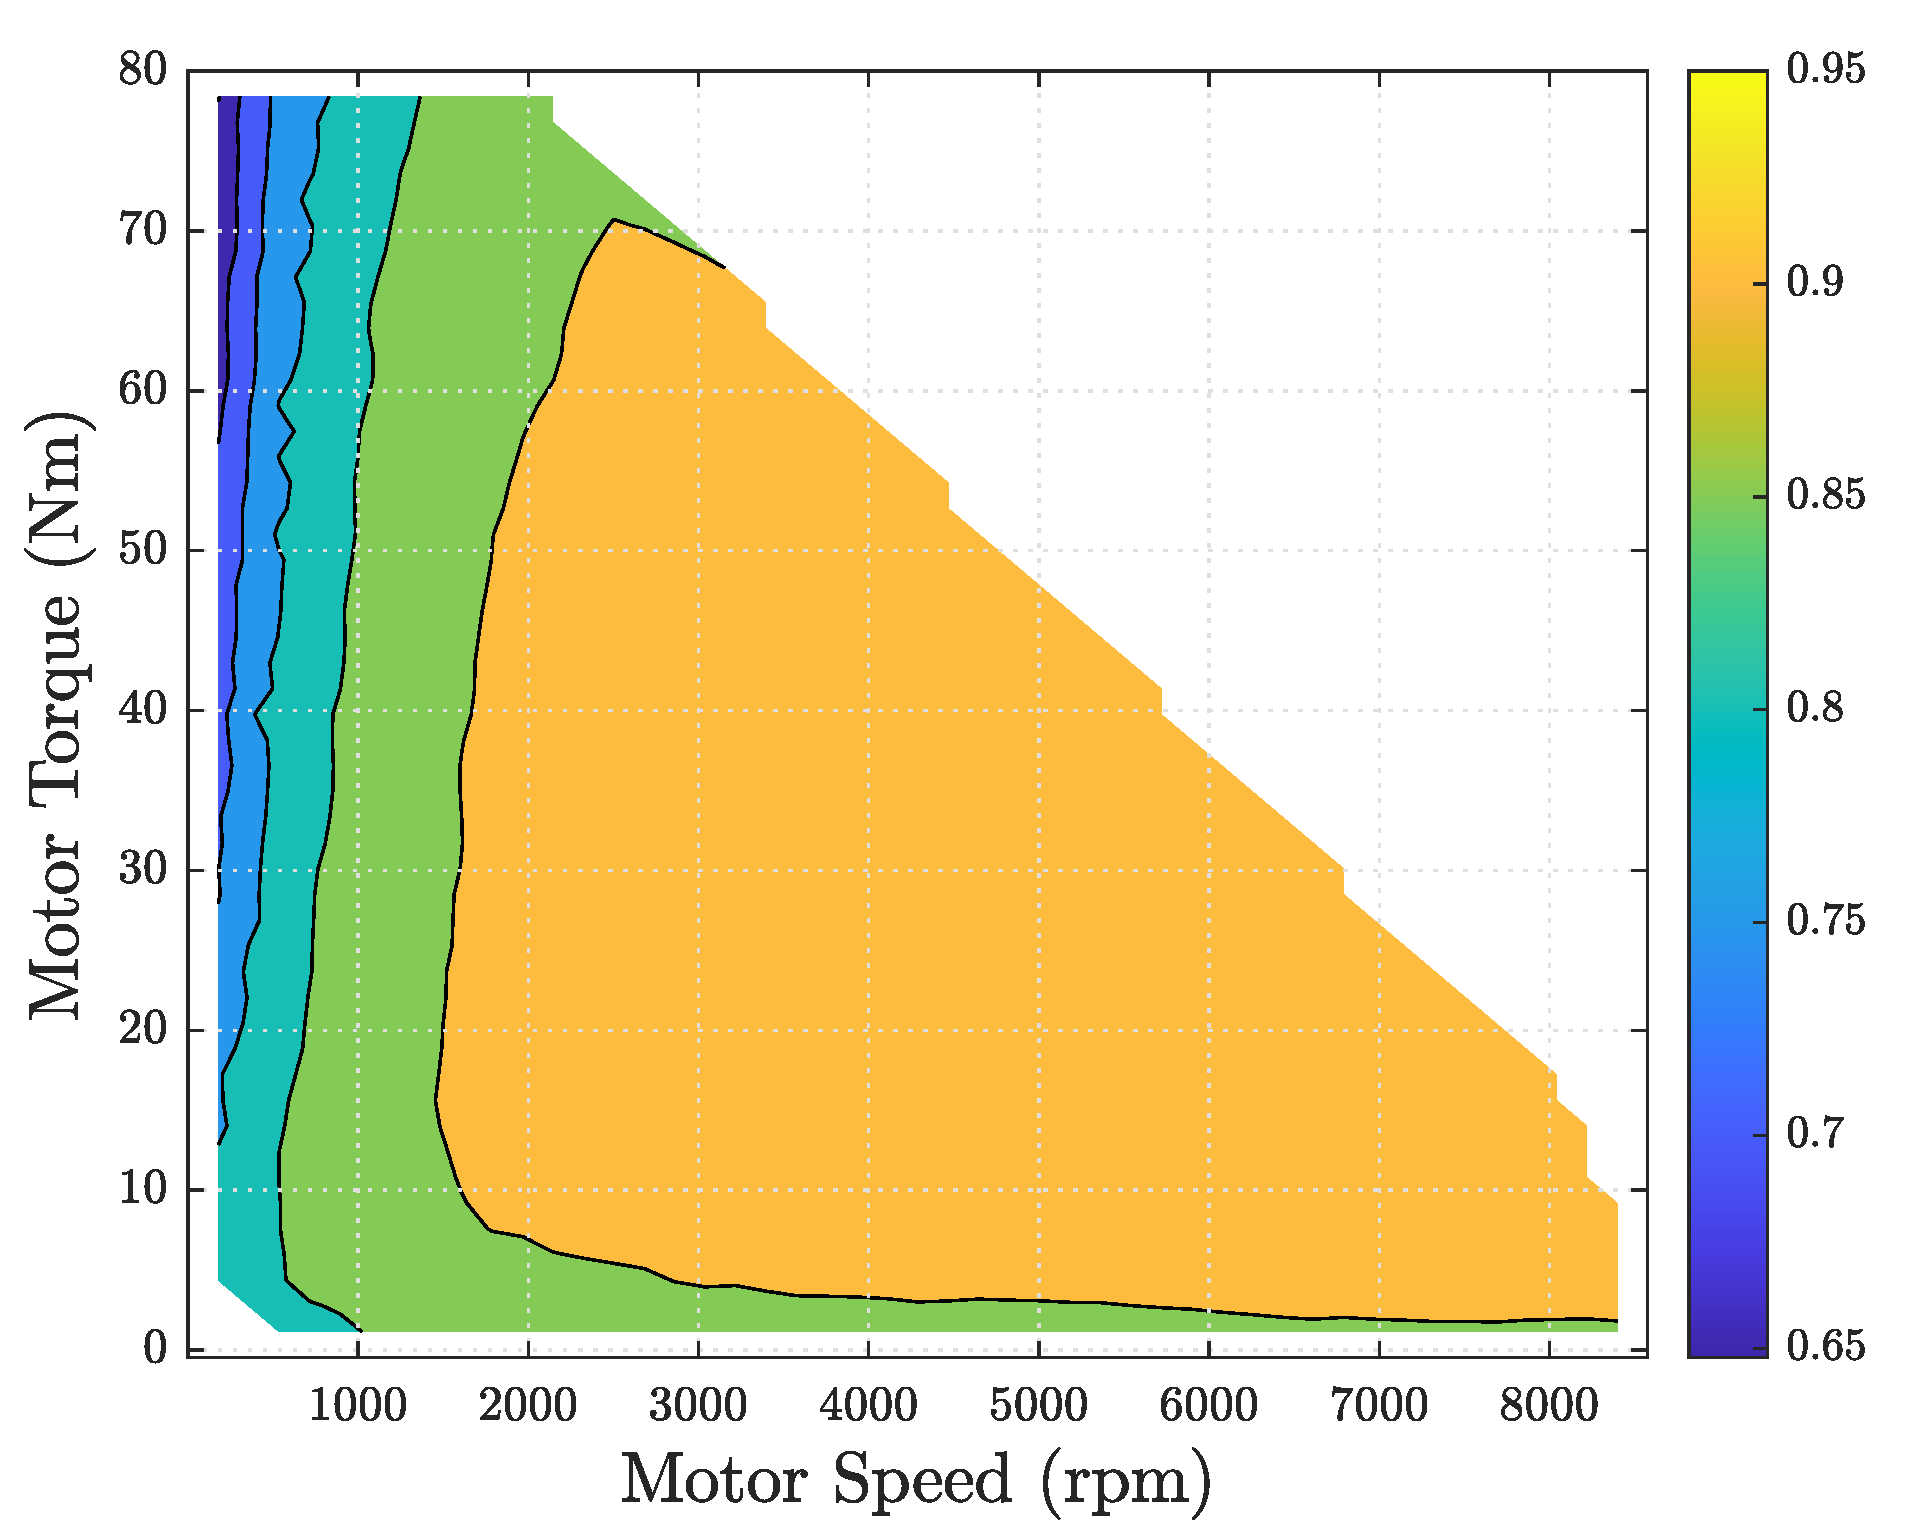
In this paper, the solution with SRM has been selected, as the power loss characteristic of this technology is suitable for the optimisation procedure. In terms of loss and energy efficiency, the SRM motor is comparable in power density and efficiency with the IM, but is penalised when compared to the PMSM. In light of this, the possibility of energy saving through an optimal torque distribution could make this technology more appealing and suitable for this powertrain configuration.
In order to control the torque distribution that enhances the system efficiency, it is essential to model how motor power losses change with motor torque and speed. There are two main modelling methods—one is based on the motor efficiency data, and the other is based on a system loss model. Generally, iron losses are difficult to be correctly modelled. A method adopted in many papers [
2,
24] consists of modelling iron losses with an equivalent core loss resistance, which is inserted in the traditional equivalent circuits of a synchronous machine. Experimental measurements are required in order to assess the value of the equivalent resistance to be implemented in the loss models, whose validity will depend on the accuracy of this parameter. Actual component models and data are essential to ensure validity and accuracy of results. However, such data are not always available.
The other—more effective—approach for evaluating the motor operational behaviour is the use of motor efficiency maps. Through the knowledge of the mechanical operational power and the efficiency map (
Figure 3 shows the map adopted in this case-study, inspired from [
22]), it is possible to evaluate the power losses that occur at all speed-torque combinations within the motor operating envelope. In particular, power losses are computed as
where
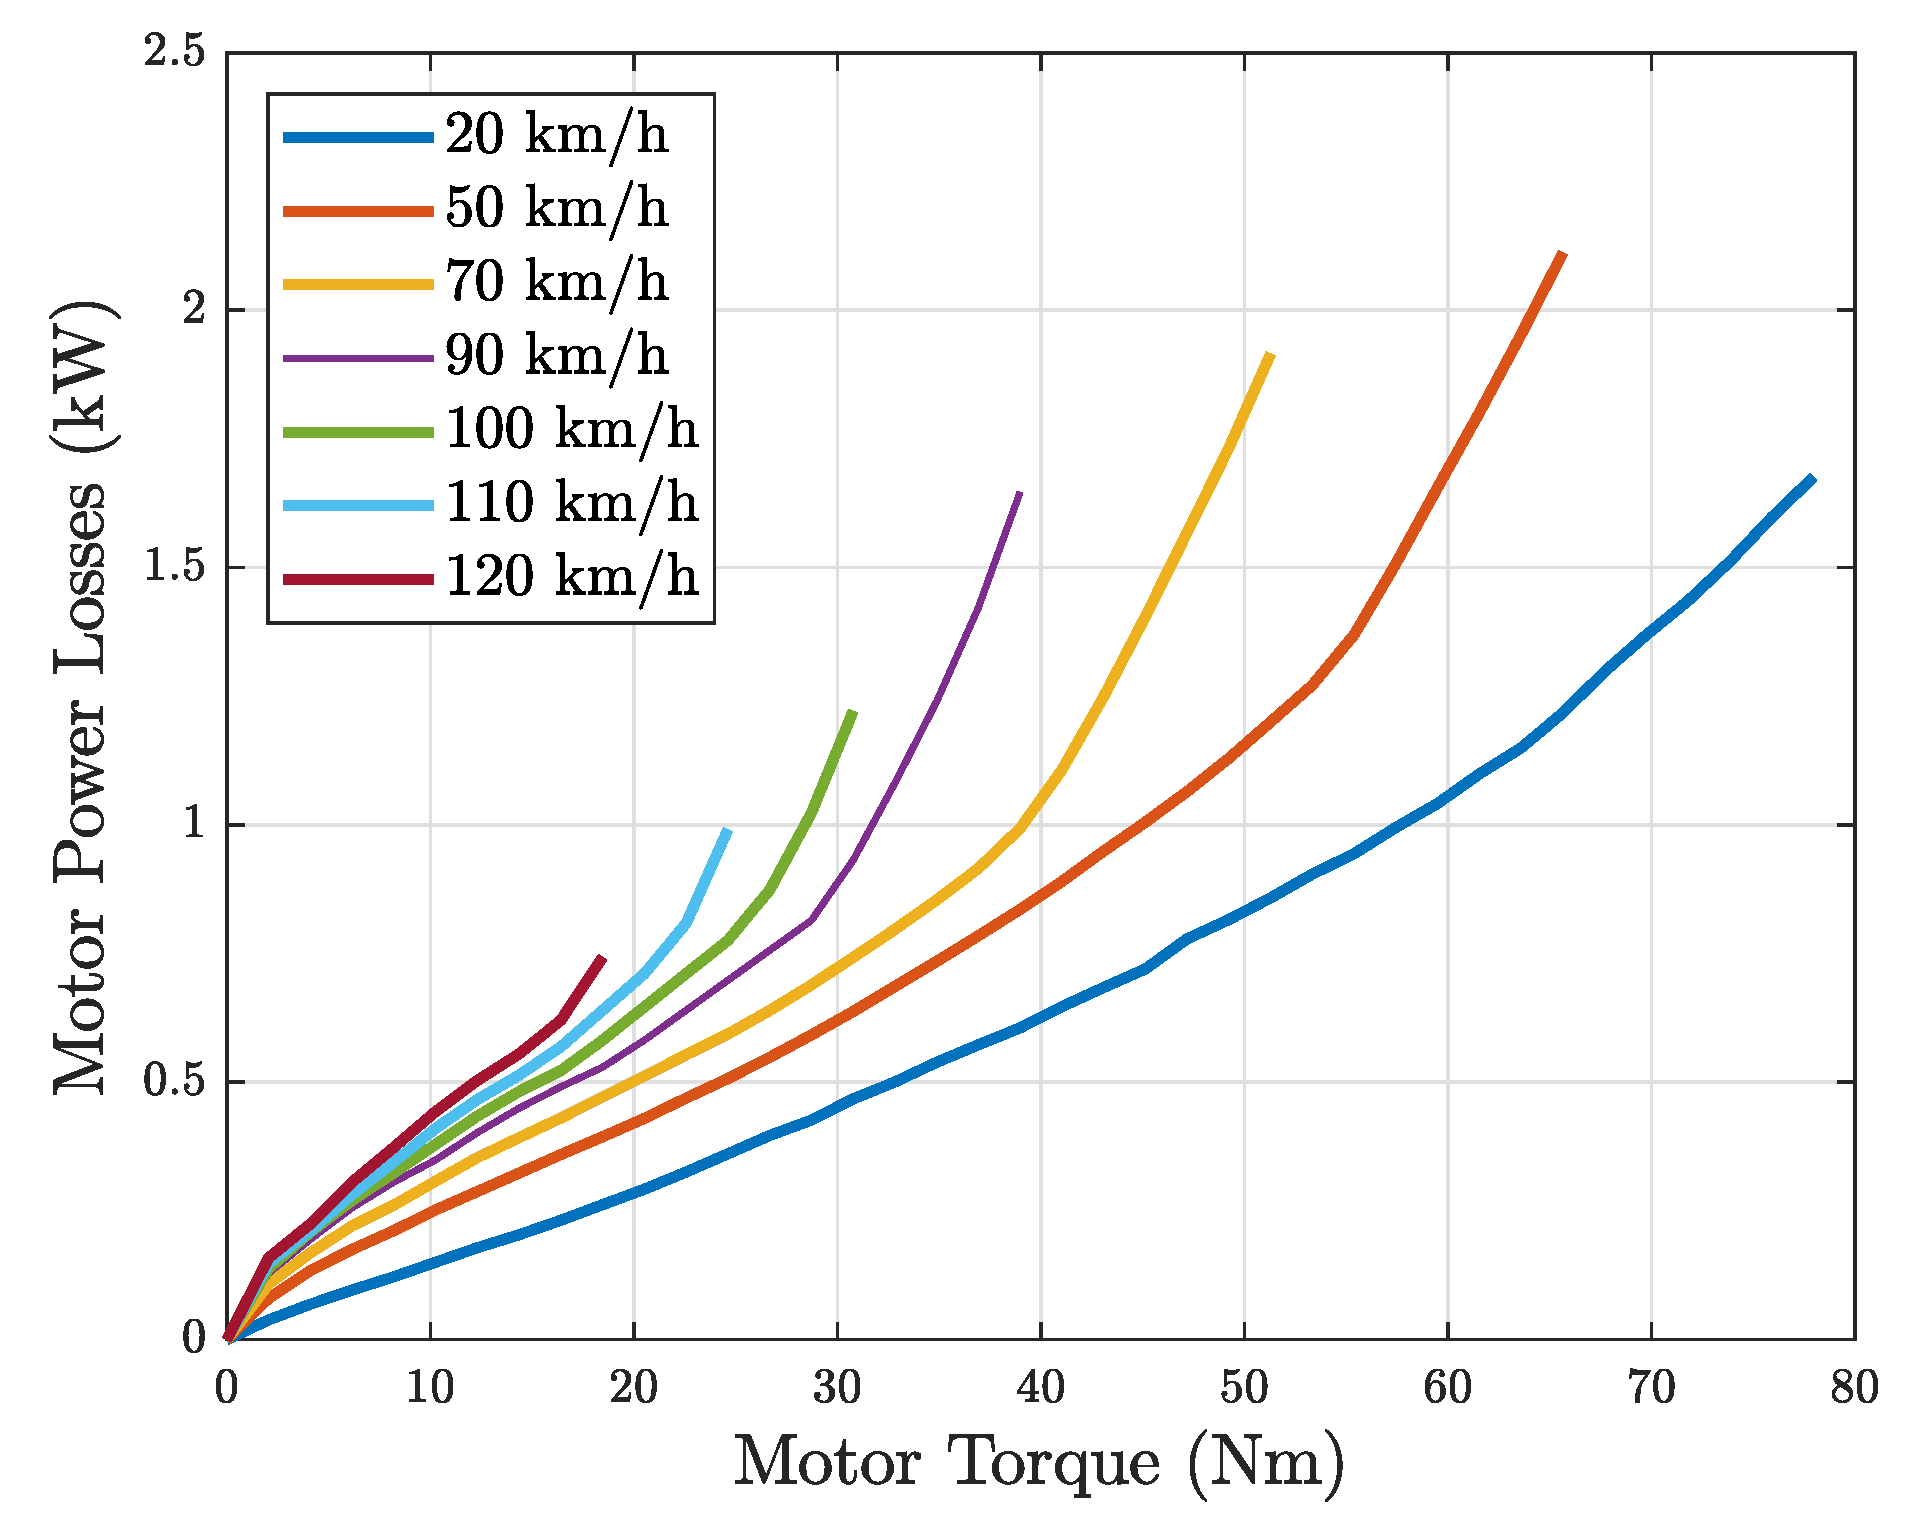
Figure 4 depicts the power losses as a function of the torque at fixed values of speed.
The use of motor efficiency maps is also a suitable way to represent the motor subsystem in a more complex system, like a vehicle. By introducing efficiency maps [
25] in a vehicle model simulation, it is possible to examine its performance over driving cycles and to compute the energy consumptions. In fact, using the instantaneous torque-speed operating points computed by the model and the efficiency map, the electrical input power for every operating point can be obtained as in Equation (
10). Therefore, the energy consumptions can be estimated by integrating the electrical input power over the driving cycle.
3.1.2. Electronic Power Converter
The performance of the motor drive depends both on the inverter and the electric motor. The dominant inverter losses consist of switching losses and conduction losses, both in the Insulated-Gate Bipolar Transistors (IGBTs) and in the anti-parallel diode. The switching losses occur in the transition time between on and off states, which is very short yet not instantaneous. The analytical expression of the inverter loss contributions requires the knowledge of many parameters that are component dependent and not normally reported in datasheets. Furthermore, inverters usually have high efficiency values (95%–97%). Instead, the efficiency of the electric machine can be significantly lower, depending on the type of machine and the operating conditions (see
Figure 3). So, the overall efficiency of the motor drives highly depends on the efficiency of the electric motor. Accordingly, a constant efficiency of 97% is assumed for the inverter.
3.1.3. Transmission
In EVs with multiple motors the transmission regulates the transfer of power from each electric motor to each wheel. The transmission parameters depend on the characteristics of the power plant and on the performance specification of the vehicle. Moreover, the transmission ratio determines the resulting working conditions of the motor. In the design of the transmission, the parameters should be constructed so that the motors operate in the most efficient operating region.
Electric motors with good speed control usually have a speed–torque characteristic that is close to ideal, and a single-speed transmission is normally sufficient to match the requirements. Generally, the main contributors to transmission losses are speed, load and temperature, leading to typical efficiencies within the range of 95%–97% [
26]. Specifically, these losses can be divided into load independent, such as spring losses and air windage, and load dependent rolling and sliding. For the load dependent losses, physical equations can be used to model such losses [
27]. Nevertheless, the accurate estimation of the required parameters is difficult. For these reasons, the transmission efficiency is assumed to be 95%.
By means of the transmission efficiency,
, and the gear ratio,
, the torque from the motor,
, is transmitted to the wheel, resulting in the wheel torque
:
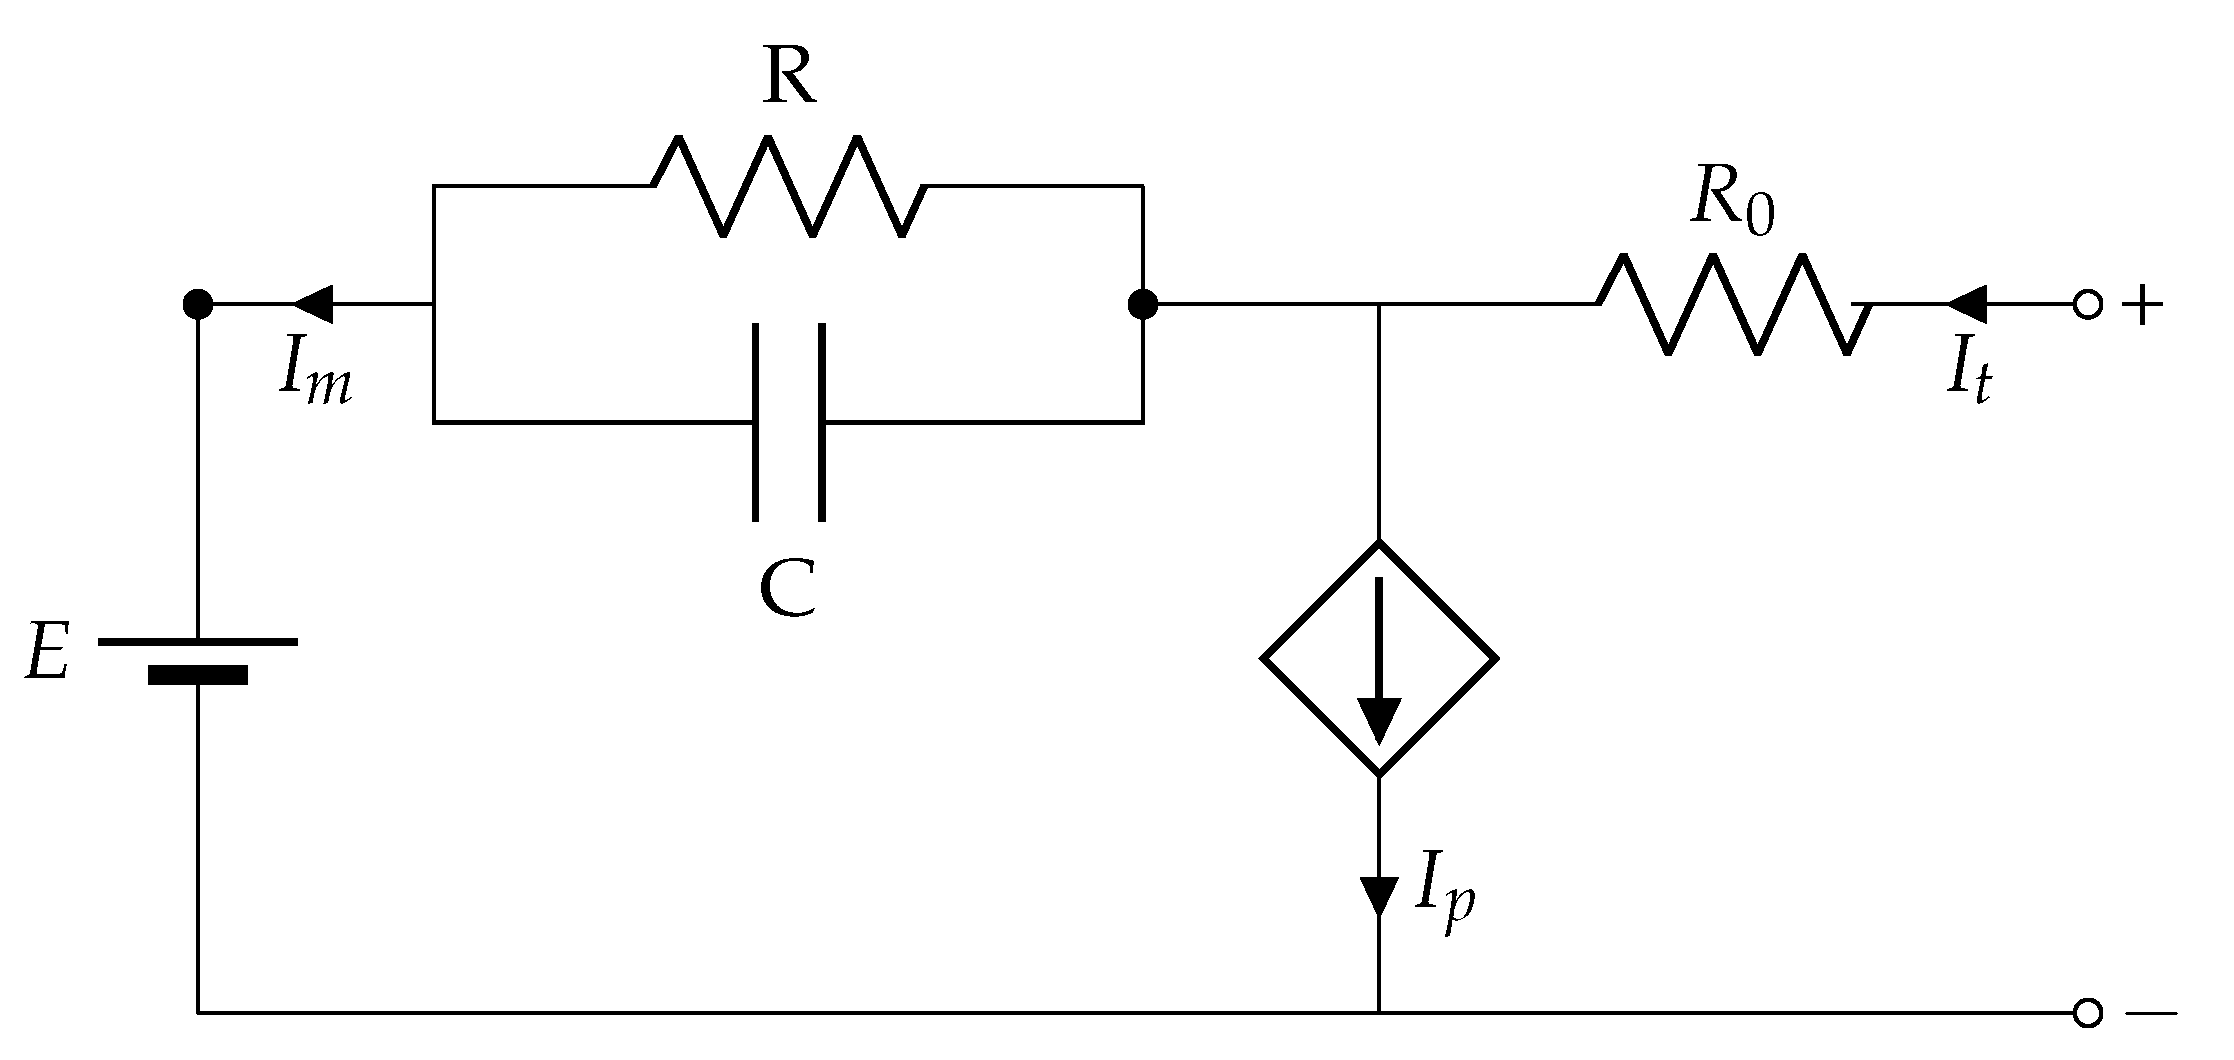
3.2. Battery Model
The battery is a key component of an EV. The driving range is strongly related to the operational efficiency of the vehicle. Accordingly, optimal torque distribution strategies are developed, aiming at the improvement of the energy efficiency thus extending the driving range. It is of interest to verify the effect of torque distribution schemes on the battery, especially in terms of energy consumption and State of Charge (SOC).
The behaviour of the battery is reproduced and modelled using the electric equivalent circuit reported in
Figure 5 [
28,
29]. It consists of an electromotive force
E, an
network, a series resistor
and a parasitic current
. In particular,
is the current related to the main reversible reaction of the battery and its time integral is the reversible charge stored during the charging process. In the model,
is located on a separate branch thus modelling a coulombic efficiency that is less than one.
The components of the circuit are not constant but depend on battery inner temperature and SOC, also, has a dependency on battery voltage and temperature. Since this equivalent representation is intended as a model to investigate the battery performance from an energy-related point of view, two simplifying hypotheses are added:
The battery model gives as output the SOC, defined by:
where
is the extracted charge computed starting from the time
at which the battery is fully charged. Combining this equation with the hypothesis of linear dependency between SOC and
E, the formulation of the SOC used in the model is obtained
The simulation model of the battery has been implemented in Simulink with the appropriate element of the Simscape library.
4. Computation of the Energy Efficient Torque Distribution Strategies
The energy efficient torque distribution strategies are derived through an offline optimisation that minimises motor power losses in traction and braking conditions. Motor power losses associated with a specified working point are calculated through its efficiency value as
where
and
are the motor torque and speed,
is the motor mechanical power and
is the motor efficiency at the operating point.
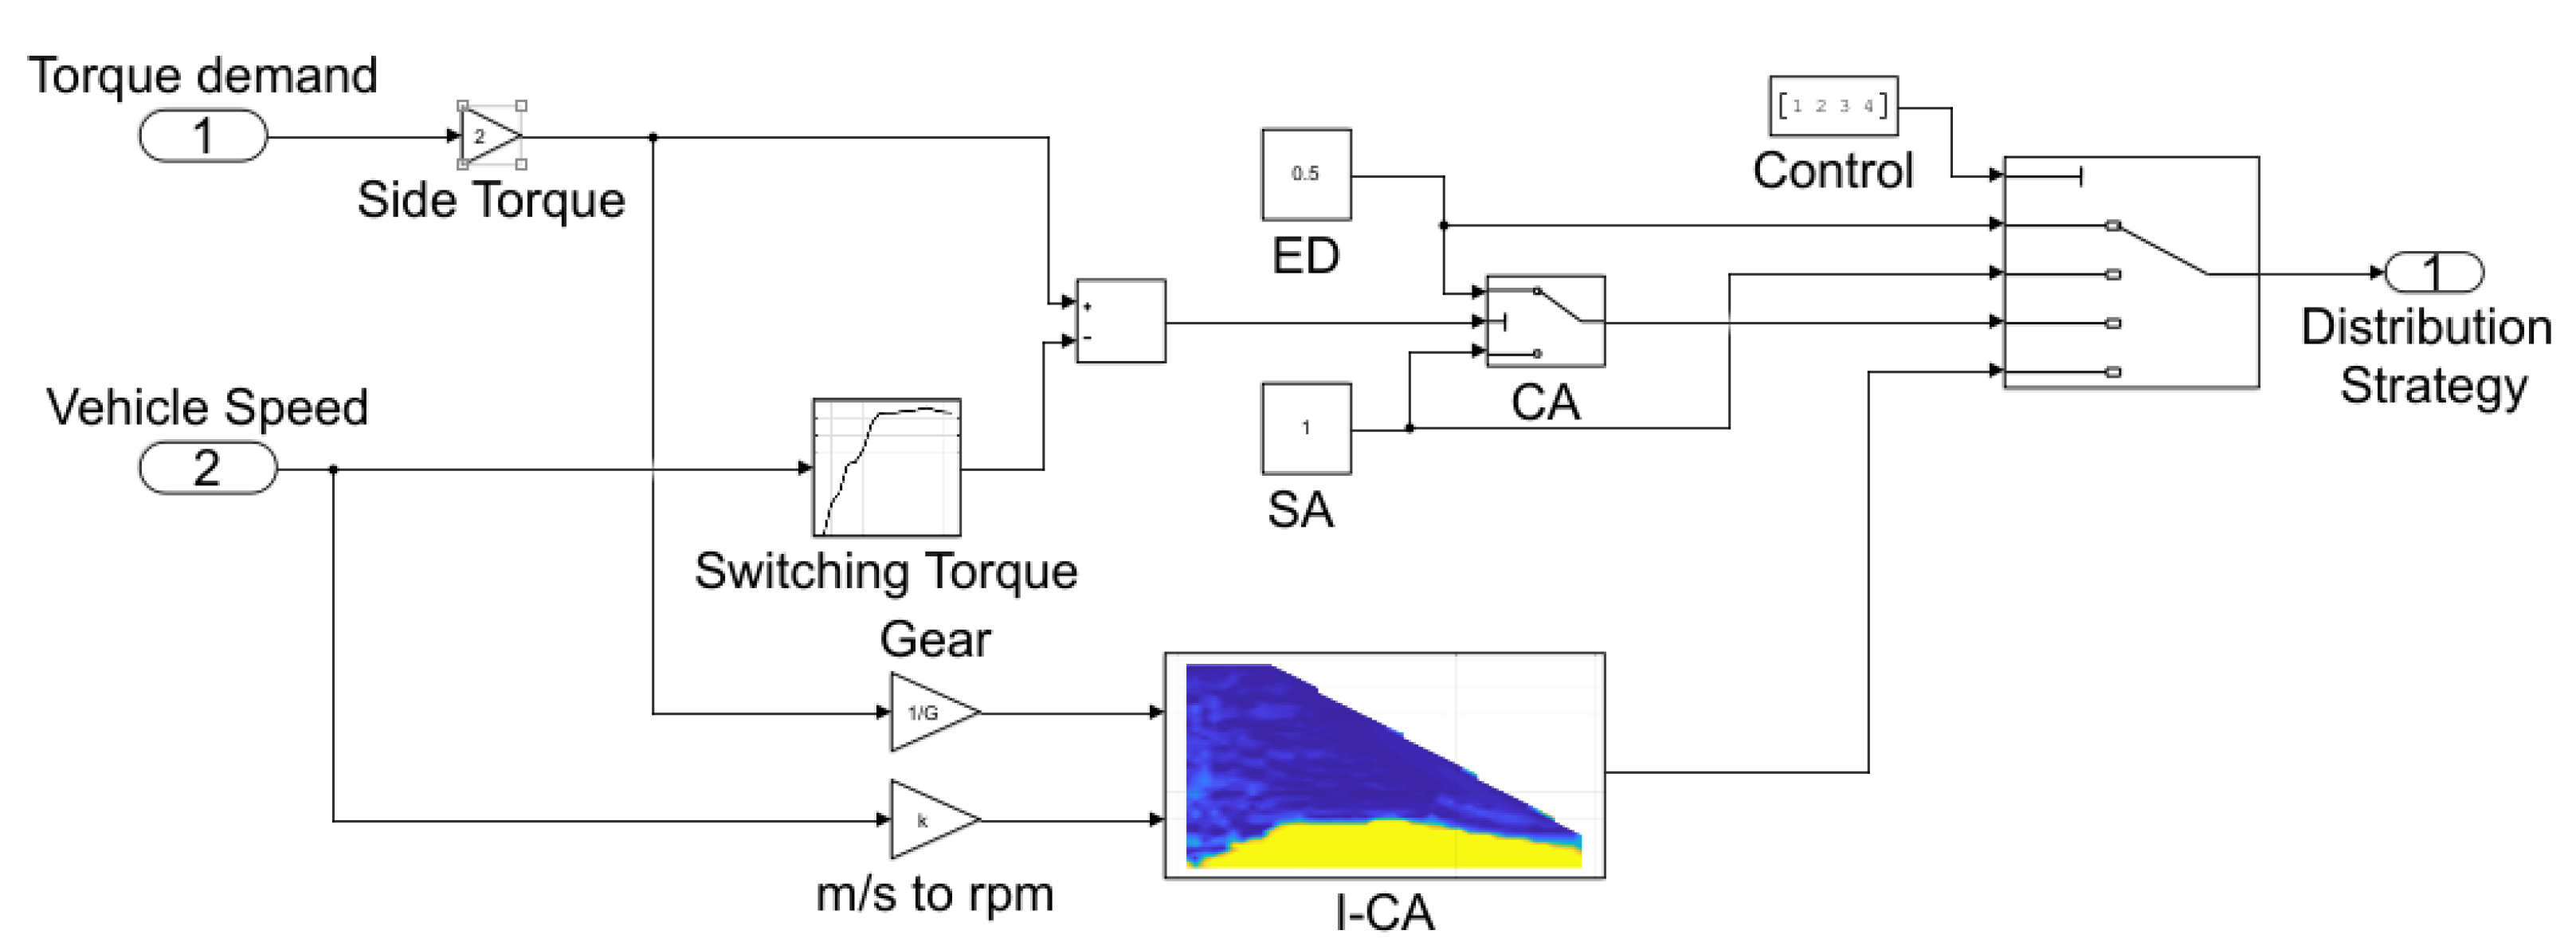
Two different energy efficient torque distribution strategies are implemented—the Control Allocation Strategy (CA) and the Implicit-Control Allocation (I-CA). To assess the benefit of the energy efficient torque allocation strategies, the energy consumptions are also analysed when operating with standard torque distributions—the Single Axle strategy (SA), which consists of a front-wheel-drive mode, and the Even Distribution strategy (ED) which consists of a 50-50 torque distribution between front and rear wheels, that is, with a front-to-total ratio equal to 0.5. The SA strategy supplies the total torque demand only by the front drivetrains. The front motors are selected, preferring an understeering behaviour rather than an oversteering one. So, the front-to-total ratio is set to 1. In general, each strategy is overruled in case of saturation on one motor: when that happens, the torque demand beyond the limit is allocated to the other motor of the same side.
4.1. CA Strategy
This strategy is the result of the analytical solution of the problem defined in [
11], which demonstrated that if the drivetrain power loss characteristics are strictly monotonically increasing with torque demand, the minimum consumption is achieved by using one motor on each side of the vehicle (i.e., SA) up to a torque demand threshold, and an even torque distribution (i.e., ED) among four motors above that threshold. Depending on the side torque demand and for each speed, the switching torque between SA or ED is computed by comparing the side power losses introduced by these two strategies. In particular, the switching torque is the torque value at which the power losses of the SA are equal to the ED ones. Thus, it can be obtained as the solution of the following equation
where
is the switching torque. In Equation (
17) the front-to-total torque ratio,
r, is set to assume only the value associated with the SA and the ED, respectively 1 and 0.5. Notably, the left-hand side of Equation (
17) represents the power losses of the SA strategy, where the front motor supplies all the torque demand, while the right-hand formulation indicates the power losses of the ED, where each motor provides half of the total torque demand.
Due to the presence of a single speed transmission, the shift between the parameters at the motors level and the ones at the wheels is straightforward through the gear ratio. The final result of the optimisation procedure is a curve representing the switching torque as a function of the vehicle speed, and the following torque distribution:
where
and
are, respectively, the torque provided by the front and rear drivetrains, to supply the side wheel torque demand
of the vehicle (
) If, for a certain vehicle speed, the side wheel torque demand is lower then the switching torque, then the SA will be the optimal solution, otherwise if the torque demand is greater than the switching torque then the ED is the optimal solution.
The CA strategy identifies the optimal distribution for the maximum efficiency operation of the motor. Depending on the motor type, the highest efficient operating area may be located in different torque-speed regions. In case power losses are a convex function of the torque, it has been demonstrated [
4,
11] that the optimal strategy is the ED.
The switching torque values are stored as a 1-dimensional look-up table in the Torque Allocator block of
Figure 1.
4.2. I-CA Strategy
In the I-CA strategy, according to Equation (
6), an offline optimisation calculates the motor power losses for a range of front-to-total torque ratios between 0.5 and 1, for all the possible speed-torque combinations. The optimal front-to-total torque ratio,
r, is selected as the value providing minimum energy consumption at the given torque and speed. The optimisation problem is solved using the MATLAB function
fminbnd, which finds the local minimum of the power losses function in the given interval (
), based on golden section search and parabolic interpolation.
The resulting I-CA map takes as input vehicle speed and side torque demand, and outputs the optimal front-to-total torque ratio. With respect to the CA, the I-CA strategy allows intermediate distribution between the SA and the ED. The I-CA map for every speed-torque values leads the motor to work with the best efficiency characteristic and thus, further energy savings are expected.
Regarding the online implementation, the calculation of the optimal front-to-total ratio is based on a 2-dimensional look-up table.
5. Simulation Results and Discussion
In this section, firstly the simulation model and the energy efficient torque distribution strategies for the considered case study are illustrated. Then, the results obtained under the optimal torque distribution strategies and the standard ones are presented and discussed.
5.1. Vehicle Simulation Model
To verify the effectiveness of the proposed energy efficient torque distribution strategies, simulations were carried out in a Simulink/Simscape environment. The developed vehicle simulation model [
30,
31] is shown in
Figure 6. The driver is modelled through a PI speed controller that follows the speed profile imposed by the selected driving cycle.
The Torque Allocator block, reported in
Figure 7, provides the front-to-total torque ratio per vehicle side for the different strategies with respect to the target torque.
Giving as input vehicle parameters, the characteristics of the powertrain components together with their efficiencies and the look-up table of the energy efficient torque distribution strategies, the developed model is able to compare different torque distribution strategies. The performed simulations provide, as output, power losses of the powertrain, energy consumptions and battery SOC.
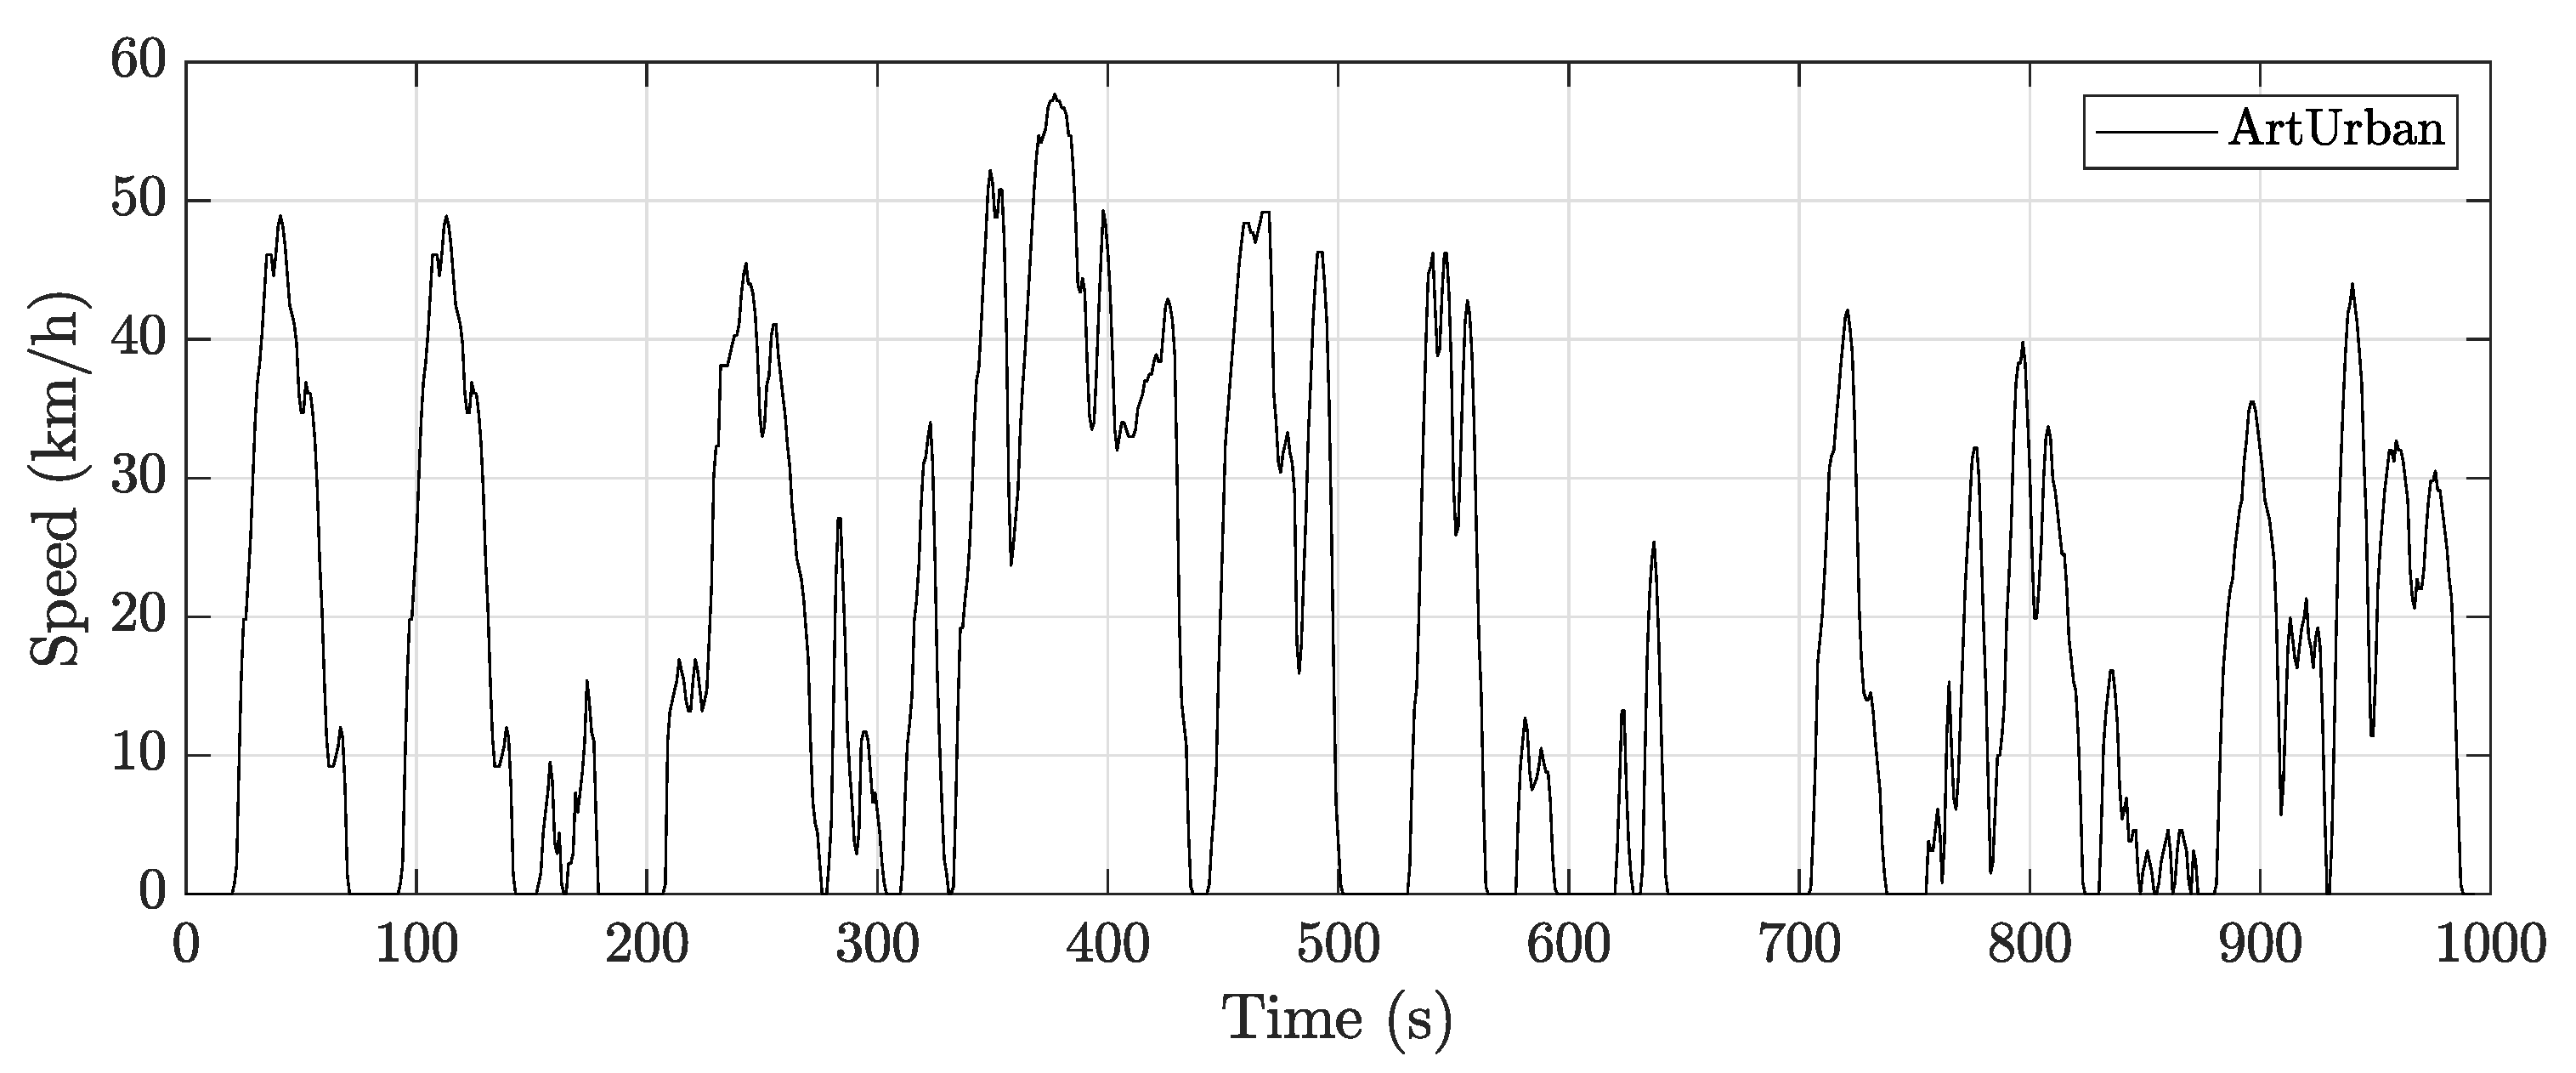
To evaluate the strategies three driving cycles [
32] have been used: the New European Diving Cycle (NEDC), the Worldwide Harmonised Light Vehicle Test Procedure (WLTP) class 3 which is more representative of the real vehicle usage, and the Artemis Urban (ArtUrban) cycle (
Figure 8) which features an extended range of speeds and high levels of accelerations and decelerations, typical of everyday driving.
The dimensional data of the vehicle are in line with typical values for commercial electric vehicles [
18].
Table 1 reports the main vehicle parameters.
Regarding the powertrain data, each component characteristic has been selected according to the vehicle performance and driving range of currently available electric vehicles [
18]. With the data of
Table 2 the vehicle achieves a top speed of 150 km/h, an acceleration time of 11.4 s for 0–100 km/h and a driving range of 350 km over the NEDC cycle with minimum SOC of 20%.
5.2. CA Computation
The optimal torque distribution that minimises drivetrain power losses is achieved by switching between SA and ED depending on side torque demand and vehicle speed. The switching torque, defined in
Section 4, is computed by comparing the motor power losses as a function of the torque induced by the ED and SA distributions.
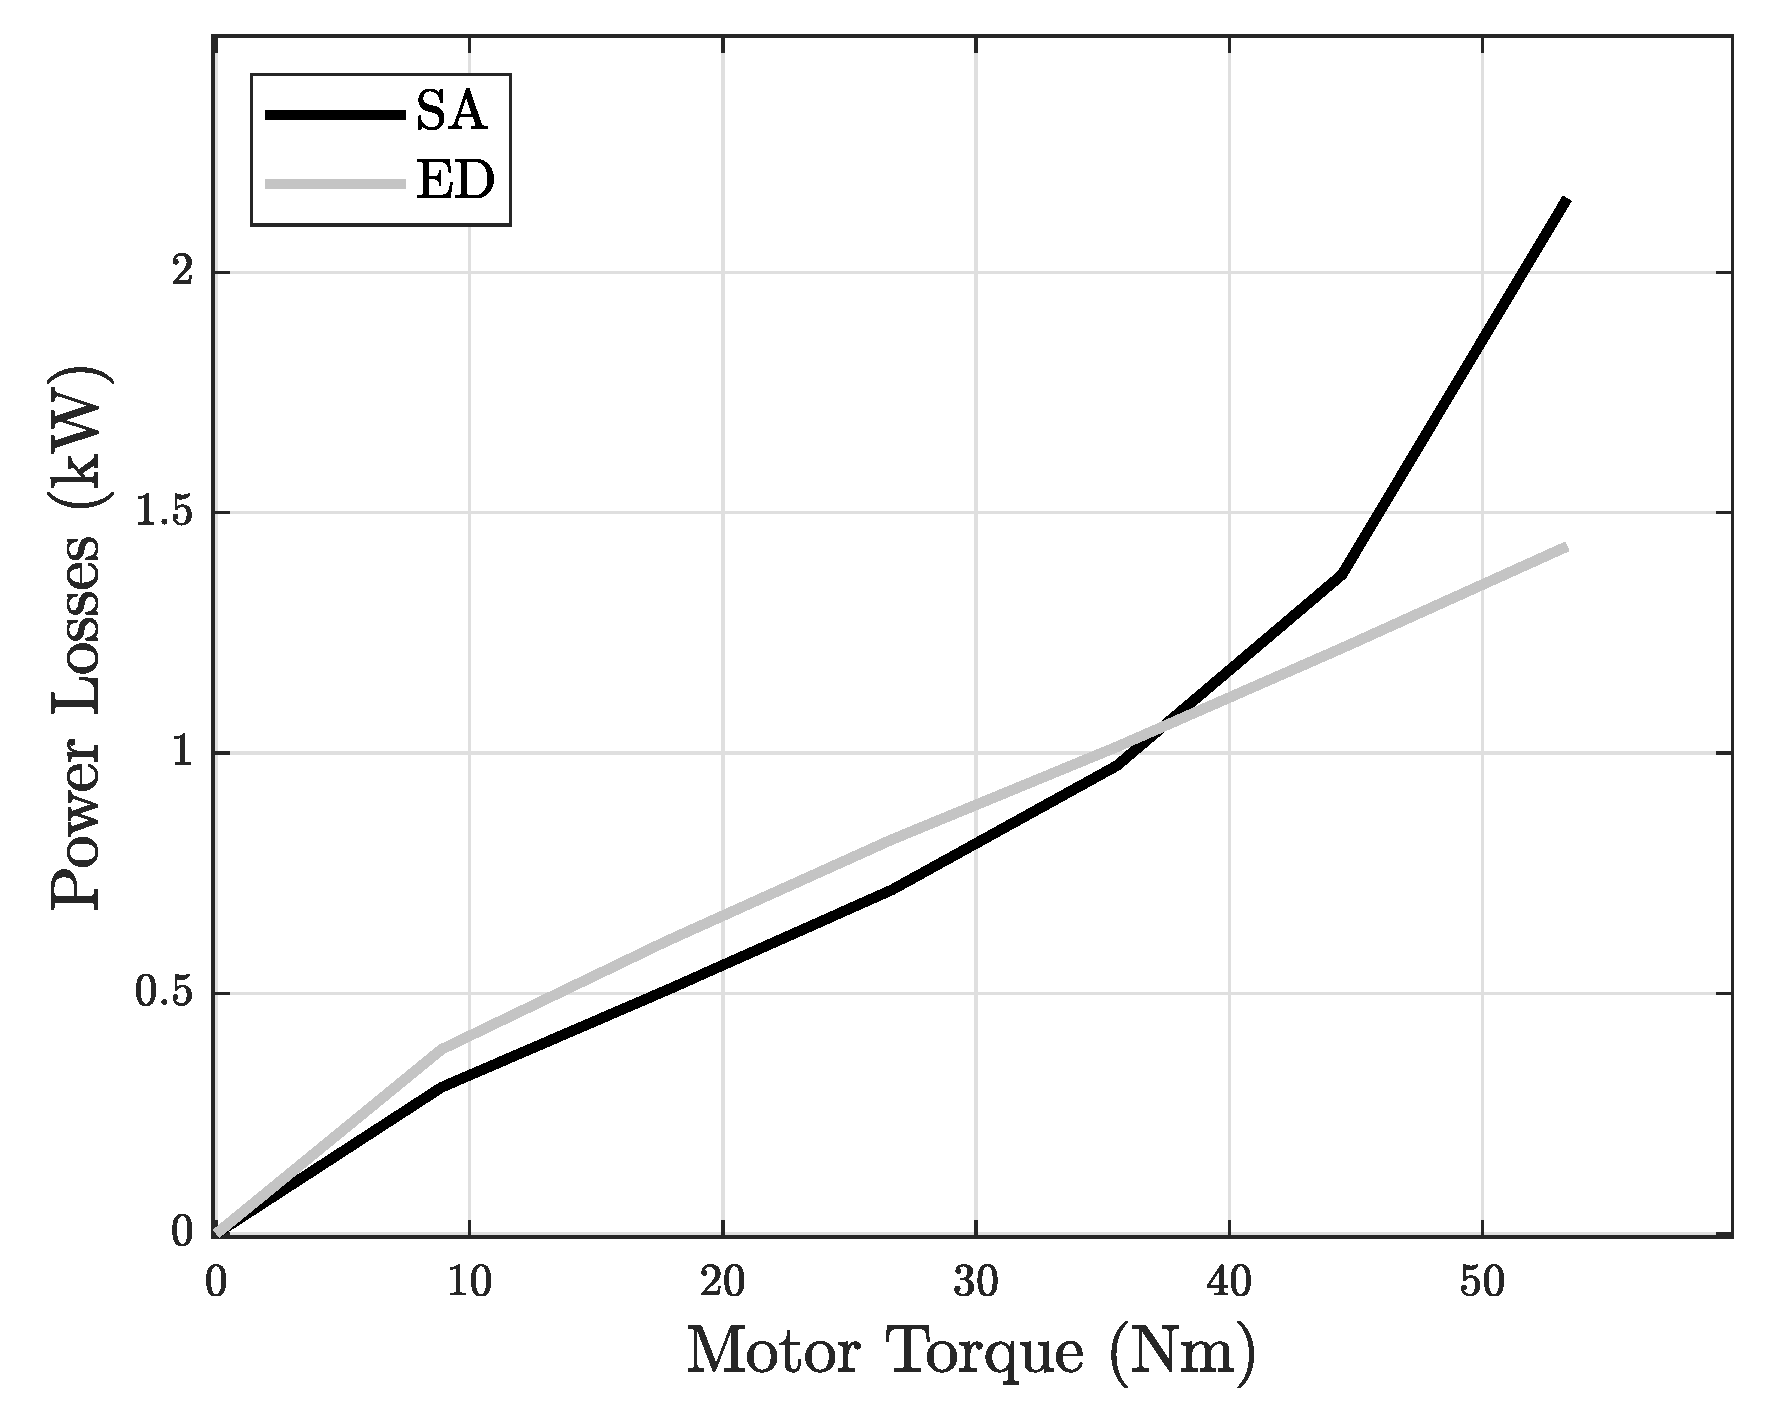
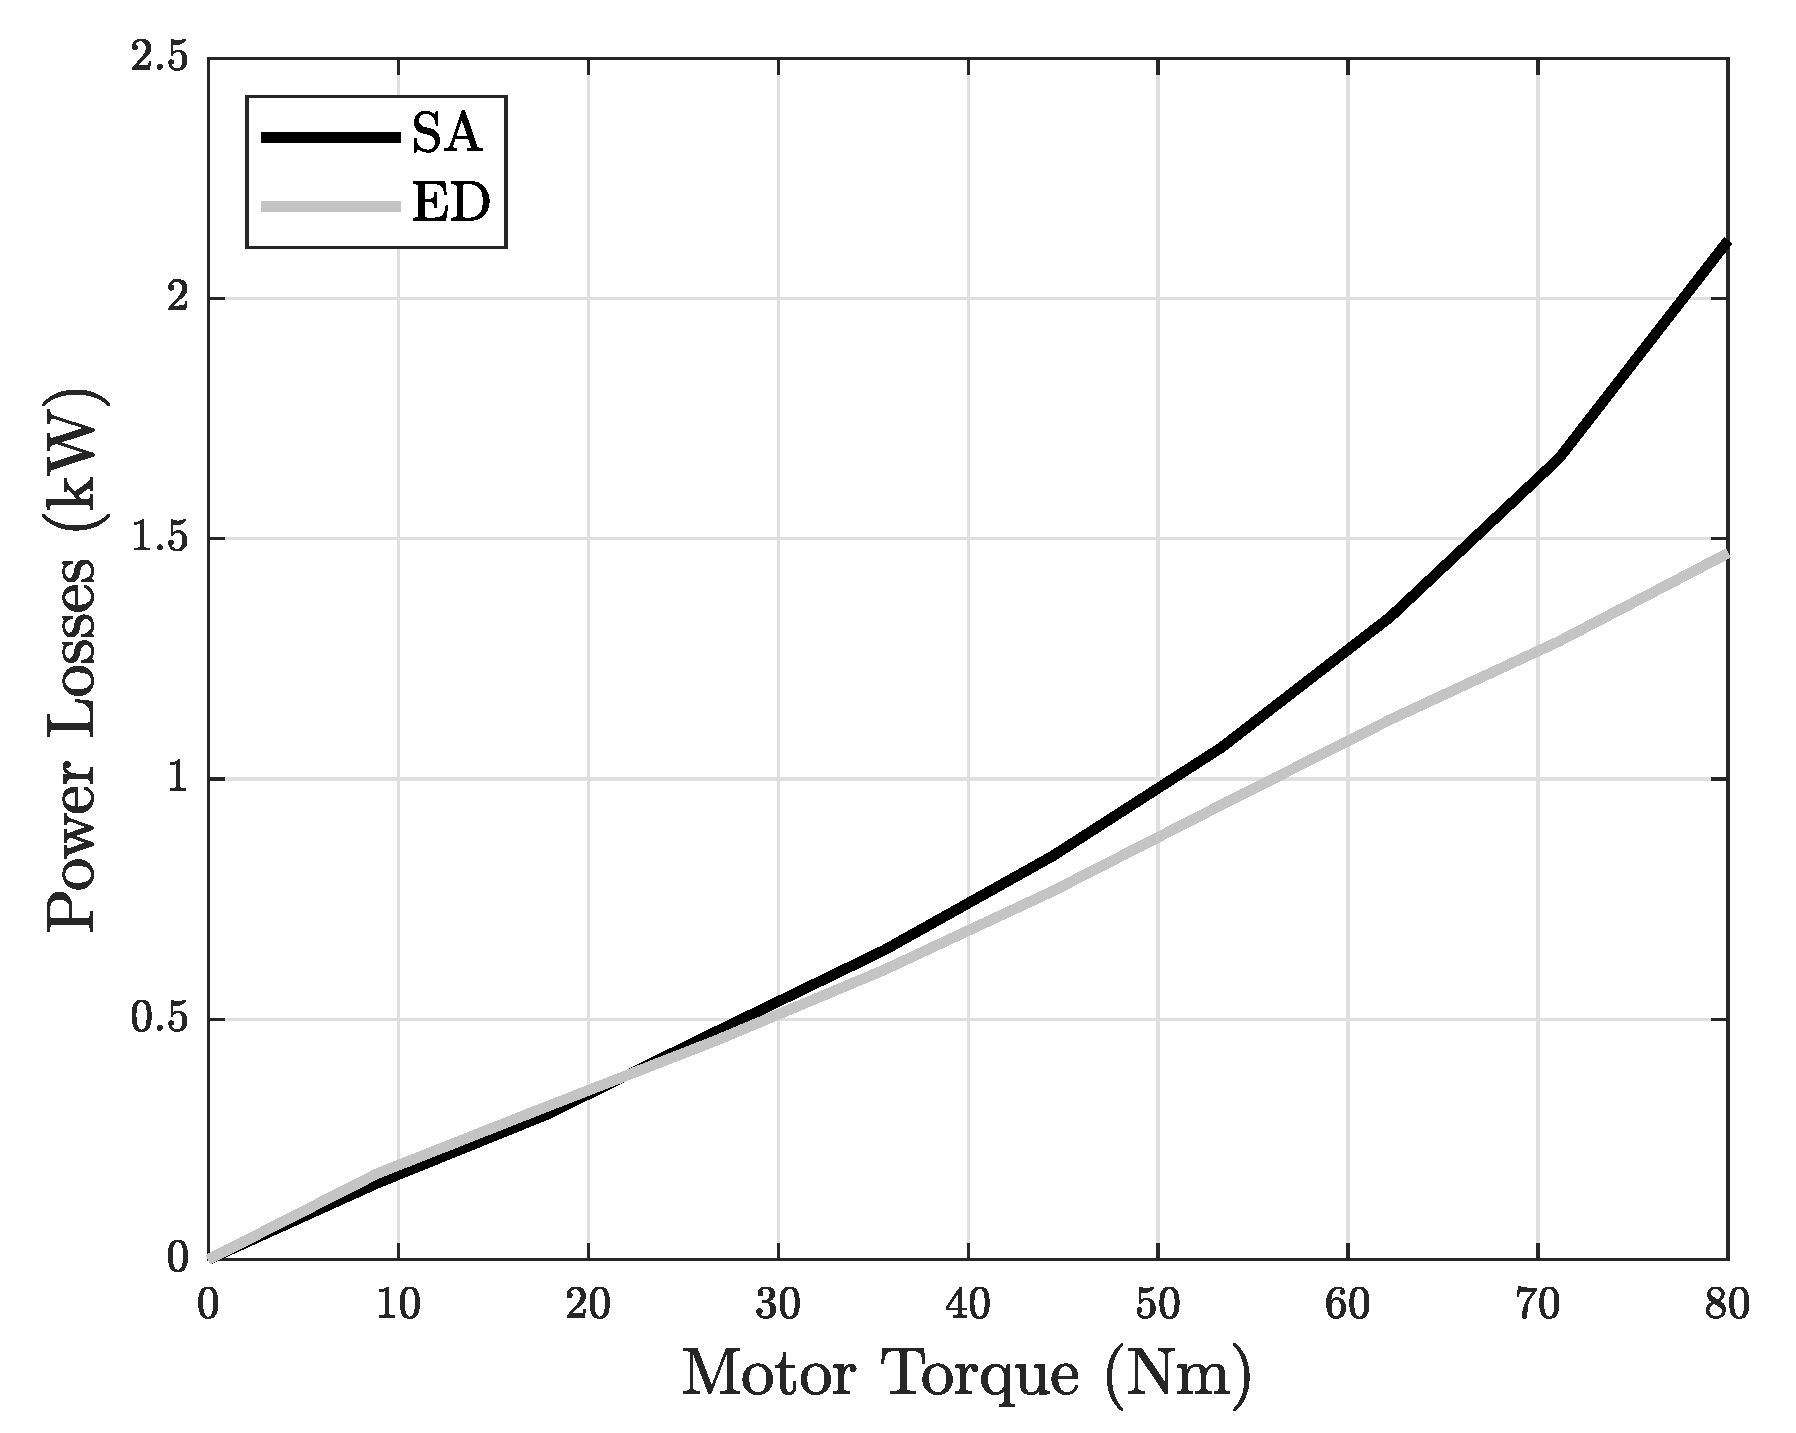
Figure 9 shows the comparison of motor power losses in ED and SA configuration, at a sample angular speed of 4570 rpm. The SA strategy presents lower power losses until 38 Nm, then for higher torque demand it results more efficient to switch the ED. While one motor would have still been able to provide the required side torque, that would have increased power losses with respect to using the ED. For example, for a side torque demand of 50 Nm the SA leads to 1.7 kW of power losses, against 1.3 kW for the ED.
By comparing motor power losses of SA and ED for every speed, the switching torque as a function of the vehicle speed can be obtained (
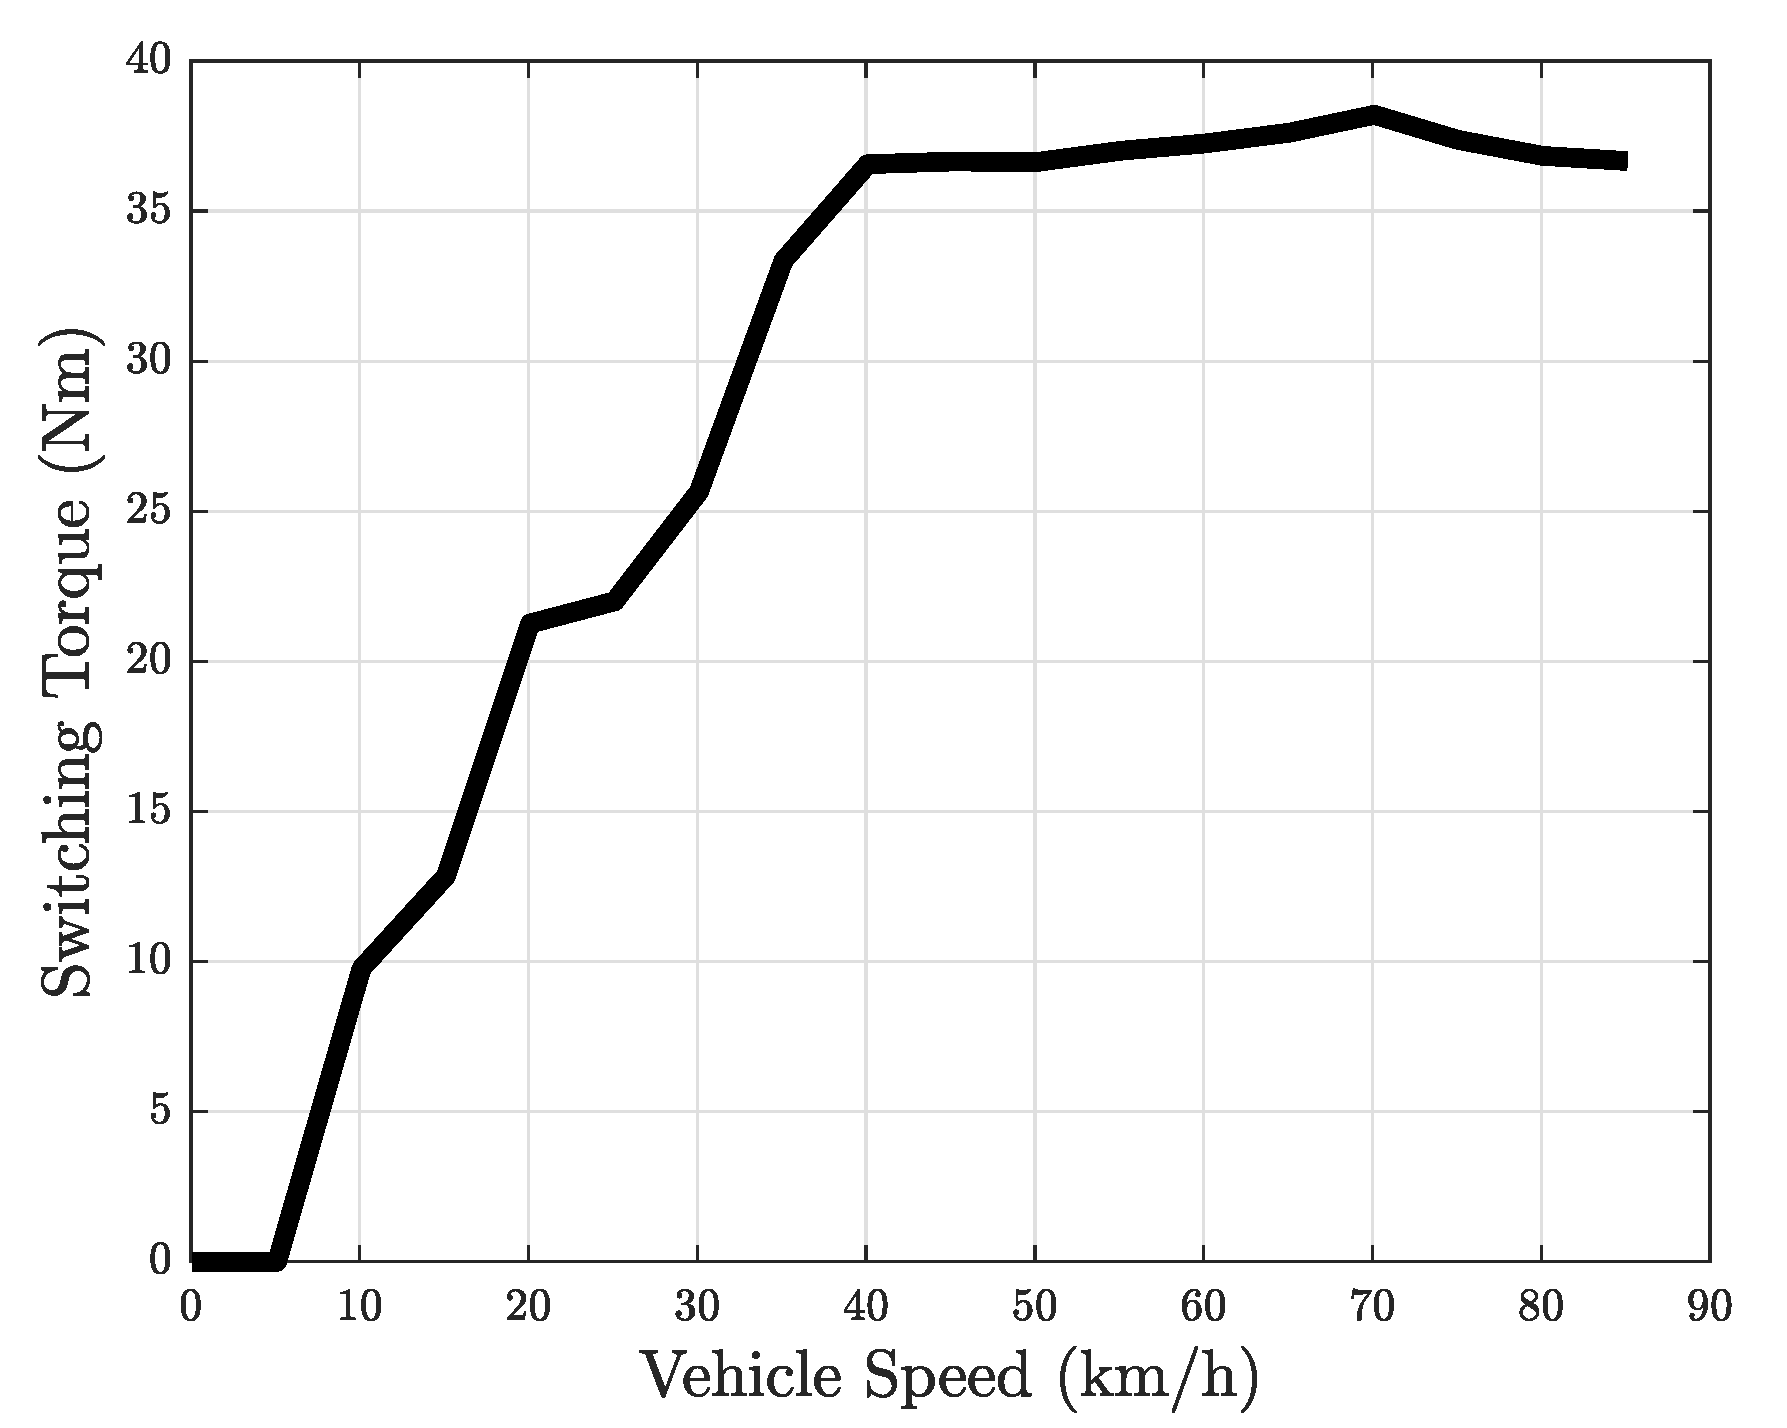
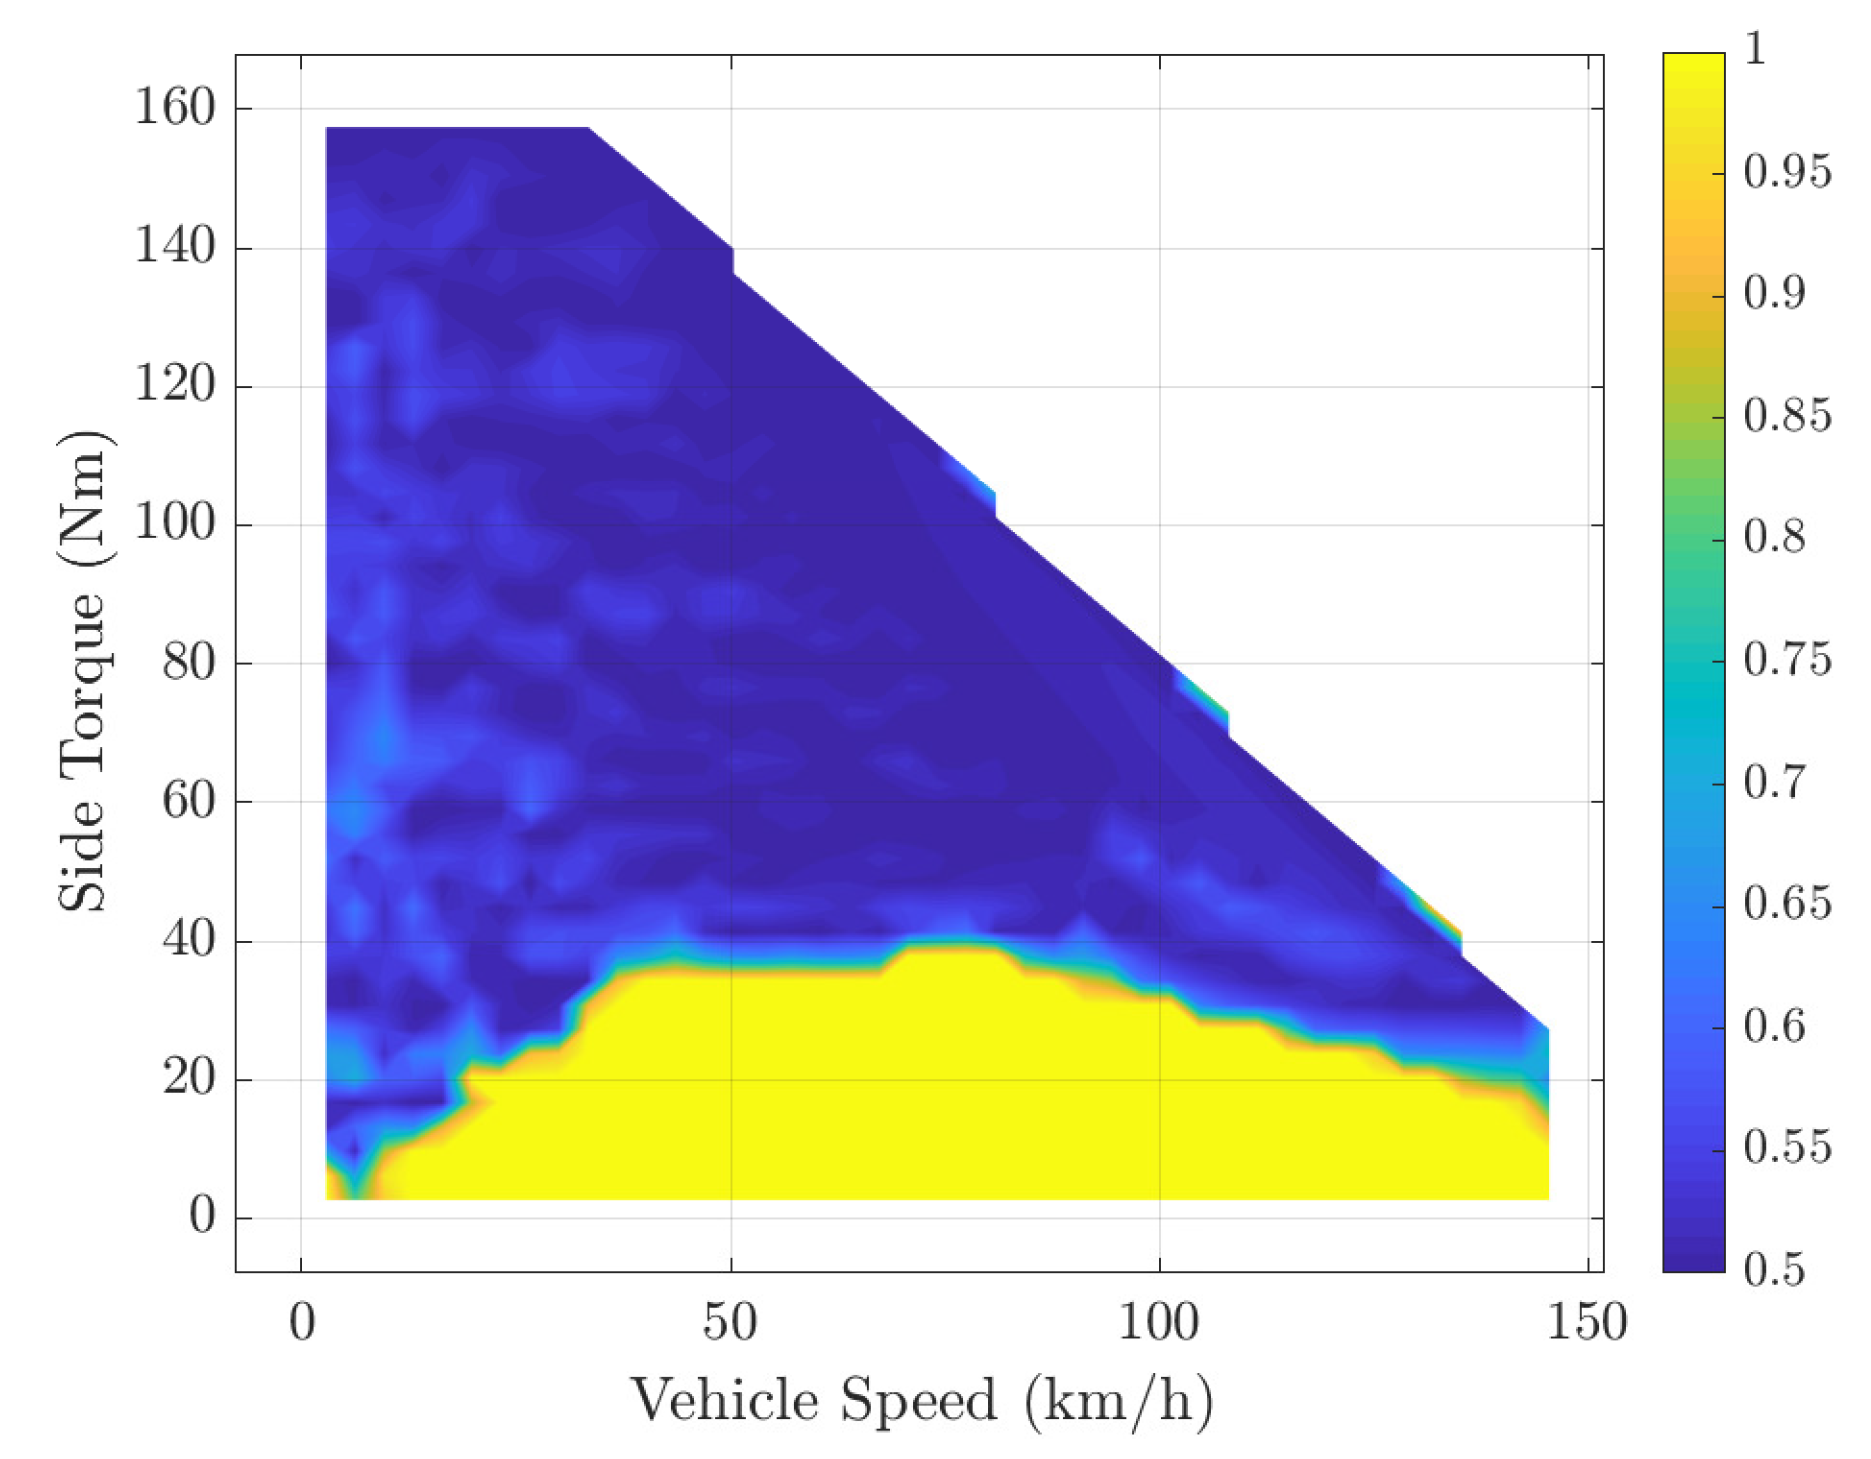
Figure 10). The CA strategy for low vehicle speed (up to 5 km/h) suggests an even distribution regardless of the torque demand. In the high speed range, the CA suggests the SA distribution for torques below ≈37 Nm.
5.3. I-CA Computation
The computation of the I-CA generates a map that, for every side torque-speed combination, returns the optimal front-to-total ratio that minimises power losses.
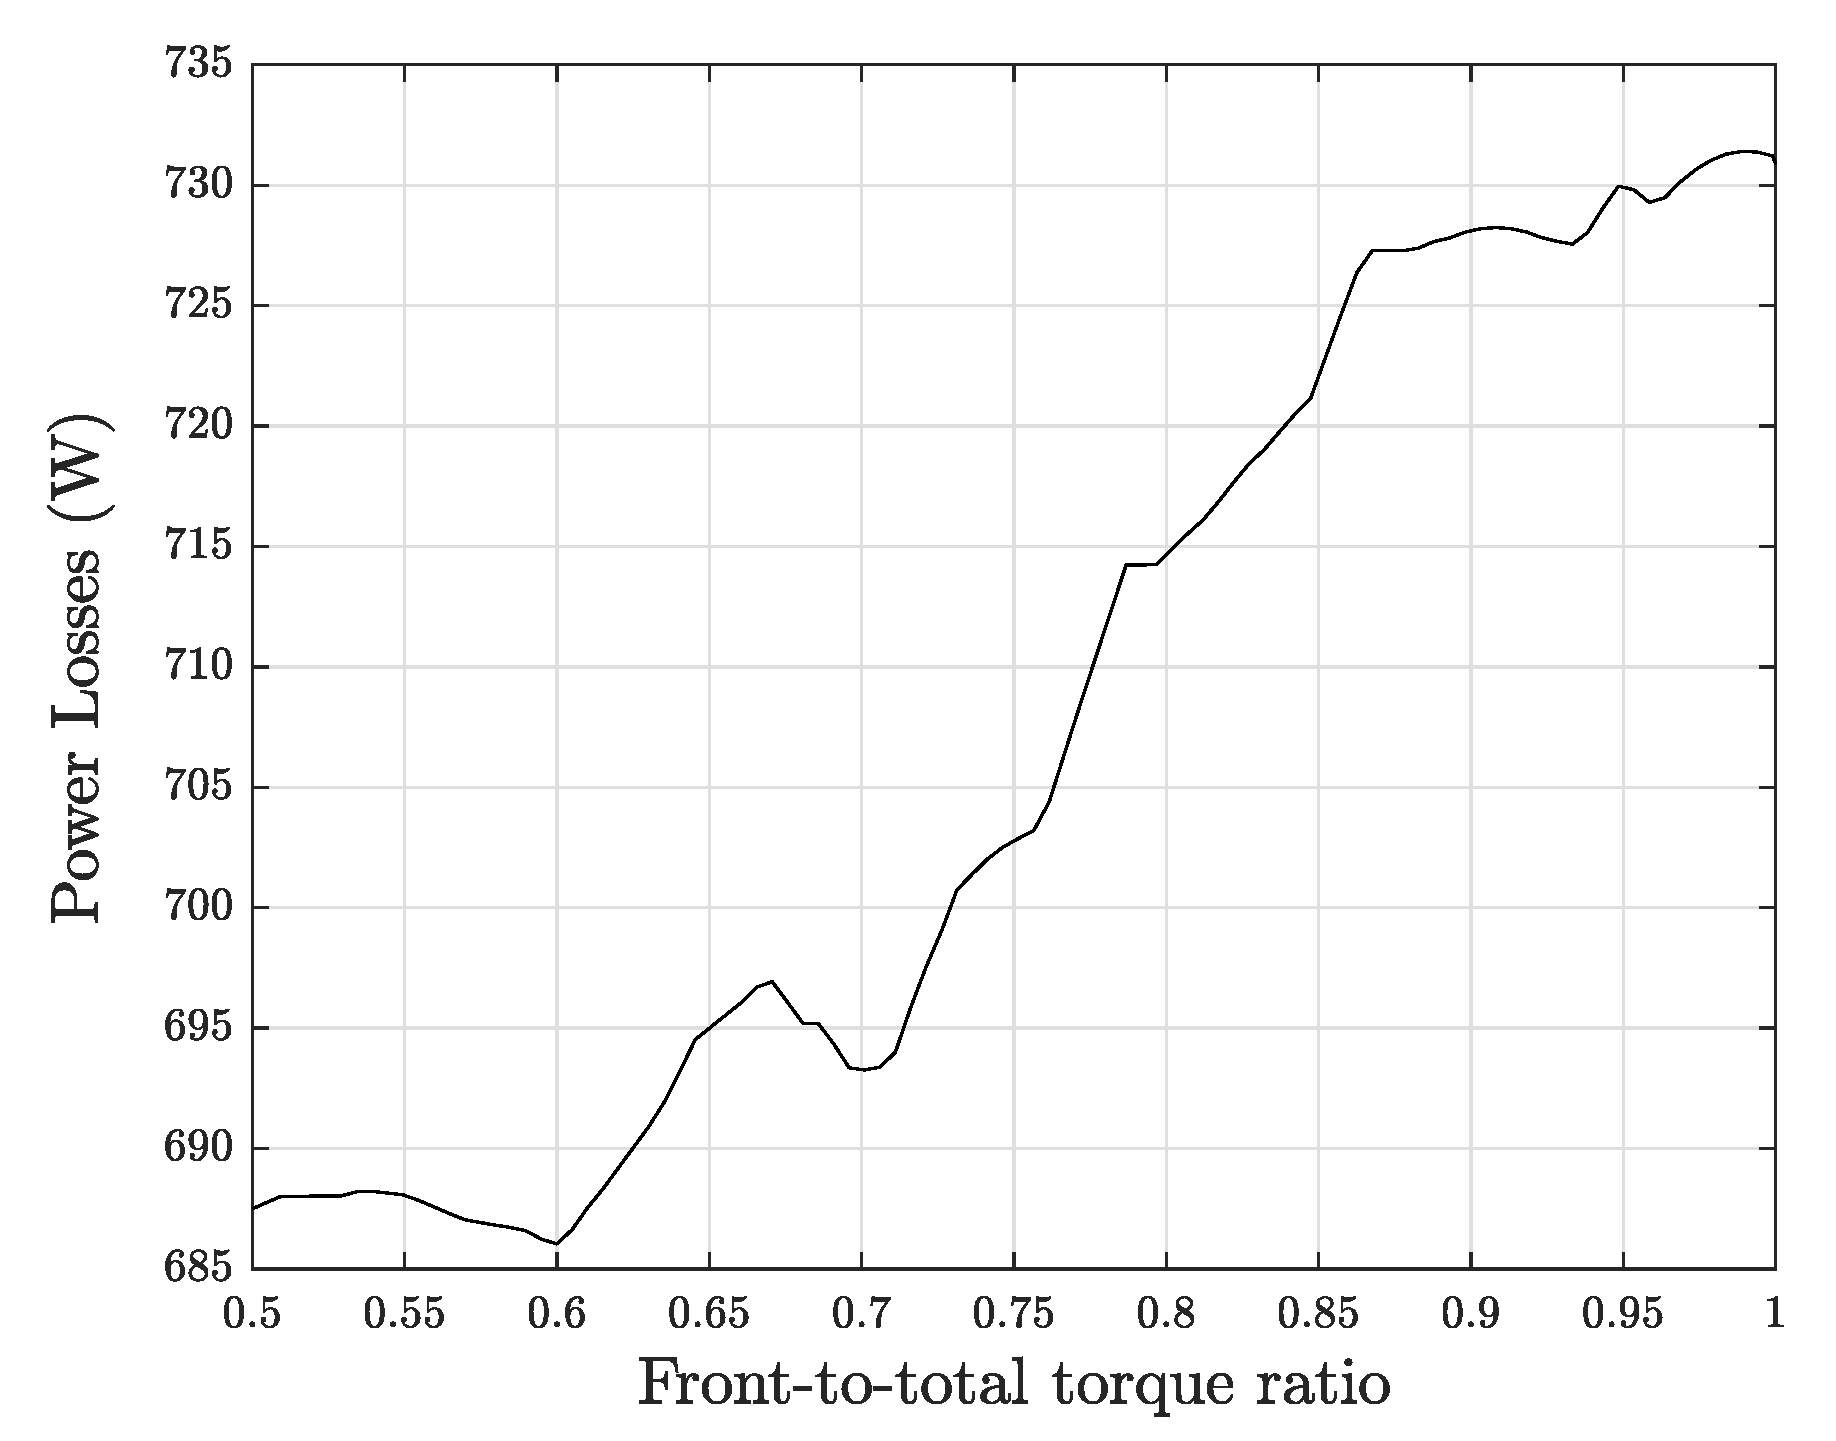
The optimisation procedure, for each point of the speed-torque plane, computes motor power losses for different front-to-total torque ratios. For example,
Figure 11 shows side motor power losses as a function of the front-to-total torque ratio at a constant angular speed of 1720 rpm and a side torque demand of 40 Nm. For this condition the I-CA suggests a front-to-total ratio of 0.6. It is interesting to notice in
Figure 12 that with the same working condition the CA provides the even distribution.
The resulting I-CA map of the optimal front-to-total torque ratio, as a function of vehicle speed and the side torque demand, is reported in
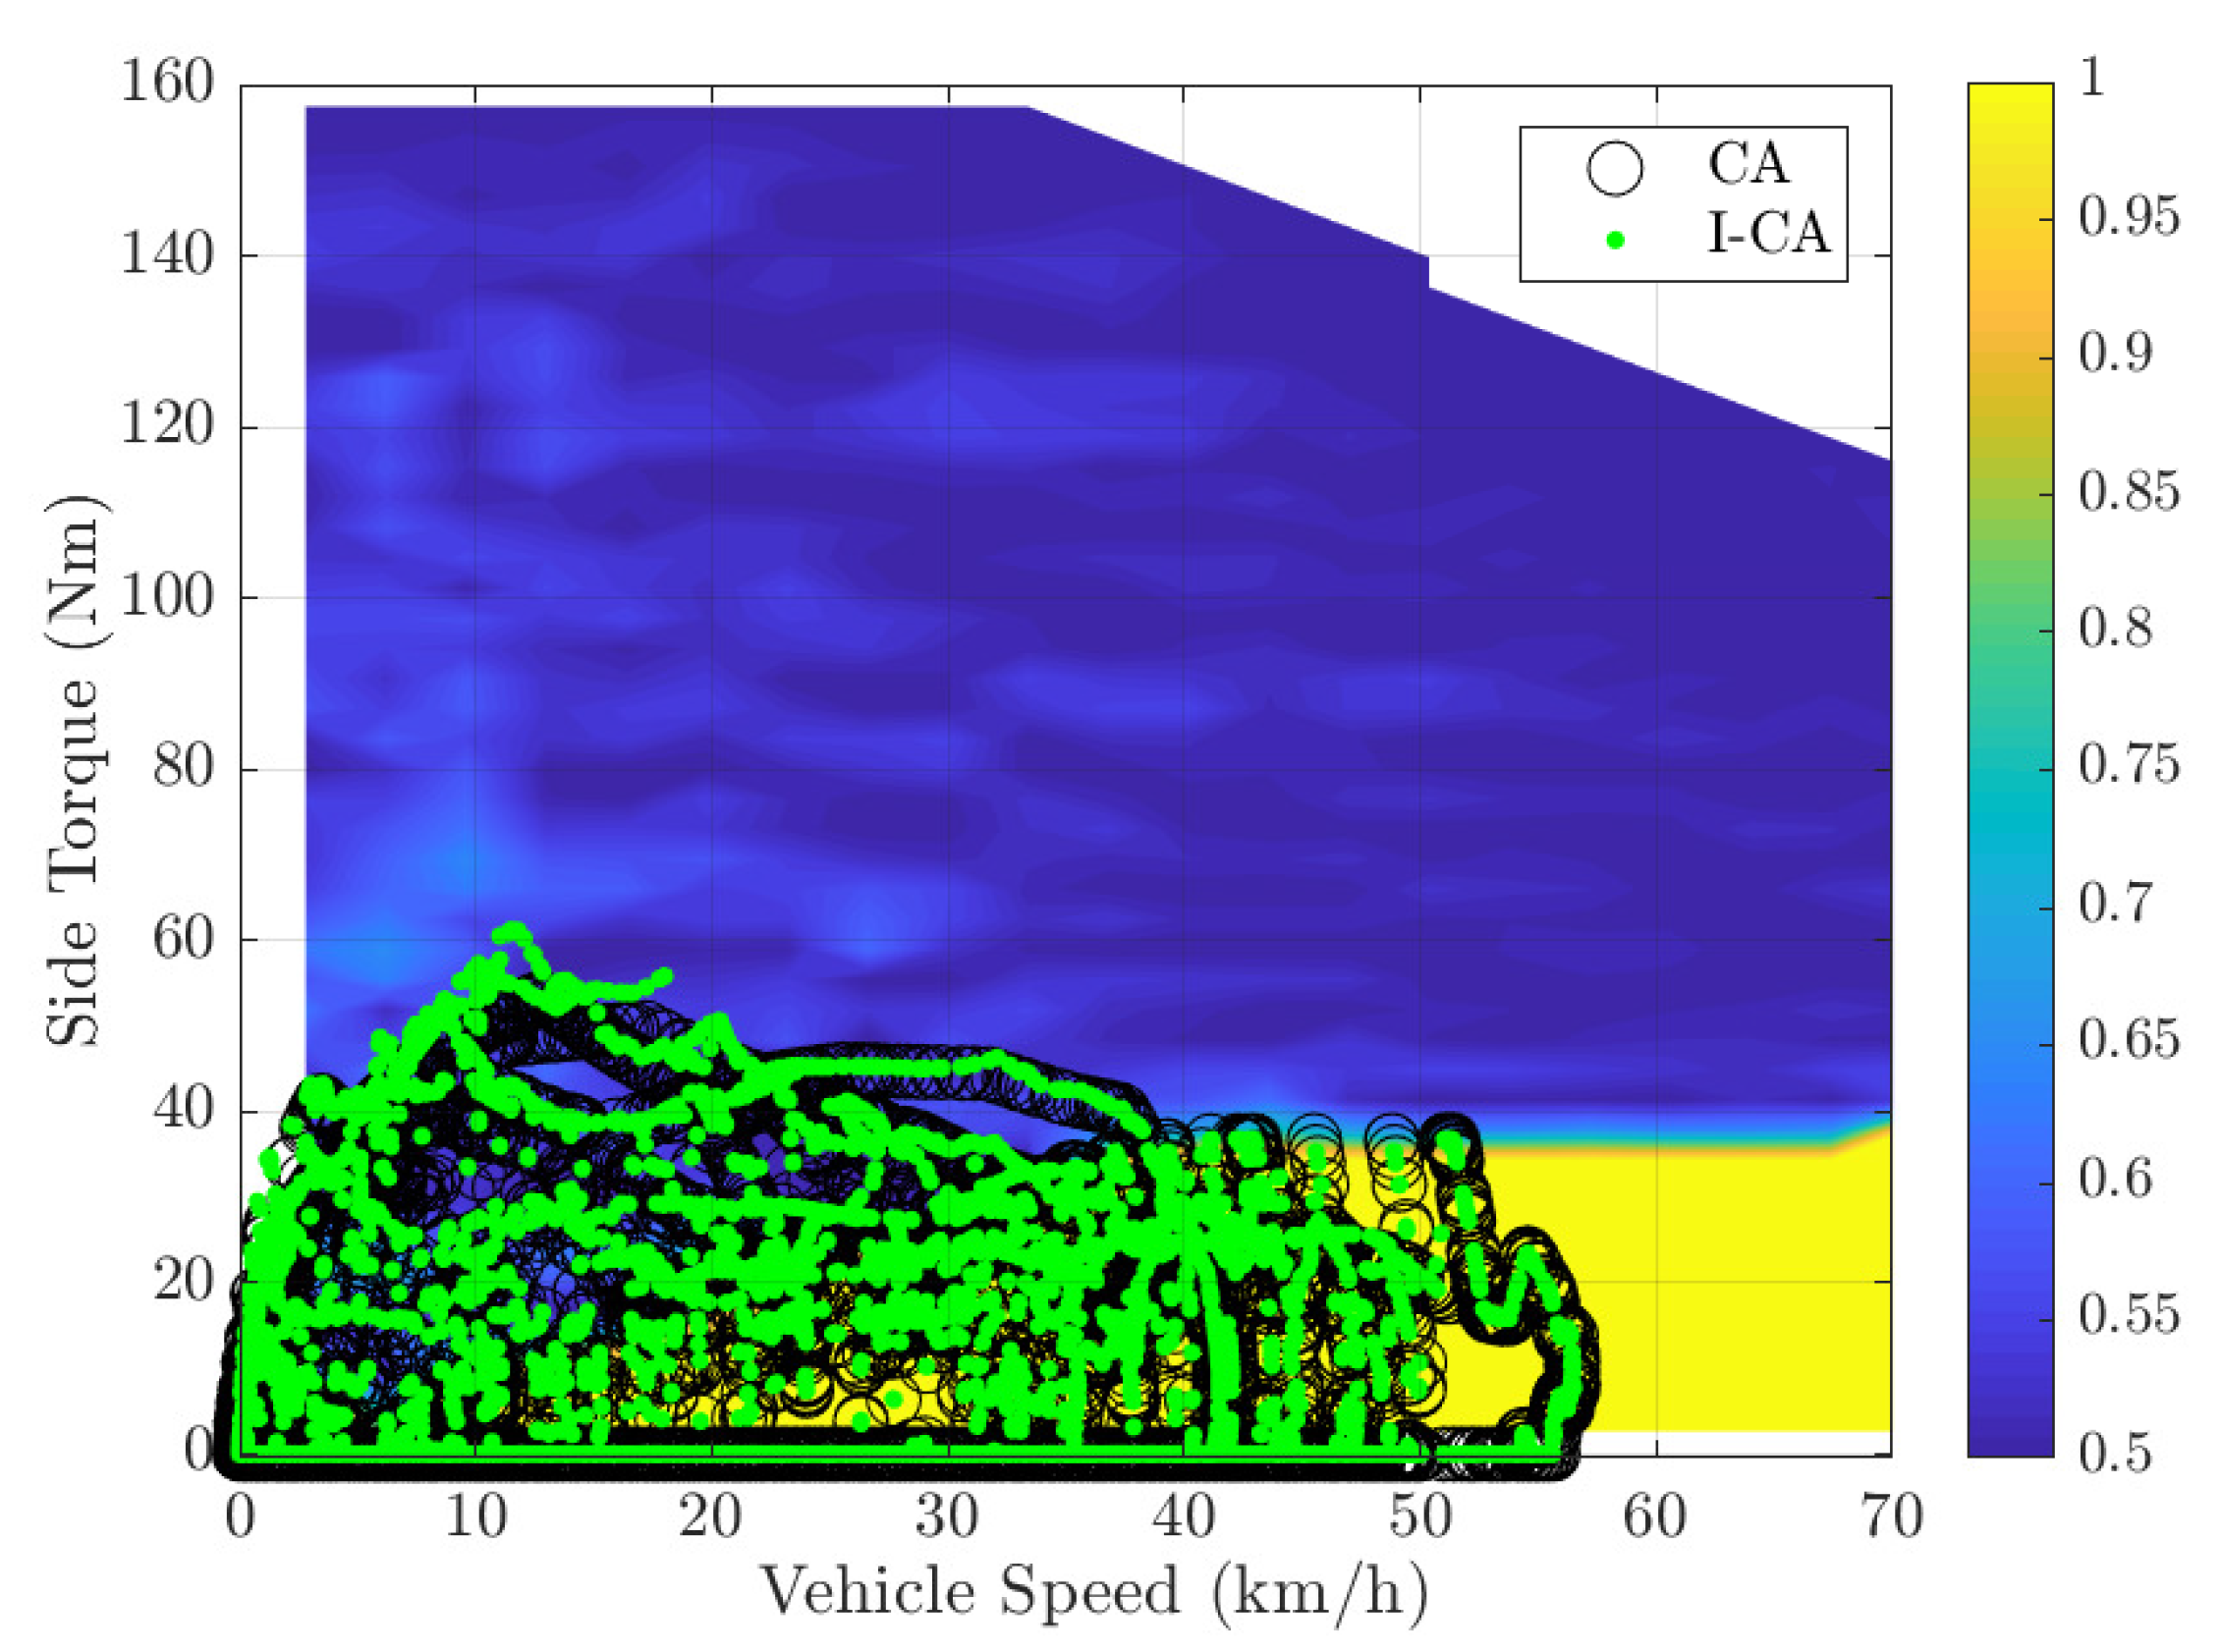
Figure 13. The general trend is towards the SA at low torque demands and the ED at medium-high torque demands, resembling the CA strategy (
Figure 10, note the different scale for the vertical axis). Due to the specific efficiency maps available in this study, the range of the I-CA map with values different from 0.5 and 1 is limited, thus the I-CA is expected to provide similar front-to-total torque ratios and similar results to the CA. However in general the I-CA strategy looks for the optimal distribution among all the possible front-to-total torque ratios, hence offering more potential for energy saving compared to the CA. In case of a map such as the one in
Figure 14, with more optimal points within
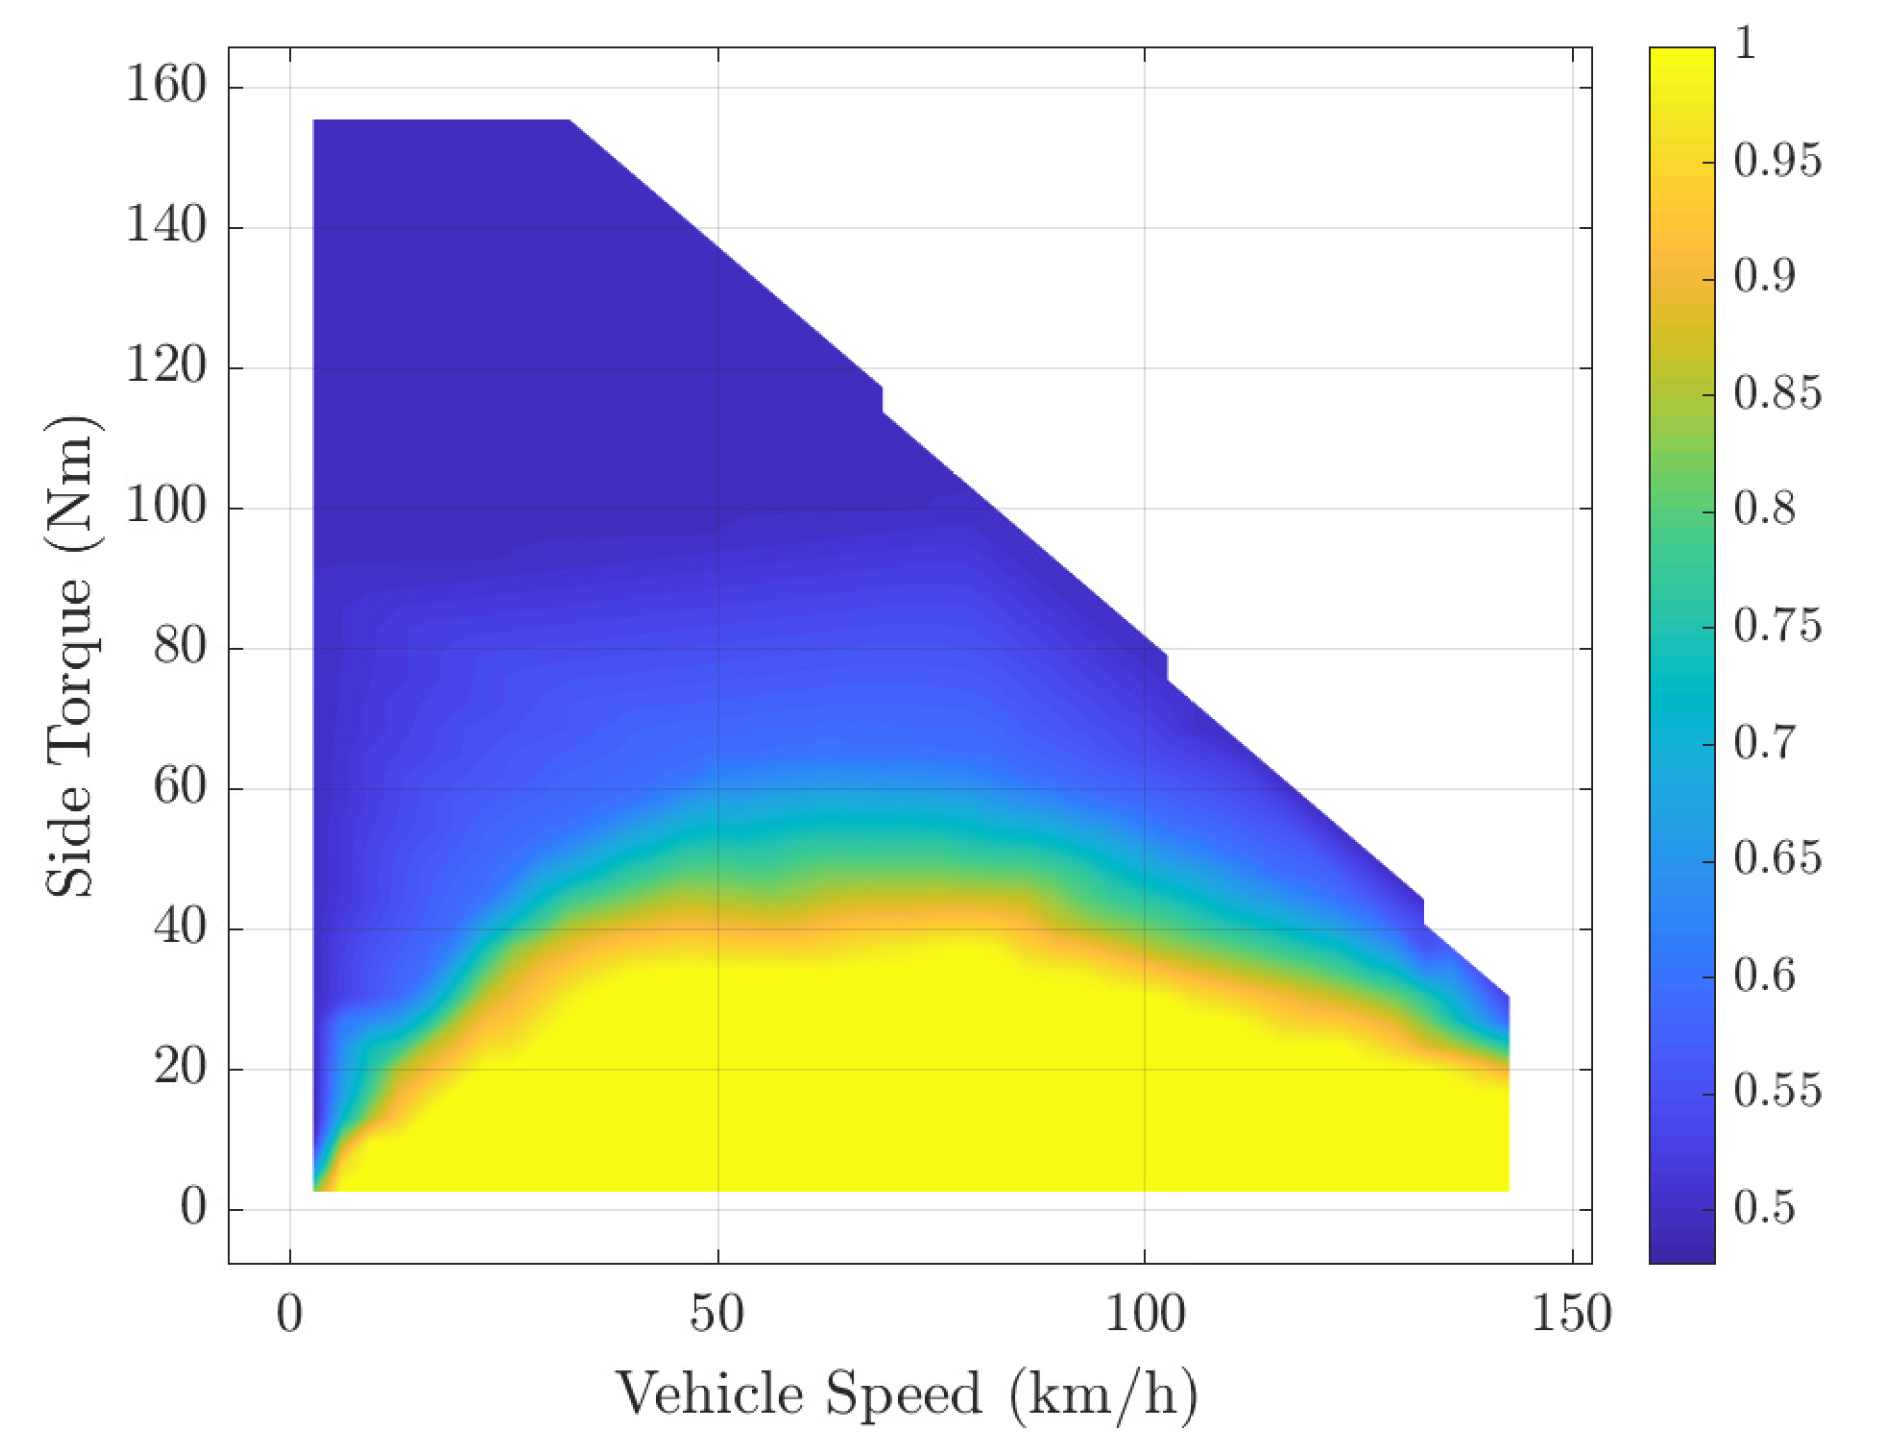
rather than 0.5 or 1, the I-CA has the potential to provide significant improvements with respect to the CA strategy. In fact, in such a case the switching torque approximation would not be accurate enough.
5.4. Results
This section presents the simulation results obtained with the considered case-study vehicle. The different strategies are compared in terms of energy consumptions and energy losses.
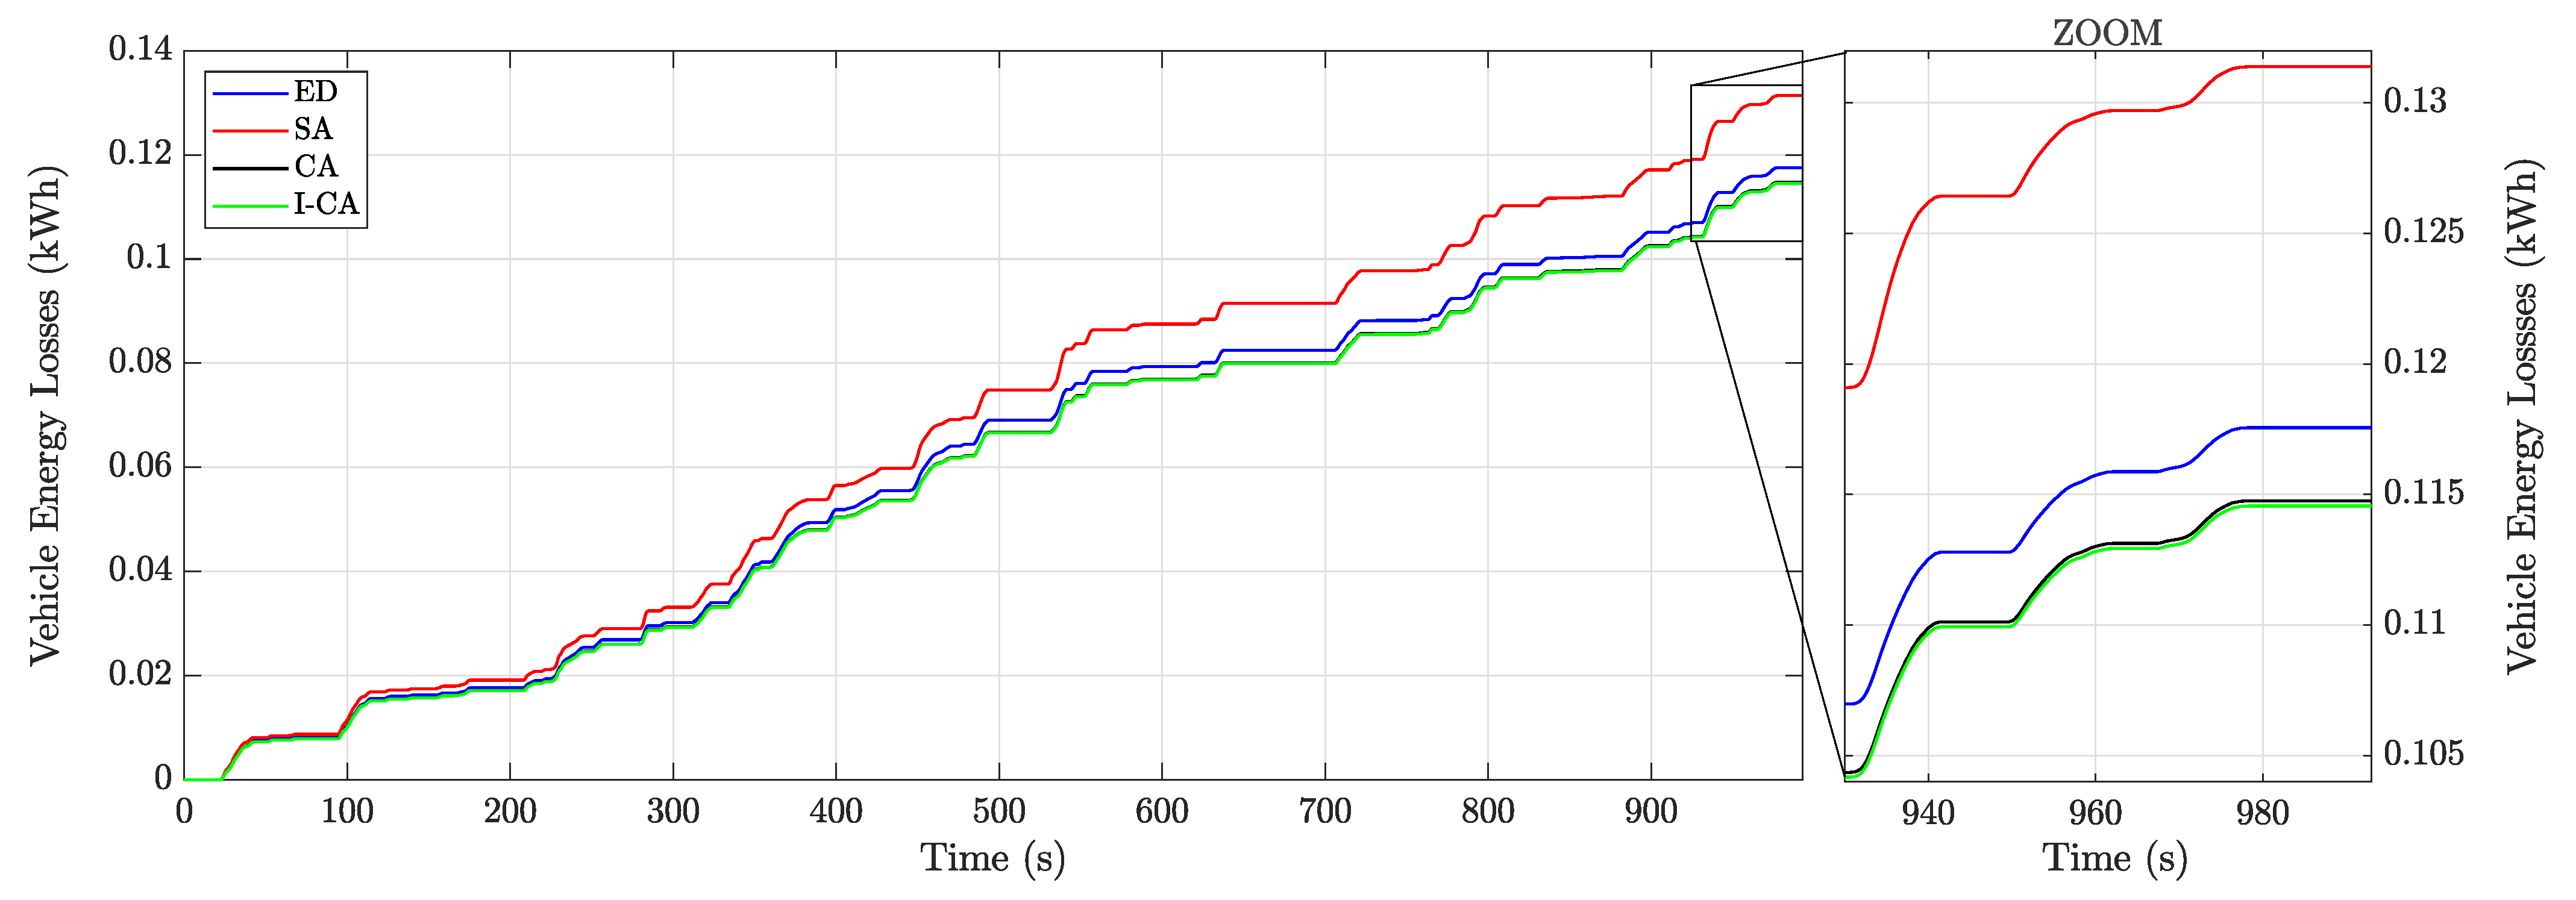
The drivetrain energy losses for the ArtUrban cycle are shown in
Figure 15. It can be observed that an even torque distribution between the four motors leads to higher energy losses, while the distribution provided by the I-CA strategy is the one that allows lower energy losses. It is interesting to notice that the results of the ED, CA and I-CA map are very similar, this implies that the ED configuration is close to the optimal one. This can be explained by looking at
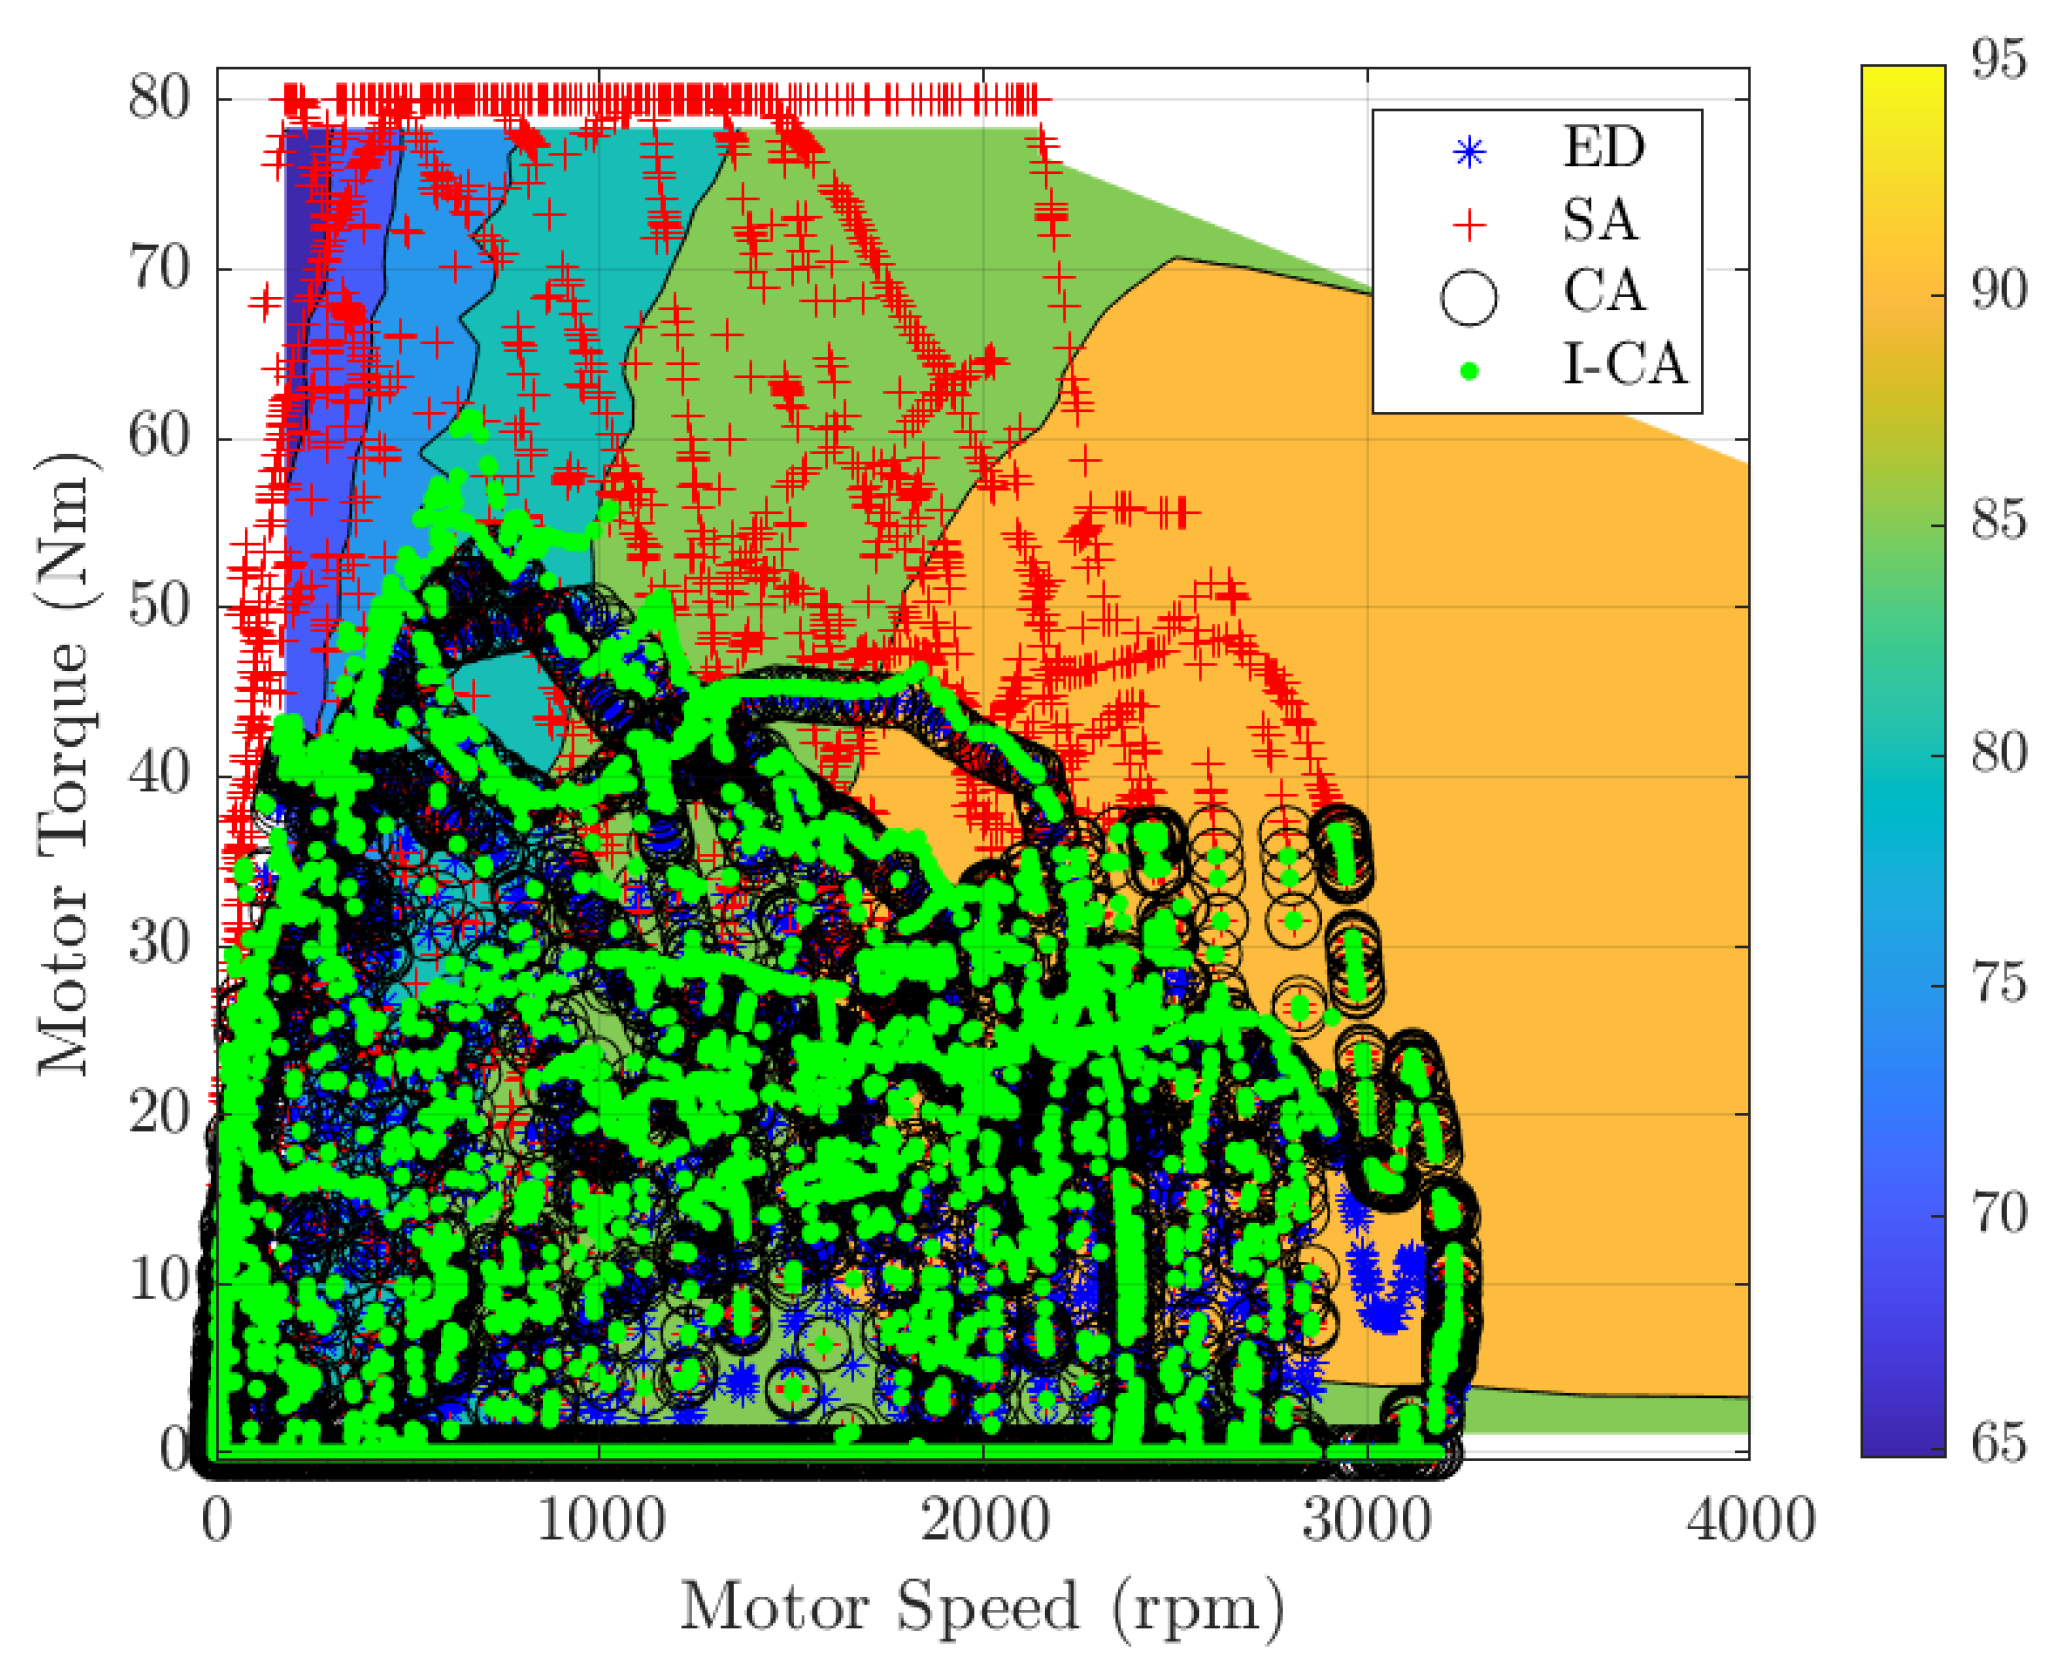
Figure 16, in which the operating points of the front motor under the different torque distribution strategies are drawn over the motor efficiency map. Notably, the SA provides medium-high level of torque demands and the operating points fall within the region where the efficiency is lower. On the other hand, the ED strategy presents lower levels of torque demand, matching the region where the motor efficiency is higher. Therefore, the CA and the I-CA strategies provide a small improvement with respect to the ED strategy and greater improvement with respect to the SA.
In most conditions, the resulting torque distribution of the CA and the I-CA is the same. The difference is due to the intermediate regions of the I-CA map with
.
Figure 17 shows the operational points for the ArtUrban driving cycle over the I-CA map. The percentage of points that fall within the intermediate region with
is limited to 8%, while the most frequent working condition falls in the area with
, which correspond to the ED configuration.
Table 3 compares the energy consumption calculated for the different strategies over the three considered driving cycles. The I-CA strategy provides up to 5.5% of the energy consumption reduction with respect to the SA (along the ArtUrban cycle), while the energy savings with respect to the ED distribution are lower. This is due to the fact that along the ArtUrban cycle driving cycle the ED keeps the motors working in regions with higher efficiency than the regions selected by the SA. On the contrary, along the NEDC cycle, under the ED the working points lie in the area with lower efficiency compared to the SA. Hence, the improvements of the energy efficient torque distribution strategies with respect to the ED are higher along the NEDC cycle. Depending on the driving cycle, greater improvements might be obtained for electrical machines that offer efficiency maps with the most efficient area placed in the low-medium speed and low-medium torque range (e.g., brushless permanent magnet motors [
22]).
According to the obtained results, the implemented torque distribution strategies improve the vehicle operational efficiency, which directly contributes to the extension of the driving range. Thus, it is of interest to verify the effect of the different torque distribution strategies on the battery SOC and its autonomy range.
Table 4 compares the implemented torque distribution strategies with respect to the resulting SOC of the battery after 350 km. The energy efficient torque distribution strategies allow an extended autonomy of up to 7 km (with respect to the ED) over the NEDC driving cycle, and 34 km compared to the SA over the ArtUrban cycle.
As an example,
Figure 18 shows the State of Charge of the battery after 100 km under the ArtUrban cycle, for the implemented torque distribution schemes.
6. Conclusions
The presented paper investigated optimal torque distribution strategies for enhancing the operational efficiency of electric vehicles with multiple motors. Two different energy efficient torque distribution strategies were implemented—the CA strategy, that switches between an even distribution and a single axle configuration, and the I-CA strategy, that for every speed-torque combination provides the optimal front-to-total ratio that minimises power losses. A vehicle longitudinal dynamic model was developed in Simulink/Simscape environment, assessing different torque distribution strategies with the integration of the elements of the electrical powertrain, including the battery. Simulation results show that the I-CA strategy always offers the higher energy saving, with a reduction in energy consumption up to 5.5%. Greater improvements may be reached depending on the motor efficiency map. Moreover, it was shown that compared to standard torque splitting schemes, the energy efficient torque distribution strategies have also positive effects on the battery, improving its SOC and the driving autonomy range on standardised driving cycles.
The presented approach can also be used for different powertrain layouts, such as all-wheel drive vehicles with dual motors (one per axle), or for all-wheel drive (AWD) vehicles with four in-wheel motors. In both scenarios, the presence of multiple motors implies a redundancy that can be exploited in the torque distribution strategy to improve efficiency. In the case of dual motors, the presence of a mechanical differential must be taken into account as an additional source of power losses.
Future studies will also investigate the effects of the I-CA in terms of fatigue of the mechanical components of the powertrain, as well as more advanced models for the battery featuring a nonlinear relationship between voltage and SOC.
We trust that the presented techniques will contribute to accelerating the advent of electric vehicles and their large-scale uptake. Together with vehicle automation, electrification is the future of passenger transportation.
Author Contributions
Conceptualization, S.S., B.L., G.L. and F.B.; methodology, S.S., B.L. and G.L.; validation, S.S. and B.L.; investigation, S.S., B.L., G.L., F.B., L.S.; resources, B.L., G.L. and L.S.; writing—original draft preparation, S.S.; writing—review and editing, S.S., B.L., G.L. and F.B.; supervision, B.L. and G.L. All authors have read and agreed to the published version of the manuscript.
Funding
This research received no external funding.
Institutional Review Board Statement
Not applicable.
Informed Consent Statement
Not applicable.
Data Availability Statement
Data available on request.
Conflicts of Interest
The authors declare no conflict of interest.
Abbreviations
| EV | Electric Vehicle |
| EM | Electrical Machine |
| EPC | Electronic Power Converter |
| RESS | Rechargeable Energy Storage System |
| PMSM | Permanent Magnet Synchronous Machines |
| SOC | State of Charge |
| ED | Even Distribution |
| SA | Single Axle |
| CA | Control Allocation |
| I-CA | Implicit-Control Allocation |
References
- Sforza, A.; Lenzo, B.; Timpone, F. A state-of-the-art review on torque distribution strategies aimed at enhancing energy efficiency for fully electric vehicles with independently actuated drivetrains. Int. J. Mech. Control 2019, 20, 3–15. [Google Scholar]
- Gu, J.; Ouyang, M.; Lu, D.; Li, J.; Lu, L. Energy efficiency optimization of electric vehicle driven by in-wheel motors. Int. J. Automot. Technol. 2013, 14, 763–772. [Google Scholar] [CrossRef]
- Chatzikomis, C.; Zanchetta, M.; Gruber, P.; Sorniotti, A.; Modic, B.; Motaln, T.; Blagotinsek, L.; Gotovac, G. An energy-efficient torque-vectoring algorithm for electric vehicles with multiple motors. Mech. Syst. Signal Process. 2019, 128, 655–673. [Google Scholar] [CrossRef]
- Chen, Y.; Wang, J. Fast and global optimal energy-efficient control allocation with applications to over-actuated electric ground vehicles. IEEE Trans. Control Syst. Technol. 2011, 20, 1202–1211. [Google Scholar] [CrossRef]
- Pennycott, A.; De Novellis, L.; Gruber, P.; Sorniotti, A.; Goggia, T. Enhancing the energy efficiency of fully electric vehicles via the minimization of motor power losses. In Proceedings of the 2013 IEEE International Conference on Systems, Man, and Cybernetics, Manchester, UK, 13–16 October 2013; IEEE: Piscataway, NJ, USA, 2013; pp. 4167–4172. [Google Scholar]
- Yuan, X.; Wang, J.; Colombage, K. Torque distribution strategy for a front and rear wheel driven electric vehicle. In Proceedings of the 6th IET International Conference on Power Electronics, Machines and Drives (PEMD 2012), Bristol, UK, 27–29 March 2012. [Google Scholar]
- Lenzo, B.; De Filippis, G.; Dizqah, A.M.; Sorniotti, A.; Gruber, P.; Fallah, S.; De Nijs, W. Torque distribution strategies for energy-efficient electric vehicles with multiple drivetrains. J. Dyn. Syst. Meas. Control 2017, 139, 121004. [Google Scholar] [CrossRef]
- Koehler, S.; Viehl, A.; Bringmann, O.; Rosenstiel, W. Energy-efficient torque distribution for axle-individually propelled electric vehicles. In Proceedings of the 2014 IEEE Intelligent Vehicles Symposium Proceedings, Dearborn, MI, USA, 8–11 June 2014; IEEE: Piscataway, NJ, USA, 2014; pp. 1109–1114. [Google Scholar]
- Hua, M.; Chen, G.; Zhang, B.; Huang, Y. A hierarchical energy efficiency optimization control strategy for distributed drive electric vehicles. Proc. Inst. Mech. Eng. Part D J. Automob. Eng. 2019, 233, 605–621. [Google Scholar] [CrossRef]
- Bucchi, F.; Frendo, F. A new formulation of the understeer coefficient to relate yaw torque and vehicle handling. Veh. Syst. Dyn. 2016, 54, 831–847. [Google Scholar] [CrossRef]
- Dizqah, A.M.; Lenzo, B.; Sorniotti, A.; Gruber, P.; Fallah, S.; De Smet, J. A fast and parametric torque distribution strategy for four-wheel-drive energy-efficient electric vehicles. IEEE Trans. Ind. Electron. 2016, 63, 4367–4376. [Google Scholar] [CrossRef]
- De Filippis, G.; Lenzo, B.; Sorniotti, A.; Gruber, P.; De Nijs, W. Energy-efficient torque-vectoring control of electric vehicles with multiple drivetrains. IEEE Trans. Veh. Technol. 2018, 67, 4702–4715. [Google Scholar] [CrossRef]
- Terashima, M.; Ashikaga, T.; Mizuno, T.; Natori, K.; Fujiwara, N.; Yada, M. Novel motors and controllers for high-performance electric vehicle with four in-wheel motors. IEEE Trans. Ind. Electron. 1997, 44, 28–38. [Google Scholar] [CrossRef]
- Lenzo, B.; Sorniotti, A.; De Filippis, G.; Gruber, P.; Sannen, K. Understeer characteristics for energy-efficient fully electric vehicles with multiple motors. In Proceedings of the EVS29 International Battery, Hybrid and Fuel Cell Electric Vehicle Symposium Proceedings, Montreal, QC, Canada, 19–22 June 2016. [Google Scholar]
- Mangia, A.; Lenzo, B.; Sabbioni, E. An integrated torque-vectoring control framework for electric vehicles featuring multiple handling and energy-efficiency modes selectable by the driver. Meccanica 2021, 56, 991–1010. [Google Scholar] [CrossRef]
- Pennycott, A.; De Novellis, L.; Sabbatini, A.; Gruber, P.; Sorniotti, A. Reducing the motor power losses of a four-wheel drive, fully electric vehicle via wheel torque allocation. Proc. Inst. Mech. Eng. Part D J. Automob. Eng. 2014, 228, 830–839. [Google Scholar] [CrossRef]
- Ceraolo, M.; Lutzemberger, G.; Mati, R.; Sani, L. Realisation and test of a fuel-cell based vehicle. In Proceedings of the 2012 IEEE International Energy Conference and Exhibition (ENERGYCON), Florence, Italy, 9–12 September 2012; IEEE: Piscataway, NJ, USA, 2012; pp. 1015–1021. [Google Scholar]
- Grunditz, E.A.; Thiringer, T. Performance analysis of current BEVs based on a comprehensive review of specifications. IEEE Trans. Transp. Electrif. 2016, 2, 270–289. [Google Scholar] [CrossRef]
- Shao, L.; Karci, A.E.H.; Tavernini, D.; Sorniotti, A.; Cheng, M. Design approaches and control strategies for energy-efficient electric machines for electric vehicles—A review. IEEE Access 2020, 8, 116900–116913. [Google Scholar] [CrossRef]
- Rahman, K.M.; Fahimi, B.; Suresh, G.; Rajarathnam, A.V.; Ehsani, M. Advantages of switched reluctance motor applications to EV and HEV: Design and control issues. IEEE Trans. Ind. Appl. 2000, 36, 111–121. [Google Scholar] [CrossRef]
- Widmer, J.D.; Martin, R.; Kimiabeigi, M. Electric vehicle traction motors without rare earth magnets. Sustain. Mater. Technol. 2015, 3, 7–13. [Google Scholar] [CrossRef]
- Yang, Z.; Shang, F.; Brown, I.P.; Krishnamurthy, M. Comparative study of interior permanent magnet, induction, and switched reluctance motor drives for EV and HEV applications. IEEE Trans. Transp. Electrif. 2015, 1, 245–254. [Google Scholar] [CrossRef]
- Zhang, X.; Göhlich, D.; Li, J. Energy-efficient toque allocation design of traction and regenerative braking for distributed drive electric vehicles. IEEE Trans. Veh. Technol. 2017, 67, 285–295. [Google Scholar] [CrossRef]
- Fujimoto, H.; Harada, S. Model-based range extension control system for electric vehicles with front and rear driving–braking force distributions. IEEE Trans. Ind. Electron. 2015, 62, 3245–3254. [Google Scholar] [CrossRef]
- Ceraolo, M. A new modelica electric and hybrid power trains library. In Proceedings of the 11th International Modelica Conference, Versailles, France, 21–23 September 2015; Linköping University Electronic Press: Linköping, Sweden, 2015; number 118, pp. 785–794. [Google Scholar]
- Hofman, T.; Dai, C. Energy efficiency analysis and comparison of transmission technologies for an electric vehicle. In Proceedings of the 2010 IEEE vehicle power and propulsion conference, Lille, France, 1–3 September 2010; IEEE: Piscataway, NJ, USA, 2010; pp. 1–6. [Google Scholar]
- Tehrani, M.G.; Kelkka, J.; Sopanen, J.; Mikkola, A.; Kerkkänen, K. Electric vehicle energy consumption simulation by modeling the efficiency of driveline components. SAE Int. J. Commer. Veh. 2016, 9, 31–39. [Google Scholar] [CrossRef]
- Ceraolo, M.; Lutzemberger, G.; Huria, T. Experimentally-Determined Models for High-Power Lithium Batteries; Technical Report, SAE Technical Paper; SAE: Warrendale, PA, USA, 2011. [Google Scholar]
- Ceraolo, M.; Giglioli, R.; Lutzemberger, G.; Sani, L. Hybrid energy systems in mobility applications. In Proceedings of the 2016 AEIT International Annual Conference (AEIT), Capri, Italy, 5–7 October 2016; IEEE: Piscataway, NJ, USA, 2016; pp. 1–6. [Google Scholar]
- Ehsani, M.; Gao, Y.; Longo, S.; Ebrahimi, K. Modern Electric, Hybrid Electric, and Fuel Cell Vehicles; CRC Press: Boca Raton, FL, USA, 2018. [Google Scholar]
- Huria, T.; Sanna, G.; Pede, G.; Lutzemberger, G. Systematic development of series-hybrid bus through modelling. In Proceedings of the 2010 IEEE Vehicle Power and Propulsion Conference, Lille, France, 1–3 September 2010; IEEE: Piscataway, NJ, USA, 2010; pp. 1–6. [Google Scholar]
- BARLOW, T.J.; Latham, S.; McCrae, I.; Boulter, P. A Reference Book of Driving Cycles for Use in the Measurement of Road Vehicle Emissions; TRL Published Project Report; TRL Limited: Crowthorne, UK, 2009. [Google Scholar]
Figure 1.
Simplified vehicle control structure.
Figure 1.
Simplified vehicle control structure.
Figure 2.
Simplified drivetrain structure.
Figure 2.
Simplified drivetrain structure.
Figure 3.
Efficiency map of the case-study Switched Reluctance Motors (SRM).
Figure 3.
Efficiency map of the case-study Switched Reluctance Motors (SRM).
Figure 4.
Motor power losses as functions of the motor torque at various speeds.
Figure 4.
Motor power losses as functions of the motor torque at various speeds.
Figure 5.
A general electric equivalent network model of a cell.
Figure 5.
A general electric equivalent network model of a cell.
Figure 6.
Vehicle simulation model.
Figure 6.
Vehicle simulation model.
Figure 7.
Strategy subsystem.
Figure 7.
Strategy subsystem.
Figure 8.
ArtUrban cycle.
Figure 8.
ArtUrban cycle.
Figure 9.
Comparison of motor power losses for the Even Distribution strategy (ED) and the Single Axle strategy (SA) as functions of the side torque at constant vehicle speed (wheel speed value: 4570 rpm).
Figure 9.
Comparison of motor power losses for the Even Distribution strategy (ED) and the Single Axle strategy (SA) as functions of the side torque at constant vehicle speed (wheel speed value: 4570 rpm).
Figure 10.
Switching torque as a function of the vehicle speed.
Figure 10.
Switching torque as a function of the vehicle speed.
Figure 11.
Motor power losses at 1720 rpm and 40 Nm.
Figure 11.
Motor power losses at 1720 rpm and 40 Nm.
Figure 12.
Control Allocation (CA) strategy at 1720 rpm.
Figure 12.
Control Allocation (CA) strategy at 1720 rpm.
Figure 13.
Implicit-Control Allocation (I-CA) map of the front-to-total ratio as a function of motor speed and demanded side torque.
Figure 13.
Implicit-Control Allocation (I-CA) map of the front-to-total ratio as a function of motor speed and demanded side torque.
Figure 14.
I-CA map of the front-to-total ratio with an extended transition zone.
Figure 14.
I-CA map of the front-to-total ratio with an extended transition zone.
Figure 15.
Vehicle energy losses over ArtUrban cycle.
Figure 15.
Vehicle energy losses over ArtUrban cycle.
Figure 16.
Working points of the different strategies along the ArtUrban cycle over the motor efficiency map.
Figure 16.
Working points of the different strategies along the ArtUrban cycle over the motor efficiency map.
Figure 17.
Working points of the CA and I-CA along the ArtUrban cycle over the I-CA map.
Figure 17.
Working points of the CA and I-CA along the ArtUrban cycle over the I-CA map.
Figure 18.
Battery State of charge (SOC) after 100 km along the ArtUrban cycle.
Figure 18.
Battery State of charge (SOC) after 100 km along the ArtUrban cycle.
Table 1.
Vehicle parameters.
Table 1.
Vehicle parameters.
| Vehicle mass | 1760 kg |
| Wheel radius | 0.31 m |
| Wheel base | 2.588 m |
| Frontal Area | 2.27 m |
| Drag Coefficient | 0.29 |
| Rolling Resistance coefficient | 0.013 |
| Tyre peak friction coefficient | 0.9 |
Table 2.
Powertrain dimensional data.
Table 2.
Powertrain dimensional data.
| Drivetrain Parameters |
| Motor peak torque | 80 Nm |
| Motor rated power | 20 kW |
| Motor maximum speed | 8000 rpm |
| Transmission ratio | 6.87 |
| Transmission efficiency | 95% |
| Inverter efficiency | 97% |
| Battery parameters |
| Battery voltage | 530 V |
| Battery number of cells | 196 |
| Battery capacity | 94 Ah |
| Battery weight | 354 kg |
Table 3.
Energy consumption along driving cycles with different torque distribution strategies.
Table 3.
Energy consumption along driving cycles with different torque distribution strategies.
| | Energy Saving (%) |
|---|
| | Energy Consumption (kWh/100 km) | CA with Respect to | I-CA with Respect to |
| Driving Cycle | ED | SA | CA | I-CA | ED | SA | ED | SA |
| WLTP | 16.71 | 16.71 | 16.6 | 16.56 | 0.63 | 0.63 | 0.89 | 0.89 |
| NEDC | 14.59 | 14.48 | 14.41 | 14.4 | 1.18 | 0.46 | 1.3 | 0.58 |
| ArtUrban | 12.67 | 13.31 | 12.59 | 12.58 | 0.68 | 5.45 | 0.72 | 5.49 |
Table 4.
State of Charge of the battery and autonomy saving along driving cycles with different torque distribution strategies.
Table 4.
State of Charge of the battery and autonomy saving along driving cycles with different torque distribution strategies.
| | Equivalent Autonomy Saving (km) |
|---|
| | State of Charge | CA with Respect to | I-CA with Respect to |
| Driving Cycle | ED | SA | CA | I-CA | ED | SA | ED | SA |
| WLTP | 26.7 | 26.7 | 27.2 | 27.36 | 3 | 3.1 | 4.1 | 4.2 |
| NEDC | 35.7 | 36.16 | 36.44 | 36.5 | 6.5 | 2.52 | 7 | 3 |
| ArtUrban | 45.93 | 43.41 | 46.28 | 46.3 | 4.3 | 33.9 | 4.4 | 34.12 |
| Publisher’s Note: MDPI stays neutral with regard to jurisdictional claims in published maps and institutional affiliations. |
© 2021 by the authors. Licensee MDPI, Basel, Switzerland. This article is an open access article distributed under the terms and conditions of the Creative Commons Attribution (CC BY) license (https://creativecommons.org/licenses/by/4.0/).


 ,
, 


