Article

Resource Endowment, Industrial Structure, and Green Development of the Yellow River Basin

1
School of Management, China University of Mining and Technology, Beijing 100083, China
2
Energy Research Institute, Chinese Academy of Macroeconomic Research, Beijing 100038, China
*
Author to whom correspondence should be addressed.
Sustainability 2021, 13(8), 4530; https://doi.org/10.3390/su13084530
Submission received: 30 March 2021 / Revised: 15 April 2021 / Accepted: 15 April 2021 / Published: 19 April 2021

Abstract

:
The Yellow River Basin is an important energy base of China, and its green development is crucial to Chinese economic transformation. In this paper, we calculate the green total factor productivity (GTFP) to measure the green development level of the Yellow River Basin by using an Slack Based Model- Global Malmquist-Luenberger (SBM-GML) index model. On this basis, we use a Generalized Method of Moments (GMM) model to further analyze the impact of resource endowment and industrial structure on the green development of cities. The results show that resource endowment inhibits the green development of cities and that the resource curse is observed in the Yellow River Basin. The industrial structure advancement significantly promotes the green development of cities. The impact of industrial structure rationalization on green development varies significantly on the type of city. Specifically, it has an inhibiting effect on key environmental protection cities but a promoting effect on non-key environmental protection cities.

1. Introduction

Since the reform and opening up, China has been experiencing rapid development in its economy. However, China’s huge energy consumption [1] and environmental damage [2] have been two of the sacrifices this nation has made in exchange for rapid economic growth. At present, China’s economy has changed from high-speed growth to high-quality development, and the traditional economic development model does not meet the current development requirements. China urgently needs economic transformation and to guide the economy to green development.
The Yellow River Basin is not only an important ecological barrier and economic region in China, but also an important energy and industrial base, which has an extremely important strategic position in China’s economic and social development. Ecological protection and green development of the Yellow River Basin has become a major national strategy [3]. Natural resources are the material basis of economic development, and the utilization of natural resources is closely related to the industrial structure. However, the Yellow River Basin is faced with the problem of resource exhaustion caused by over-exploitation of resources, and the pace of transformation and upgrading of traditional industries lags behind, with insufficient endogenous motivation. Improving the utilization efficiency of natural resources and realizing industrial transformation and development are the fundamental guarantee for ecological protection and green development in the Yellow River Basin. It is of great significance to study the internal relationship between the resource endowment, industrial structure and green development in the Yellow River Basin.
Therefore, this paper selects the urban economic data of the Yellow River Basin from 2005 to 2017, calculates the green development index of the Yellow River Basin with the global Data Envelope Analyse (DEA) theory, and uses the systematic generalized distance estimation model to explore the influence and mechanism of resource endowment and industrial structure on the green development of the Yellow River Basin. By unifying resource endowment and industrial structure into one framework, the research not only explores the influence of resource endowment and industrial structure on green development respectively, but also explores the interaction of resource endowment and industrial structure on green development.
The rest of this study is organized as follows: the second part is literature review and theoretical mechanism. Relevant literature on the relationship between the selected variables is reviewed, and the influence mechanism among variables is sorted out; the third part is the model and measurement, which introduces the selection of variables, data description, research methods and measurement models; the fourth part is the empirical analysis, which shows and analyzes the empirical results; the fifth part is the conclusion and suggestion, giving the empirical results and policy suggestions.

2. Literature Review and Theoretical Mechanism

2.1. Resource Endowment and Green Development

According to traditional economic theory, the start of industrialization in a country is based on good natural resource endowment. Abundant natural resources are in particular the engine of economic growth. Capital, labor, and natural resources are the fundamental production factors of a region, which have a positive effect on economic growth [4]. The development history of the United States and Canada is evidence of this phenomenon.
However, in the second half of the 20th century, many resource-oriented countries have experienced economic stagnation, for example, countries of Latin America [5], Nigeria [6], and Kazakhstan [7]. Notably, some resource-poor countries achieved significant economic growth, for example, Japan, South Korea, and Singapore [8]. The aforementioned examples challenge the traditional theory that abundant natural resources are beneficial to regional economic growth.
In 1993, Auty [9] was the first to propose the concept of the “resource curse,” that is, an abundance of natural resources is not a sufficient favorable condition for regional economic growth but rather a restriction. The concept of the “resource curse” has evoked wide concern and controversy in academic circles. Thus far, scholars hold mainly two viewpoints—“resource curse” and “resource gospel”—regarding the impact of resource endowment on green development.
Scholars who hold the view of the “resource curse” posit that abundant natural resources are a curse but not a driver of economic development [10,11]. Their reasons can be summarized in three aspects: the squeezing effect, deteriorating trade terms, and the weakening of the political system.
(1) Squeezing effect. Resource abundance promotes the development of resource-intensive industries, which are mainly mining industries and low-level manufacturing industries. This economic development model drives the inflow of low-tech industry and low-cost labor and does not attract talent in high-tech industries. The brain drain in high-tech industries eventually leads to the overdevelopment of resource-based industries. As a result, other industries have no impetus for development and are squeezed [12,13].
(2) Deteriorating trade terms. Natural resource abundance hinders—to a large extent—growth in regional capital investment. The increase in foreign trade income due to the export of primary products of natural resources hinders the pace of industrialization. The resource-driven economic development mode leads to an economy that is stuck in a state of inefficiency and has a low level. In addition, natural resource abundance may lead to residents’ resistance to the development of other industries [14].
(3) Weakening political systems. Resource abundance encourages rent-seeking and corruption and weakens the quality of local political systems [15].
Scholars who hold the view of “resource gospel” posit that abundant natural resources can result in relatively rapid wealth accumulation, which is helpful for regional development. Therefore, resources benefit economic development. The excessive dependence on resources leads to the abnormal phenomenon that resources restrict economic growth [16]. Effective promotion of the development of a green economy would occur if natural resources could be used in a reasonable, restrained manner. Practices have proved that abundant natural resources provide an excellent opportunity for economic development in most countries.
Rian Hilmawan and Jeremy Clark [17] investigated whether a resource curse could be observed in Indonesia. After measuring the relationship between real per capita income and resource endowment by using mining output share data, Hilmawan and Jeremy Clark did not observe a “resource curse” phenomenon in Indonesia but did observe a positive correlation between real per capita income and resource endowment. The research results of Halit Yanikkaya and Taner Turan [18] indicate that total resource, coal, mineral, natural gas and oil rents have significantly positive effects on economic growth. Ahmed Atil [19] studied the relationship between natural resources and the financial economy of Pakistan and showed that abundant natural resources can promote the development of the financial economy and that natural resources are the driver of financial and economic development.
The aforementioned studies all show that rich natural resources are the “gospel” of economic growth. The discovery of natural resources will cause the production possibility curve to expand outward. The increase in natural capital and national wealth will substantially improve the consumption capacity of domestic residents of goods and services, which will sharply stimulate economic growth. By contrast, the reduction of a country’s non-renewable resources, for example, crude oil, coal, natural gas, iron ore, and copper ore, is a negative factor for economic growth.

2.2. Industrial Structure and Green Development

The proportion and allocation factors of industrial structure affect the level of green development of the economy. For a long time, the neglect in controlling the environmental pollution and resource consumption caused by industrial development has put unprecedented pressure on China’s economic transformation, and human health [20]. The gap in the quality of regional green development is consistent with the gap in green total factor productivity (GTFP), and this result further verifies that green economic growth is mainly driven by GTFP [21]. Regarding the relationship between industrial structure and green development, individuals have expressed two main viewpoints about it.
The first viewpoint is that the upgrading of industrial structure is conducive to the green development of the economy. Zhu [4] analyzed the impact of the industrial structure at China’s provincial level on the efficiency of green development from two aspects: advancement and rationalization. The results showed that both the advancement and rationalization of the industrial structure promote the efficiency of green development. Notably, industrial structure advancement has a greater promoting effect on green development. A study of the panel data of 31 provinces in China [22] demonstrated that an interactive relationship exists between industrial structure upgrading and economic growth, the upgrading of industrial structure can promote regional economic growth, and regional economic growth positively promotes the industrial structure upgrading. The research of Zhiqiang Sun [23] shows that the optimization of industrial structure has an obvious effect on the improvement of ecological efficiency, which indicates that its contribution is high. Liu [24] demonstrated that the consumption of energy in the process of industrial development is the main source of environmental pollution. To achieve green development, nations must first achieve industrial structure rationalization.
The second viewpoint is that industrial structure upgrading does not necessarily promote green development. Using provincial panel data of China, Xu [25] investigated the relationship between industrial structure and natural resource utilization efficiency. The analysis results showed that industrial structure has a negative impact on natural resource utilization efficiency and that industrial structure adjustment does not promote the improvement of resource utilization and has no positive effect on green development. Although China’s industrial structure is better than it used to be, it remains dominated by heavy industry; thus, the industrial structure restrains the efficiency of natural resource utilization. Zhang [8] demonstrated that the increasing proportion of the service industry means that the economic structure has changed and that such change may be due to changes in demand and cost increases. The structural transformation may result in structural deceleration, hindering further development.
Some scholars have investigated the influence of industrial structure on green development by centering on the advancement and the rationalization. Industrial structure advancement refers to the development of industrial structure from a low level to a high level. The change in the proportion of industrial structure that is driven by technological progress substantially increases labor productivity [26]. Industrial structure rationalization represents the degree of coordination and the degree of resources effectively allocated among different industries under the constraints of productivity level and resources [27]. Industrial structure advancement leads to a “structural deceleration” in the economy, highlighting the important influence of the industrial structure rationalization on the quality of economic development. Gan [28] demonstrated that the advanced development of industrial structure leads to changes in industrial structure and then causes economic fluctuations. By contrast, industrial structure rationalization can effectively restrain economic fluctuations through effective allocation of resources. Therefore, in the long term, industrial structure rationalization plays a more significant role in promoting economic growth than the advanced development of industrial structure.

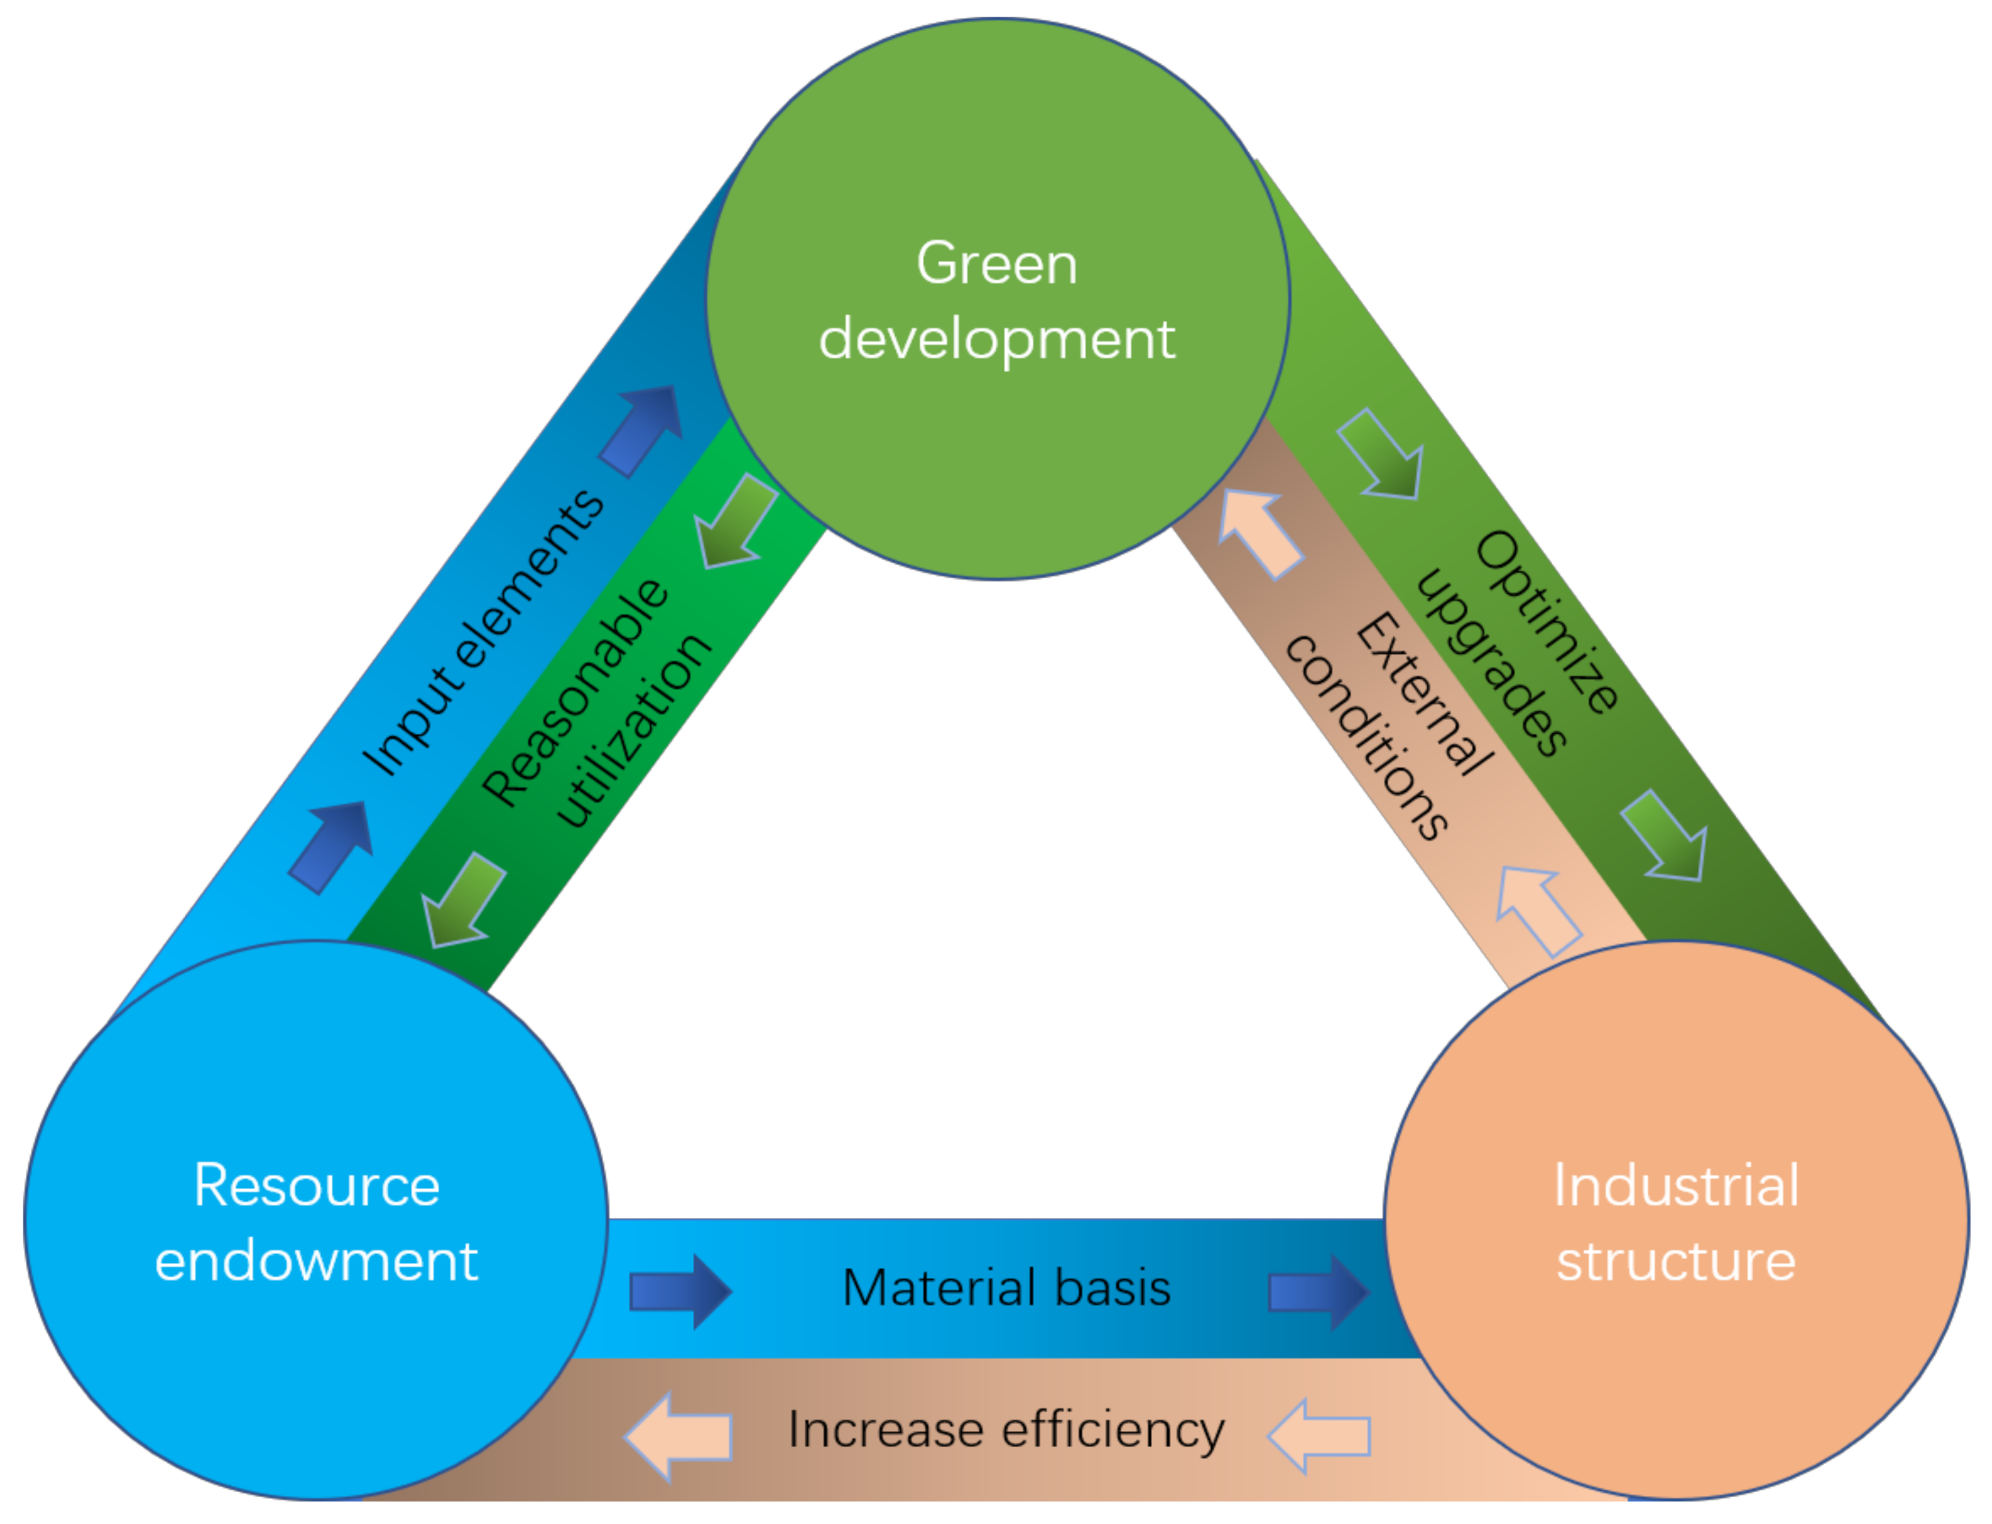
2.3. Resource Endowment, Industrial Structure, and Green Development

Resource endowment is the original driving force of the evolution of industrial structure. To a certain extent, the evolution of a region’s industrial structure is closely related to the degree of its resource endowment. Regions with rich resources are more likely to form this type of industrial structure that is dominated by resource exploiting and processing, and getting into path dependence [29].
Economic development is driven by resource abundance and energy consumption, causing the low efficiency of resource utilization and impeding green development. Additionally, economic development might be continuously strengthened along this path under the action of inertia, resulting in path lock. The earliest classic model of “Dutch disease” was presented by Corden and Neary [30]. They pointed out that because of the lack of connection effects and externalities in the resource extraction sector, resource-rich regions tend to form an industrial structure in which the resource extraction industry was developed and the manufacturing industry was lagging. Additionally, such industrial structure often led to insufficient diffusion effects and sustainable effects of economic development.
Matsuyama [31] further studied this topic and pointed out that the dominance of resource-based industries weakens the growth of manufacturing industries. Taking advantage of low resource costs, cities with rich resources achieve rapid development, but such a development model restricts the development of other non-resource-based industries in the long run, leading to a single industrial structure and stagnant green development of urban cities finally. Therefore, he suggested that regions with path dependence or path lock-in should focus on the development of industries other than the leading ones, to diversify the industrial structure, improve resource utilization efficiency, and further drive the green development of the economy.
In conclusion, the influence mechanism of resource endowment and industrial structure on the green development in the Yellow River Basin is presented in Figure 1.
The green economic transformation of the Yellow River Basin is closely related to the efficiency of resource utilization and the development of industrial structure advancement and rationalization. The literature has demonstrated that the academic community has begun to pay attention to the impact of resource endowment and industrial structure on green development.
Notably, the literature has the following limitation. First, most research is conducted from a macro perspective, and less is conducted at the city level. Cities are the main body that consumes resources and formulates the direction of industrial development, and cities should be the research objects. Second, resource endowment and industrial structure have an inherent impact. Most scholars study the impact of resource endowment on green development or the impact of industrial structure on green development separately. Few scholars unify the two in one framework to conduct a more comprehensive study. Third, promoting the green development of the economy in the Yellow River Basin is a major development strategy in China. The current research on the green development of the Yellow River Basin mainly focuses on discussions of industrial policy development and theoretical mechanisms. Empirical studies on resource endowment and industrial structure at the city level are scarce. Thus, this paper uses the prefecture-level cities (in terms of administrative divisions, cities that are directly under the jurisdiction of provincial administrative regions and are at the same level as regions), hereinafter referred to as “city” or “cities”, in the Yellow River Basin as the research object, integrates resource endowment and industrial structure into one research framework, constructs dynamic panel data, and empirically tests the impact of both on the green development of the economy, to provide a reference for decision-making on the green development of the economy.

3. Methods

3.1. Measurement Model

GTFP is an important criterion in measuring the economic transition from extensive to intensive and plays a role in comprehensively reflecting the relationship between environmental protection and economic development. Therefore, we use GTFP to measure the green development of cities in the Yellow River Basin. In addition, a one-period lag GTFP is introduced to construct the dynamic panel data model and to consider its impact on the current period. To solve the problem of variable endogeneity appropriately and fully use the sample information, we use the System Generalized Method of Moments (SYS-GMM) method for estimation. The specific model is shown in Formula (1).
G T F P i t = β 0 + β 1 G T F P i t 1 + β 2 R E + β 3 T S i t + β 4 T R i t + β 5 E n v i i t + β 6 T e c h i t + β 7 U r b a i t + β 8 P g d p i t + ε i t
In Formula (1), i and t respectively represent the city and the year; β 0 is a constant term; β 1 to β 8 represent the coefficient of variables, respectively; GTFP represents the level of green development of the economy; RE represents the degree of abundance of natural resources; TS and TR represent the industrial structure advancement and the industrial structure rationalization, respectively; Envi, Tech, Urba, and Pgdp represent the environmental regulation, the technological progress, the urbanization rate, the economic development level, respectively; and ε is a stochastic disturbance team.

3.2. Variable Selection and Data Descriptions

3.2.1. Explained Variable

On the basis of the SBM-GML model to measure GTFP and by referring to the research methods of Tone [32], Zhou [33] and Sun [34] have defined the SBM directional distance function containing the undesirable output, which is specifically expressed as follows:
S V t x t , k , y t , k , b t , k , g x , g y , g b = m a x s x , s y , s b 1 N n = 1 N S n x g n x + 1 M + I ( m = 1 M S m y g m y + i = 1 I S i b g i b ) 2 s . t . k = 1 K z k t x k n t + s n x = x k n t , n ; k = 1 K z k t y k m t s m y = y k m t , m ; k = 1 K z k t b k i t + s i b = b k i t , i ; k = 1 K z k t = 1 , z k t 0 , k ; s m y 0 , m ; s i b 0 , i
where x t , k , y t , k , and b t , k represent the vector of input, expected output, and undesired output of city k in period t, respectively; g x , g y , and g b represent the direction vector of input decrease, desirable output increase, and undesirable output decrease, respectively; s n x , s m y , and s i b represent the slack vector of input redundancy, desirable output insufficient, and undesirable output excessiveness, respectively. The Global SBM directional distance function is expressed as follows:
S V G x t , k , y t , k , b t , k , g x , g y , g b = m a x s x , s y , s b 1 N n = 1 N S n x g n x + 1 M + I ( m = 1 M S m y g m y + i = 1 I S i b g i b ) 2 s . t . t = 1 T k = 1 K z k t x k n t + s n x = x k n t , n ; t = 1 T k = 1 K z k t y k m t s m y = y k m t , m ; t = 1 T k = 1 K z k t b k i t + s i b = b k i t , i ; k = 1 K z k t = 1 , z k t 0 , k ; s m y 0 , m ; s i b 0 , i
We construct the GML index in t to t + 1 based on the SBM directional distance function. The input indicators selected in the calculation of GTFP include labor, water resources, energy input, land, and capital stock. The number of employees, total volume of water supply, and electricity consumption in each city at the end of the year are used to measure labor input, water resource input, and energy input, respectively. Urban construction land area is used to measure urban land resource input. The perpetual inventory method is used to estimate each city’s capital stock, and the specific formula is k i , t = k i , t 1 ( 1 δ i ) + I i , t , where k i , t and k i , t 1 , respectively, represent the capital stock in the t and t − 1 period of city i, respectively. I i , t is the fixed asset investment of city i during t period; δ is the capital depreciation rate (take 10.96% referring to Haojie Shan) [35].
Output indicators include desirable output and undesirable output. The desirable output is measured by the GDP of each city. The undesirable output is represented by industrial wastewater discharge, industrial SO2 discharge, and industrial soot emissions. The GML index is further decomposed into a technical efficiency index (GEFFCH) and technical progress index (GTECH). In Formula (4), when G T F P t t + 1 is greater than 1, it represents the growth of GTFP from t to t + 1 period. In Formula (5), when G E F F C H t t + 1 is greater than 1, it represents the improvement of technical efficiency from t to the t + 1 period. In Formula (6), when G T E C H t t + 1 is greater than 1, it represents the improvement of technological progress from t to the t + 1 period.
G T F P t t + 1 = 1 + S V G ( x t , y t , b t ; g x , g y , g b ) 1 + S V G ( x t + 1 , y t + 1 , b t + 1 ; g x , g y , g b ) = G E F F C H t t + 1 × G T E C H t t + 1
G E F F C H t t + 1 = 1 + S V t ( x t , y t , b t ; g x , g y , g b ) 1 + S V t + 1 ( x t + 1 , y t + 1 , b t + 1 ; g x , g y , g b )
G T E C H t t + 1 = [ 1 + S V G ( x t , y t , b t ; g x , g y , g b ) ] / [ 1 + S V t ( x t , y t , b t ; g x , g y , g b ) ] [ 1 + S V G ( x t + 1 , y t + 1 , b t + 1 ; g x , g y , g b ) ] / [ 1 + S V t + 1 ( x t + 1 , y t + 1 , b t + 1 ; g x , g y , g b ) ]

3.2.2. Core Explanatory Variables

Resource endowment (RE). We refer to Hong Li [36] and use the ratio of the employees in the extractive industry to the year-end total population to measure the resource endowment. The extractive industry includes coal, oil, natural gas, metal and non-metallic mining and selecting industry, logging industry, production and supply of tap water, and other subdivided industries directly related to natural resources, which can reflect the abundance of natural resources and measure the degree of dependence of economic development on natural resources in a region.
RE = P m i n i n g P t o t a l
where RE represents the resource endowment, and P m i n i n g and P t o t a l represent the number of employees in the extractive industry and the year-end total population, respectively.
Industrial structure. We measure the industrial structure of cities in the Yellow River Basin from two dimensions: industrial structure advancement and industrial structure rationalization. Industrial structure advancement means that the transformation of industrial structure from low level to high level which is measured by the ratio of the tertiary industry output value to the secondary industry output value. It can reflect whether the industrial structure is developing toward being service oriented [37]. Industrial structure rationalization reflects the coupling degree of the factor input structure and output structure; it is measured by the reciprocal of the Theil index (TL) to measure industrial structure rationalization (TR), by referring to Binbin Yu [38]. They are respectively expressed by Formulas (8) and (9):
T S = Y 3 Y 2
where TS represents the industrial structure advancement, and Y 3 and Y 2 represent the output value of tertiary industry and the output value of secondary industry, respectively.
T L = i = 1 n Y i Y ln Y i Y / L i L ;   T R = 1 T L
where Y and L respectively represent output value and number of employees. If TL = 0, the economic system is in equilibrium. The degree of industrial structure rationalization is consistent with the value of TR. The larger the value of TR, the more reasonable the industrial structure.

3.2.3. Control Variables

Environmental regulation (Envi) is a comprehensive index calculated by the entropy method, which includes the city’s industrial waste water discharge, industrial smoke (dust) removal, industrial smoke removal rate, industrial smoke and dust discharge volume, comprehensive utilization rate of industrial solid waste, industrial SO2 emissions, SO2 removal rate, and harmless treatment rate of domestic garbage.
Technological progress (Tech) is measured by the proportion of local fiscal expenditures on science and technology in public budget expenditures. It can provide a powerful motivator for economic development, improve energy utilization efficiency, and reduce energy consumption.
Urbanization rate (Urba) is measured by the ratio of urban population to the year-end total population in a region and reflects the urbanization level of a region.
The level of economic development (Pgdp) is measured by per capita GDP.

3.2.4. Data Source

This paper uses cities as the research object according to the scope of the Yellow River Basin delimited by the Yellow River Conservancy Commission of the Ministry of Water Resources. The Yellow River Basin flows through nine provinces—Qinghai, Sichuan, Gansu, Ningxia, Inner Mongolia, Shaanxi, Shanxi, Henan, and Shandong—a total of 69 cities (or states or leagues) are included. Because only the Aba Tibetan and Qiang autonomous prefecture and Ganzi Tibetan autonomous prefecture in Sichuan are in the Yellow River Basin, and their data are missing, the research scope of this paper excludes Sichuan Province. In addition, because the data of some cities in other provinces are missing, the scope of the Yellow River Basin studied in this paper is 55 representative cities in the other eight provinces. The relevant data are mainly from the China City Statistical Yearbook [39], the statistical yearbooks of each province [40], and the historical statistical yearbooks and statistical bulletins of each city. The descriptive statistics of the variables are shown in Table 1.

4. Empirical Results

4.1. Overall Analysis

This paper uses systematic GMM (SYS-GMM) as the main estimation method and differential GMM (DIF-GMM) as the auxiliary analysis method to study the impact of resource endowment and industrial structure on the green development of the economy in cities of the Yellow River Basin. The regression results are presented in Table 2. The p value of the Sargan test is close to one. Therefore, the assumption that all the instrumental variables are effective is valid, demonstrating that the selection of the instrumental variables in the model is reasonable. Arellano-Bond autocorrelation tests show AR(1) < 0.05 and AR(2) > 0.05, indicating that the random disturbance item has first-order autocorrelation but has no second-order autocorrelation. The first-order lag terms of GTFP have a positive effect on the current period, and all of them passed the 1% significance test, indicating that the GTFP is affected by the prior period and continues to be accumulated.
It can be seen from Model (3) in Table 2 that, the coefficient of resource endowment is −0.008, which have passed the significance test, indicating that rich resources hinder the improvement of green development of cities in the Yellow River Basin. This is consistent with the research conclusions of Wangsheng Meng [41]. The fundamental reason is the excessive dependence on natural resources, leading to rapid development of resource-based industries. In the short term, intensive resource-based industries promote economic development; in the long term, they result in a crowding-out effect on the industry of education, finance, commerce, service, and others, limiting the development of the industrial structure toward diversification. For short-term economic benefits, attracting enterprises with high taxation, high energy consumption, and high pollution to drive regional economic growth at the cost of environmental pollution. This development model is bound to seriously restrict the green development in the Yellow River Basin.
The coefficient of industrial structure advancement is 0.098, which have passed the significance test, there is a positive correlation between industrial structure advancement and GTFP. This is consistent with Meng Huang’s [42] research conclusions. The reason for this finding may be that the development of the economy mainly depends on resources and energy consumption because of abundant natural resources in the Yellow River Basin, forming many resource-dependent industries. Such a single industrial structure and extensive industrial development mode cause the low efficiency of resource utilization. The problem of environmental pollution cannot be effectively solved. Because some advanced technologies and industries remain in their infancy, industrial structure advancement can significantly promote the improvement of GTFP. The coefficient of industrial structure rationalization is −0.019, which have passed the significance test, there is a negative correlation between industrial structure rationalization and GTFP. The reason may be that the blind pursuit of the rational allocation of production factors among industries weakens the industrial competitiveness of some cities in the Yellow River Basin and reduces the driving effect of leading industries on urban development.
In terms of control variables in Model (3) in Table 2, the regression results are consistent with expectations. The coefficient of environmental regulation is 0.009, but failed the significance test, there is a positive correlation between environmental regulation and GTFP. This is consistent with Lingming Chen’s [43] research conclusions. Environmental regulation strengthens the supervision of polluting enterprises and regulates the rational use of natural resources. Therefore, the problem of environmental pollution is solved, promoting green development in the Yellow River Basin. The coefficient of technological progress is 0.036, which have passed the significance test, indicating that scientific and technological progress can drive the development of emerging industries, promote the green transformation of industries, and facilitate green development in the Yellow River Basin. The coefficient of urbanization rate is −0.234, indicating that urbanization rate and GTFP have a negative correlation [44]. Urbanization can improve the efficiency of energy utilization, protect the ecological environment, and reduce environmental pollution. However, urbanization construction is a process of high energy consumption and high pollution. In recent years, developers have been speeding up construction to obtain benefits quickly at the cost of environmental pollution and high energy consumption, causing wasted resources and low efficiency of energy utilization, hindering the green development of the cities in the Yellow River Basin. The coefficient of the level of economic development is 0.036, indicating that economic development can drive the diversity of industrial structure, promote the development of industrial structure to an advanced level, enhance technological innovation, increase resource utilization efficiency, and promote green development of the cities in the Yellow River Basin.
The interactive impact of resource endowment and industrial structure on GTFP was further studied. The interactive impact results are shown in Models (5) and (6). The coefficient of the interaction item between resource endowment and industrial structure advancement is 0.046 in Model (5), and the impact is positive. Industrial structure advancement promotes the efficiency of resource utilization and strengthens the green development of the cities in the Yellow River Basin; The coefficient of the interaction item between resource endowment and industrial structure rationalization is 0.003 in Model (5), and the impact is also positive, but the impact is small. This finding indicates that under the intensive resource-based industry development model, industrial structure rationalization can promote the rational allocation of natural resources, improve the efficiency of resource utilization, and strengthen the green development of the cities in the Yellow River Basin.
To further study the internal influence of resource endowment and industrial structure on green development, we decomposed the GML index into a GTECH index and GEFFCH index to explore the influence mechanism of resource endowment and industrial structure on technological progress and technological efficiency (Table 3). The first-order lagging term coefficients of both the GTECH index and the GEFFCH index are positive, which is the same result obtained for the main index of green development. The GTECH index and the GEFFCH index are affected by the prior period and is a process of continuous accumulation.
It can be seen from Models (1) and (2) in Table 3 that, the coefficients of resource endowment are −0.016 and 0.004, respectively, indicating that resource endowment promotes technological efficiency but inhibits technological progress, and the inhibiting effect is stronger than the promoting effect, inhibiting the improvement of GTFP. The coefficients of industrial structure advancement are 0.073 and 0.071, respectively. Industrial structure advancement significantly promotes technological progress and technological efficiency, and the impact on GTFP is positive. The coefficients of industrial structure rationalization are −0.04 and 0.025, respectively. Industrial structure rationalization restrains technological progress but promotes technological efficiency, while the promoting effect is less than the inhibiting effect, which has a negative impact on GTFP.
It can be seen from Model (3) and (4) in Table 3 that, the coefficients of the interaction item between resource endowment and industrial structure advancement are 0.051 and 0.001, respectively, indicating that the interaction item between resource endowment and industrial structure advancement has a significant promoting effect on technological progress; and a weak effect on technological efficiency, and the results are not significant. The coefficients of the interaction item between resource endowment and industrial structure rationalization are 0.007 and −0.001, respectively, indicating that the interaction item between resource endowment and industrial structure rationalization has a significant promoting effect on technological progress; and a weak effect on technological efficiency, and the results are not significant. The interactive terms promote GTFP by promoting technological progress.

4.2. Regional Heterogeneity Analysis

There are 113 key environmental protection cities in China, according to the annual report on key environmental protection cities in 2003. Key environmental protection cities refer to the national key cities where the State Environmental Protection Administration directly conducts quantitative assessments of comprehensive environmental improvement. Among the 55 cities in the Yellow River Basin studied in this paper, 25 are key environmental protection cities; the remaining 30 cities are collectively referred to as non-key environmental protection cities in this paper. Cities in the Yellow River Basin are divided into key environmental protection cities and non-key environment protection cities to further study the differences in the impact of resource endowment and industrial structure on green development caused by different urban environmental protection policies. The regression results are shown in Models (1) and (2) in Table 4.
Considering that the Yellow River Basin spans the east, middle, and west areas and has obvious differences in the upper, middle, and lower reaches, to investigate the influence of resource endowment and industrial structure on the green development under different regional conditions, the upper, middle, and lower reaches are divided according to the method of Ma Jianhua [45]. Because the horizontal span of the cities in the upper and middle reaches is relatively small, we merge the cities in the upper reaches and middle reaches to conduct a regional comparative analysis with the cities in the lower reaches. The regression results are shown in Models (3) and (4) in Table 4.
The lagging first-order item coefficient of GTFP in all models of Table 4 is positive, consistent with the results of the full-sampled regression, indicating that the cumulative effect of GTFP does not have heterogeneity among cities in different regions. The impacts of resource endowment and industrial structure on GTFP are different between key environmental protection cities and non-key environmental protection cities.
In key environmental protection cities in Table 4, the coefficient of resource endowment is −0.011, indicating that the impact of resource endowment on GTFP is negative, inhibiting the improvement of GTFP. The ecological environment of key environmental protection cities is fragile, and most of them are resource-intensive industrial cities and are highly dependent on natural resources. Therefore, resource endowment hinders the level of green development. The coefficient of the industrial structure advancement is 0.155, the industrial structure advancement significantly promotes the level of GTFP. The coefficient of the industrial structure rationalization is −0.023, industrial structure rationalization inhibits the improvement of GTFP.
In non-key environmental protection cities in Table 4, the coefficient of resource endowment is 0.008, but failed the significance test, indicating that the impact of resource endowment on GTFP is positive, promoting the improvement of GTFP. In non-key environmental protection cities, they have diversified industrial structure and, therefore, have low dependence on natural resources. Thus, abundant natural resources promote the level of green development. The coefficient of the industrial structure advancement is 0.022, the industrial structure advancement inhibits the level of green development. The coefficient of the industrial structure rationalization is low, the impact of industrial structure rationalization on GTFP is weak.
It can be seen from Models (1) and (2) in Table 4 that, the impact of urbanization rate on GTFP differs in cities by environmental protection policy. In key environmental protection cities, the urbanization rate inhibits the improvement of GTFP. The main reason for this finding is that key environmental protection cities are under the process of urbanization construction, which simultaneously is a process of high pollution and high energy consumption; in non-key environmental protection cities, urbanization construction is relatively perfect; thus, the urbanization rate accelerates green development in cities.
It can be seen from Models (3) and (4) in Table 4 that, the impact of resource endowment and industrial structure on the GTFP of cities in the upper and middle reaches and lower reaches is not obviously different, which is consistent with the whole regression results. The coefficients of industrial structure advancement are 0.105 and 0.061, respectively. It shows that industrial structure advancement has played a greater role in promoting GTFP in the upper and middle reaches cities. Cities in the lower reaches should speed up the upgrading of industrial structure. Regarding urbanization rate, it inhibits the GTFP in the upper and middle reaches but promotes it in the lower reaches. The reason for this finding is that cities in the upper and middle reaches have a lower level of urbanization and remain under the process of urbanization construction, while the cities in the lower reaches have achieved a higher level of urbanization.

4.3. Robustness Test

Due to the availability of data, this article does not adjust the measurement indicators of resource endowment, but only adjusts the measurement indicators of industrial structure. Refer to Yingshi Liu [46] for the measurement of industrial structure advancement, the calculation method is as follows:
T S = i = 1 3 Y i × i = Y 1 × 1 + Y 2 × 2 + Y 3 × 3 , 1 i 3
Refer to Jing Han [47] for the measurement of industrial structure rationalization, the calculation method is as follows:
T L = i = 1 n Y i Y Y i Y / L i L 1
T R = 1 T L
In order to verify the robustness of the regression results, the regression results of mixed effect, fixed effect and random effect OLS models are added for comparative analysis. The regression results are shown in Table 5.
As can be seen from Table 5, after changing the measurement method of industrial structure and using various models for regression analysis, the coefficient of industrial structure advancement is significantly positive, which is consistent with the above regression results, indicating that the conclusion that industrial structure advancement promotes green development of the Yellow River Basin is robust; The coefficient of industrial structure rationalization is significantly negative, which is consistent with the previous regression results, indicating that the conclusion that industrial structure rationalization inhibits the green development of the Yellow River Basin is robust. In some models, the coefficient of industrial structure rationalization is not significant, which is slightly different from the previous results, but the overall conclusion does not change. The sign of the control variable remains basically unchanged. Overall, the model is robust.

5. Conclusions and Policy Implications

On the basis of panel data of 55 cities in the Yellow River Basin from the period 2005–2017, we calculate the GTFP of each city by using the SBM-GML model to measure the green development level of the Yellow River Basin. To claim causality, we further study the impact of resource endowment and industrial structure on green development by using the SYS-GMM method, respectively. Our conclusions are as follows:
(1) There is a significant negative correlation between natural resources and green development of the economy in the Yellow River Basin. There is a “resource curse” phenomenon in the Yellow River Basin. Abundant natural resources have become an obstacle to the green development of the economy. Resource endowment promotes technical efficiency but inhibits technological progress, and the inhibiting effect is significantly greater than the promoting effect, further inhibiting the level of green development. From the perspective of different types of city, the impact of resource endowment on green development differs. In key environmental protection cities, resource endowment inhibits the development and becomes the “curse” of economic development; in non-key environmental protection cities, resource endowment promotes green development of the economy and becomes the “gospel” of economic development. In different regions, the influence of resource endowment on green development is not significantly different, and the main difference lies in the degree of resource endowment of the city itself.
(2) The effect of industrial structure advancement and industrial structure rationalization on green development differs. Industrial structure advancement promotes technological progress and technological efficiency, and the promoting effect on technical progress is greater than that on technical efficiency, promoting green development of the Yellow River Basin; the Industrial structure rationalization has an inhibiting effect on technical progress but a promoting effect on technical efficiency, and the promoting effect is less than the inhibiting effect, inhibiting green development of the Yellow River Basin. In the key cities of environmental protection, the industrial structure advancement greatly promotes the increase of green development; in the cities of upper and middle reaches, the industrial structure advancement promotes the increase of green development. The industrial structure rationalization has no significant difference in the influence of different types of city and different regions, and it does not promote the level of green development.
(3) The interaction between resource endowment and industrial structure promotes the level of green development. The interaction item between resource endowment and industrial structure advancement significantly promotes technological progress but inhibits technological efficiency. The inhibiting effect is far less than the promoting effect. However, it fails the significance test. The interaction item between resource endowment and industrial structure advancement promotes the level of green development. The interaction item between resource endowment and industrial structure rationalization promotes technological progress significantly and technological efficiency but fails the significance test. Under the dual promoting effect, the interaction item between resource endowment and industrial structure rationalization promotes the green development of the economy in the Yellow River Basin.
According to the empirical results of resource endowment, industrial structure, and green development, we propose the following policy suggestions:
Raise the entry threshold of natural resource extraction and processing industries, eliminate processes, technologies and equipment with low resource utilization, and control the proportion of resource-based industries. The government should clearly restrict or prohibit the further development of the industries with serious ecological environment pollution, strictly implement the laws and regulations on protecting the ecological environment. To internalize the negative externality of environmental pollution into the production and operation cost of enterprises, and promote the green development of the Yellow River Basin.
Change the economic development model of the Yellow River Basin’s “path dependence” on resources, combine spatial layout structural adjustment and industrial strategic reorganization, increase efforts to support key projects in non-resource industries, and build a growth mechanism for non-resource industries. By accelerating the extension of the industrial chain, vigorously developing successive industries and cultivating new advantageous industries, gradually reduce the excessive dependence on resources, break the resource curse, and realize the leap from environmental protection focus to non-environmental protection focus.
To promote the upgrading of industrial structure of cities in the Yellow River Basin and give full play to the dual driving role of industrial structure advancement on technological progress and technical efficiency, the cities in the upper and middle reaches should further expand the positive effect of industrial structure advancement, and the cities in the lower reaches should make up for the lack of industrial structure advancement. Moreover, while the industrial structure of each city is developing towards upgrading level, attention should be paid to the construction of rationalization of the industrial structure, and the degree of coordination between industries and the degree of rational allocation of resources should be improved.
The government should increase financial allocation for innovation, increase investment in scientific research, learn advanced technology, and improve the efficiency of resource exploitation and utilization. Meanwhile, it should promote regional technology exchange and cooperation in science and technology, formulate policies to encourage and guide the flow of funds into environmental protection and low-carbon projects, and avoid the industrial obstacles of green transformation from the source. Moreover, it is necessary to strengthen the terminal pollution control, promote regional joint prevention and control, and strengthen coordinated control of multiple pollutants and regional collaborative governance.

Author Contributions

Conceptualisation, methodology, investigation, visualisation, and writing the original draft, K.Z. Resources, methodology, supervision, and funding acquisition, R.Z. Supervision, and funding acquisition, H.L. Data curation, methodology, G.W. Data curation, and software application, X.S. All authors have read and agreed to the published version of the manuscript.

Funding

This research was funded by the Major Science and Technology Projects in Shanxi Province, grant number 20181102017 and China University of Mining and Technology (Beijing) Yuezaki Young Scholars Funded Project, grant number 800015Z1121.

Institutional Review Board Statement

Not applicable.

Informed Consent Statement

Not applicable.

Data Availability Statement

The data presented in this study are available on request from the corresponding author.

Conflicts of Interest

The authors declare no conflict of interest.

References

  1. Mele, M.; Magazzino, C. A Machine Learning analysis of the relationship among iron and steel industries, air pollution, and economic growth in China. J. Clean. Prod. 2020, 277, 123293. [Google Scholar] [CrossRef]
  2. Udemba, E.N.; Magazzino, C.; Bekun, F.V. Modeling the nexus between pollutant emission, energy consumption, foreign direct investment, and economic growth: New insights from China. Environ. Sci. Pollut. Res. Int. 2020, 27, 17831–17842. [Google Scholar] [CrossRef] [PubMed]
  3. Speech at the Symposium on ecological protection and high quality development of the Yellow River Basin. Available online: https://baijiahao.baidu.com/s?id=1647443445350748172&wfr=spider&for=pc (accessed on 12 November 2020).
  4. Zhu, B.; Zhang, M.; Zhou, Y.; Wang, P.; Sheng, J.; He, K.; Wei, Y.; Xie, R. Exploring the effect of industrial structure adjustment on interprovincial green development efficiency in China: A novel integrated approach. Energy Policy 2019, 134, 110946. [Google Scholar] [CrossRef]
  5. Blanco, L.; Grier, R. Natural resource dependence and the accumulation of physical and human capital in Latin America. Resour. Policy 2012, 37, 281–295. [Google Scholar] [CrossRef]
  6. Idemudia, U. The resource curse and the decentralization of oil revenue: The case of Nigeria. J. Clean. Prod. 2012, 35, 183–193. [Google Scholar] [CrossRef]
  7. Oskenbayev, Y.; Yilmaz, M.; Abdulla, K. Resource concentration, institutional quality and the natural resource curse. Econ. Syst. 2013, 37, 254–270. [Google Scholar] [CrossRef]
  8. Menyu, Z.Z.X. The summary of the 1st China Forum for Scholars on Development Economics. Econ. Res. J. 2019, 3, 194–198. [Google Scholar]
  9. Auty, R.; Warhurst, A. Sustainable development in mineral exporting economies. Resour. Policy 1993, 19, 14–29. [Google Scholar] [CrossRef]
  10. Xie, X.; Li, K.; Liu, Z.; Ai, H. Curse or blessing: How does natural resource dependence affect city-level economic development in China? Aust. J. Agric. Resour. Econ. 2021. [Google Scholar] [CrossRef]
  11. Hu, H.; Ran, W.; Wei, Y.; Li, X. Do Energy Resource Curse and Heterogeneous Curse Exist in Provinces? Evidence from China. Energies 2020, 13, 4383. [Google Scholar] [CrossRef]
  12. Sun, H.; Sun, W.; Geng, Y.; Yang, X.; Edziah, B.K. How does natural resource dependence affect public education spending? Environ. Sci. Pollut. Res. Int. 2018, 26, 3666–3674. [Google Scholar] [CrossRef]
  13. Wang, H.; Wang, S.; Yang, C.; Jiang, S.; Li, Y. Resource Price Fluctuations, Resource Dependence and Sustainable Growth. Sustainability 2019, 11, 6371. [Google Scholar] [CrossRef] [Green Version]
  14. Kim, D.; Lin, S. Natural Resources and Economic Development: New Panel Evidence. Environ. Resour. Econ. 2015, 66, 363–391. [Google Scholar] [CrossRef]
  15. Orihuela, J.C. Institutions and place: Bringing context back into the study of the resource curse. J. Inst. Econ. 2018, 14, 157–180. [Google Scholar] [CrossRef]
  16. Badeeb, R.A.; Lean, H.H.; Clark, J. The evolution of the natural resource curse thesis: A critical literature survey. Resour. Policy 2017, 51, 123–134. [Google Scholar] [CrossRef]
  17. Hilmawan, R.; Clark, J. An investigation of the resource curse in Indonesia. Resour. Policy 2019, 64, 101483. [Google Scholar] [CrossRef] [Green Version]
  18. Yanıkkaya, H.; Turan, T. Curse or Blessing? An Empirical Re-examination of Natural Resource-Growth Nexus. J. Int. Dev. 2018, 30, 1455–1473. [Google Scholar] [CrossRef]
  19. Atil, A.; Nawaz, K.; Lahiani, A.; Roubaud, D. Are natural resources a blessing or a curse for financial development in Pakistan? The importance of oil prices, economic growth and economic globalization. Resour. Policy 2020, 67, 101683. [Google Scholar] [CrossRef]
  20. Jin, B.; Li, G. Green economic growth from a developmental perspective. China Financ. Econ. Rev. 2013, 1, 4. [Google Scholar] [CrossRef] [Green Version]
  21. Chao, L.H.L. Regional Difference and Structural Decomposition of Green Total Factor Productivity in China. Shanghai J. Econ. 2018, 6, 35–47. [Google Scholar]
  22. Chen, S.; Zhang, Y.; Chen, X. Technology Choice, Upgrading of Industrial Structure and Economic Growth—Research Based on Semi-Parameter Spatial Panel Vector Auto-Regression Model. Econ. Surv. 2017, 34, 87–92. [Google Scholar]
  23. Sun, Z.; Sun, T. Financial development, Industrial structure optimization, and Eco-efficiency promotion. Fresen. Environ. Bull. 2019, 28, 6231–6238. [Google Scholar]
  24. Liu, Z.; Zhang, H.; Zhang, Y.; Zhu, T. How does industrial policy affect the eco-efficiency of industrial sector? Evidence from China. Appl. Energy 2020, 272, 115206. [Google Scholar] [CrossRef]
  25. Xu, L.; Tan, J. Financial development, industrial structure and natural resource utilization efficiency in China. Resour. Policy 2020, 66, 101642. [Google Scholar] [CrossRef]
  26. Li, F.Y.; Liu, S.J.; Cheng, Y.; Song, Z.Y. Effect of Value-added in China’s Exports on Regional Industrial Structure Advancement. Sci. Geogr. Sin. 2017, 37, 37–45. [Google Scholar]
  27. Kraftova, I.; Zdrazil, P.; Mateja, Z. Reflection of Industrial Structure in Innovative Capability. Inžinerinė Ekon. 2016, 27, 304–315. [Google Scholar] [CrossRef] [Green Version]
  28. Dianfan, G.C.Z.R. An Empirical Study on the Effects of Industrial Structure on Economic Growth and Fluctuations in China. Econ. Res. J. 2011, 5, 4–16, 31. [Google Scholar]
  29. Zhang, H.; Shen, L.; Zhong, S.; Elshkaki, A. Coal resource and industrial structure nexus in energy-rich area: The case of the contiguous area of Shanxi and Shaanxi Provinces, and Inner Mongolia Autonomous Region of China. Resour. Policy 2020, 66, 101646. [Google Scholar] [CrossRef]
  30. Corden, W.M.; Neary, J.P. Booming Sector and De-Industrialisation in a Small Open Economy. Econ. J. 1982, 92, 825–848. [Google Scholar] [CrossRef] [Green Version]
  31. Matsuyama, K. Agricultural productivity, comparative advantage, and economic growth. J. Econ. Theory 1992, 58, 317–334. [Google Scholar] [CrossRef] [Green Version]
  32. Tone, K.; Toloo, M.; Izadikhah, M. A modified slacks-based measure of efficiency in data envelopment analysis. Eur. J. Oper. Res. 2020, 287, 560–571. [Google Scholar] [CrossRef]
  33. Zhou, C.; Shi, C.; Wang, S.; Zhang, G. Estimation of eco-efficiency and its influencing factors in Guangdong province based on Super-SBM and panel regression models. Ecol. Indic. 2018, 86, 67–80. [Google Scholar] [CrossRef]
  34. Sun, X.; Zhang, R.; Chen, X.; Li, P.; Guo, J. Impact of Nanotechnology Patents on Green Development of China’s Building Industry. Recent Pat. Nanotechnol. 2020, 14, 141–152. [Google Scholar] [CrossRef]
  35. Haojie, S. Reestimating the Capital Stock of China: 1952~2006. J. Quant. Tech. Econ. 2008, 10, 17–31. [Google Scholar]
  36. Qing, L.H.A.Z. Environmental Regulations, Resource Endowments and Urban Industry Transformation: Comparative Analysis of Resource-based and Non-resource-based Cities. Econ. Res. J. 2018, 53, 182–198. [Google Scholar]
  37. Yong, J.; HuiXin, Y. Government Intervention, Distortion of Industrial Structure and Improvement of Total Factor Productivity. Financ. Trade Res. 2019, 30, 1–16. [Google Scholar]
  38. Yu, B. Economic growth effects of industrial Restructuring and productivity improvement. China Ind. Econ. 2015, 12, 83–98. [Google Scholar]
  39. China City Statistical Yearbook. Available online: https://data.cnki.net/ (accessed on 10 October 2020).
  40. China Statistical Yearbook. Available online: http://www.stats.gov.cn/ (accessed on 10 October 2020).
  41. Wangsheng, M.; Yang, Z. Natural resource endowment, path selection of technologicalprogress, and green economic growth: An empirical research based on China’s provincial panel data. Resour. Sci. 2020, 42, 2314–2327. [Google Scholar]
  42. Huang, M.; Ding, R.; Xin, C. Impact of Technological Innovation and Industrial-Structure Upgrades on Ecological Efficiency in China in Terms of Spatial Spillover and the Threshold Effect. Integr. Environ. Asses 2020. [Google Scholar] [CrossRef]
  43. Chen, L.; Ye, W.; Huo, C.; James, K. Environmental Regulations, the Industrial Structure, and High-Quality Regional Economic Development: Evidence from China. Land 2020, 9, 517. [Google Scholar] [CrossRef]
  44. Tang, M.; Li, Z.; Hu, F.; Wu, B. How does land urbanization promote urban eco-efficiency? The mediating effect of industrial structure advancement. J. Clean. Prod. 2020, 272, 122798. [Google Scholar] [CrossRef]
  45. MA, J.S.Y.C. Chaotic characters of the Yellow River Basin based on the sediment time series: An attempt to integrated research in geography. J. Geogr. Sci. 2010, 20, 219–230. [Google Scholar] [CrossRef]
  46. Yingshi, L.; Yinhua, T.; Ying, L. Upgrading of Industrial Structure, Energy Efficiency, Green Total Factor Productivity. Theory Pract. Financ. Econ. 2018, 39, 118–126. [Google Scholar]
  47. Calderon, C.; Chong, A.; Leon, G. Institutional enforcement, labor-market rigidities, and economic performance. Emerg. Mark. Rev. 2007, 8, 38–49. [Google Scholar] [CrossRef] [Green Version]
Figure 1. Impact mechanism diagram.
Sustainability 13 04530 g001
Table 1. Descriptive statistics of variables.
Variable NameSymbolAverage ValueStandard DeviationMaximumMinimum
Explained variableGreen Total Factor ProductivityGTFP1.18930.26042.40290.5492
Green technological progressGTECH1.03160.18682.10550.4608
Green technology efficiencyGEFFCH1.00960.11241.77390.5570
Core explanatory variablesResource endowmentRE0.05570.19840.08850.0001
Industrial structure advancementTS0.83120.56989.48220.1486
Industrial structure rationalizationTR0.19621.036221.64200.0058
Control variablesTechnological progressTech0.01010.00920.16560.0007
The level of economic developmentPgdp3.92593.281925.68770.2396
Environmental regulationEnvi0.61750.20151.03230.0871
Urbanization rateUrba0.59920.25680.99850.1310
Table 2. Full-sampled dynamic panel regression results.
SYS-GMMDIF-GMMSYS-GMMDIF-GMMSYS-GMMDIF-GMM
VARIABLES(1)(2)(3)(4)(5)(6)
GTFPGTFPGTFPGTFPGTFPGTFP
L.GTFP0.361 ***0.232 ***0.387 ***0.214 ***0.336 ***0.173 ***
(101.94)(80.27)(10.11)(17.98)(24.06)(8.38)
RE−0.012 ***−0.009 ***−0.008 ***−0.004 **−0.023 ***−0.019 ***
(−14.49)(−9.76)(−6.42)(−2.42)(−12.00)(−8.94)
TS0.032 ***0.042 ***0.098 ***0.079 ***0.032 *0.023
(5.65)(17.29)(10.57)(4.32)(1.91)(1.35)
TR−0.012 ***−0.009 ***−0.019 ***−0.012 **−0.014 **−0.009
(−4.46)(−5.36)(−3.42)(−2.57)(−2.50)(−1.39)
RE × TS 0.046 ***0.050 ***
(11.02)(11.69)
RE × TR 0.003 *0.001
(1.82)(0.95)
Tech 0.036 ***0.038 ***0.038 ***0.039 ***
(11.66)(19.55)(10.49)(17.41)
Pgdp 0.036 **0.0210.041 ***0.023
(2.10)(1.18)(2.76)(1.27)
Envi 0.009−0.029−0.0010.073
(0.17)(−0.49)(−0.03)(1.50)
Urba −0.234 ***−0.097 *−0.224 ***−0.160 ***
(−6.99)(−1.92)(−5.46)(−3.62)
Constant0.080 ***0.108 ***0.782 ***0.495 ***0.655 ***0.592 ***
(10.67)(26.59)(9.75)(3.70)(6.01)(4.98)
Sargan51.38449.69437.73233.57638.36335.327
(0.8906)(0.6411)(0.9973)(0.9868)(0.9966)(0.9769)
AR(1)−4.041−3.901−3.736−3.485−3.634−3.3695
(0.0001)(0.0001)(0.0002)(0.0005)(0.0003)(0.0008)
AR(2)0.1321−0.180−0.437−0.830−0.598−1.006
(0.8949)(0.8574)(0.6620)(0.4066)(0.5499)(0.3144)
Observations623564509461509461
Number of ID555345434543
Note: The z statistic value is shown in parentheses; the values listed in the Sargan column are the overidentifying test values and their p values; AR(1) and AR(2) are the Arellano-Bond autocorrelation test results and their p values of the first-order residual sequences and the second-order residual sequences, respectively. * is significant at the 10% level, ** is significant at the 5% level, and *** is significant at the 1% level. The same as below.
Table 3. Regression results after decomposition of GTFP.
Green Technological Progress (1)Green Technology Efficiency (2)Green Technological Progress (3)Green Technology Efficiency (4)
VARIABLESGTECHGEFFCHGTECHGEFFCH
L.GTECH0.326 *** 0.318 ***
(18.85) (16.77)
L.GEFFCH 0.389 *** 0.393 ***
(80.02) (47.57)
RE−0.016 ***0.004 ***−0.032 ***0.002 **
(−8.04)(7.12)(−13.66)(2.34)
TS0.073 ***0.071 ***0.0170.067 ***
(4.05)(44.56)(1.13)(24.71)
TR−0.040 ***0.025 ***−0.048 ***0.027 ***
(−7.89)(20.97)(−10.02)(28.19)
RE × TS 0.051 ***0.001
(12.71)(0.49)
RE × TR 0.007 ***−0.001
(5.03)(−0.33)
Tech0.045 ***0.003 ***0.039 ***0.001
(16.85)(2.68)(6.10)(1.24)
Pgdp−0.072 ***−0.013 ***−0.057 ***−0.010 **
(−6.63)(−5.02)(−3.24)(−2.10)
Envi0.059−0.070 ***0.041−0.067 ***
(1.11)(−8.07)(0.58)(−7.06)
Urba−0.068 **−0.015 ***−0.080 ***−0.023 ***
(−2.29)(−2.94)(−3.87)(−3.57)
Constant1.236 ***0.351 ***1.004 ***0.348 ***
(14.63)(21.08)(5.71)(6.79)
Sargan38.55338.59936.39440.078
(0.9963)(0.9962)(0.9984)(0.9936)
AR(1)−4.577−2.925−4.318−2.929
(0.0000)(0.0034)(0.0000)(0.0034)
AR(2)−1.9561.137−2.0711.137
(0.0505)(0.2554)(0.0383)(0.2554)
Observations509509509509
Number of ID45454545
** is significant at the 5% level, and *** is significant at the 1% level.
Table 4. Regional heterogeneity analysis.
(Key Environmental Protection Cities) (1)(Non-Key Environmental Protection Cities) (2)(Upper and Middle Reaches) (3)(Lower Reaches) (4)
VARIABLESGTFPGTFPGTFPGTFP
L. GTFP0.297 **0.1470.315 ***0.091
(2.38)(1.00)(5.26)(0.17)
RE−0.011 ***0.008−0.001−0.004
(−3.67)(1.45)(−0.14)(−1.27)
TR0.155 ***0.0220.105 **0.061
(4.22)(0.37)(2.20)(0.71)
TS−0.023 ***0.000−0.026 **−0.011
(−3.00)(0.01)(−2.51)(−0.28)
Tech0.0170.066 ***0.054 ***0.028 *
(1.59)(3.47)(10.91)(1.78)
Pgdp0.0060.0500.138 ***0.071
(0.13)(0.46)(3.36)(0.53)
Envi0.192−1.242 **−0.526 **−0.284
(1.05)(−2.53)(−2.30)(−1.11)
Urba−0.0790.1460.037−0.122
(−0.78)(1.24)(0.27)(−0.49)
Constant0.3930.031−0.967 **0.175
(0.76)(0.03)(−2.24)(0.33)
Sargan15.16811.78917.5679.019
(1.0000)(1.0000)(1.0000)(1.0000)
AR(1)−2.498−2.184−3.336−0.619
(0.0125)(0.0290)(0.0008)(0.5359)
AR(2)−2.1770.274−0.227−1.201
(0.0295)(0.7844)(0.8205)(0.2297)
Observations289220328157
Number of ID25202815
** is significant at the 5% level, and *** is significant at the 1% level.
Table 5. Robustness test results.
SYS-GMMDIF-GMMMixed EffectFixed EffectRandom Effect
VARIABLES(1)(2)(3)(4)(5)
GTFPGTFPGTFPGTFPGTFP
L.GTFP0.374 ***0.196 ***
(9.28)(9.86)
RE−0.007 ***−0.005 ***−0.012 **0.0130.005
(−6.93)(−3.17)(−2.42)(1.62)(0.67)
TS *0.945 ***0.736 ***0.0370.0280.036
(21.55)(5.12)(1.59)(1.00)(1.40)
TR *−0.014 ***−0.009 **−0.004−0.005−0.004
(−3.58)(−2.33)(−0.37)(−0.37)(−0.40)
Tech0.040 ***0.041 ***0.065 ***0.059 ***0.061 ***
(16.29)(18.69)(4.85)(5.30)(5.45)
Pgdp0.0110.0080.0210.147 ***0.112 ***
(0.62)(0.59)(1.00)(5.05)(4.29)
Envi−0.012−0.0140.110−0.084−0.015
(−0.19)(−0.31)(1.08)(−0.76)(−0.15)
Urba−0.238 ***−0.129 ***−0.008−0.152 ***−0.108 **
(−7.61)(−3.77)(−0.25)(−2.78)(−2.49)
Constant0.255 ***0.1170.244−0.426−0.270
(3.02)(0.98)(1.00)(−1.44)(−1.03)
Sargan38.1034.90
(0.9969)(0.9798)
AR(1)−3.8275−3.5104
(0.0001)(0.0004)
AR(2)−0.4913−0.9033
(0.6232)(0.3664)
Observations509461551551551
Number of ID4543454545
F 12.1726.09
(0.0000)(0.0000)
R-squared 0.1360.2680.264
** is significant at the 5% level, and *** is significant at the 1% level.
Publisher’s Note: MDPI stays neutral with regard to jurisdictional claims in published maps and institutional affiliations.

