
Ranking Locations for Hydrogen Production Using Hybrid Wind-Solar: A Case Study

 ,
,  , , , , ,
  ,
,  ,
, 
Abstract
1. Introduction
2. Review of Literature
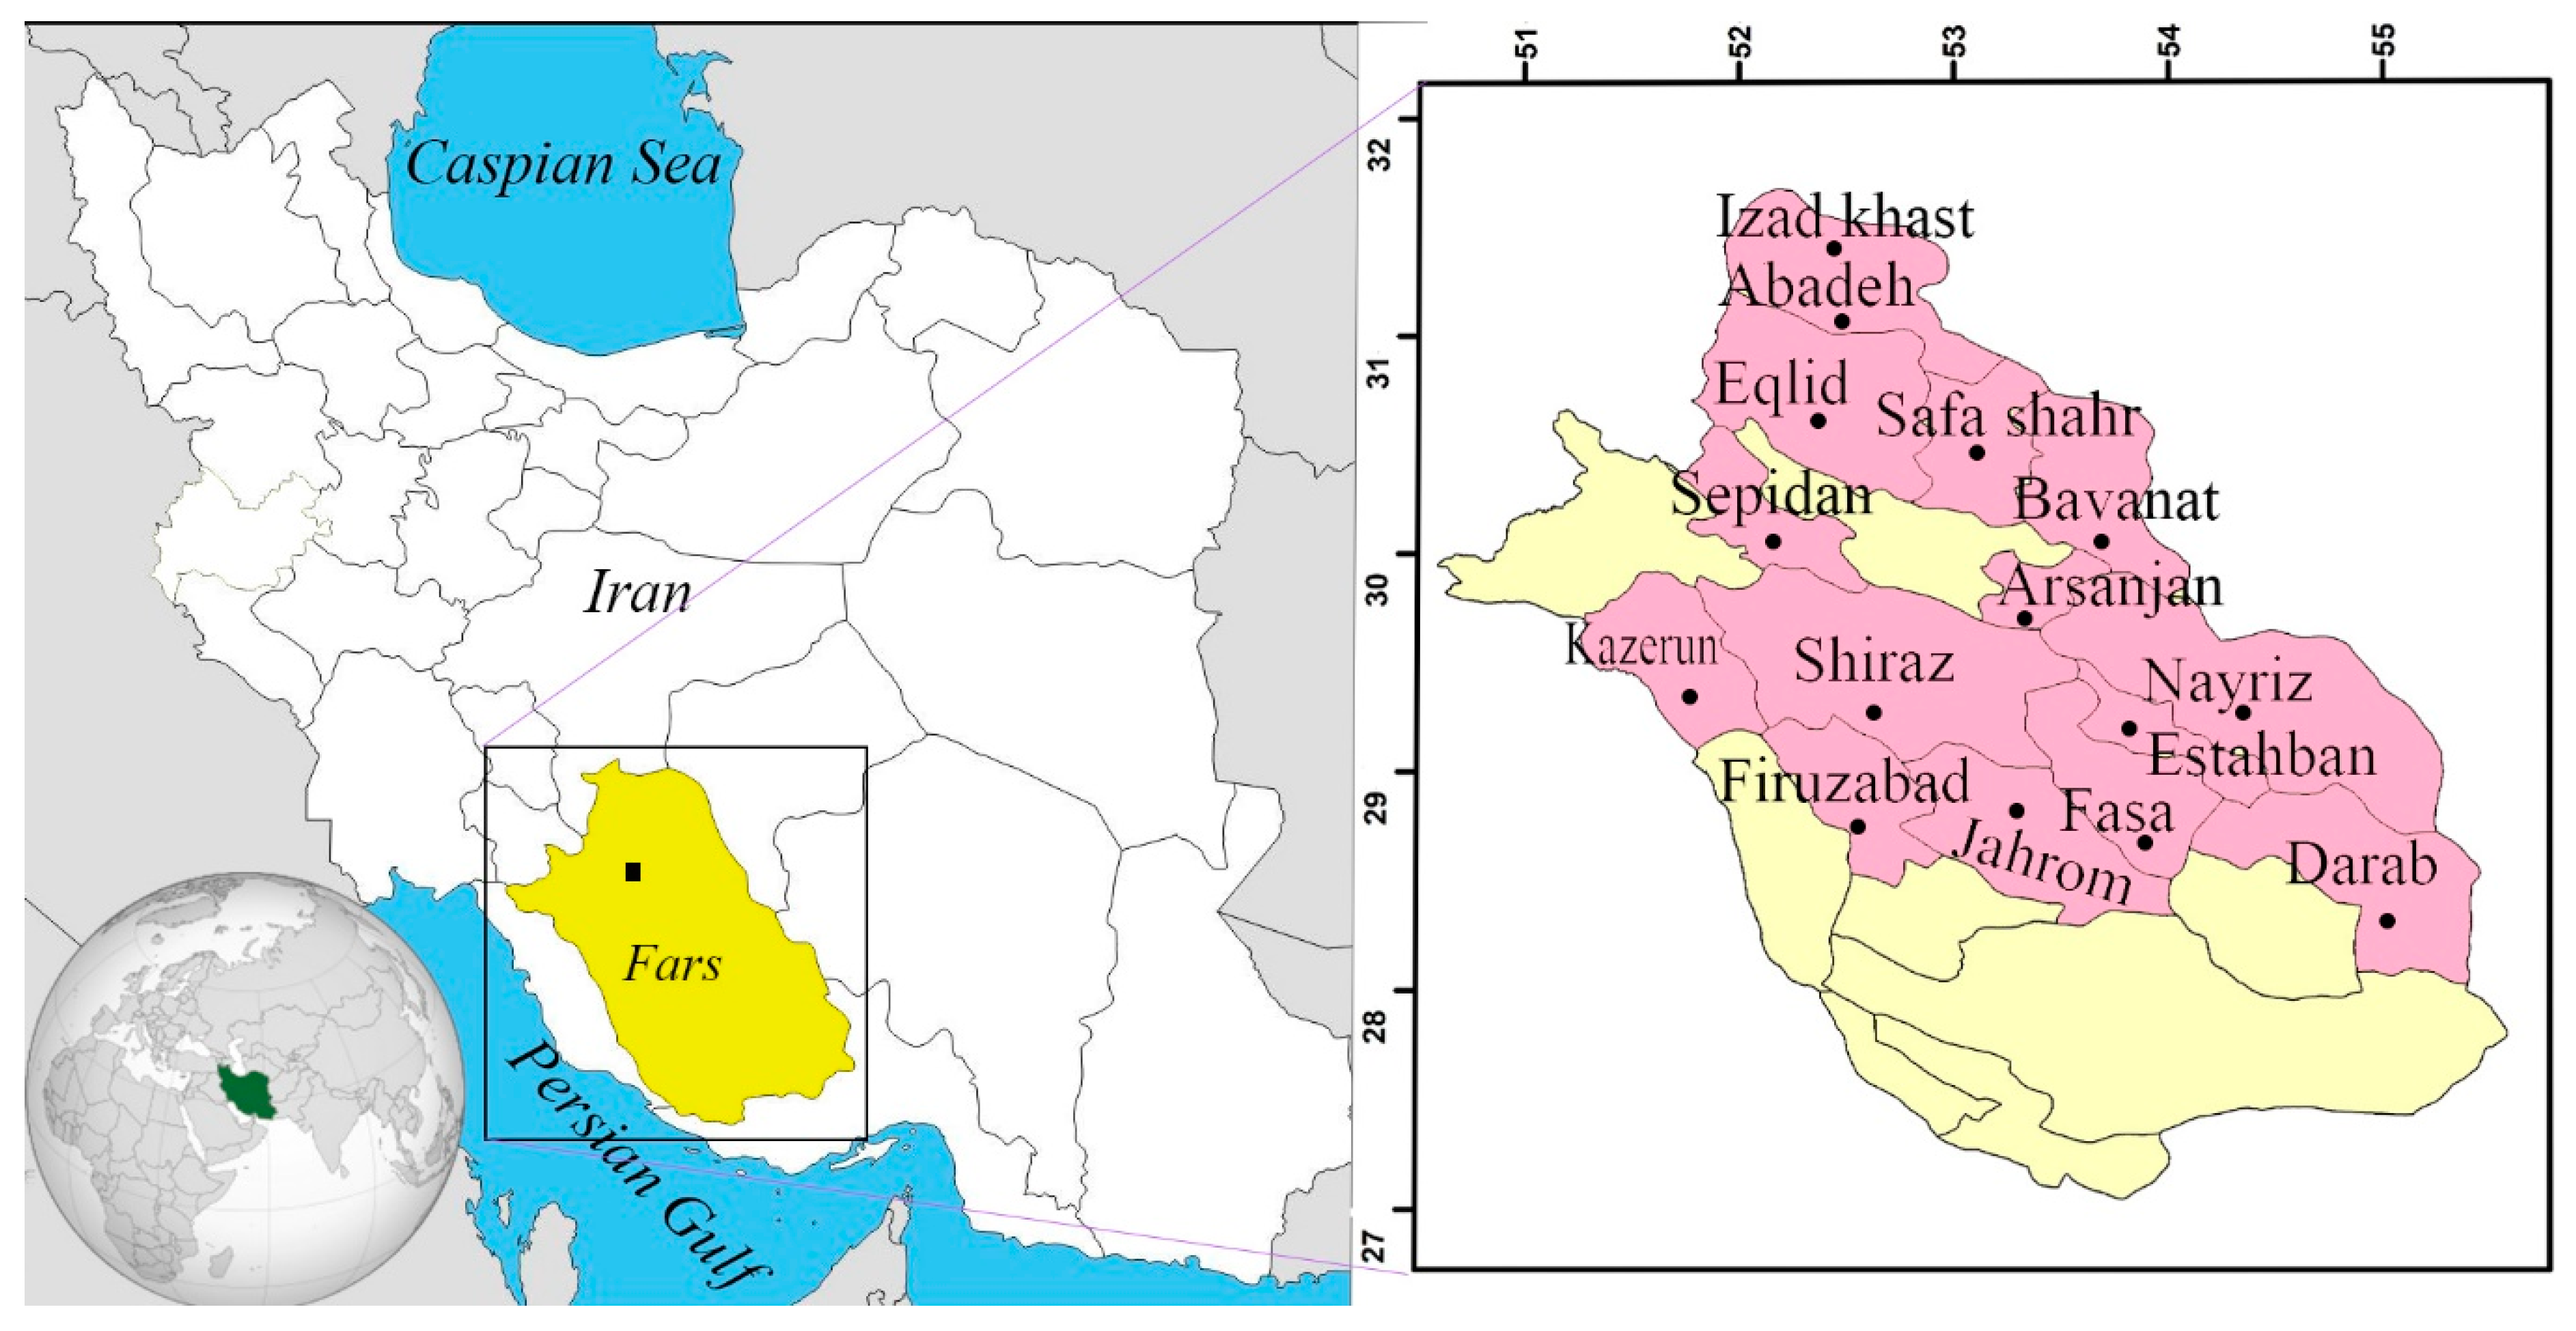
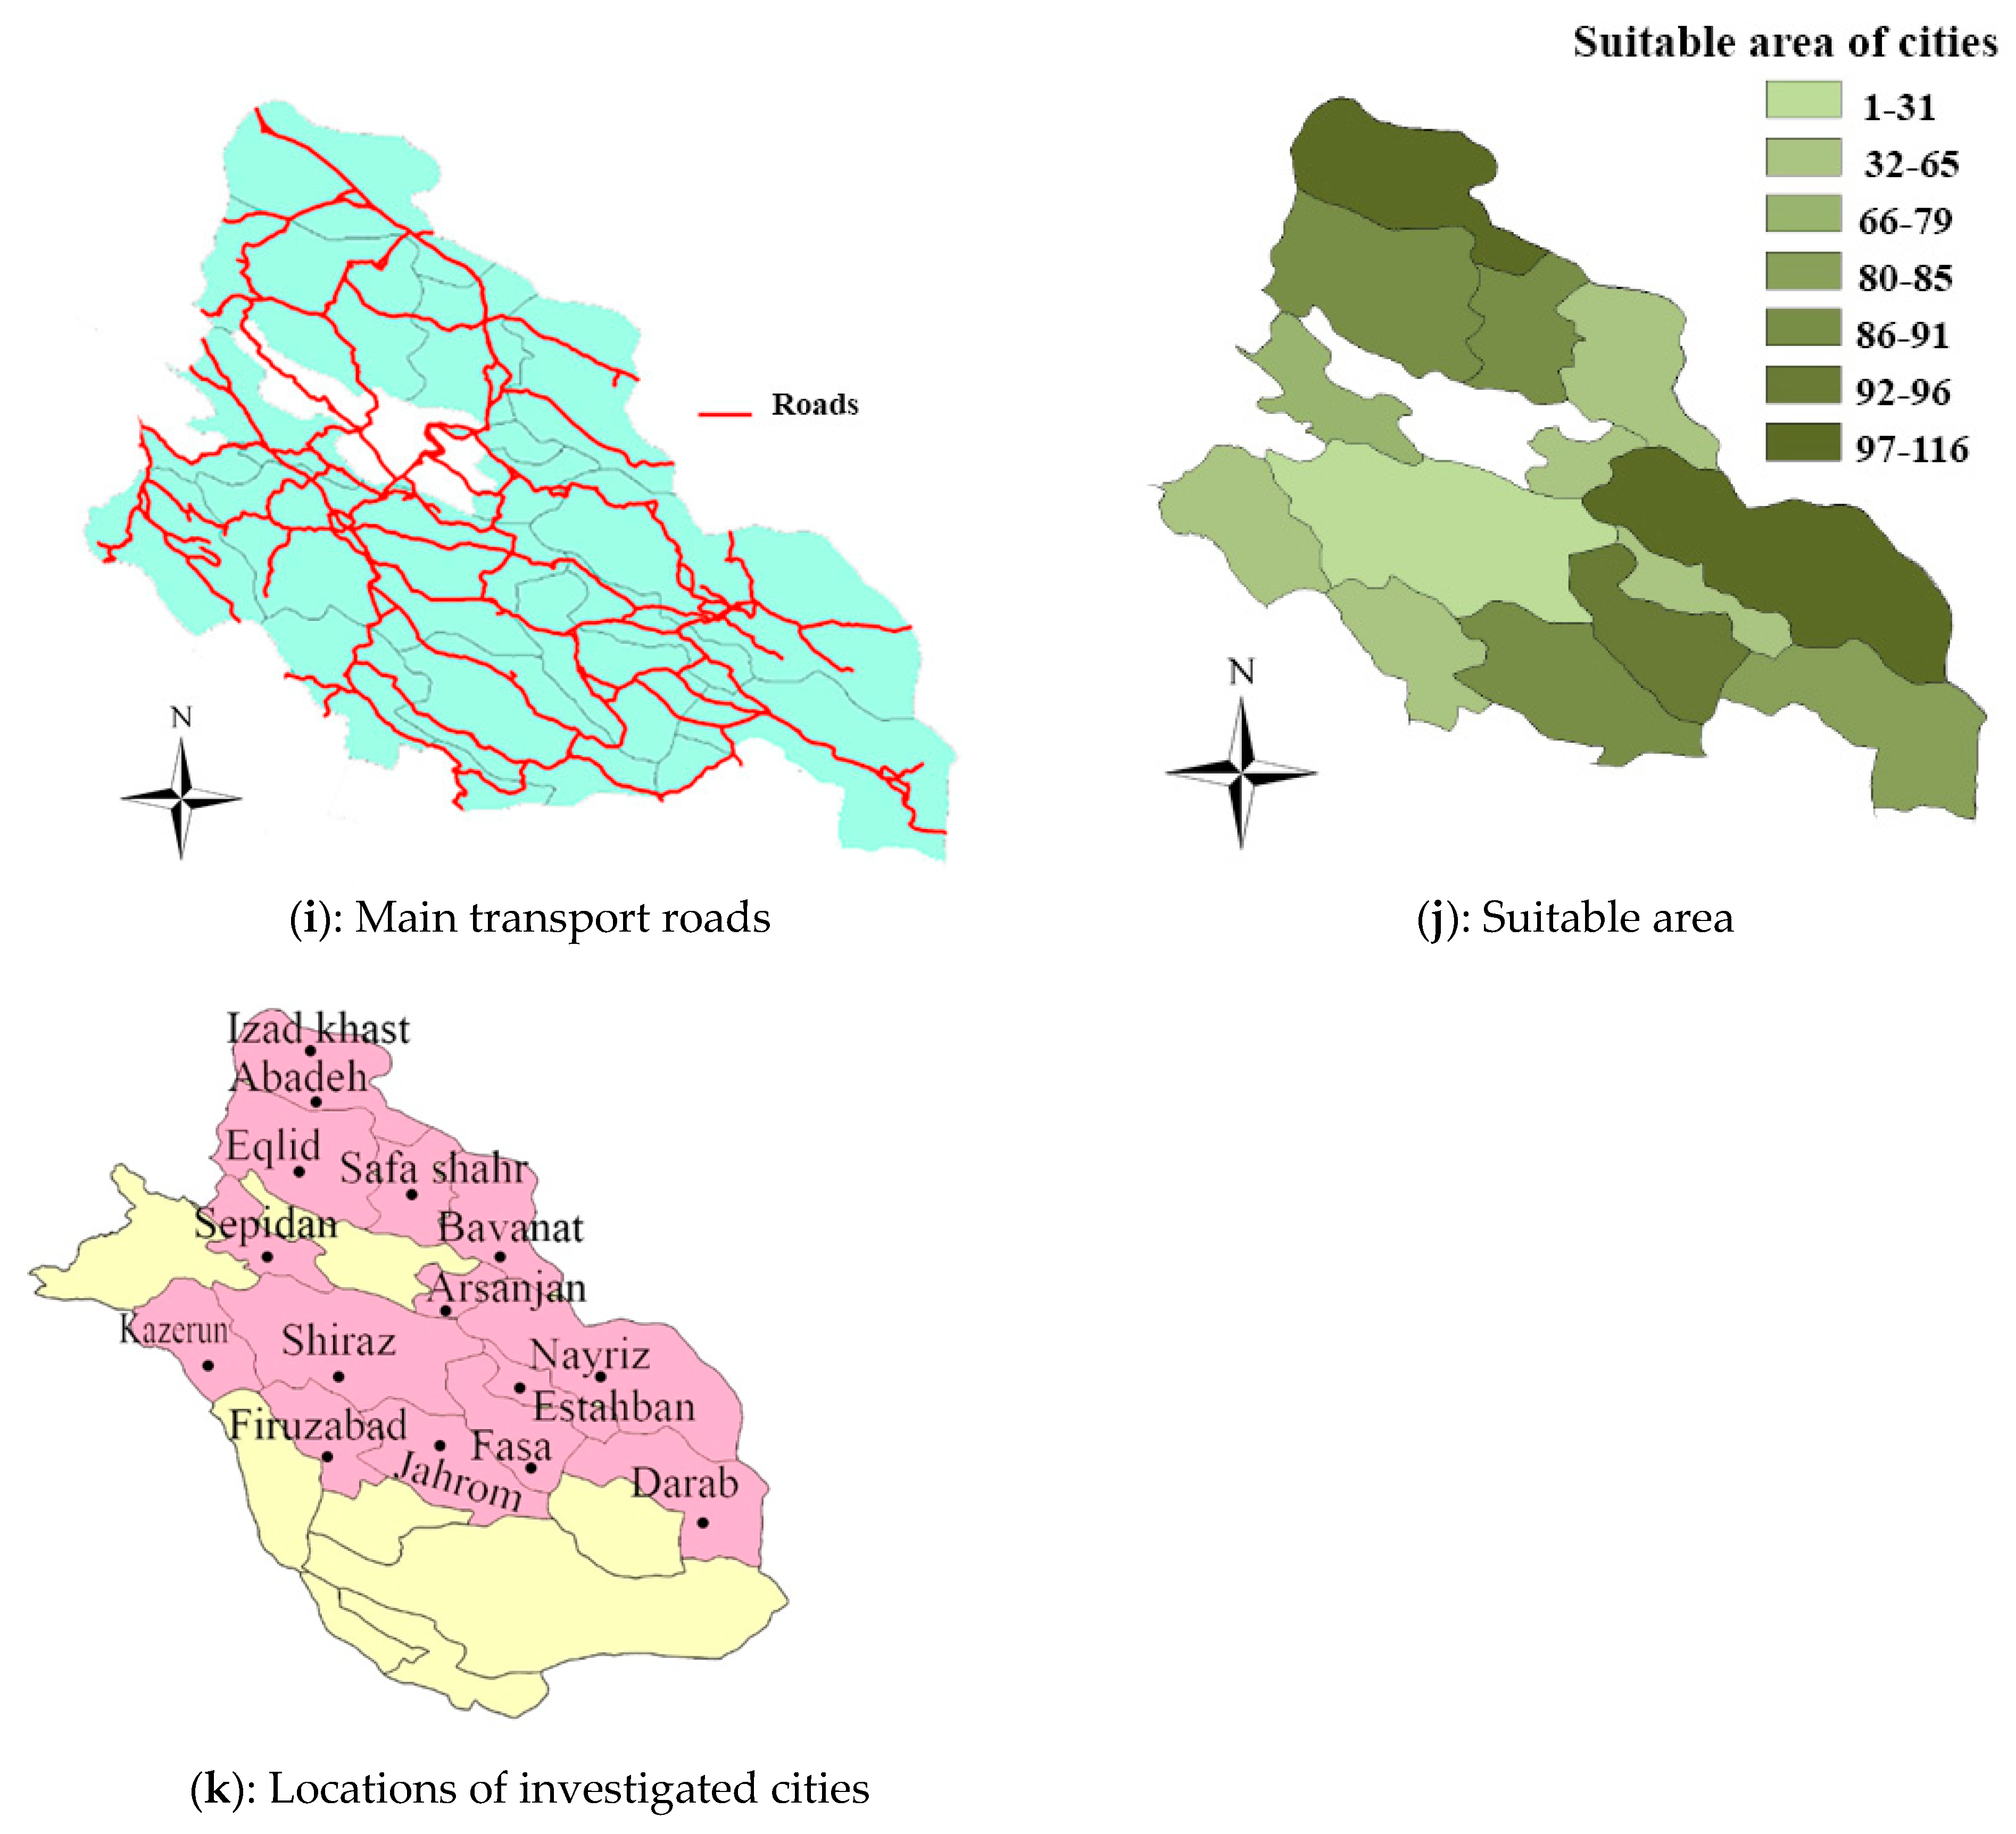
3. Study Area
4. Methodology
4.1. Multi-Criteria Decision-Making Methods
4.1.1. ARAS
- Step 1:
- Forming the decision matrix (a matrix whose rows are decision alternatives and whose columns are evaluation criteria).
- Step 2:
- Determining the hypothetical ideal value (the highest value for positive criteria and the lowest value for negative criteria).
- Step 3:
- Normalizing the decision matrix using the linear method.
- Step 4:
- Weighting the decision matrix by multiplying the criteria weights of the decision matrix by the normalized criteria values using Equation (1).
- Step 5:
- Computing the total utility. In this step, the weighted normalized value should be summed in rows according to Equation (2). Here, the highest obtained value is the best, and the lowest value is the worst. The optimality function has a direct relationship with the values and criteria weights and their relative impact on the final result. Thus, the variable with the highest optimality function value is the most effective. The superiority of alternatives can therefore be determined according to their value. This is why this method is known to perform very well in the evaluation and ranking of decision options [31].
- Step 6:
- Computing the relative utility. The degree of utility of each alternative is important not only for identifying the best option, but also for determining the relative quality (desirability) of lower-ranked options. In this step, Equation (3) is used to compute the degree of utility of each alternative through a comparison with an analyzed variable, which is determined by the ideal state, i.e., [29].
4.1.2. SAW
- Step 1:
- Forming the decision matrix.
- Step 2:
- Obtaining the normalized decision matrix using the linear norm method.
- Step 3:
- Obtaining the weight matrix.
- Step 4:
- Determining the best alternative using Equation (4) [33]:
4.1.3. CODAS
- Step 1:
- Forming the decision matrix
- Step 2:
- Normalizing the decision matrix using the linear method.
- Step 3:
- Forming the weighted normalized decision matrix by multiplying the criteria weight by the normalized matrix using Equation (5) [36]:
- Step 4:
- Computing the negative ideal point in terms of each criterion, which is denoted by , as shown in Equation (6):
- Step 5:
- Computing Euclidean and Taxicab distances from the negative ideal using Equations (7) and (8), respectively [34]
- Step 6:
- Forming the relative evaluation matrix using Equation (9) [35].
- Step 7:
- Ranking the alternatives by summing their values using Equation (11). The larger the value, the better the rank of the alternative [34].
4.1.4. TOPSIS
- Step 1:
- Forming the decision matrix.
- Step 2:
- Obtaining the normalized decision matrix using the vector norm method.
- Step 3:
- Creating the weight matrix based on one of the weighting methods.
- Step 4:
- Forming the weighted normalized matrix using Equation (12)
- Step 5:
- Determining the positive ideal solution , which is the largest value for positive criteria and the smallest value for negative criteria (i.e., the best value for each criterion), and also determining the negative ideal solution , which is the smallest value for positive criteria and the largest value for negative criteria (i.e., the worst value for each criterion).
- Step 6:
- Computing the Euclidean distance of each alternative from the positive and negative ideals using Equations (13) and (14) [8]:
- Step 7:
- Determining the relative closeness of each alternative to the ideal using Equation (15) [33]:
- Step 8:
- Ranking the alternatives in descending order of their values.
4.1.5. Aggregation Methods
Rank Averaging
Borda Method
Copeland Method
4.2. Decision Criteria
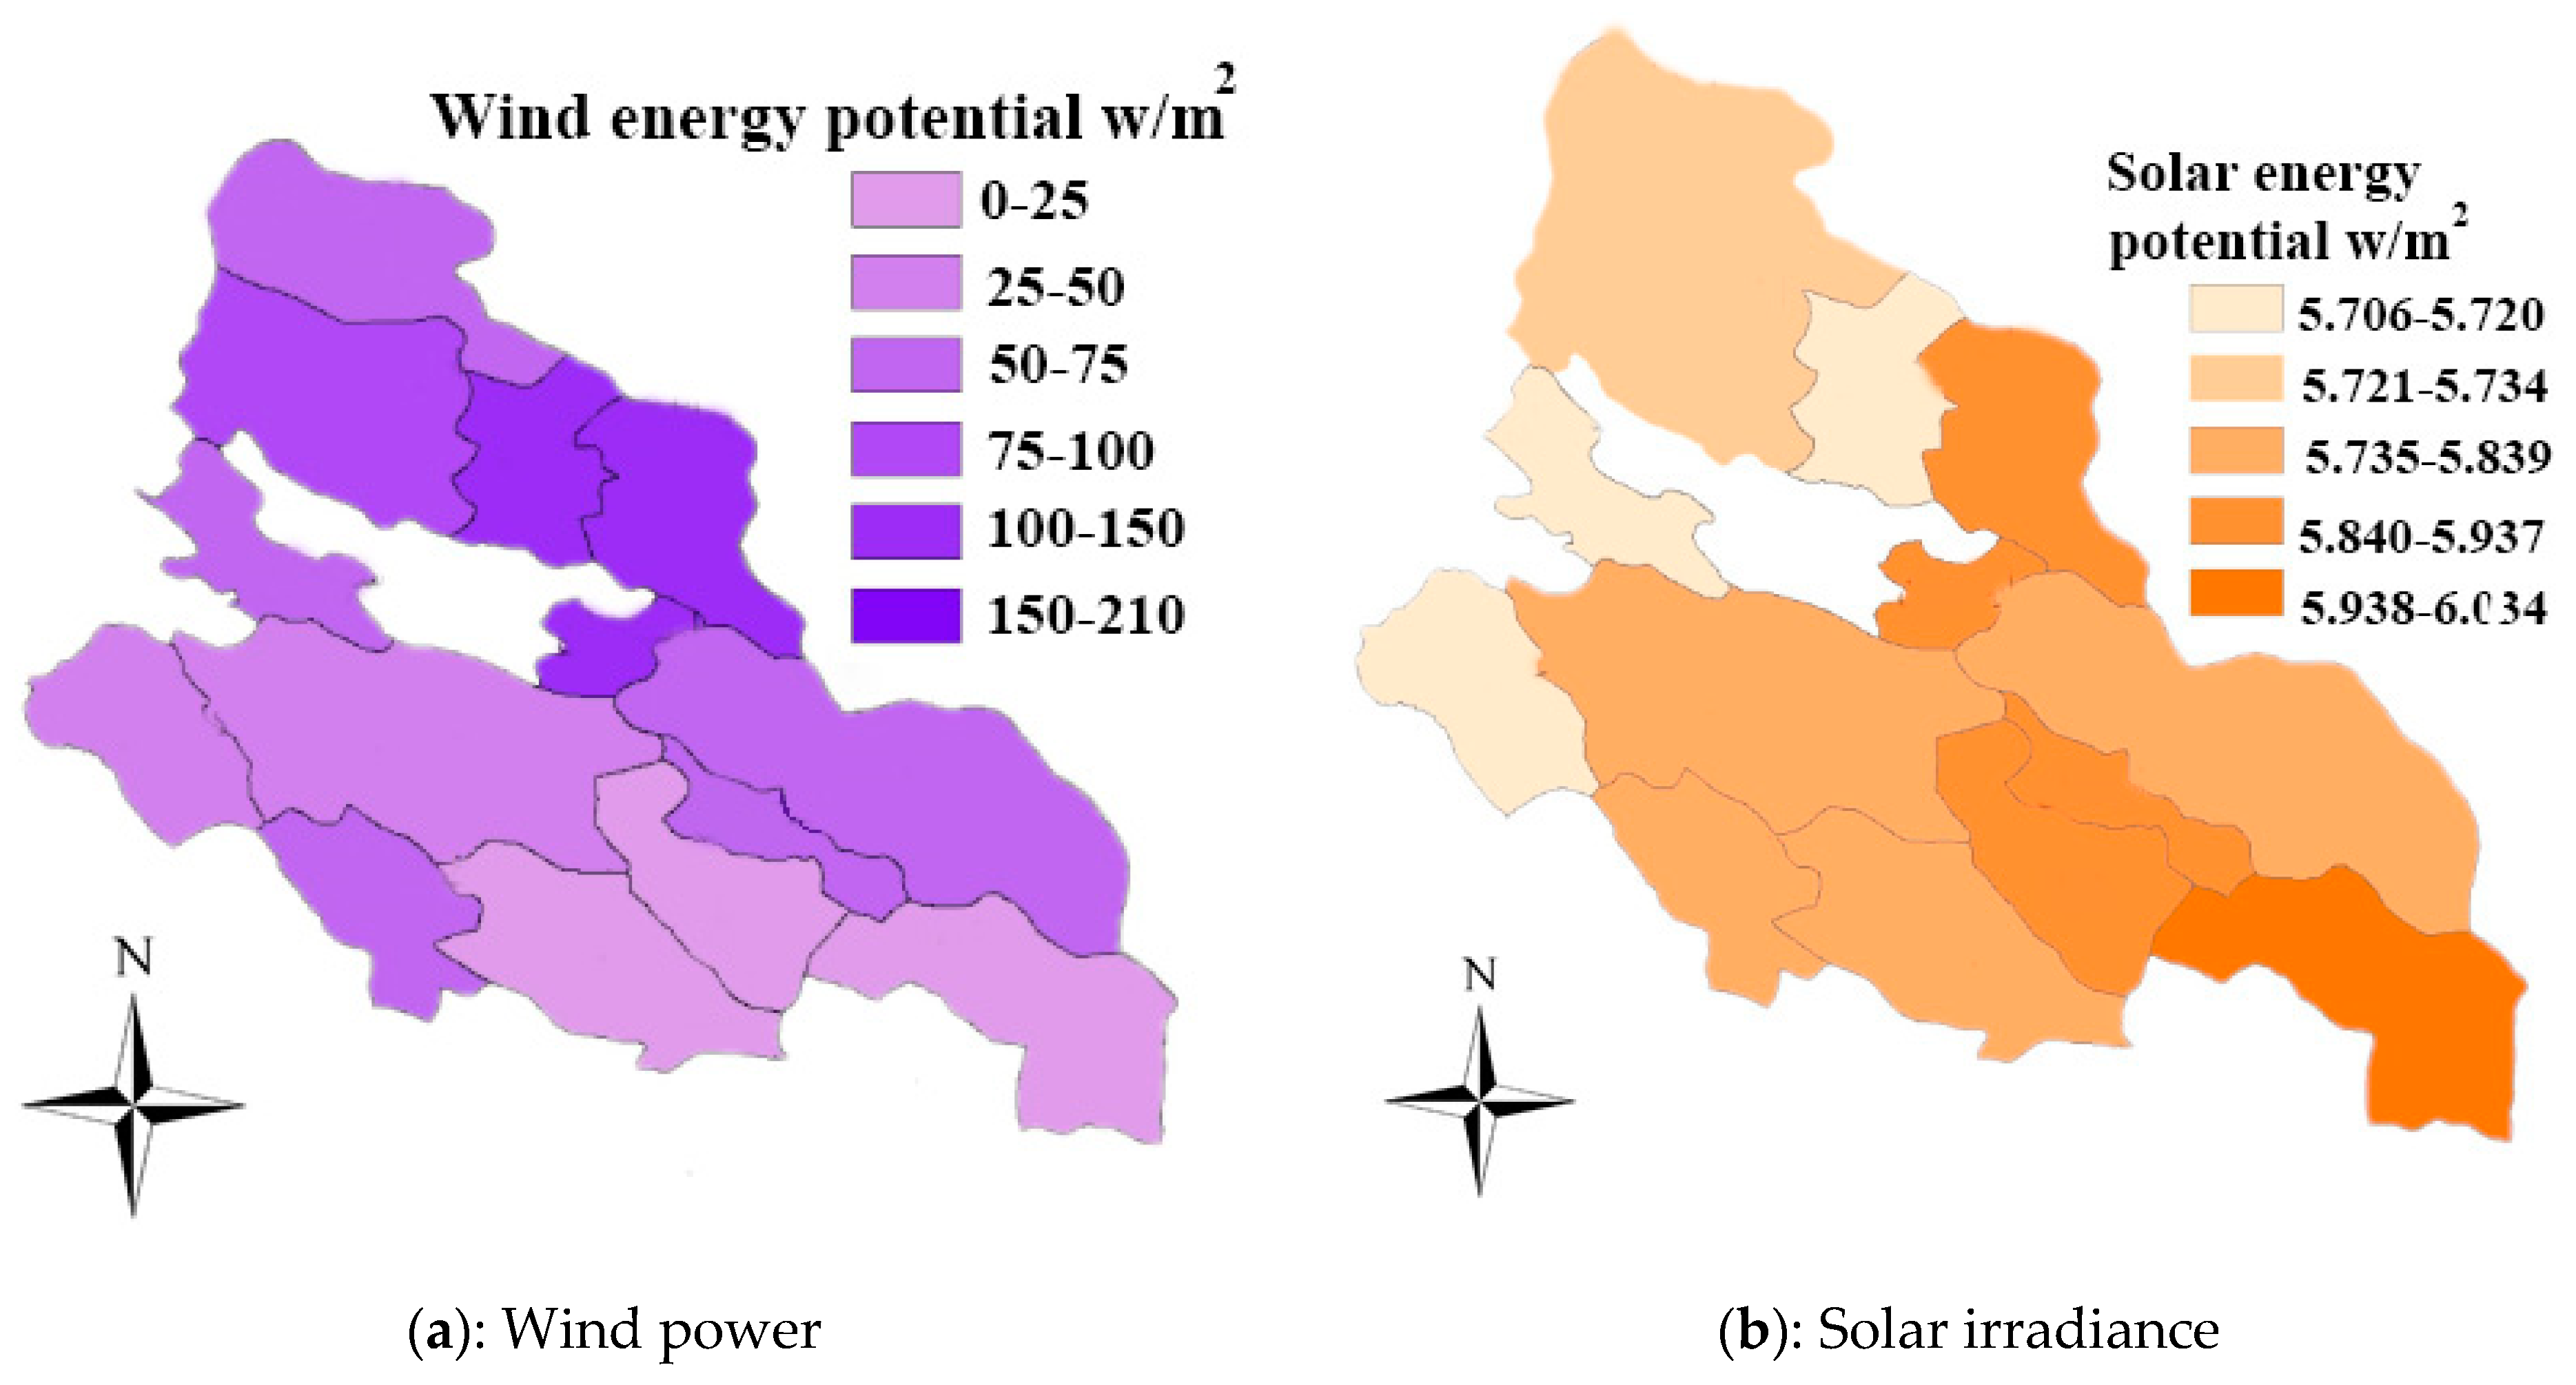
4.2.1. Solar Energy Potential
4.2.2. Wind Energy Potential
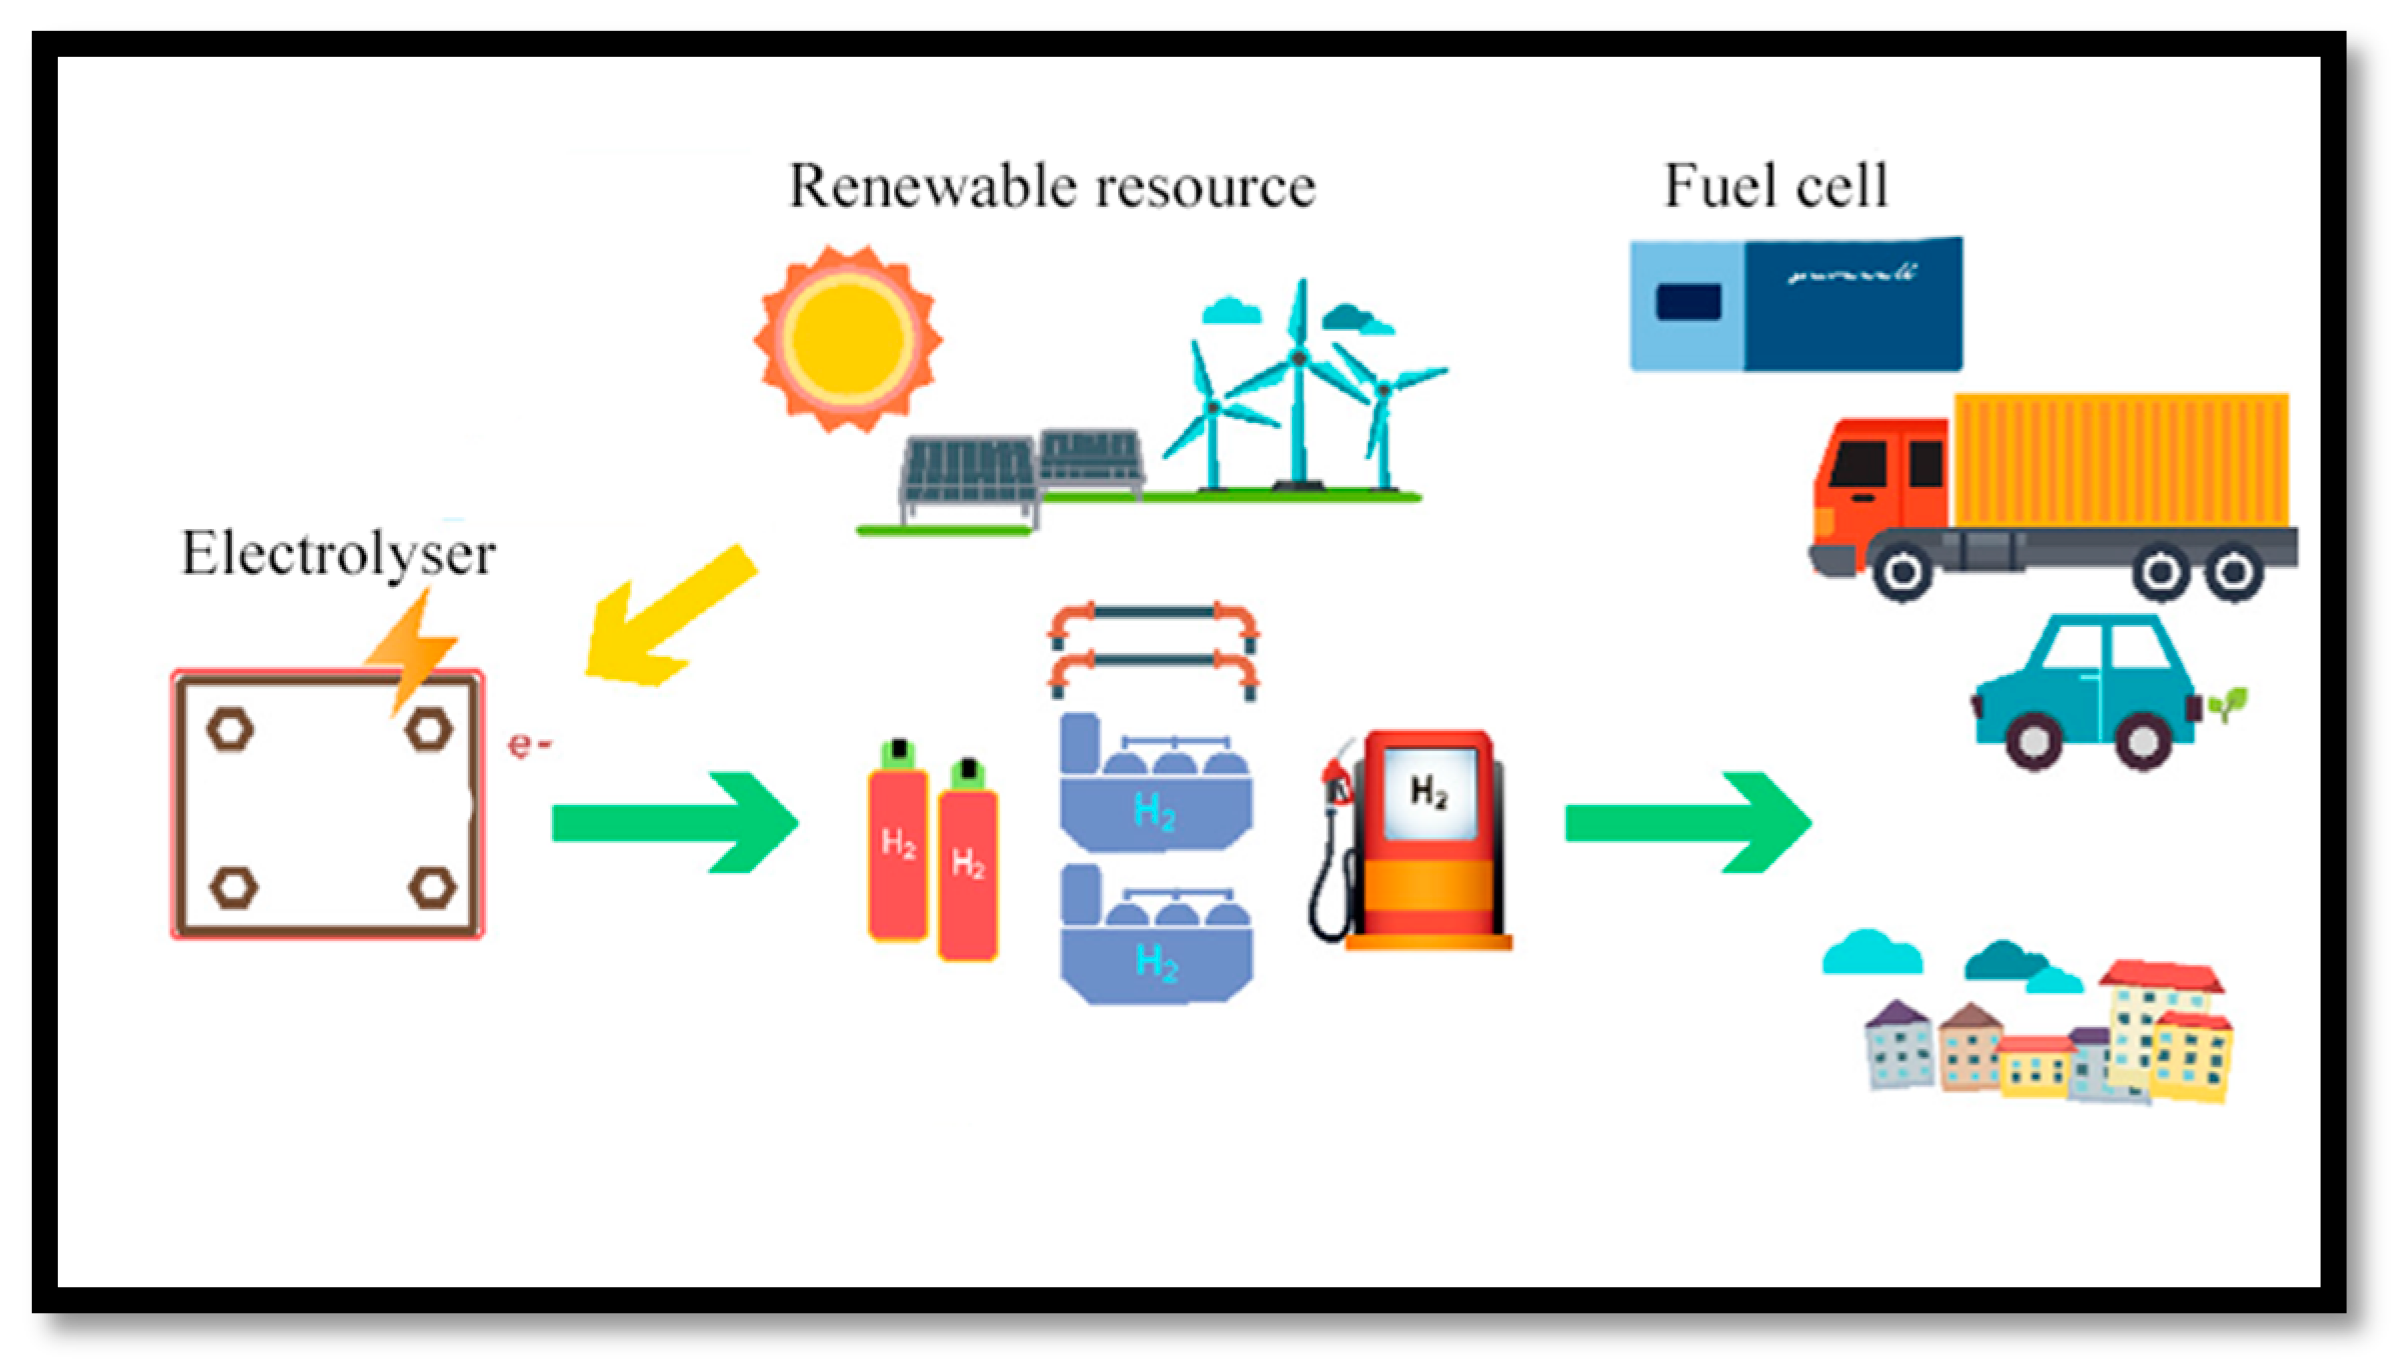
4.2.3. Electrolyzer
4.3. Criteria Weighting
Best—Worst Method (BWM)
- Step 1:
- Specifying the set of criteria that will be used in the decision-making (c1, c2, …, cn).
- Step 2:
- Identifying the best (most preferable) and worst (least preferable) criteria (in this step, the decision-maker generally specifies the best and worst criteria without making any comparison).
- Step 3:
- Determining the preference of the best criterion over other criteria on a scale between 1 and 9, with 1 indicating equal preference and 9 indicating complete superiority. The result of this vector comparison should be in the form of Equation (30).
- Step 4:
- Determining the preference of all criteria over the worst criterion on a scale between 1 and 9, with 1 indicating equal preference and 9 indicating complete superiority. The result of this vector comparison will be in the form of Equation (31).
- Step 5:
- Finding the optimal weights. The importance weight of criteria should be obtained in the format of . This vector must be defined in such a way that for each criterion j, and . Thus, to meet the mentioned conditions, the terms and should be minimum. Additionally, since it is assumed that the importance weights are non-negative and sum up to 1, the problem can be expressed as the mathematical programming problem of Equation (32) [46]:
5. Analysis
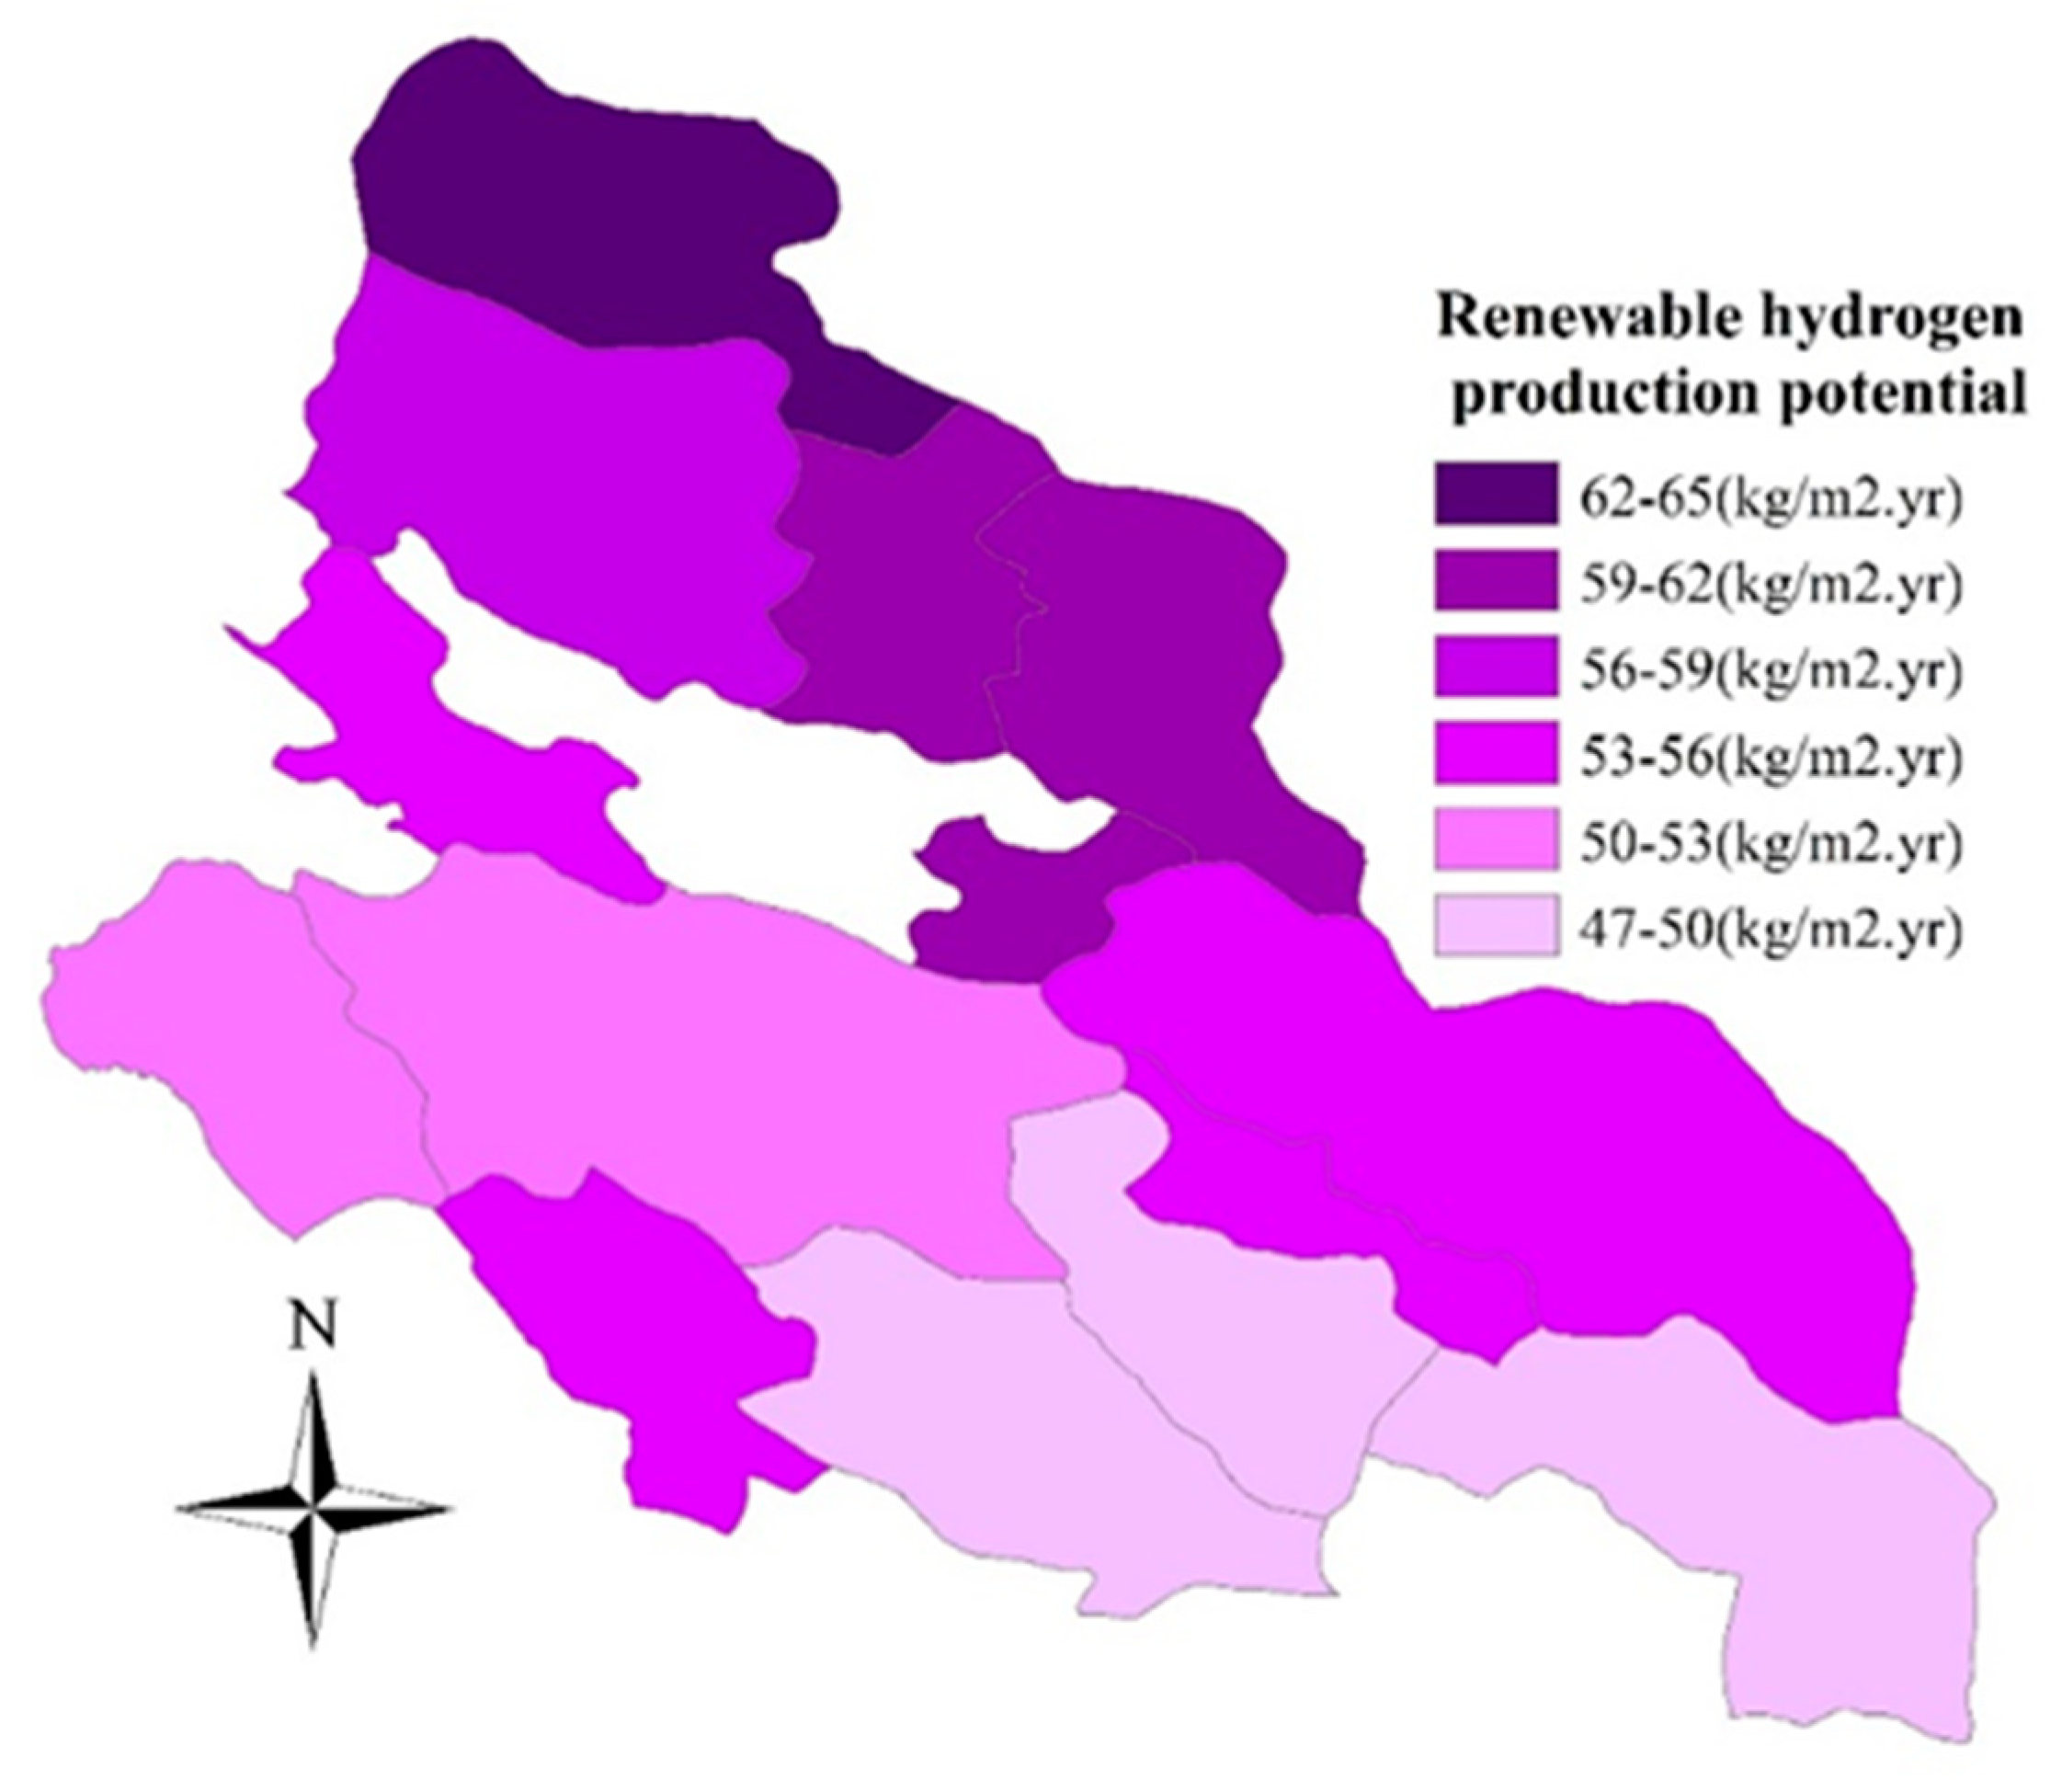
Hydrogen Production Potential
6. Conclusions
Author Contributions
Funding
Institutional Review Board Statement
Informed Consent Statement
Data Availability Statement
Conflicts of Interest
Nomenclature
| Normalized decision matrix | |
| The characteristic value of the i-th option relative to the j-th criterion | |
| Weight vector | |
| Criterion weight of j-th | |
| Normalized weighted matrix | |
| Normalized weighted matrix elements | |
| The Optimality Function value for the ith alternative in ARAS method | |
| The ideal mode in ARAS | |
| The degree of desirability of each option in ARAS | |
| The most suitable option in SAW | |
| Euclidean distance | |
| Taxicab distance | |
| Threshold parameter in CODAS | |
| Relative evaluation matrix | |
| Ranking | |
| The positive ideal solution | |
| The negative ideal solution | |
| Distance from the negative ideal solution | |
| Distance from the positive ideal solution | |
| The relative closeness of each alternative to the ideal solution | |
| Average energy radiation reaching a horizontal surface | |
| Average energy radiation reaching a horizontal surface in clear, cloudless conditions | |
| Angstrom coefficient | |
| Angstrom coefficient | |
| Average daily hours of sunshine | |
| The average number of possible hours of sunshine per day | |
| Julius number of the day of the year | |
| Solar constant | |
| Latitude of the place | |
| The sun declination angle | |
| The sunset hour angle | |
| Wind speed at the desired height | |
| Wind speed available | |
| The desired height | |
| Current height | |
| Power law index | |
| Probability density function | |
| V | Wind speed |
| Ambient air density | |
| Ambient air pressure in Pascal units | |
| Average air temperature in Kelvin | |
| Gas constant for dry air | |
| C | Scale parameter |
| k | Shape parameter |
| Weight of hydrogen gas produced in kilograms | |
| Energy produced by renewable energy sources | |
| The low calorific value of hydrogen in kilowatt hours per kilogram | |
| Electrolyzer system efficiency | |
| Extra efficiency factor to take into account the energy lost in the electrolyzer | |
| Indication of the performance of the best criterion B compared to the criterion j-th | |
| Indication of the performance of j relative to the worst criterion w | |
| Optimal value of BWM method |
References
- Sharvini, S.R.; Noor, Z.Z.; Chong, C.S.; Stringer, L.C.; Yusuf, R.O. Energy consumption trends and their linkages with renewable energy policies in East and Southeast Asian countries: Challenges and opportunities. Sustain. Environ. Res. 2018, 28, 257–266. [Google Scholar] [CrossRef]
- Yazdanpanah, M.; Komendantova, N.; Ardestani, R.S. Governance of energy transition in Iran: Investigating public acceptance and willingness to use renewable energy sources through socio-psychological model. Renew. Sustain. Energy Rev. 2015, 45, 565–573. [Google Scholar] [CrossRef]
- Tavana, A.; Javid, A.E.; Houshfar, E.; Andwari, A.M.; Ashjaee, M.; Shoaee, S.; Maghmoomi, A.; Marashi, F. Toward renewable and sustainable energies perspective in Iran. Renew. Energy 2019, 139, 1194–1216. [Google Scholar] [CrossRef]
- Mostafaeipour, A.; Abesi, S. Wind Turbine Productivity and Development in Iran. In Proceedings of the 2010 International Conference on Biosciences, Cancun, Mexico, 7–13 March 2010. [Google Scholar] [CrossRef]
- Mohammadi, K.; Mostafaeipour, A.; Dinpashoh, Y.; Poura, N. Electricity Generation and Energy Cost Estimation of Large-Scale Wind Turbines in Jarandagh, Iran. Hindawi Publishing Corporation. J. Energy 2014, 2014, 613681. [Google Scholar] [CrossRef]
- Zarezade, M.; Mostafaeipour, A. Identifying the effective factors on implementing the solar dryers for Yazd province, Iran. Renew. Sustain. Energy Rev. 2016, 57, 765–775. [Google Scholar] [CrossRef]
- Ren, J. Multi-criteria decision making for the prioritization of energy systems under uncertainties after life cycle sustainability assessment. Sustain. Prod. Consum. 2018, 16, 45–57. [Google Scholar] [CrossRef]
- Gigović, L.; Pamučar, D.; Božanić, D.; Ljubojević, S. Application of the GIS-DANP-MABAC multi-criteria model for selecting the location of wind farms: A case study of Vojvodina, Serbia. Renew. Energy 2017, 103, 501–521. [Google Scholar] [CrossRef]
- Noorollahi, Y.; Yousefi, H.; Mohammadi, M. Multi-criteria decision support system for wind farm site selection using GIS. Sustain. Energy Technol. Assess. 2016, 13, 38–50. [Google Scholar] [CrossRef]
- Available online: http://www.satba.gov.ir (accessed on 15 March 2019).
- Menia, S.; Tebibel, H.; Lassouane, F.; Khellaf, A.; Nouicer, I. Hydrogen production by methanol aqueous electrolysis using photovoltaic energy: Algerian potential. Int. J. Hydrogen Energy 2017, 42, 8661–8669. [Google Scholar] [CrossRef]
- Kaur, M.; Pal, K. Review on hydrogen storage materials and methods from an electrochemical viewpoint. J. Energy Storage 2019, 23, 234–249. [Google Scholar] [CrossRef]
- Ju, H.; Badwal, S.; Giddey, S. A comprehensive review of carbon and hydrocarbon assisted water electrolysis for hydrogen production. Appl. Energy 2018, 231, 502–533. [Google Scholar] [CrossRef]
- Available online: http://www.jrenew.ir/ (accessed on 2 April 2021).
- Zoghi, M.; Houshang Ehsani, A.; Sadat, M.; Javad Amiri, M.; Karimi, S. Optimization solar site selection by fuzzy logic model and weighted linear combination method in arid and semi-arid region: A case study Isfahan-IRAN. Renew. Sustain. Energy Rev. 2017, 68, 986–996. [Google Scholar] [CrossRef]
- Çolak, M.; Kaya, İ. Prioritization of renewable energy alternatives by using an integrated fuzzy MCDM model: A real case application for Turkey. Renew. Sustain. Energy Rev. 2017, 80, 840–853. [Google Scholar] [CrossRef]
- Mostafaeipour, A.; Alvandimanesh, M.; Najafi, F.; Issakhov, A. Identifying challenges and barriers for development of solar energy by using fuzzy best-worst method: A case study. Energy 2021, 226, 120355. [Google Scholar] [CrossRef]
- Ren, J.; Toniolo, S. Life cycle sustainability decision-support framework for ranking of hydrogen production pathways under uncertainties: An interval multi-criteria decision making approach. J. Clean. Prod. 2018, 175, 222–236. [Google Scholar] [CrossRef]
- Acar, C.; Beskese, A.; Temur, G.T. Sustainability analysis of different hydrogen production options using hesitant fuzzy AHP. Int. J. Hydrogen Energy 2018, 43, 18059–18076. [Google Scholar] [CrossRef]
- Yeh, T.-M.; Huang, Y.-L. Factors in determining wind farm location: Integrating GQM, fuzzy DEMATEL, and ANP. Renew. Energy 2014, 66, 159–169. [Google Scholar] [CrossRef]
- Alemi-Ardakani, M.; Milani, A.S.; Yannacopoulos, S.; Shokouhi, G. On the effect of subjective, objective and combinative weighting in multiple criteria decision making: A case study on impact optimization of composites. Expert Syst. Appl. 2016, 46, 426–438. [Google Scholar] [CrossRef]
- Messaoudi, D.; Settou, N.; Negrou, B.; Settou, B. GIS based multi-criteria decision making for solar hydrogen production sites selection in Algeria. Int. J. Hydrogen Energy 2019, 44, 31808–31831. [Google Scholar] [CrossRef]
- Lee, H.-C.; Chang, C.-T. Comparative analysis of MCDM methods for ranking renewable energy sources in Taiwan. Renew. Sustain. Energy Rev. 2018, 92, 883–896. [Google Scholar] [CrossRef]
- Mohsin, M.; Rasheed, A.; Saidur, R. Economic viability and production capacity of wind generated renewable hydrogen. Int. J. Hydrogen Energy 2018, 43, 2621–2630. [Google Scholar] [CrossRef]
- Villacreses, G.; Gaona, G.; Martínez-Gómez, J.; Jijón, D.J. Wind farms suitability location using geographical information system (GIS), based on multi-criteria decision making (MCDM) methods: The case of continental Ecuador. Renew. Energy 2017, 109, 275–286. [Google Scholar] [CrossRef]
- Dhunny, A.Z.; Doorga, J.R.S.; Allam, Z.; Lollchund, M.R.; Boojhawon, R. Identification of optimal wind, solar and hybrid wind-solar farming sites using fuzzy logic modelling. Energy 2019, 188, 116056. [Google Scholar] [CrossRef]
- Available online: http://investinfars.ir (accessed on 2 April 2021).
- Available online: https://barghnews.com/fa/news/42970 (accessed on 2 April 2021).
- Zavadskas, E.K.; Turskis, Z. A new additive ratio assessment (ARAS) method in multicriteria decision-making. Technol. Econ. Dev. Econ. 2010, 16, 159–172. [Google Scholar] [CrossRef]
- Kutut, V.; Zavadskas, E.K.; Lazauskas, M. Assessment of priority alternatives for preservation of historic buildings using model based on ARAS and AHP methods. Arch. Civ. Mech. Eng. 2014, 14, 287–294. [Google Scholar] [CrossRef]
- Paul, D.; Agarwal, P.; Chakraborty, S. Performance appraisal of Indian state police forces using ARAS method. Manag. Sci. Lett. 2016, 6, 361–372. [Google Scholar] [CrossRef]
- Wang, Y.-J. Interval-valued fuzzy multi-criteria decision-making based on simple additive weighting and relative preference relation. Inf. Sci. 2019, 503, 319–335. [Google Scholar] [CrossRef]
- Mostafaeipour, A.; Jooyandeh, E. Prioritizing the locations for hydrogen production using a hybrid wind-solar system: A case study. Adv. Energy Res. 2017, 5, 107. [Google Scholar]
- Keshavarz Ghorabaee, M.; Zavadskas, E.K.; Turskis, Z.; Antucheviciene, J. A New Combinative Distance-Based Assessment (Codas) Method for Multi-Criteria Decision-Making. Econ. Comput. Econ. Cybern. Stud. Res. Acad. Econ. Stud. 2016, 50, 25–44. [Google Scholar]
- Ijadi Maghsoodi, A.; Rasoulipanah, H.; Martínez López, L.; Liao, H.; Zavadskas, E.K. Integrating interval-valued multi-granular 2-tuple linguistic BWM-CODAS approach with target-based attributes: Site selection for a construction project. Comput. Ind. Eng. 2020, 139, 106147. [Google Scholar] [CrossRef]
- Ijadi Maghsoodi, A.; Ijadi Maghsoodi, A.; Poursoltan, P.; Antucheviciene, J.; Turskis, Z. Dam construction material selection by implementing the integrated SWARA—CODAS approach with target-based attributes. Arch. Civ. Mech. Eng. 2019, 19, 1194–1210. [Google Scholar] [CrossRef]
- Peng, C.; Du, H.; Liao, T.W. A research on the cutting database system based on machining features and TOPSIS. Robot. Comput. Integr. Manuf. 2017, 43, 96–104. [Google Scholar] [CrossRef]
- Phelipe, M.R.; Alexandre, P.B.; Glauco, B.S.; Helder, G.C. Analysis of the operational performance of brazilian airport terminals: A multicriteria approach with De Borda-AHP integration. J. Air Transp. Manag. 2016, 51, 19–26. [Google Scholar]
- Green, M.A.; Emery, K.; Hishikawa, Y.; Warta, W.; Dunlop, E.D. Solar cell efficiency tables (Version 45). Progress in photovoltaics. Res. Appl. 2015, 23, 1–9. [Google Scholar]
- Rezaei, M.; Mostafaeipour, A.; Qolipour, M.; Tavakkoli-Moghaddam, R. Investigation of the optimal location design of a hybrid wind-solar plant: A case study. Int. J. Hydrogen Energy 2018, 43, 100–114. [Google Scholar] [CrossRef]
- Esteves, N.B.; Sigal, A.; Leiva, E.P.M.; Rodríguez, C.R.; Cavalcante, F.S.A.; de Lima, L.C. Wind and solar hydrogen for the potential production of ammonia in the state of Ceará–Brazil. Int. J. Hydrogen Energy 2015, 40, 9917–9923. [Google Scholar] [CrossRef]
- Aryanpur, V.; Shafiei, E. Optimal deployment of renewable electricity technologies in Iran and implications for emissions reductions. Energy 2015, 91, 882–893. [Google Scholar] [CrossRef]
- Sigal, A.; Leiva, E.P.M.; Rodríguez, C.R. Assessment of the potential for hydrogen production from renewable resources in Argentina. Int. J. Hydrogen Energy 2014, 39, 8204–8214. [Google Scholar] [CrossRef]
- Komiyama, R.; Otsuki, T.; Fujii, Y. Energy modeling and analysis for optimal grid integration of large-scale variable renewables using hydrogen storage in Japan. Energy 2015, 81, 537–555. [Google Scholar] [CrossRef]
- Rezaei, J. Best-worst multi-criteria decision-making method. Omega 2015, 53, 49–57. [Google Scholar] [CrossRef]
- Available online: https://ecoscore.be/en/info/ecoscore/co2 (accessed on 2 April 2021).


| No | Cities | Latitude N | Longitude E |
|---|---|---|---|
| 1 | Shiraz | 29°37′ | 52°32′ |
| 2 | Kazerun | 29°38′ | 51°39′ |
| 3 | Fasa | 28°55′ | 53°39′ |
| 4 | Abadeh | 31°18′ | 52°67′ |
| 5 | Bavanat | 30°28′ | 53°27′ |
| 6 | Arsanjan | 29°92′ | 53°32′ |
| 7 | Sepidan | 30°15′ | 51°58′ |
| 8 | Nayriz | 29°12′ | 54°20′ |
| 9 | Eqlid | 30°53′ | 52°41′ |
| 10 | Firuzabad | 28°81′ | 52°55′ |
| 11 | Safa Shahr | 30°36′ | 53°11′ |
| 12 | Estahban | 29°12′ | 54°03′ |
| 13 | Izad Khast | 31°08′ | 52°40′ |
| 14 | Darab | 28°75′ | 54°55′ |
| 15 | Jahrom | 28°30′ | 53°33′ |
| Constraint | Objective |
|---|---|
| A distance of 1000 m from residential areas | Protecting the safety of residents |
| A distance of 1000 m from water reservoirs, streams, forests, and protected areas | Protecting natural resources |
| A distance of 250 m from the road network A distance of at least 250 m from the power grid A distance of 500 m from the railway network A distance of 2000 m from airports | Infrastructure constraints |
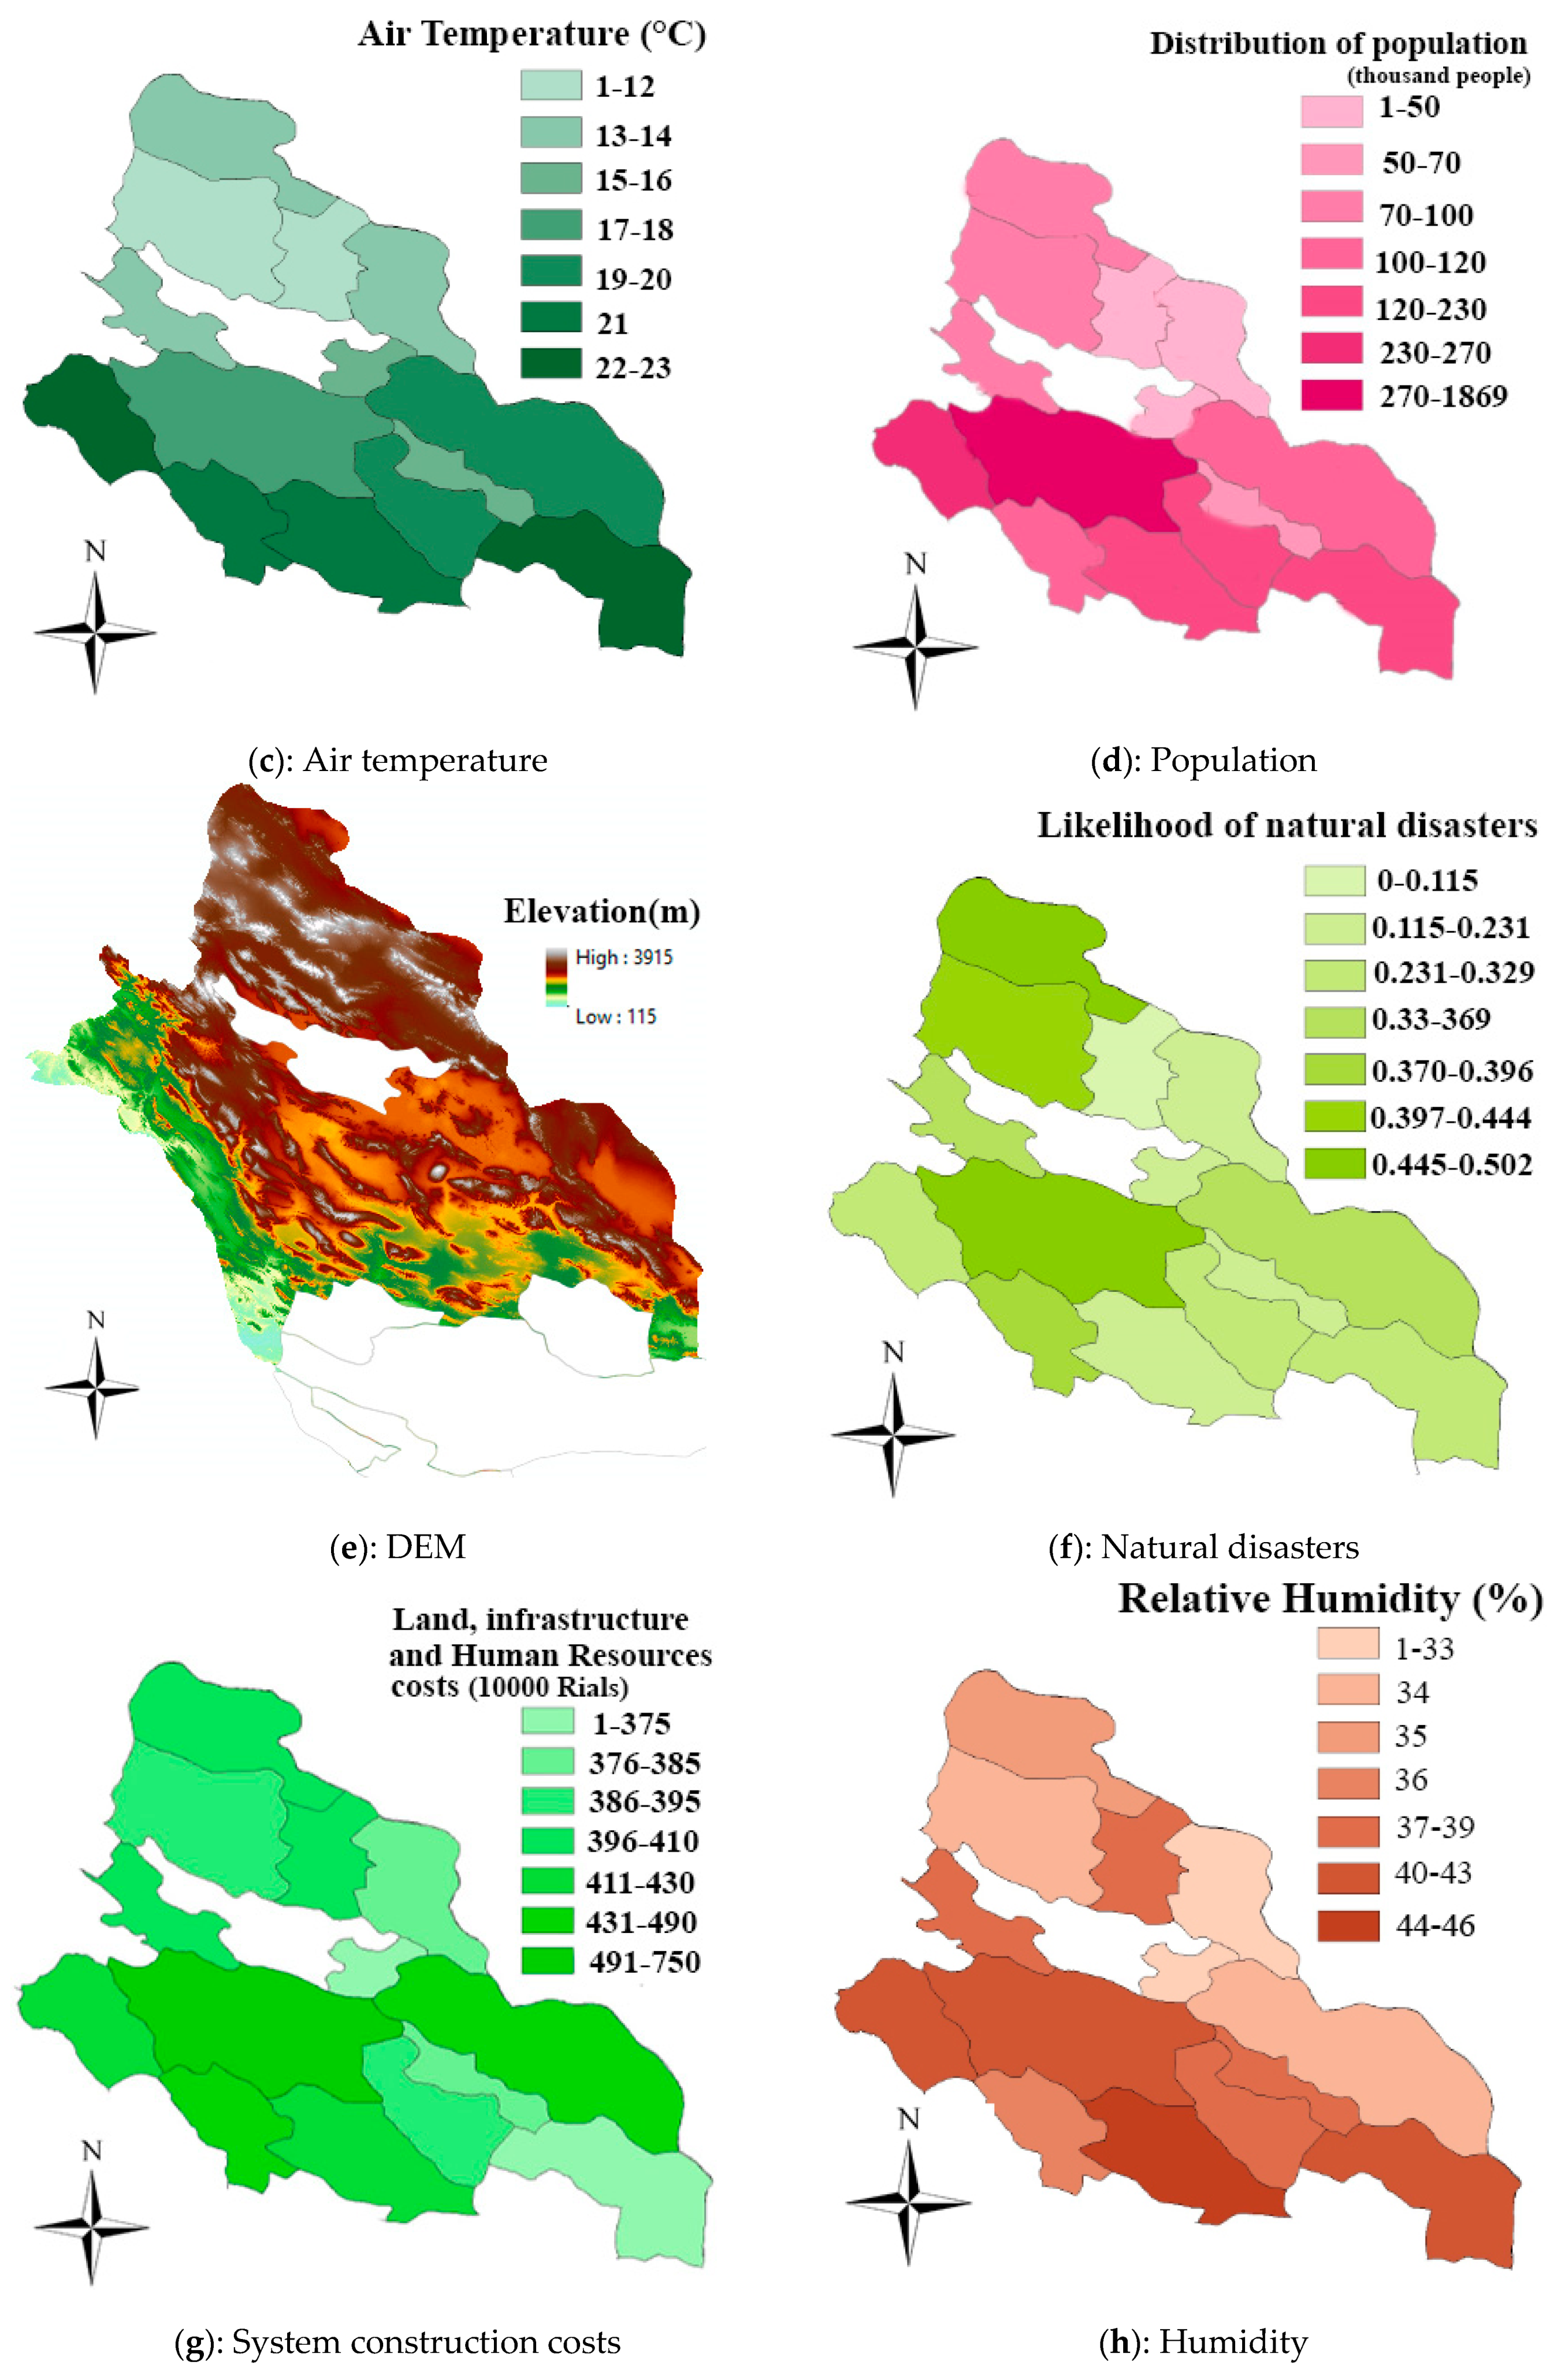
| No. | Criterion | Type |
|---|---|---|
| 1 | Solar energy potential | Positive |
| 2 | Wind energy potential | Positive |
| 3 | Mountain-heights | Negative |
| 4 | Temperature | Negative |
| 5 | Distance from main roads | Negative |
| 6 | Costs | Negative |
| 7 | Natural disasters | Negative |
| 8 | Population | Positive |
| 9 | Topography (features) | Negative |
| 10 | Relative humidity | Positive |
| No | Cities | ARAS | SAW | CODAS | TOPSIS | Average Ratings Ranking | Borda | Copland |
|---|---|---|---|---|---|---|---|---|
| 1 | Shiraz | 3 | 13 | 5 | 6 | 6 | 6 | 6 |
| 2 | Kazerun | 13 | 14 | 12 | 13 | 13 | 12 | 12 |
| 3 | Fasa | 12 | 10 | 14 | 12 | 12 | 12 | 12 |
| 4 | Abadeh | 9 | 7 | 10 | 8 | 8 | 8 | 8 |
| 5 | Bavanat | 4 | 3 | 3 | 3 | 3 | 3 | 3 |
| 6 | Arsanjan | 5 | 5 | 4 | 4 | 4 | 4 | 4 |
| 7 | Sepidan | 7 | 6 | 7 | 7 | 7 | 7 | 7 |
| 8 | Nayriz | 8 | 8 | 11 | 10 | 9 | 11 | 11 |
| 9 | Eqlid | 6 | 4 | 6 | 5 | 5 | 5 | 5 |
| 10 | Firuzabad | 10 | 11 | 8 | 11 | 11 | 10 | 10 |
| 11 | Safa Shahr | 2 | 2 | 2 | 2 | 2 | 2 | 2 |
| 12 | Estahban | 11 | 9 | 9 | 9 | 10 | 9 | 9 |
| 13 | Izad Khast | 1 | 1 | 1 | 1 | 1 | 1 | 1 |
| 14 | Darab | 14 | 12 | 13 | 14 | 14 | 12 | 12 |
| 15 | Jahrom | 15 | 15 | 15 | 15 | 15 | 13 | 13 |
| No | Cities | Ranking |
|---|---|---|
| 1 | Izad Khast | 1 |
| 2 | Safa Shahr | 2 |
| 3 | Bavanat | 3 |
| 4 | Arsanjan | 4 |
| 5 | Eqlid | 5 |
| 6 | Shiraz | 6 |
| 7 | Sepidan | 7 |
| 8 | Abadeh | 8 |
| 9 | Estahban, Firuzabad, Nayriz | 9 |
| 10 | Fasa. Kazerun, Darab, Jahrom | 10 |
| No | Cities | Available Wind Energy (kWh/m2.yr) | Produced Hydrogen from Wind (kg/m2.yr) | Available Solar Energy (kWh/m2.yr) | Produced Hydrogen from—Solar (kg/m2.yr) | Produced Hydrogen from Wind and Solar (kg/m2.yr) | Equivalent to Gasoline (Liter) | Equivalent to CO2 Emission (kg/yr) |
|---|---|---|---|---|---|---|---|---|
| 1 | Shiraz | 2137.1 | 38.5 | 677.8 | 12.2 | 50.7 | 141.9 | 452.5 |
| 2 | Kazerun | 2091.7 | 37.7 | 782.5 | 14.1 | 51.7 | 144.9 | 462.0 |
| 3 | Fasa | 2172.9 | 39.1 | 599.9 | 10.8 | 49.9 | 139.7 | 445.7 |
| 4 | Abadeh | 2098.6 | 37.8 | 863.4 | 15.5 | 53.3 | 149.3 | 476.1 |
| 5 | Bavanat | 2161.2 | 38.9 | 1271.9 | 22.9 | 61.8 | 173.0 | 551.8 |
| 6 | Arsanjan | 2139.6 | 38.5 | 1303.3 | 23.5 | 62.0 | 173.5 | 553.4 |
| 7 | Sepidan | 2093.5 | 37.7 | 956.0 | 17.2 | 54.9 | 153.7 | 490.2 |
| 8 | Nayriz | 2185.0 | 39.3 | 904.8 | 16.3 | 55.6 | 155.7 | 496.6 |
| 9 | Eqlid | 2097.9 | 37.8 | 1059.2 | 19.1 | 56.8 | 159.1 | 507.5 |
| 10 | Firuzabad | 2113.7 | 38.0 | 913.9 | 16.5 | 54.5 | 152.6 | 486.6 |
| 11 | Safa Shahr | 2088.4 | 37.6 | 1257.2 | 22.6 | 60.2 | 168.6 | 537.8 |
| 12 | Estahban | 2149.9 | 38.7 | 952.3 | 17.1 | 55.8 | 156.4 | 498.6 |
| 13 | Izad Khast | 2089.1 | 37.6 | 1469.1 | 26.4 | 64.0 | 179.3 | 571.9 |
| 14 | Darab | 2208.4 | 39.8 | 541.3 | 9.7 | 49.5 | 138.6 | 442.0 |
| 15 | Jahrom | 2137.1 | 38.5 | 495.9 | 8.9 | 47.4 | 132.7 | 423.2 |
Publisher’s Note: MDPI stays neutral with regard to jurisdictional claims in published maps and institutional affiliations. |
© 2021 by the authors. Licensee MDPI, Basel, Switzerland. This article is an open access article distributed under the terms and conditions of the Creative Commons Attribution (CC BY) license (https://creativecommons.org/licenses/by/4.0/).
Share and Cite
Almutairi, K.; Mostafaeipour, A.; Jahanshahi, E.; Jooyandeh, E.; Himri, Y.; Jahangiri, M.; Issakhov, A.; Chowdhury, S.; Hosseini Dehshiri, S.J.; Hosseini Dehshiri, S.S.; et al. Ranking Locations for Hydrogen Production Using Hybrid Wind-Solar: A Case Study. Sustainability 2021, 13, 4524. https://doi.org/10.3390/su13084524
Almutairi K, Mostafaeipour A, Jahanshahi E, Jooyandeh E, Himri Y, Jahangiri M, Issakhov A, Chowdhury S, Hosseini Dehshiri SJ, Hosseini Dehshiri SS, et al. Ranking Locations for Hydrogen Production Using Hybrid Wind-Solar: A Case Study. Sustainability. 2021; 13(8):4524. https://doi.org/10.3390/su13084524
Chicago/Turabian StyleAlmutairi, Khalid, Ali Mostafaeipour, Ehsan Jahanshahi, Erfan Jooyandeh, Youcef Himri, Mehdi Jahangiri, Alibek Issakhov, Shahariar Chowdhury, Seyyed Jalaladdin Hosseini Dehshiri, Seyyed Shahabaddin Hosseini Dehshiri, and et al. 2021. "Ranking Locations for Hydrogen Production Using Hybrid Wind-Solar: A Case Study" Sustainability 13, no. 8: 4524. https://doi.org/10.3390/su13084524
APA StyleAlmutairi, K., Mostafaeipour, A., Jahanshahi, E., Jooyandeh, E., Himri, Y., Jahangiri, M., Issakhov, A., Chowdhury, S., Hosseini Dehshiri, S. J., Hosseini Dehshiri, S. S., & Techato, K. (2021). Ranking Locations for Hydrogen Production Using Hybrid Wind-Solar: A Case Study. Sustainability, 13(8), 4524. https://doi.org/10.3390/su13084524