1. Introduction
The threats that demographic shifts pose to the financial sustainability of healthcare systems in developed and developing nations are well known. Ageing populations caused by longer lifespans [
1] and decreased fertility rates [
2] mean that the number of healthcare recipients steadily increases and care must be provided for longer. Therefore, the weight of healthcare expenditure in public budget is destined, ceteris paribus, to increase as well [
3,
4]. However, the way longer lifespans are achieved—either through reduction in child and adult mortality rates, or through reduction in the mortality rates of elderly people—also seems to affect healthcare sustainability [
5,
6,
7].
In the period 1990–2017, improvements in healthy life expectancy were mainly achieved through reductions in child and adult mortality rates, rather than reductions in non-fatal diseases, health risks and injuries, as periodically reported by the OECD Health Data statistics. The Global Burden of Disease Study 2019 confirmed these findings: some non-health goods and services, such as better education, better living standards, crime prevention, reduction in social inequalities and policies for younger people have a higher distal effect on the life expectancy below the age of 50 than proximal health delivery policies. However, as Salomon and colleagues [
1,
8] concisely synthesized, improving health “
means more than simply delaying death or increasing life expectancy at birth”.
The primary goal of this paper is to investigate if and how the way longer lifespans are achieved affects healthcare sustainability. The intuition is that since most improvements in terms of life expectancy are the result of lower mortality rates among younger people, more subjects reach an age in which they are chronically in need of medical assistance [
9], and that this need increases non-linearly as age advances. The hypothesis is that years lost to disability increase linearly with life-expectancy and that current health expenditure increases exponentially with years lost to disability.
In order to reach the objective, the correlation between life expectancy (LE), years lost to disability (YLD), and per-capita current health expenditure (CHE) in 33 Countries in 2017 (the latest year at which all data were available) was plotted.
These variables were chosen based on the evidence that health status in high-income countries mostly converge [
10,
11,
12,
13,
14] and absolute per capita spending shows diminishing returns in terms of overall life expectancy [
15].
This work is based upon an unpublished research study by Danovi and Olgiati [
16] and on a seminal work presented in 2015 at the World health summit in Beijing [
17]. In the article, dated 2012, the authors investigated the same relationships studied in these pages, essentially reaching the same results. This is relevant, although not surprising, because it shows that the trends discussed are consistent over time.
In the wake of the COVID-19 pandemic, concerns over the sustainability of universal healthcare systems seem more urgent than ever; accordingly, the analysis was updated with the most recent data available. Although the pandemic opened a vast array of questions, the findings presented in these pages appear nonetheless relevant, as the trends shown are independent of its devastating, yet contingent effects.
2. Materials and Methods
Data on life expectancy, healthy life expectancy, and years lost to disability for 33 countries in the year 2017 were downloaded as comma separated values files (“csv”) from the Institute for Health Metrics and Evaluation (IHME) Global Burden of Disease Study 2019 GBDSx [
18]. Data on per-capita current health expenditure, also in csv format, were downloaded from the WHO Global Health Expenditure Statistics Repository [
19]. The analysis was performed employing the statistical software SPSS.
The following variables and definitions, based on “The Global Burden of Disease: Generating Evidence, Guiding Policy”, were adopted:
Life expectancy (LE). Life expectancy at birth is the average number of years that a person can expect to live at birth;
Healthy life expectancy (HALE). Healthy life expectancy is the average number of years that a person can expect to live in “full health” by taking into account years lived in less than full health due to disease and/or non-fatal injury;
Years lost to disability (YLD). The Years Lost due to Disability is the difference between life expectancy (LE) and healthy life expectancy at birth (HALE), where LE is always greater or equal to HALE. It is equivalent to the number of years that people live with a health condition or its consequences or in less than full health due to disease and/or non-fatal injury;
Current health expenditure (CHE). According to the World Health Organization’s Data Repository on Health Expenditure, current health spending includes public (government, external resources for health from international programs and social security) and private expenditure (private pre-paid plans and out-of-pocket). For the purpose of comparisons, total health expenditure is expressed in constant (2017) US dollars.
Since the Institute for Health Metrics and Evaluation (IHME) provides data about LE and HALE, but not about YLD, values for each country in the sample and for both sexes were computed simply by subtracting LE and HALE.
Two datasets were created, one to investigate the relationship between life expectancy and years lost due to disability, and the other to investigate the relationship between years lost due to disability and per-capita current health expenditure. For each dataset both a multiple linear regression and an exponential regression were performed, assessing which was the best fit. In the first dataset, YLD was the dependent variable and LE was the independent variable. In the second dataset, CHE was the dependent variable and YLD was the independent variable.
3. Results
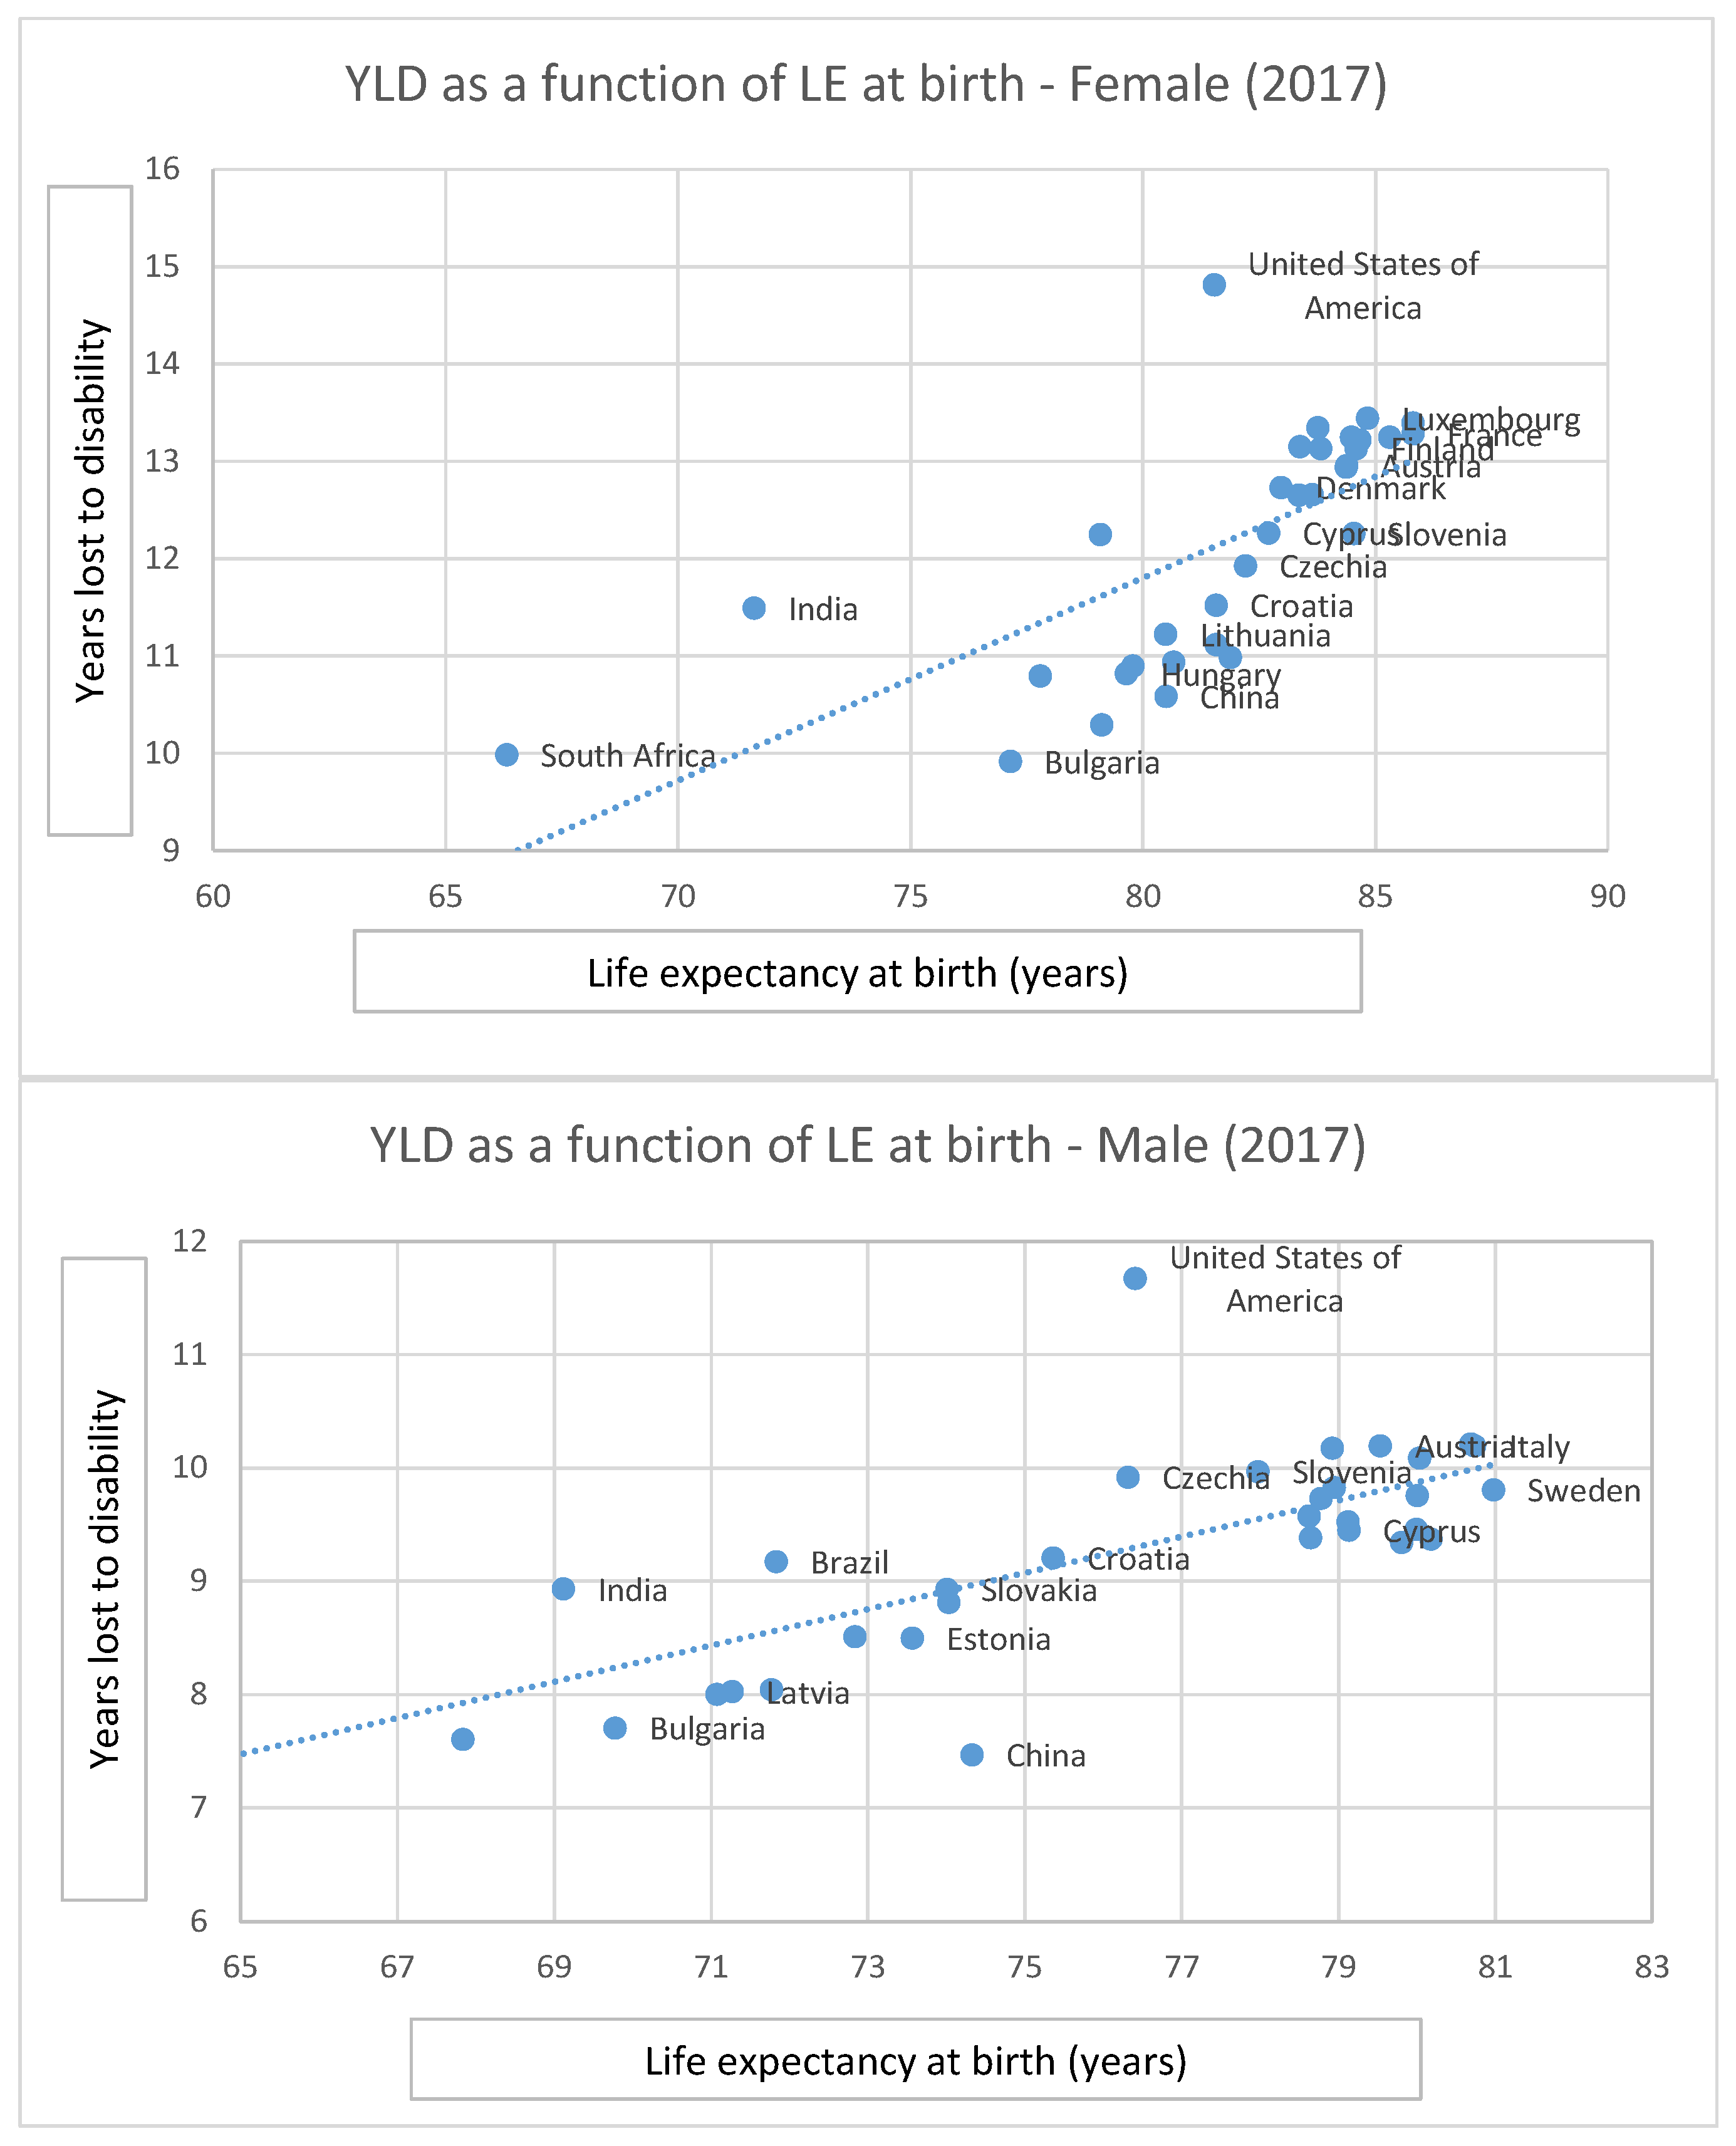
With respect to the study of the relationship between life expectancy and years lost to disability, the statistical analysis performed on the data compiled by the Institute for Health Metrics and Evaluation (IHME) in the Global Burden of Disease Study 2017 showed the existence of a linear correlation between the two variables in high- and middle-income countries. This epidemiological relationship, also referred to as “expansion of morbidity hypothesis”, is graphed in
Figure 1. The chart shows that in the European Union and in emerging BRICS (Brazil, Russia, India, China, South Africa) economies, an increase in YLD at birth is strongly and positively related to LE: as LE improves YLD grows linearly both for males (Slope = 0.16; Correlation = 0.77; R
2 = 0.61) and for females (Slope = 0.20; Correlation = 0.68; R
2 = 0.47).
Analysis of the Global Burden of Disease Study in 2017 [
18] showed that in the United States in 2017 mortality differences due to drugs overdose, pregnancy complications, traumas and homicide before the age of fifty accounted for a large proportion of the gap in LE with other comparable countries. Furthermore, these dynamics appear to be particularly acute in South Africa which in this respect can be considered an outlier. In 2017, life expectancy at fifty was 22.1 years for males and 26.68 for females while life expectancy at birth was 60.03 for males and 66.32 for females, highlighting the huge loss in life years under the age of fifty due to premature fatal disease and injury. In general
Figure 1 shows that variation around the regression line is higher in BRICS emerging economies than in high-income countries, with the exception of Brazil.
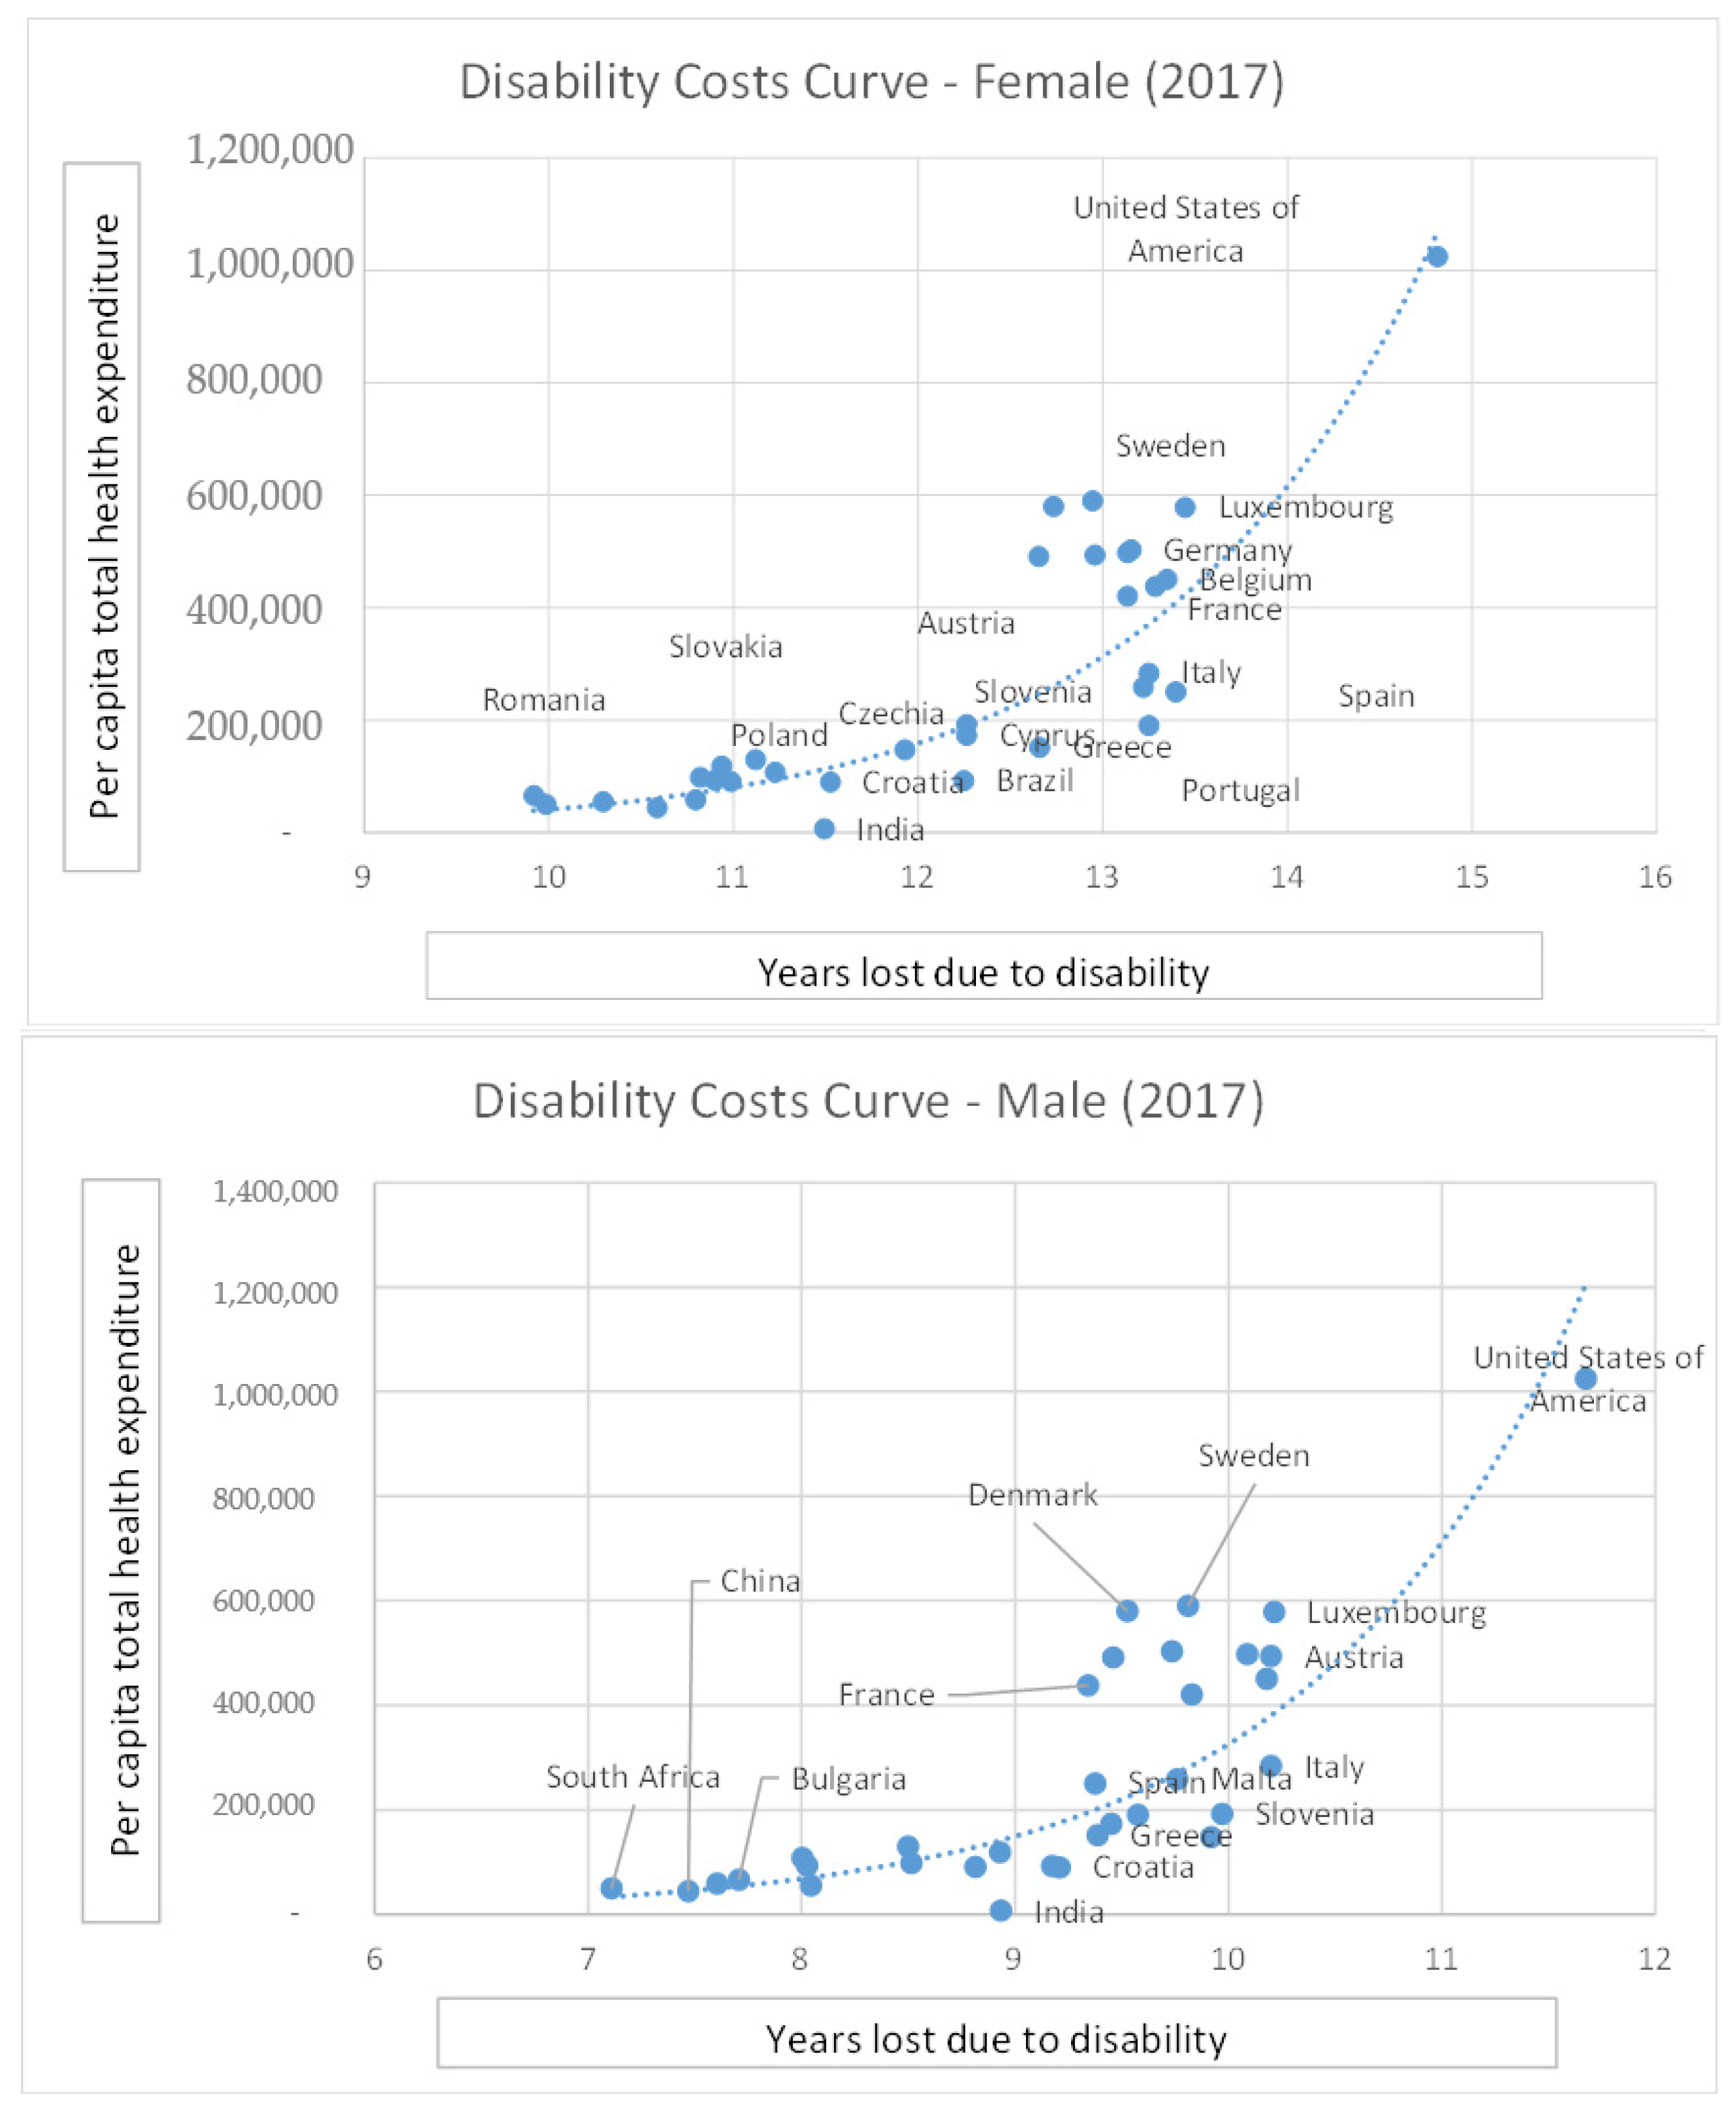
With respect to the second object of the investigation, i.e., the relationship between years lost due to disability and per-capita current health expenditure, the analysis performed on the selected sample of 33 high and middle-income countries (EU, USA and BRICS nations) showed that in the year 2017 CHE was an exponential function of YLD (males R
2 = 0.60; females R
2 = 0.65) both for males and females. The result of the analysis is graphed below in
Figure 2.
Overall, the linear correlation between LE and YLD, as well as the exponential correlation between YLD and CHE appear to be statistically significant, as summarized in
Table 1.
4. Discussion
The analysis of the relationship between life expectancy (LE at birth and at 50+ years of age), healthy life expectancy (HALE at birth and at 50+ years of age), the number of years lost due to disability (YLD at birth and at 50+ years of age), and per capita total health expenditure (CHE) in constant (2017) USD in the US, the European Union and the five largest high-growth middle-income countries (Brazil, Russian Federation, India, China, South Africa) in the year 2017 for males and females showed that LE and YLD are linearly correlated, while YLD and CHE are exponentially correlated.
These findings back the hypothesis that health expenditure increases non-linearly with the improvement of life expectancy and therefore that, as better socioeconomic conditions (per-capita wealth, living standards, education, equality and lower crime rates) determine improvements in health and life expectancy at birth, so the number of years lost to disability increases, and more resources need to be spent on healthcare.
These results imply that improving life expectancy via social policies bears negative consequences in terms of healthcare sustainability, unless the number of years lost to disability is reduced too. In other words, as overall YLD and CHE increase, additional resources should be invested not only to reduce mortality but also to reduce incidence, duration and severity of diseases that cause morbidity, co-morbidity and poli-morbidity, but not mortality.
Previous works, such as Jaba et al. [
20], investigated the relationship between healthcare expenditure and life-expectancy, highlighting how the latter is causally related to the former. Others, such as Felder et al. and Gerdtham et al. [
21,
22] studied the determinants of healthcare expenditure. The present paper, on the other hand, specifically investigates the notion that improving life-expectancy via other policies—without addressing the issue of late-life chronic illness—poses a threat to the long-term sustainability of healthcare systems. The conclusion that the number of years lost due to disability increases with life expectancy is not surprising. Such a relationship was noted as far back as 1977 by Gruenberg [
9].
Our results are consistent with those from Breyer and Felder [
23], who assessed that the demographic effect on healthcare expenditure in Germany up until 2050 is significantly lower if one accounts for the costs in the last years of life rather than focusing only on crude age-specific health expenditure. The analysis backs the claim that it is proximity to death and not age per se that determines the bulk of expenditure.
The findings specifically concerning the US are consistent with those by Murray et al., who analyzed the state of US healthcare in the 1990–2010 period, including the burden of diseases, injuries and risk factors, and concluded that the United States: “
made notable progress in improving health in the two decades from 1990 to 2010” but “
in a marked shift, non-fatal disease and disability accounted for almost half of all health burden in the US in 2010. Despite progress in extending life spans, population health in the US has not kept pace with advances in other wealthy countries” [
13]. Along these lines, the US Health Reform of 2010 introduced, among other initiatives, a mixed policy of long-term interventions aimed at reducing health spending growth relative to GDP, short-term interventions aimed at reducing costs immediately, and actions directed at controlling costs and increasing the value of care.
The implications of the disability costs curve on the sustainability of healthcare systems are not trivial from a financial perspective. The analysis showed at which rates both public and private healthcare systems are destined to absorb an ever-increasing number of resources. These findings bear significant consequences for:
Low-growth European countries (Italy, Spain, Portugal, Greece) facing a prolonged recession and enduring an economic crisis hampering the well-established present welfare and universal coverage models;
Mid-growth European economies (Germany, France, United Kingdom among the largest) in their effort to improve “healthy” life expectancy;
High-growth emerging middle-income economies striving to improve both life and healthy life expectancy gap with more advanced public health systems.
Clearly, the first goal should be to improve cost effectiveness and health adjusted life expectancy or, in other words, to reduce the number of years lost to disability per year of life expectancy gained. However, reaching this goal depends upon unpredictable future technological developments.
For more general healthcare planning purposes, the estimation of the sustainability of increased spending per additional year lived with disease, if public health policies do not improve the existing relationship between disability and life expectancy, is quite straightforward. Chernew and colleagues [
24,
25] proposed a theoretically sound and operating definition which can be extended to emerging economies, the US and other European high-income countries: healthcare spending growth is affordable if its growth rate allows for a reasonable amount of consumption of non-health goods and services. They concluded that health spending is sustainable if its growth rate does not exceed the maximum gap of +1% above real GDP growth.
For instance, in Germany—the highest health spender but not the country with the highest life expectancy—a gain of 1 year in life expectancy at birth corresponds to approximately +10 months in increased healthy life expectancy and +2 months lost to disability both for males (9.7 + 0.16 = 9.86 YLD) and females (11.0 + 0.15 = 11.15 YLD). This additional loss corresponds to an additional per-capita cost between USD 274 and 392 PPP (purchasing power parity) int. (+10–11%). If the future, expected average annual real GDP growth is to stay constant at a minimum of +1.5%, and the sustainable health spending maximum growth gap is assumed at +1% above the real GDP; this would mean that 6.7 years of economic growth would be needed to compensate 1 year of additional life expectancy.
On the other hand, in the case of Greece (LE 79.58, YLD 10.91, CHE 1517), one additional year of life expectancy would correspond to an increase of USD +416 of per-capita total health expenditure (+27% with respect to the current spending of USD 1517).
According to the analysis presented in this paper, the value of a sustainable healthcare policy should be measured in terms of increased healthy life expectancy as well as reduced number of years lost due to disability for each level of per capita health spending, i.e., bending the disability costs curve (
Figure 2) in terms of less money spent for less years lost. Without these goals, political economy and health economic policies will deliver more years of life expectancy but, at the same time, more years of disease and at a higher cost.
To conclude, policy makers should prioritize health policies aimed not only at improving life expectancy but also at reducing the burden of disability, to ensure the sustainability of public healthcare systems. To this end, future research may investigate the policies that are being deployed by southern European countries, which seems to be performing better relatively to the other countries in the sample.
Further studies may also overcome the limitations of the present contribution. The main limitation is that the data employed do not allow us to take the COVID-19 pandemic into account. Therefore, it would be useful to reperform it as soon as more recent data are available. No retrospective correlations on the variables studied in this paper were performed. Future contributions may improve upon this point. Another limitation of the study is that its scope is very broad. First of all, the analysis was performed on a sample of very diverse countries. While using a larger sample allows for a simpler statistical analysis (yielding a significant correlation), using a smaller and more homogenous one, such as EU27 Countries, could provide more specific information which could prove more useful to policy makers. Moreover, one must note that this contribution does not make a distinction between different causes of disability. A narrower focus would probably yield more practical results.


