
Predict and Simulate Sustainable Urban Growth by Using GIS and MCE Based CA. Case of Famagusta in Northern Cyprus


Abstract
1. Introduction
2. Literature Review
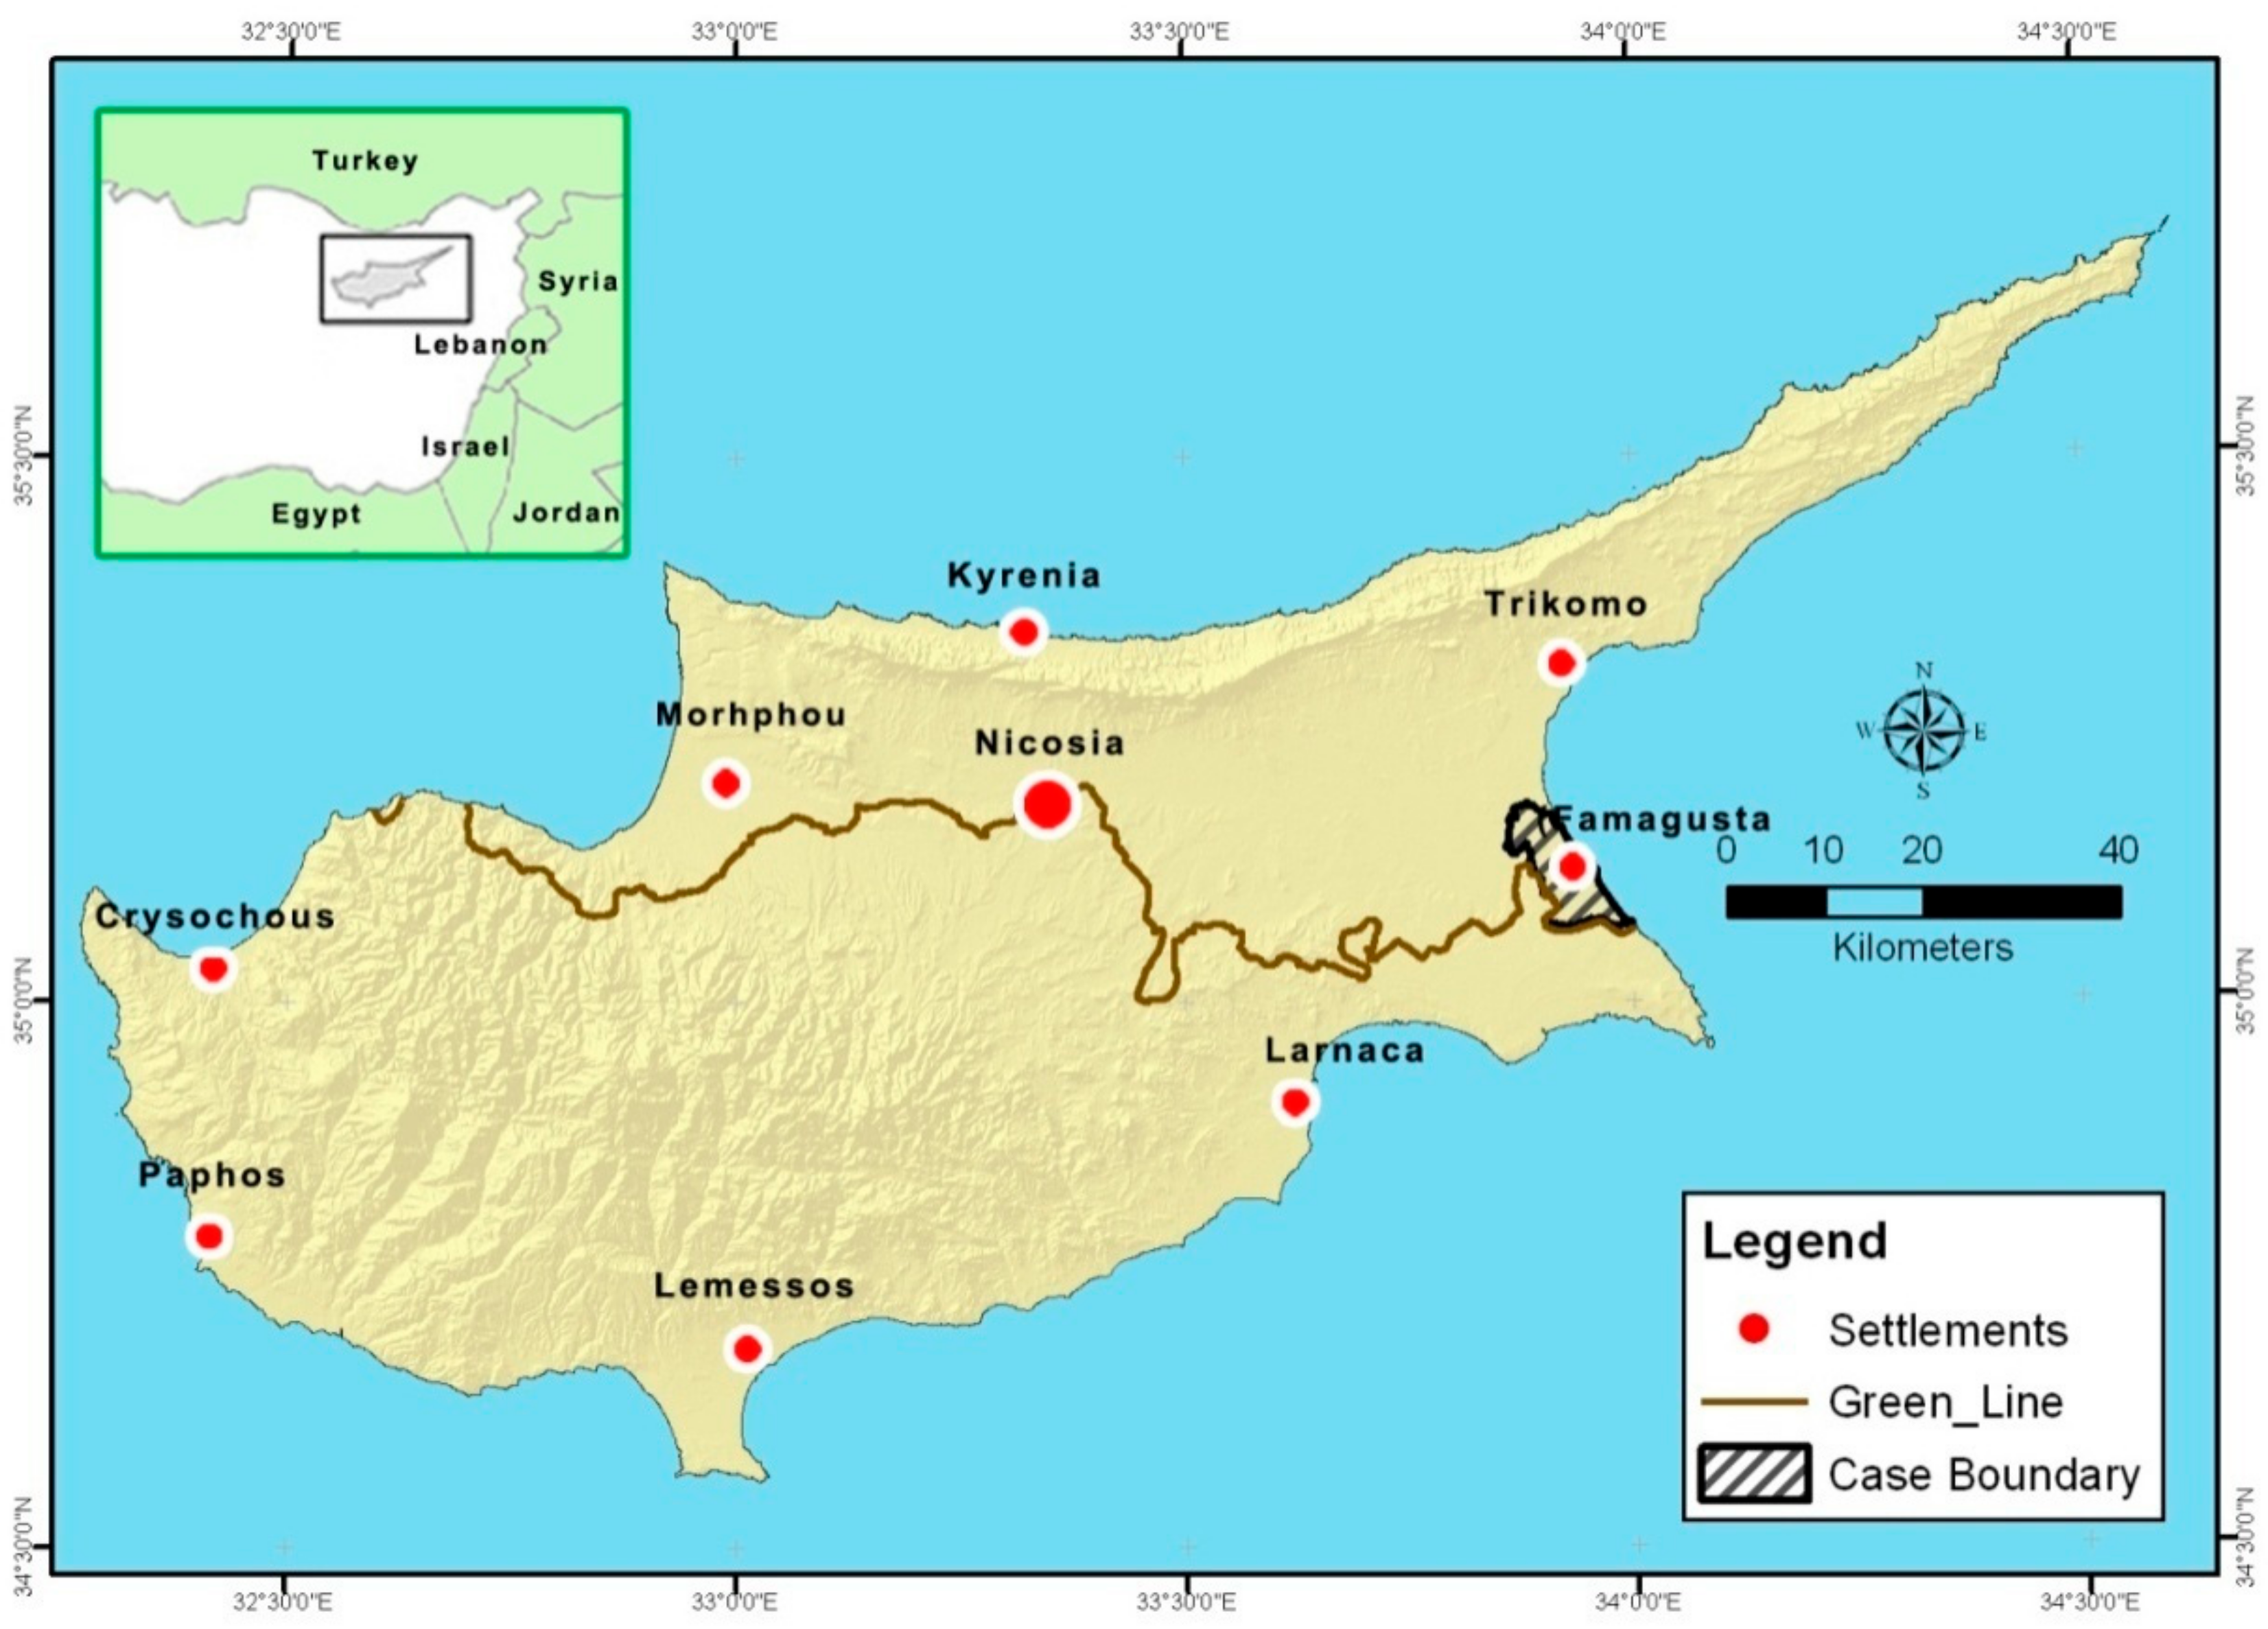
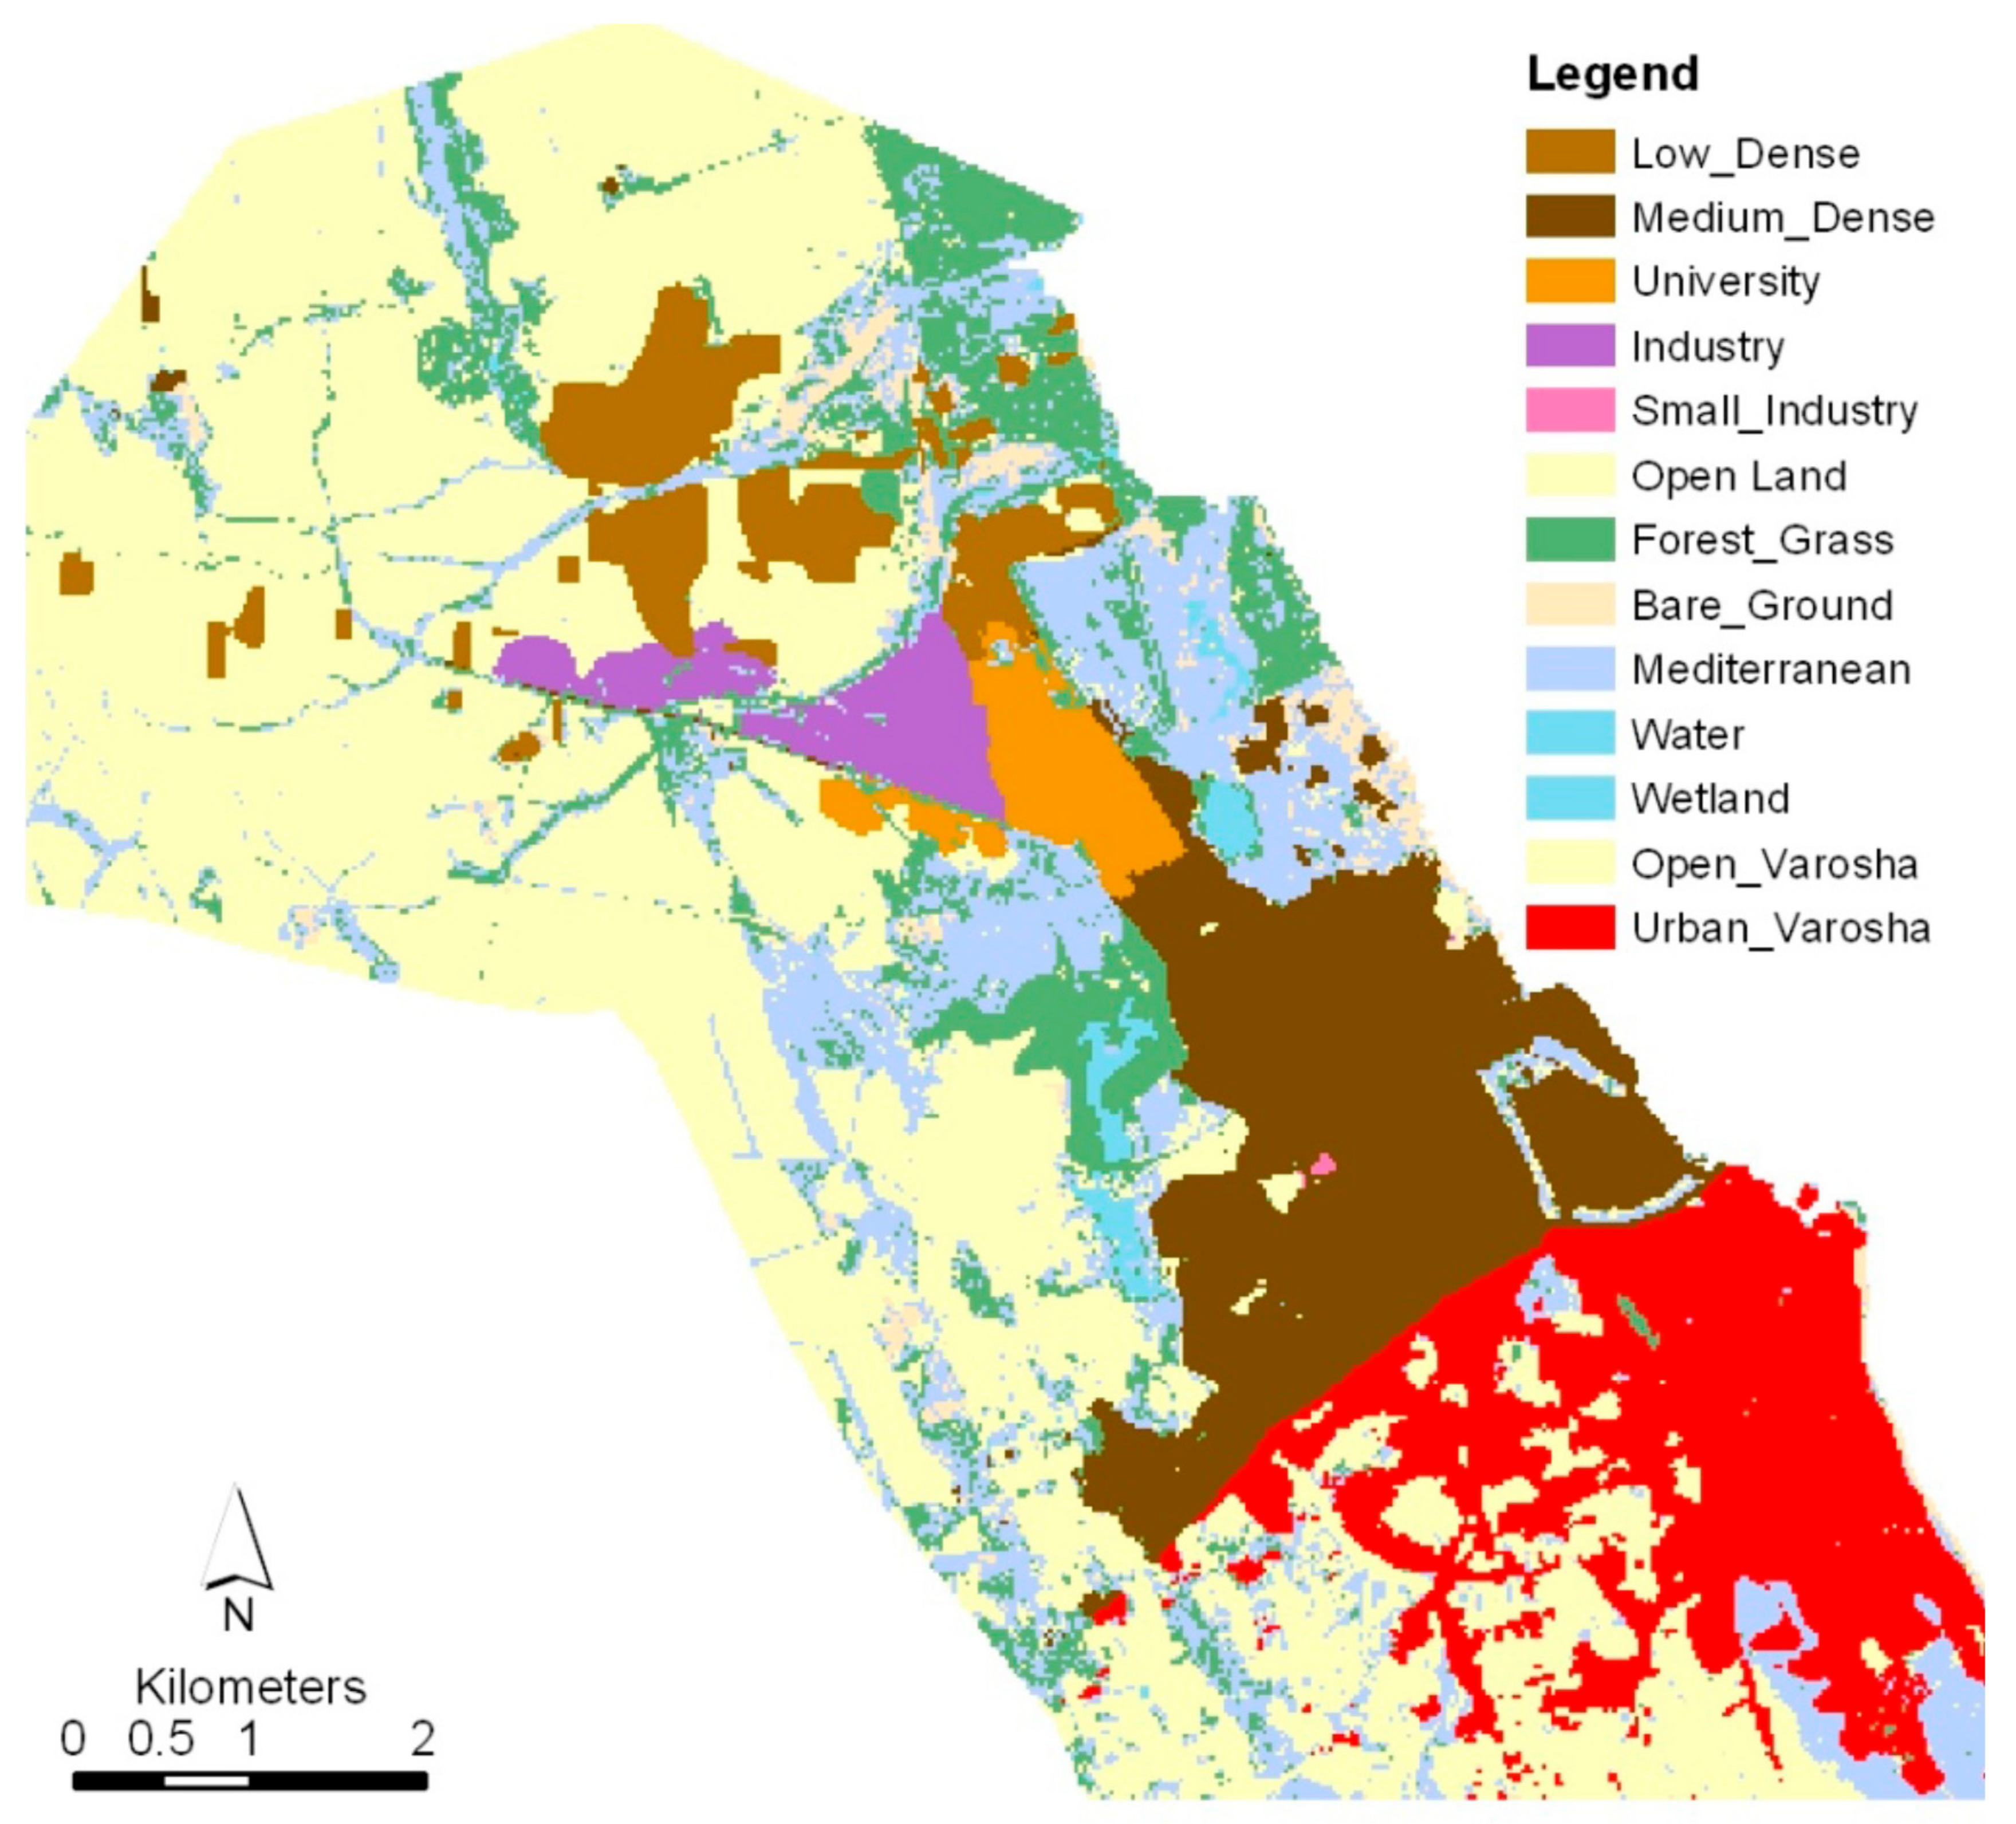
3. Famagusta City
4. Model and Materials
4.1. Prediction of Urban Growth under the Do-Nothing Scenario
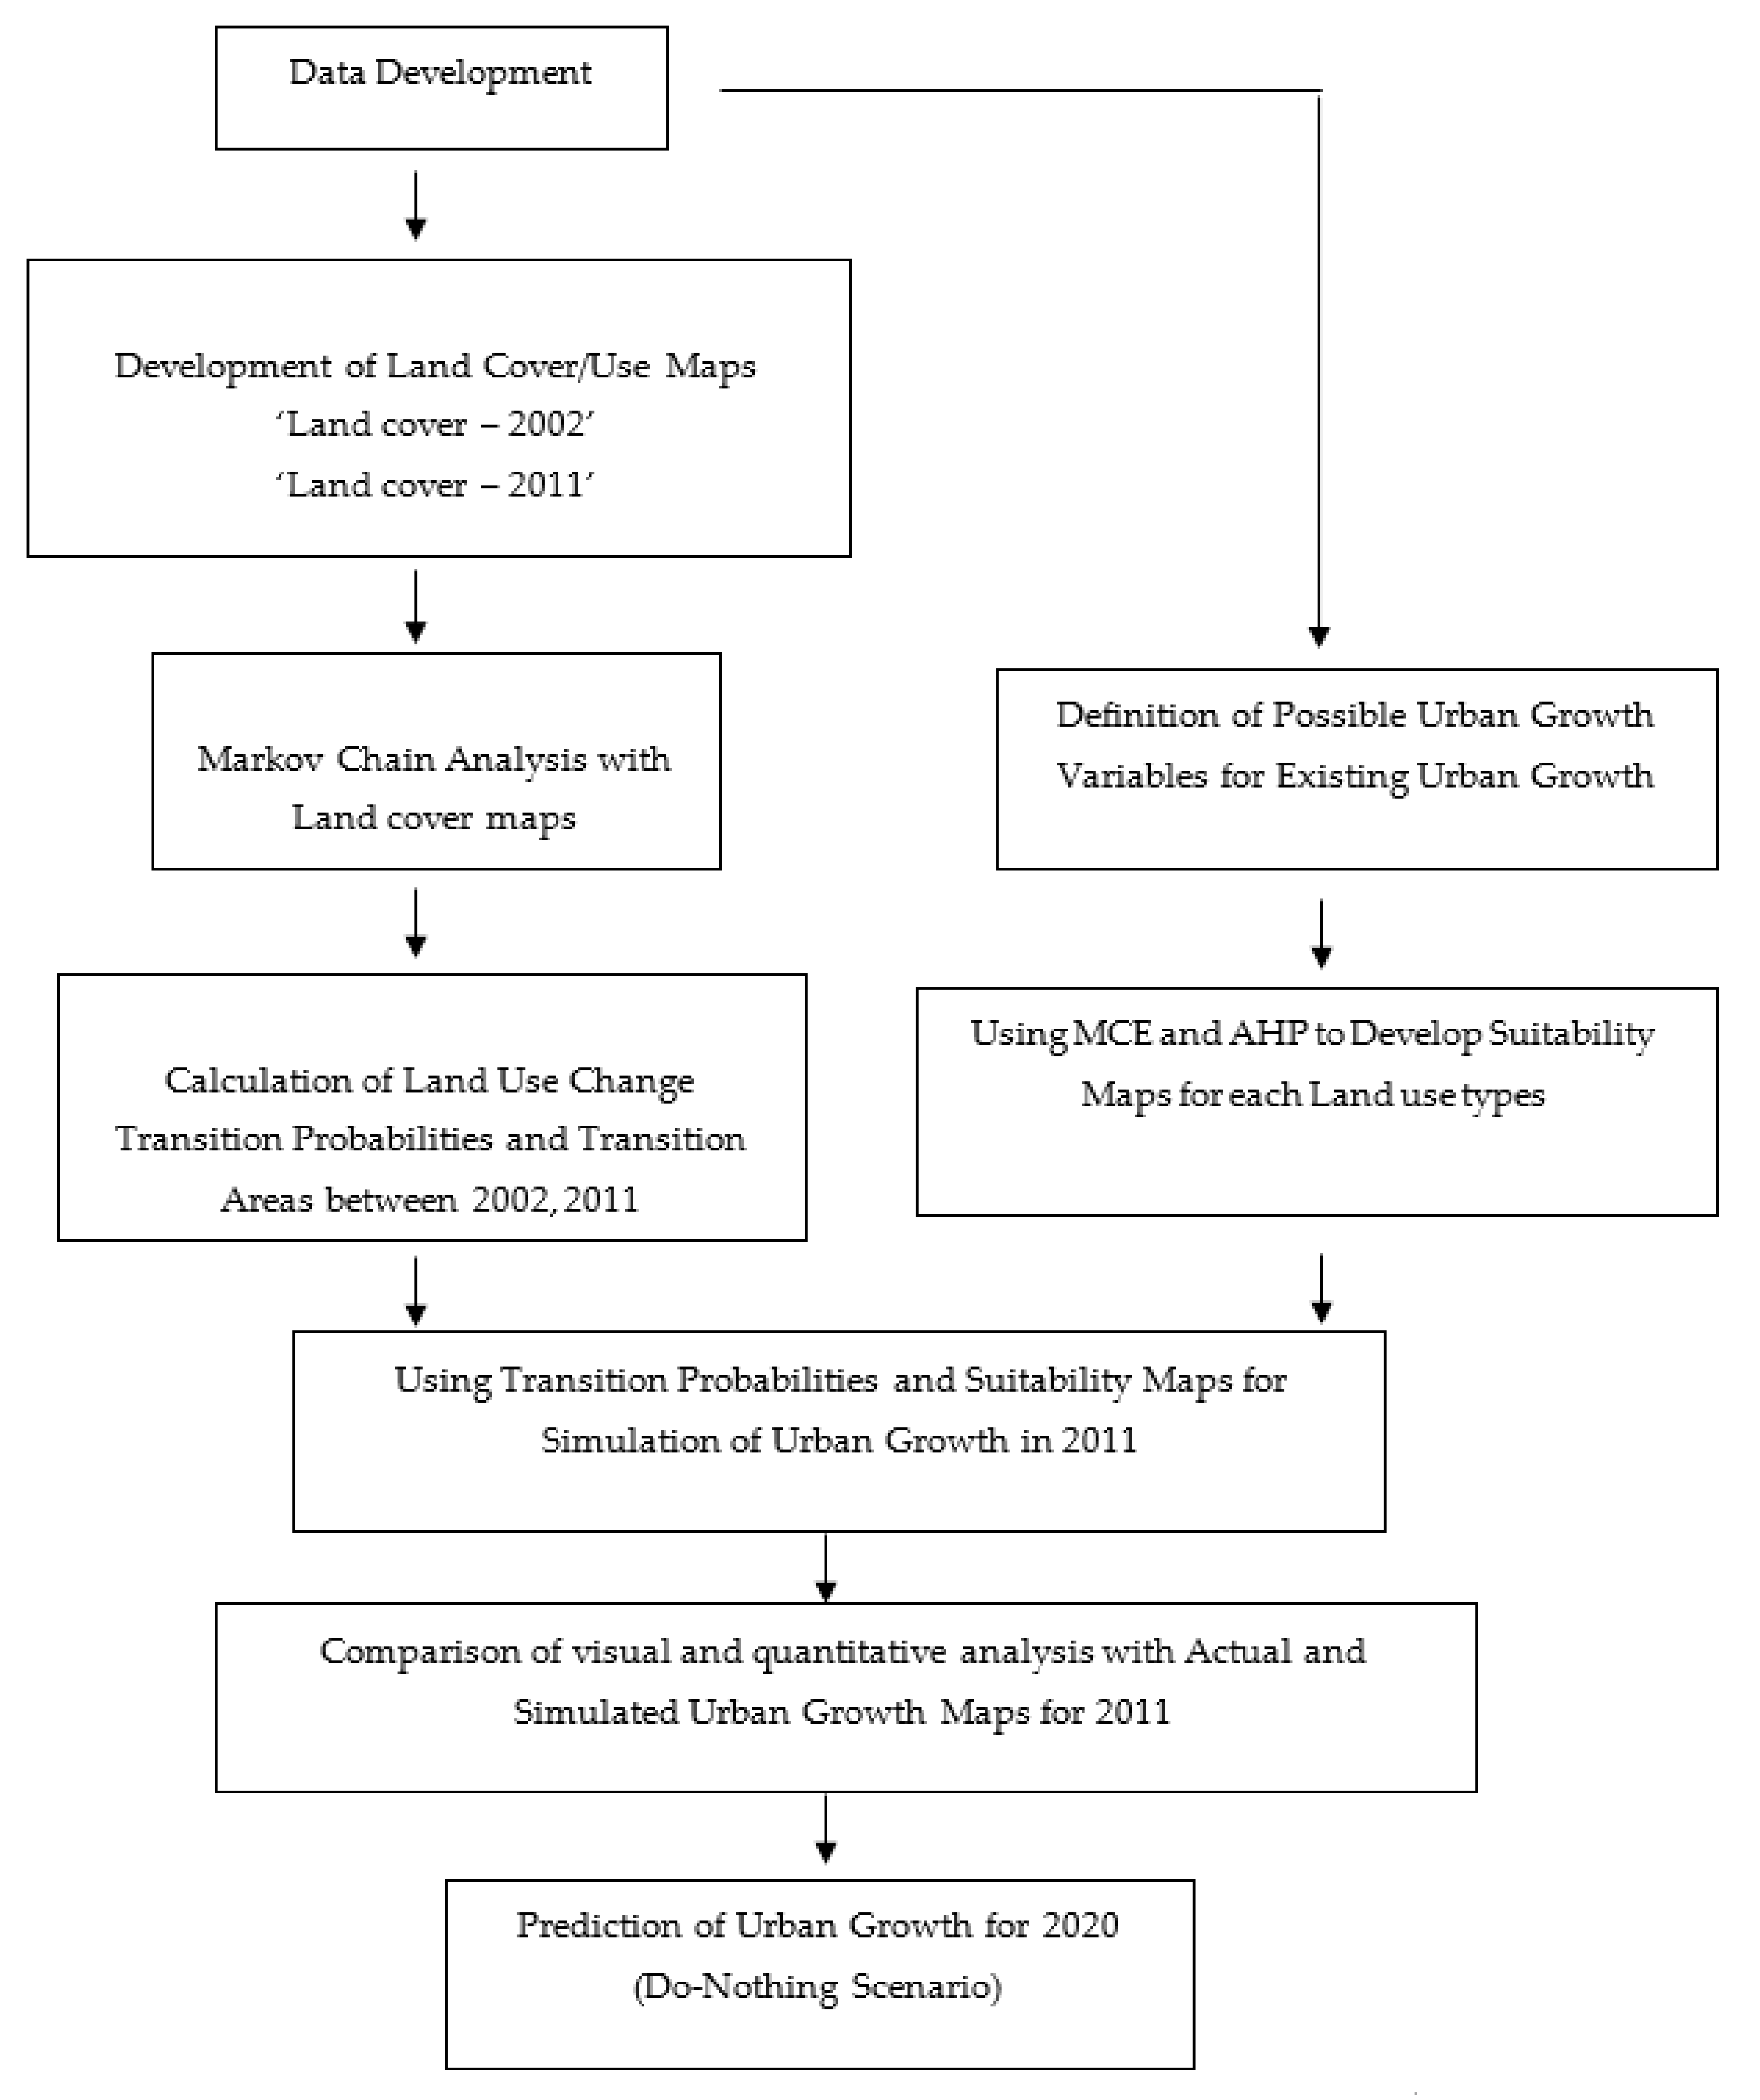
4.1.1. Data Development Process
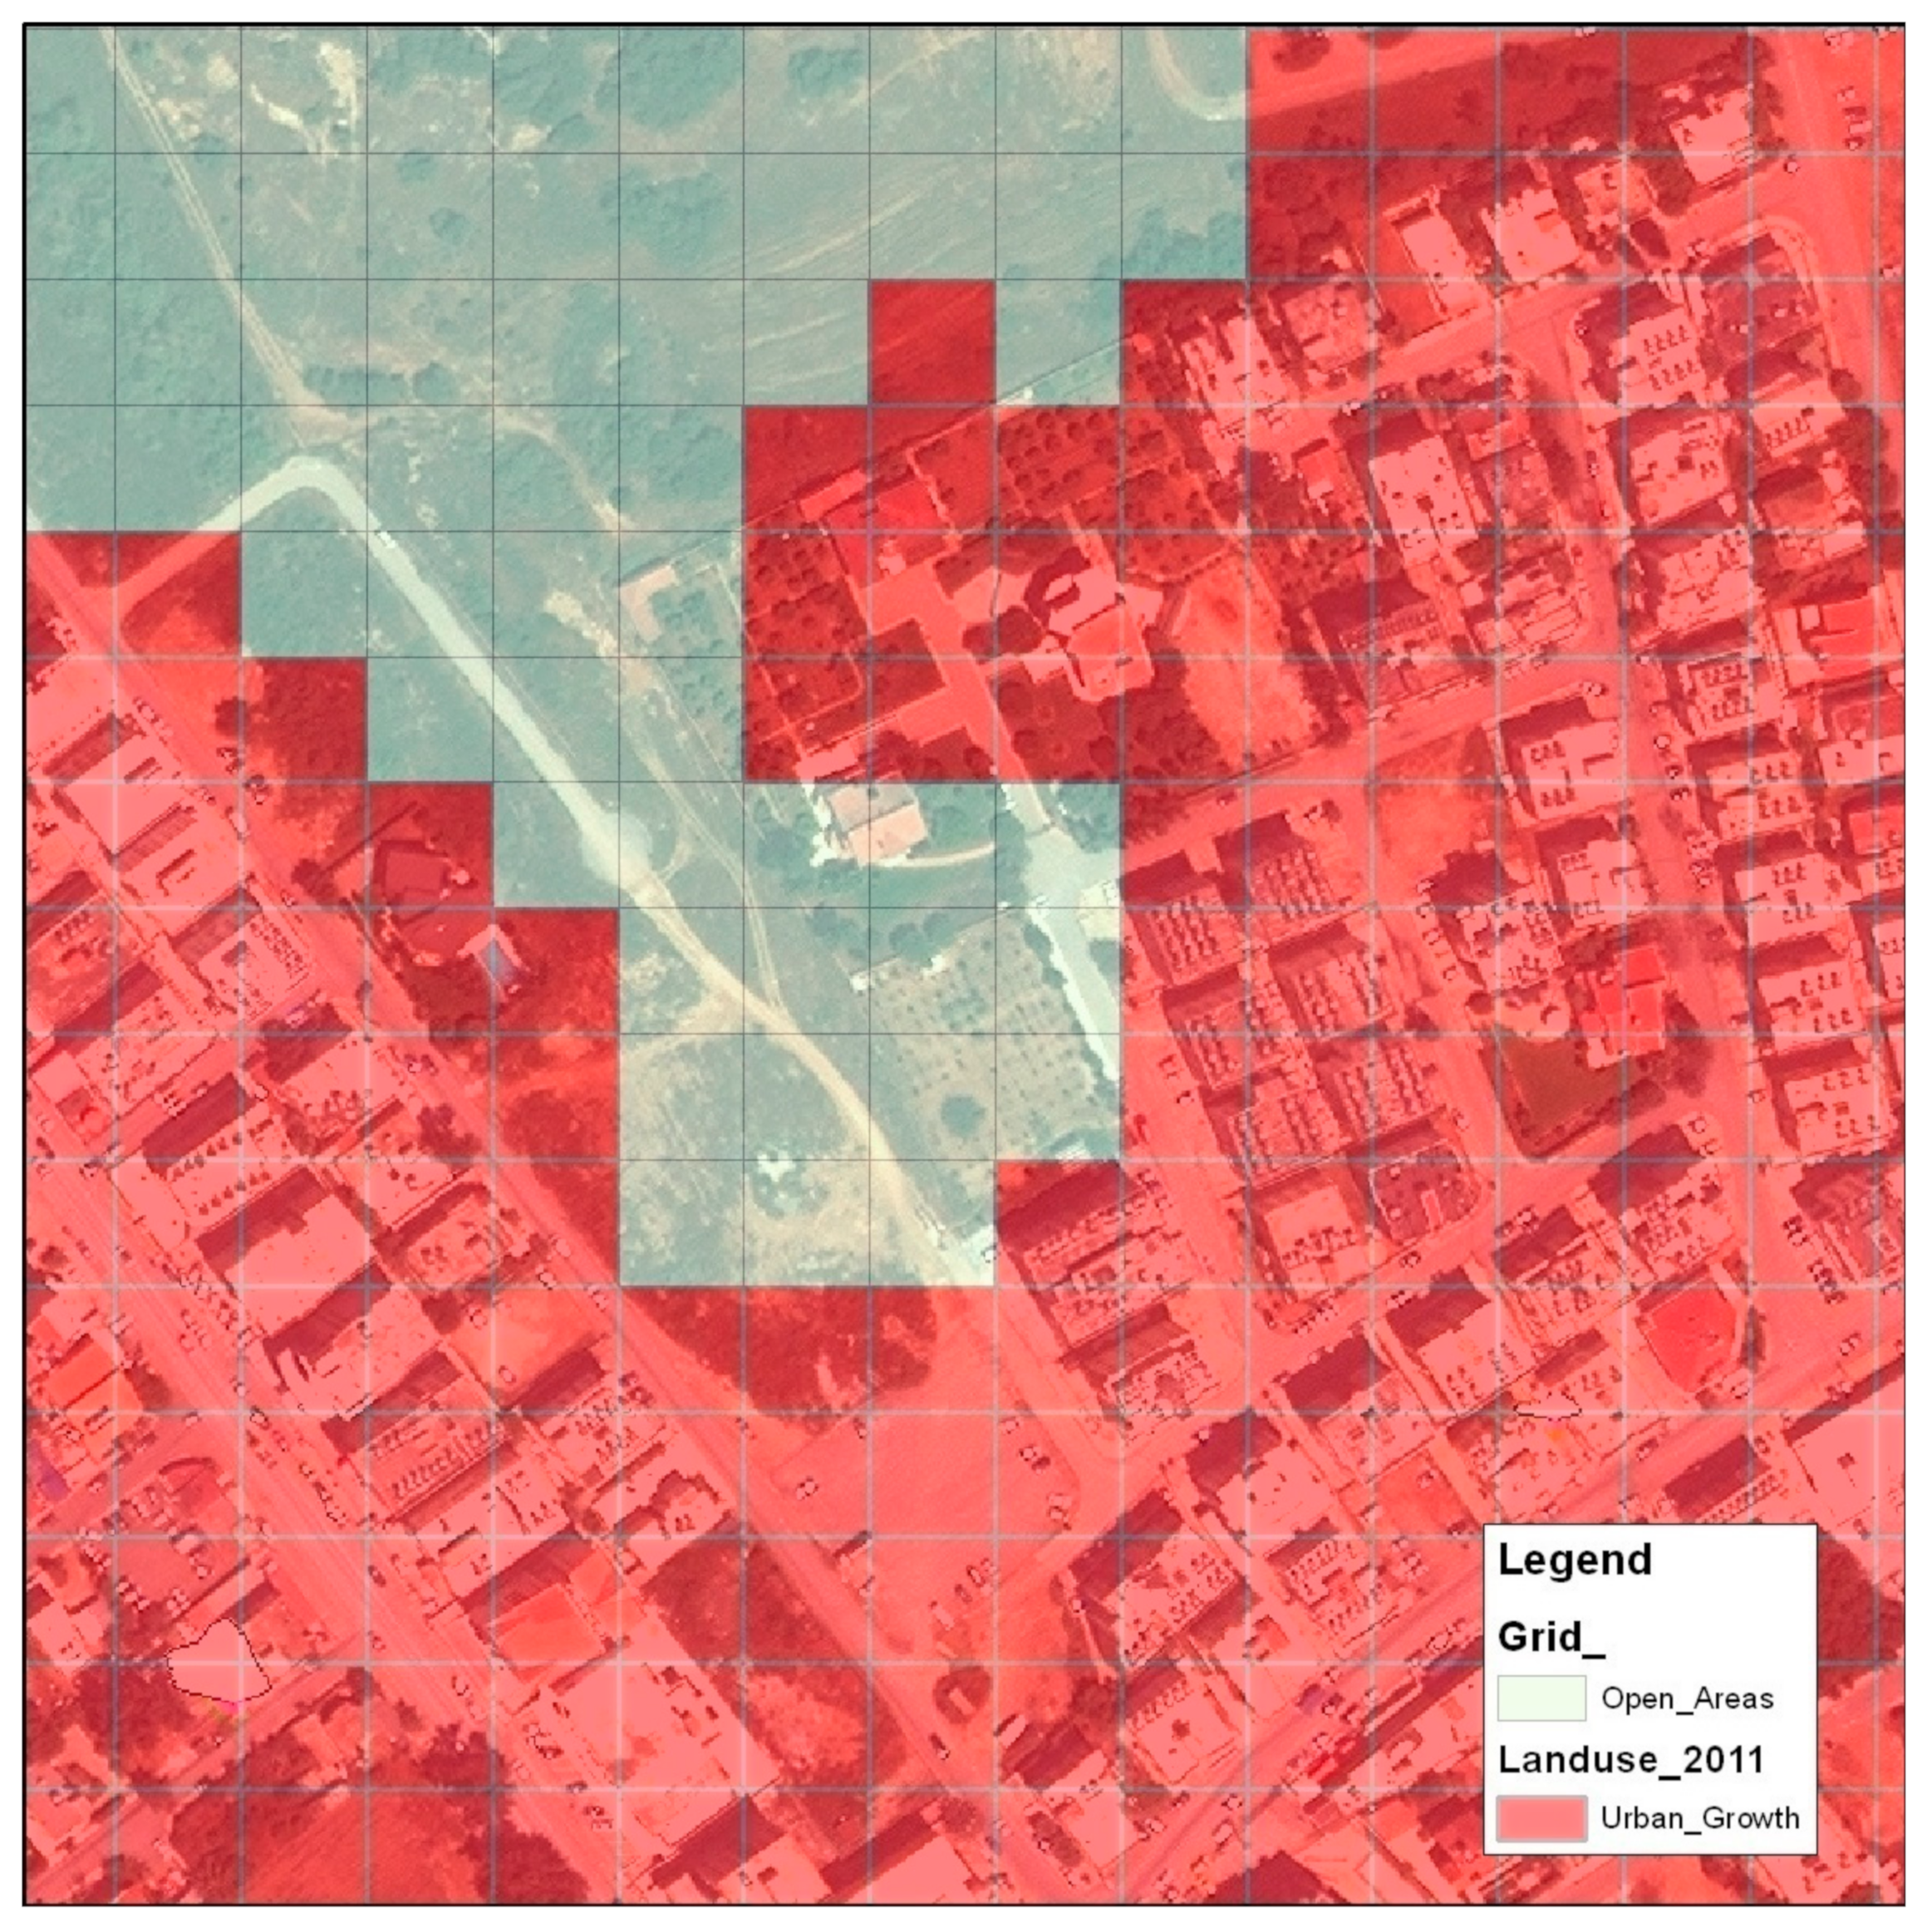
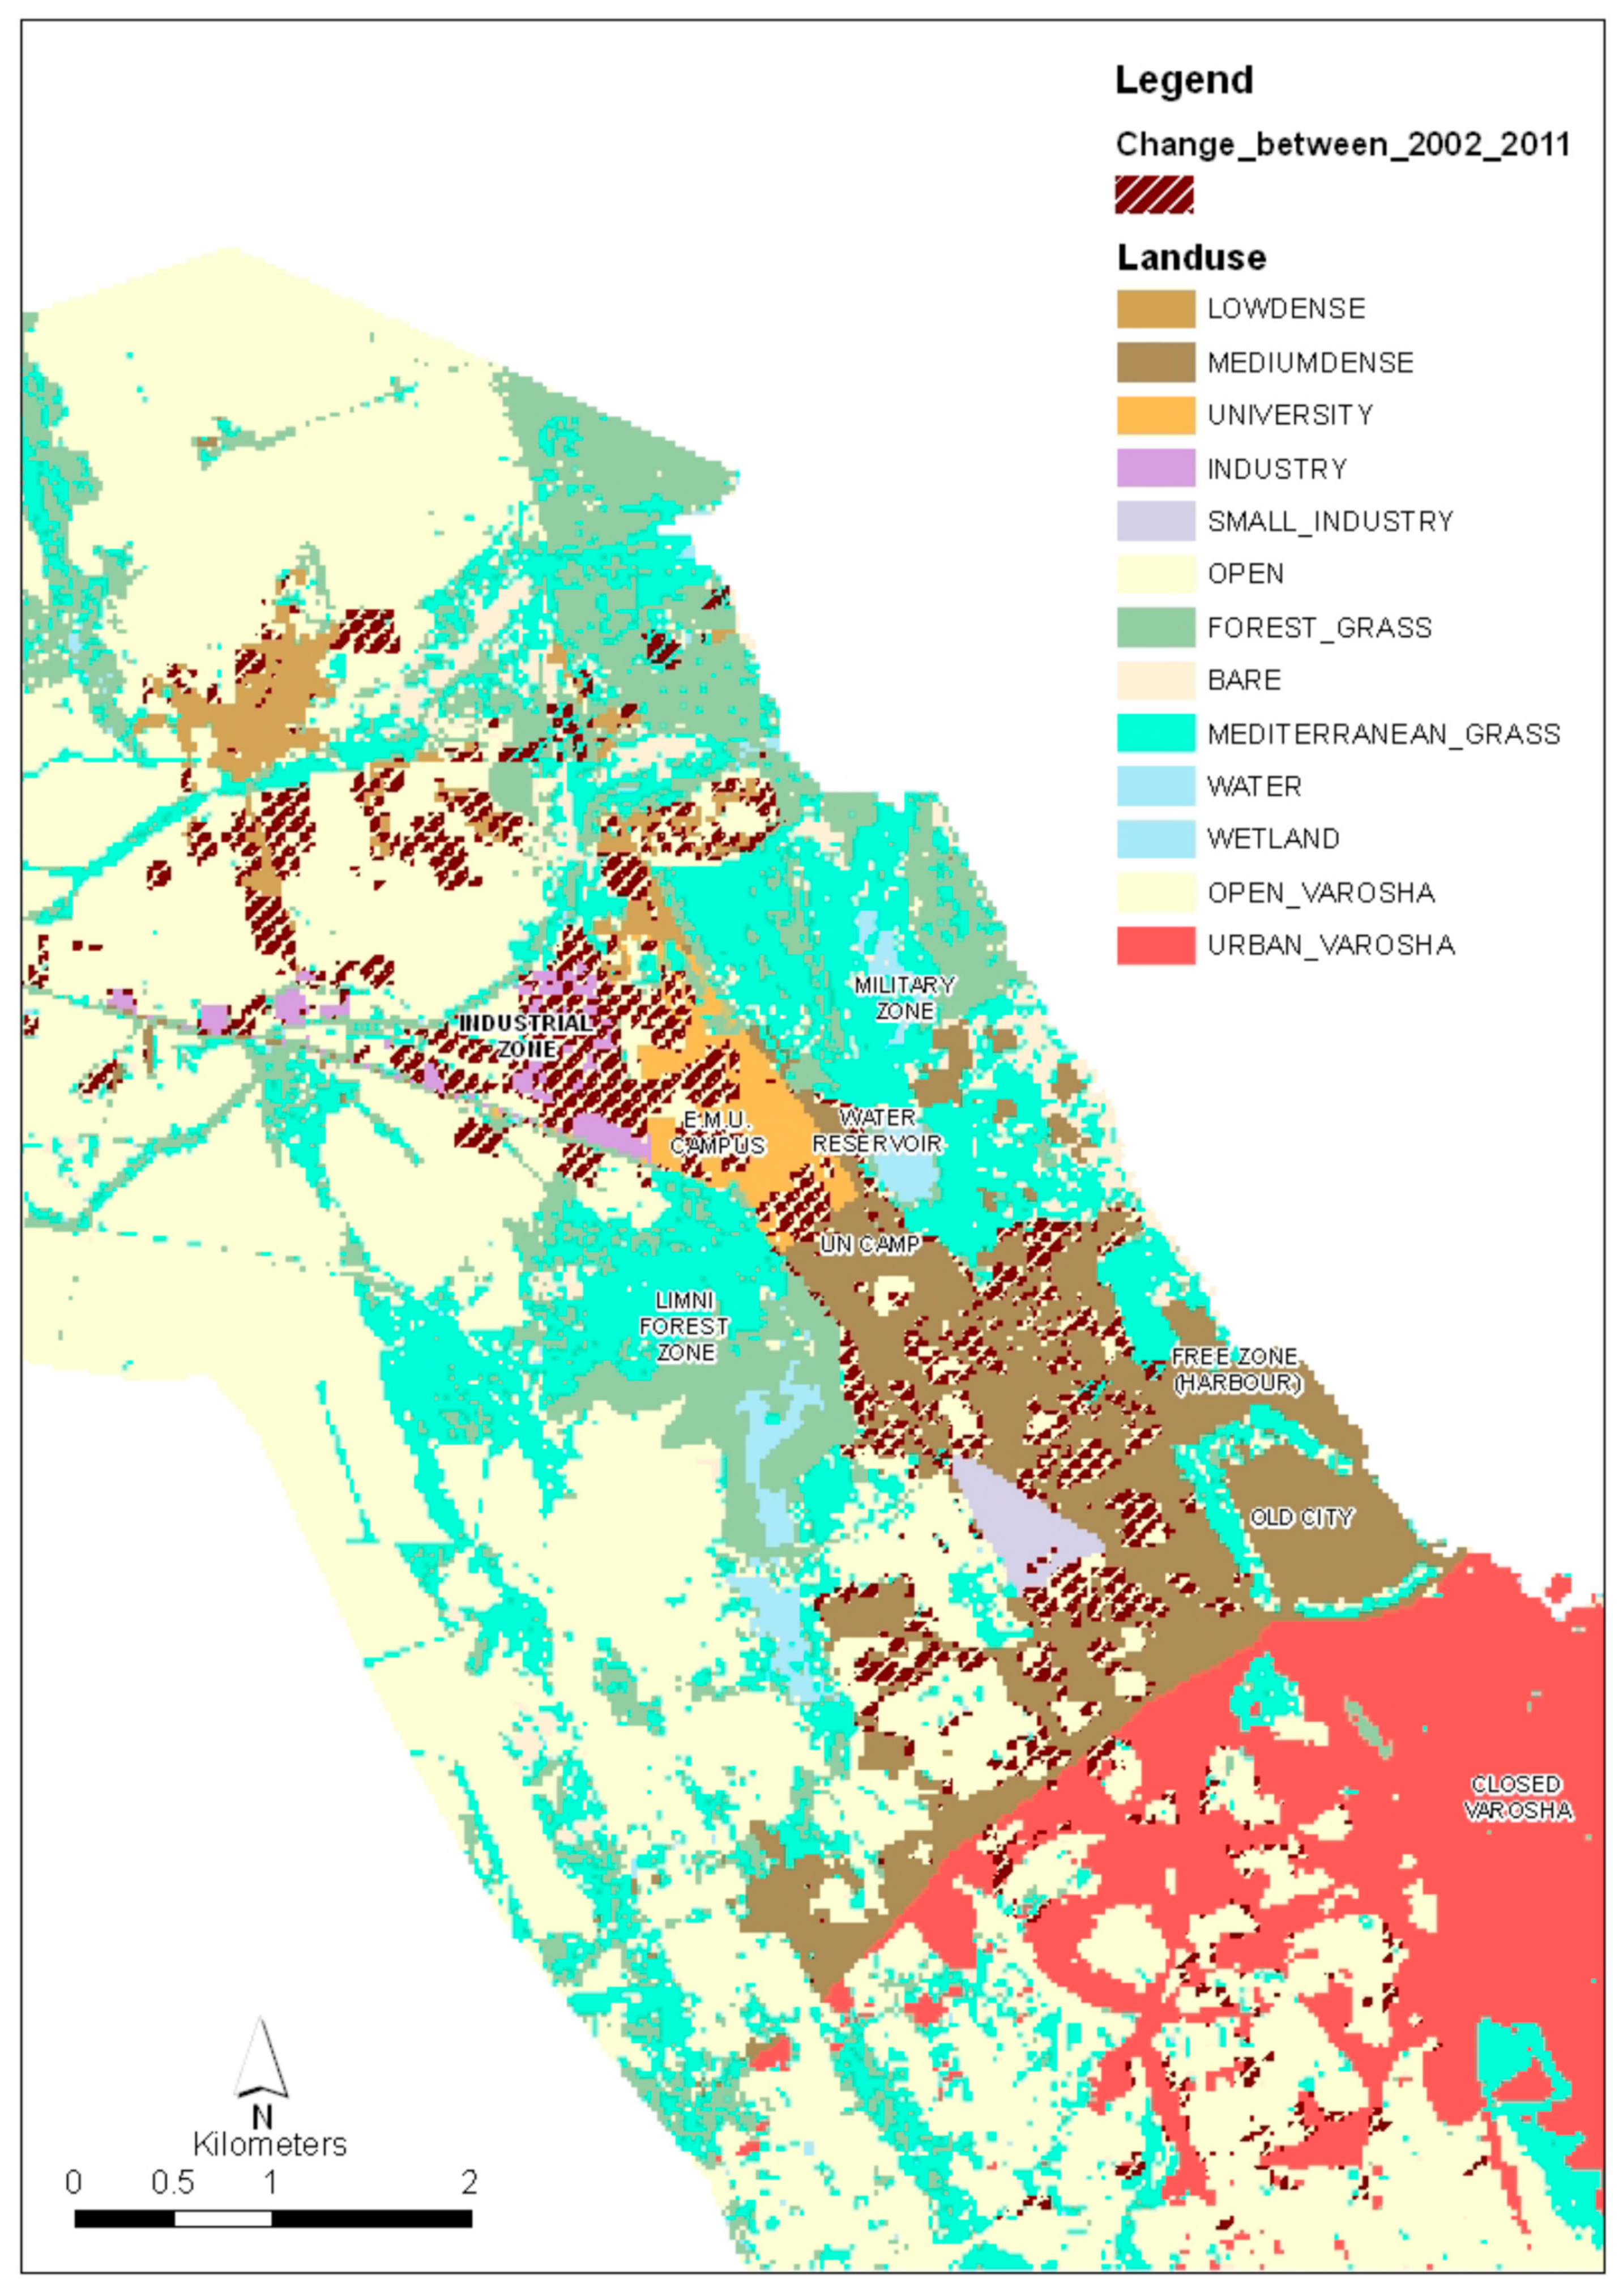
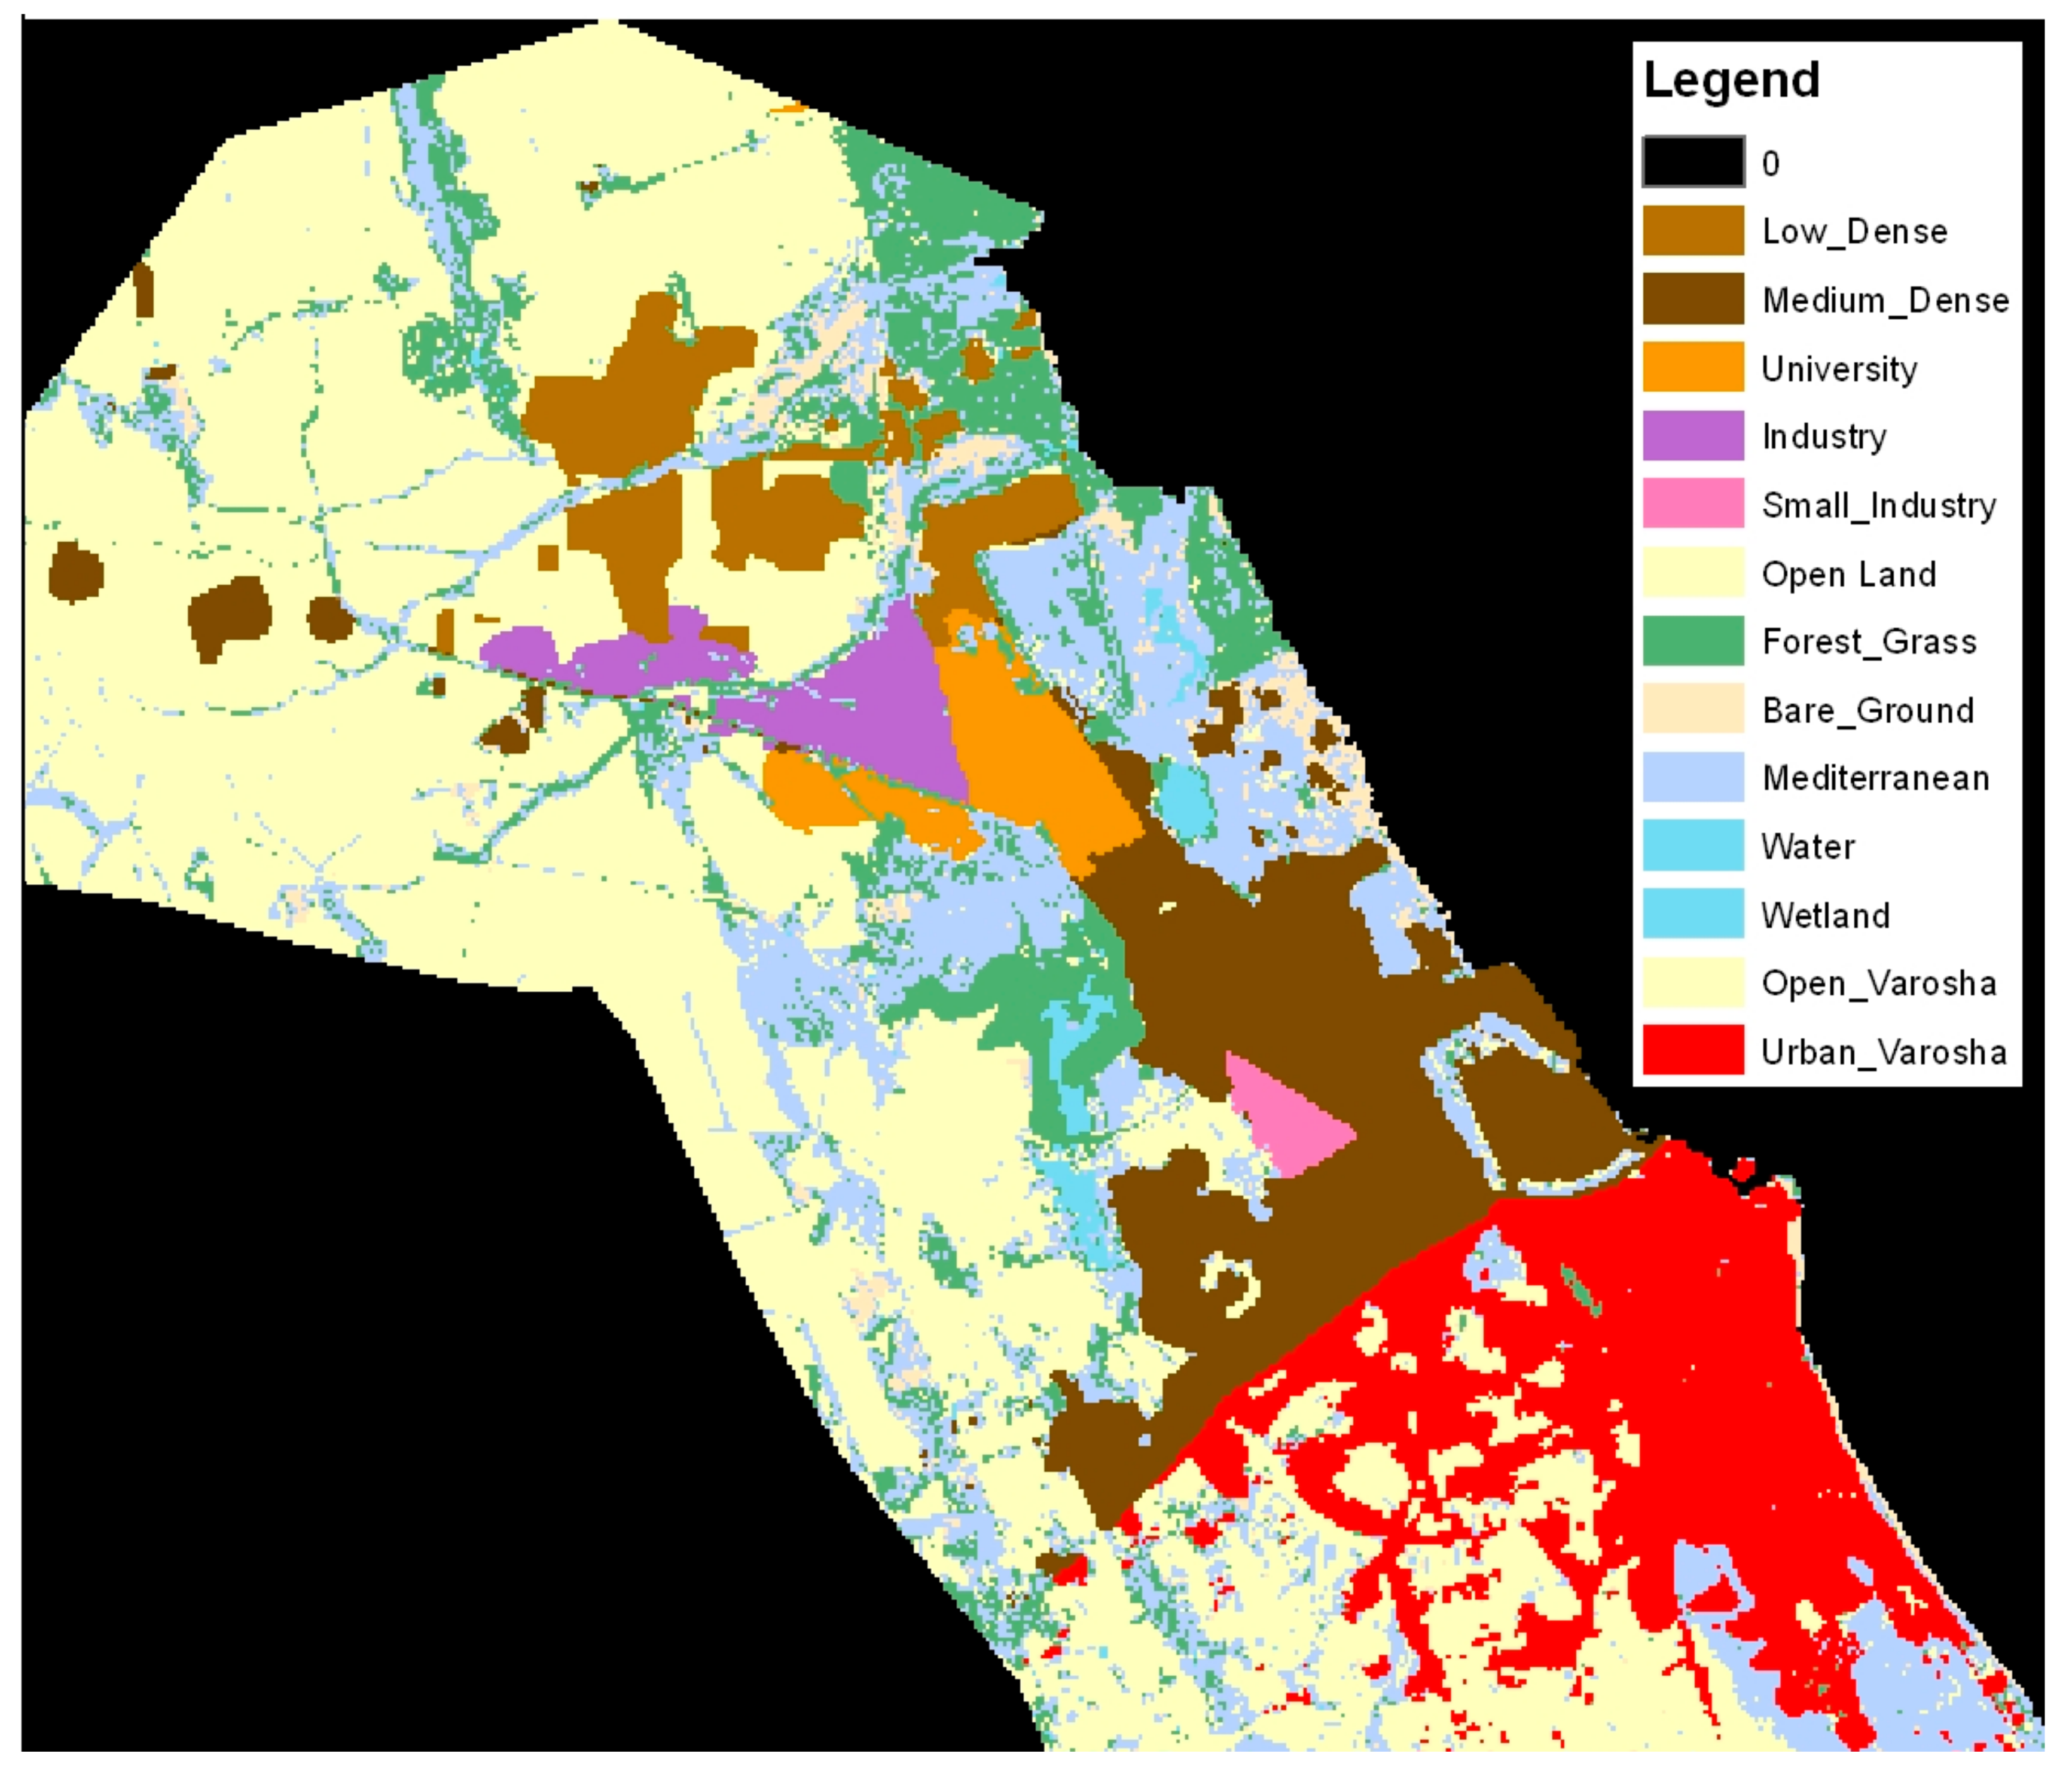
4.1.2. Analyzing Land Use Changes with Temporal Images
4.1.3. Markov Chain Analysis with Land Use Maps
- n = number of time steps;
- m = number of states;
- = vector of initial states at an initial time, t;
- = vector of states at the next time, t + 1;P = transition probabilities matrix.
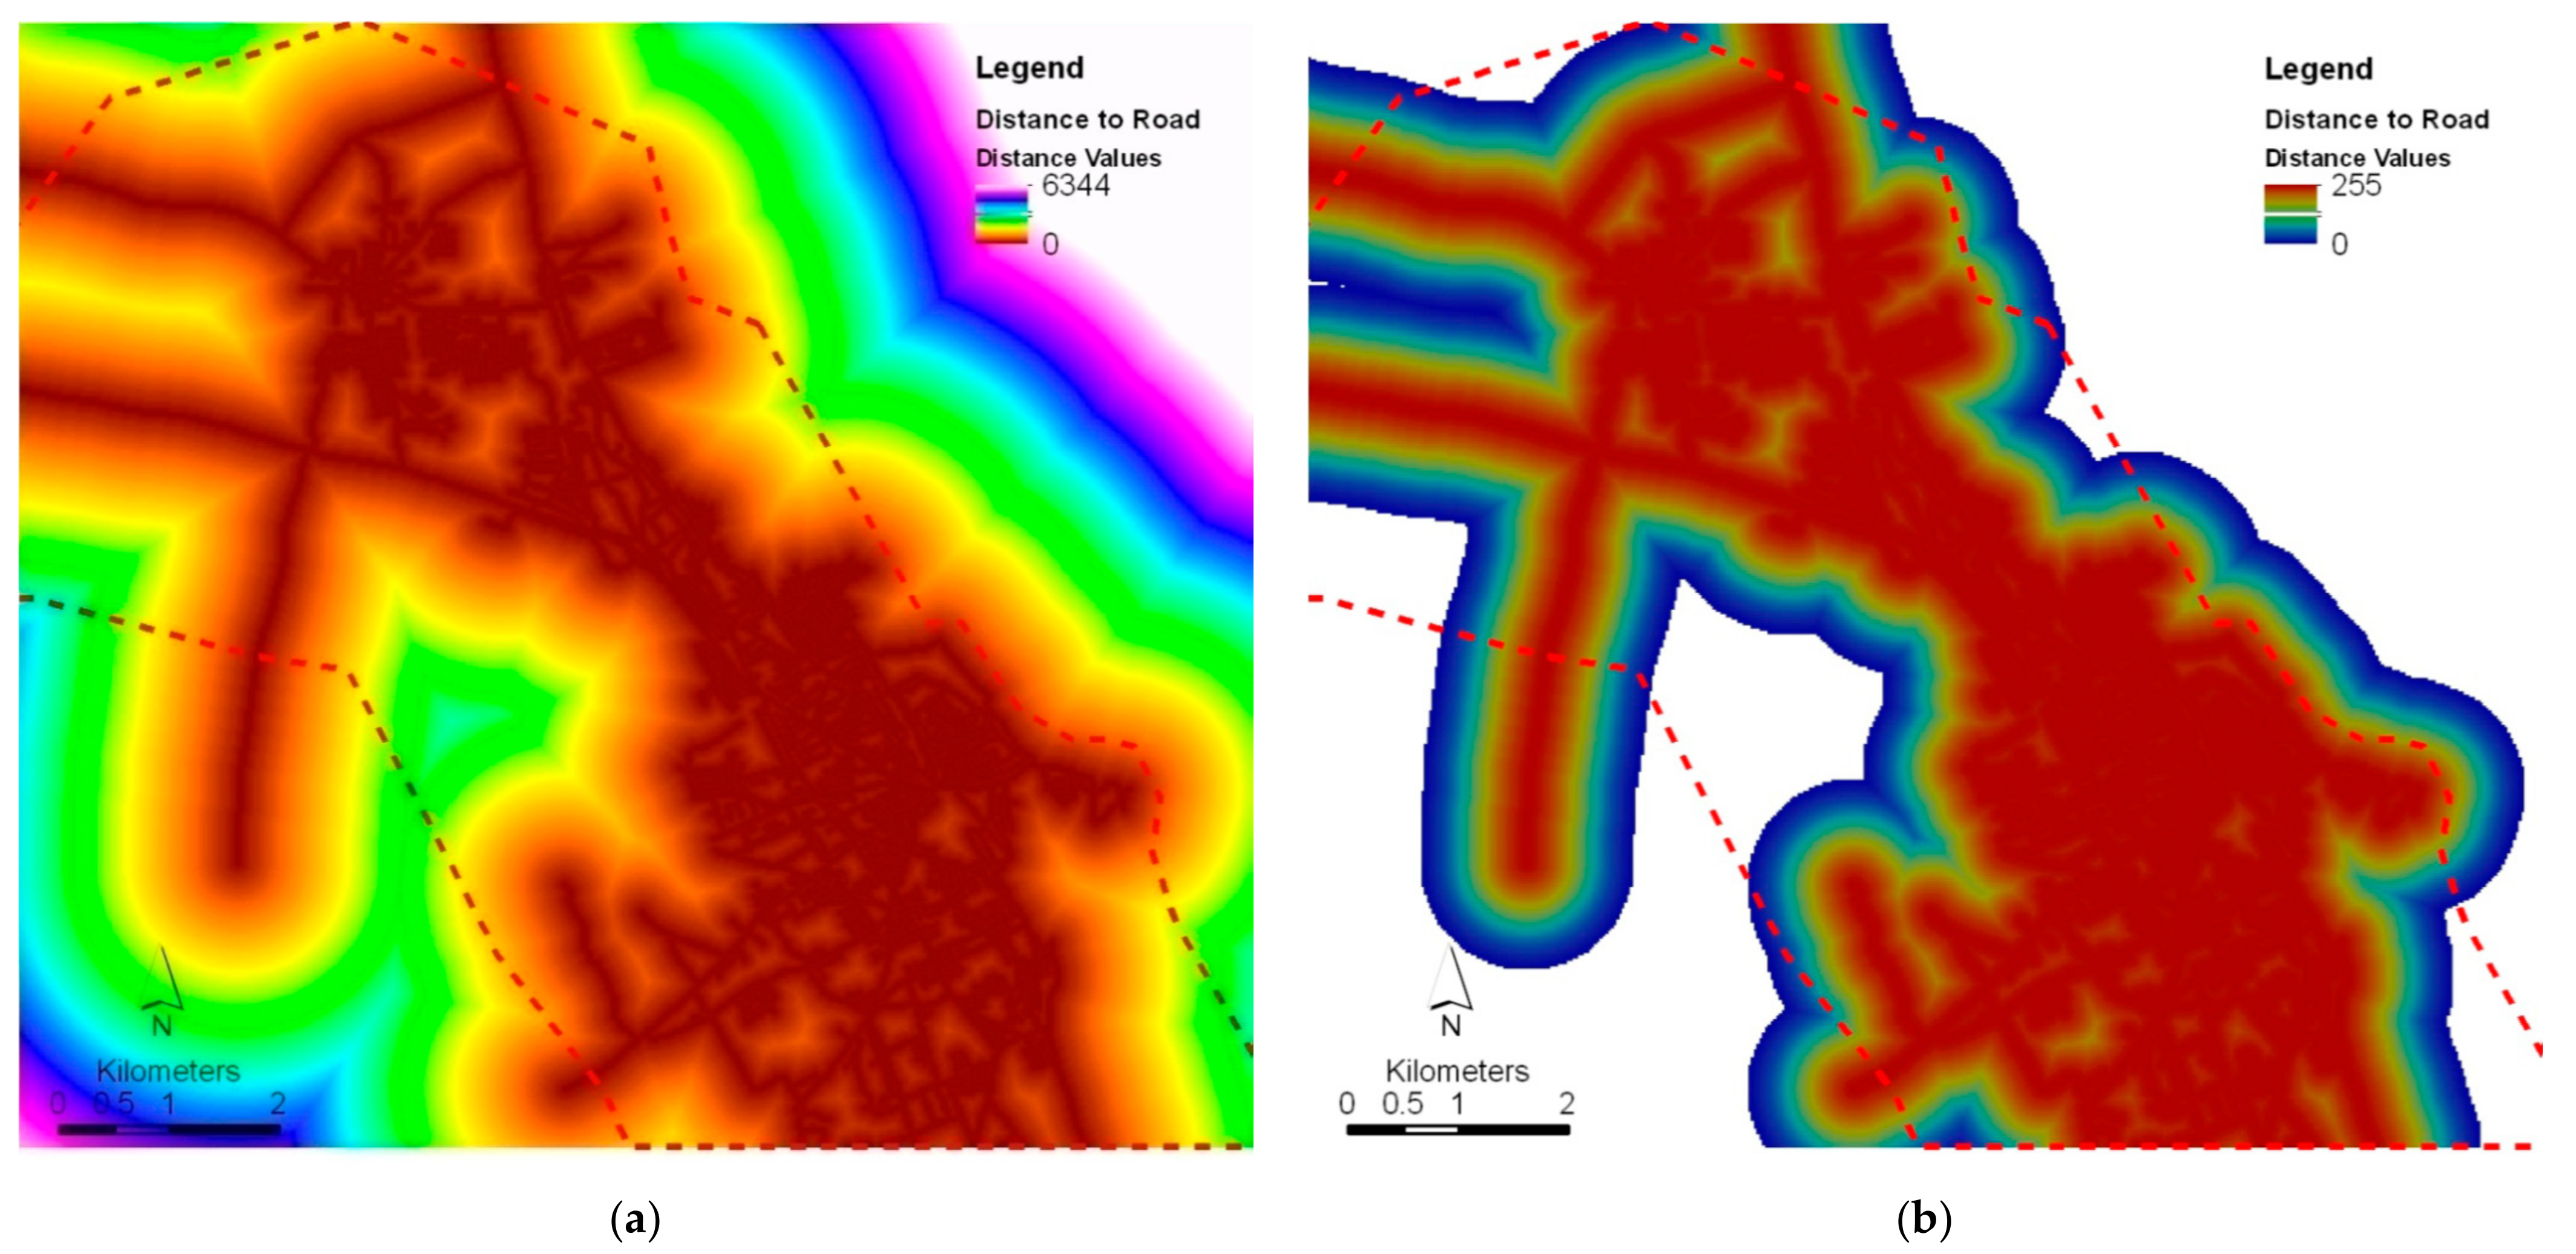
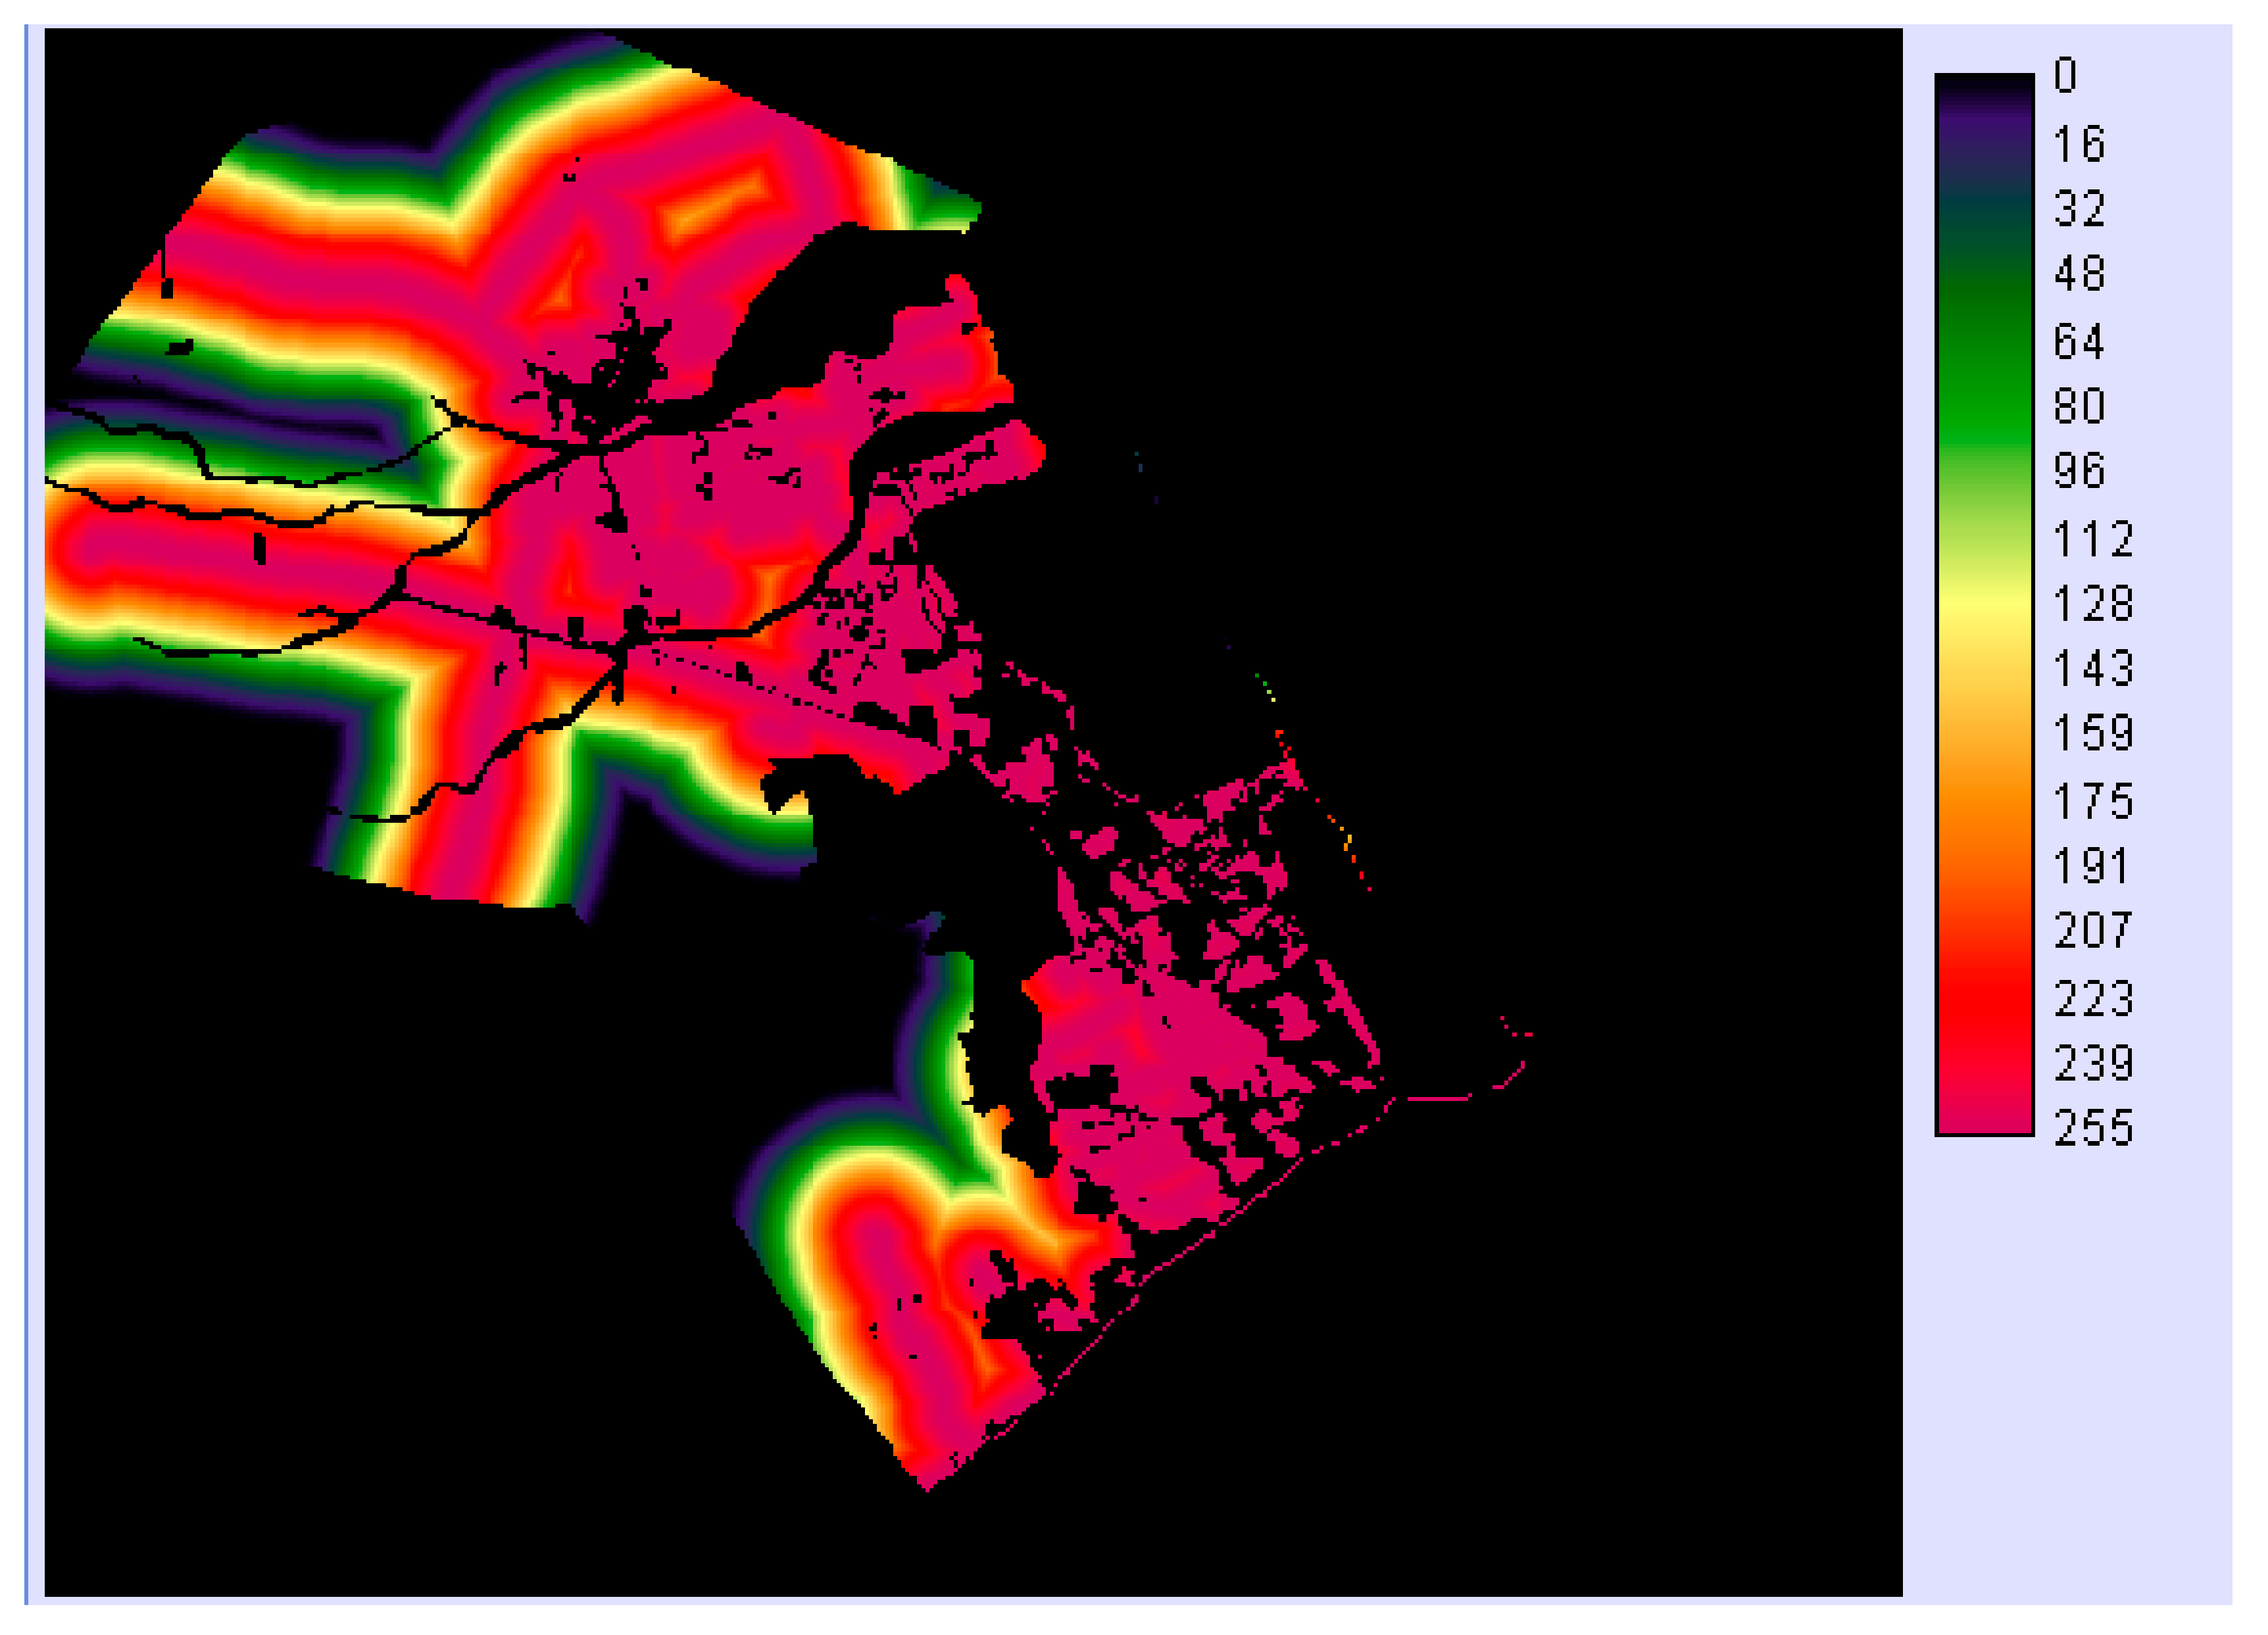
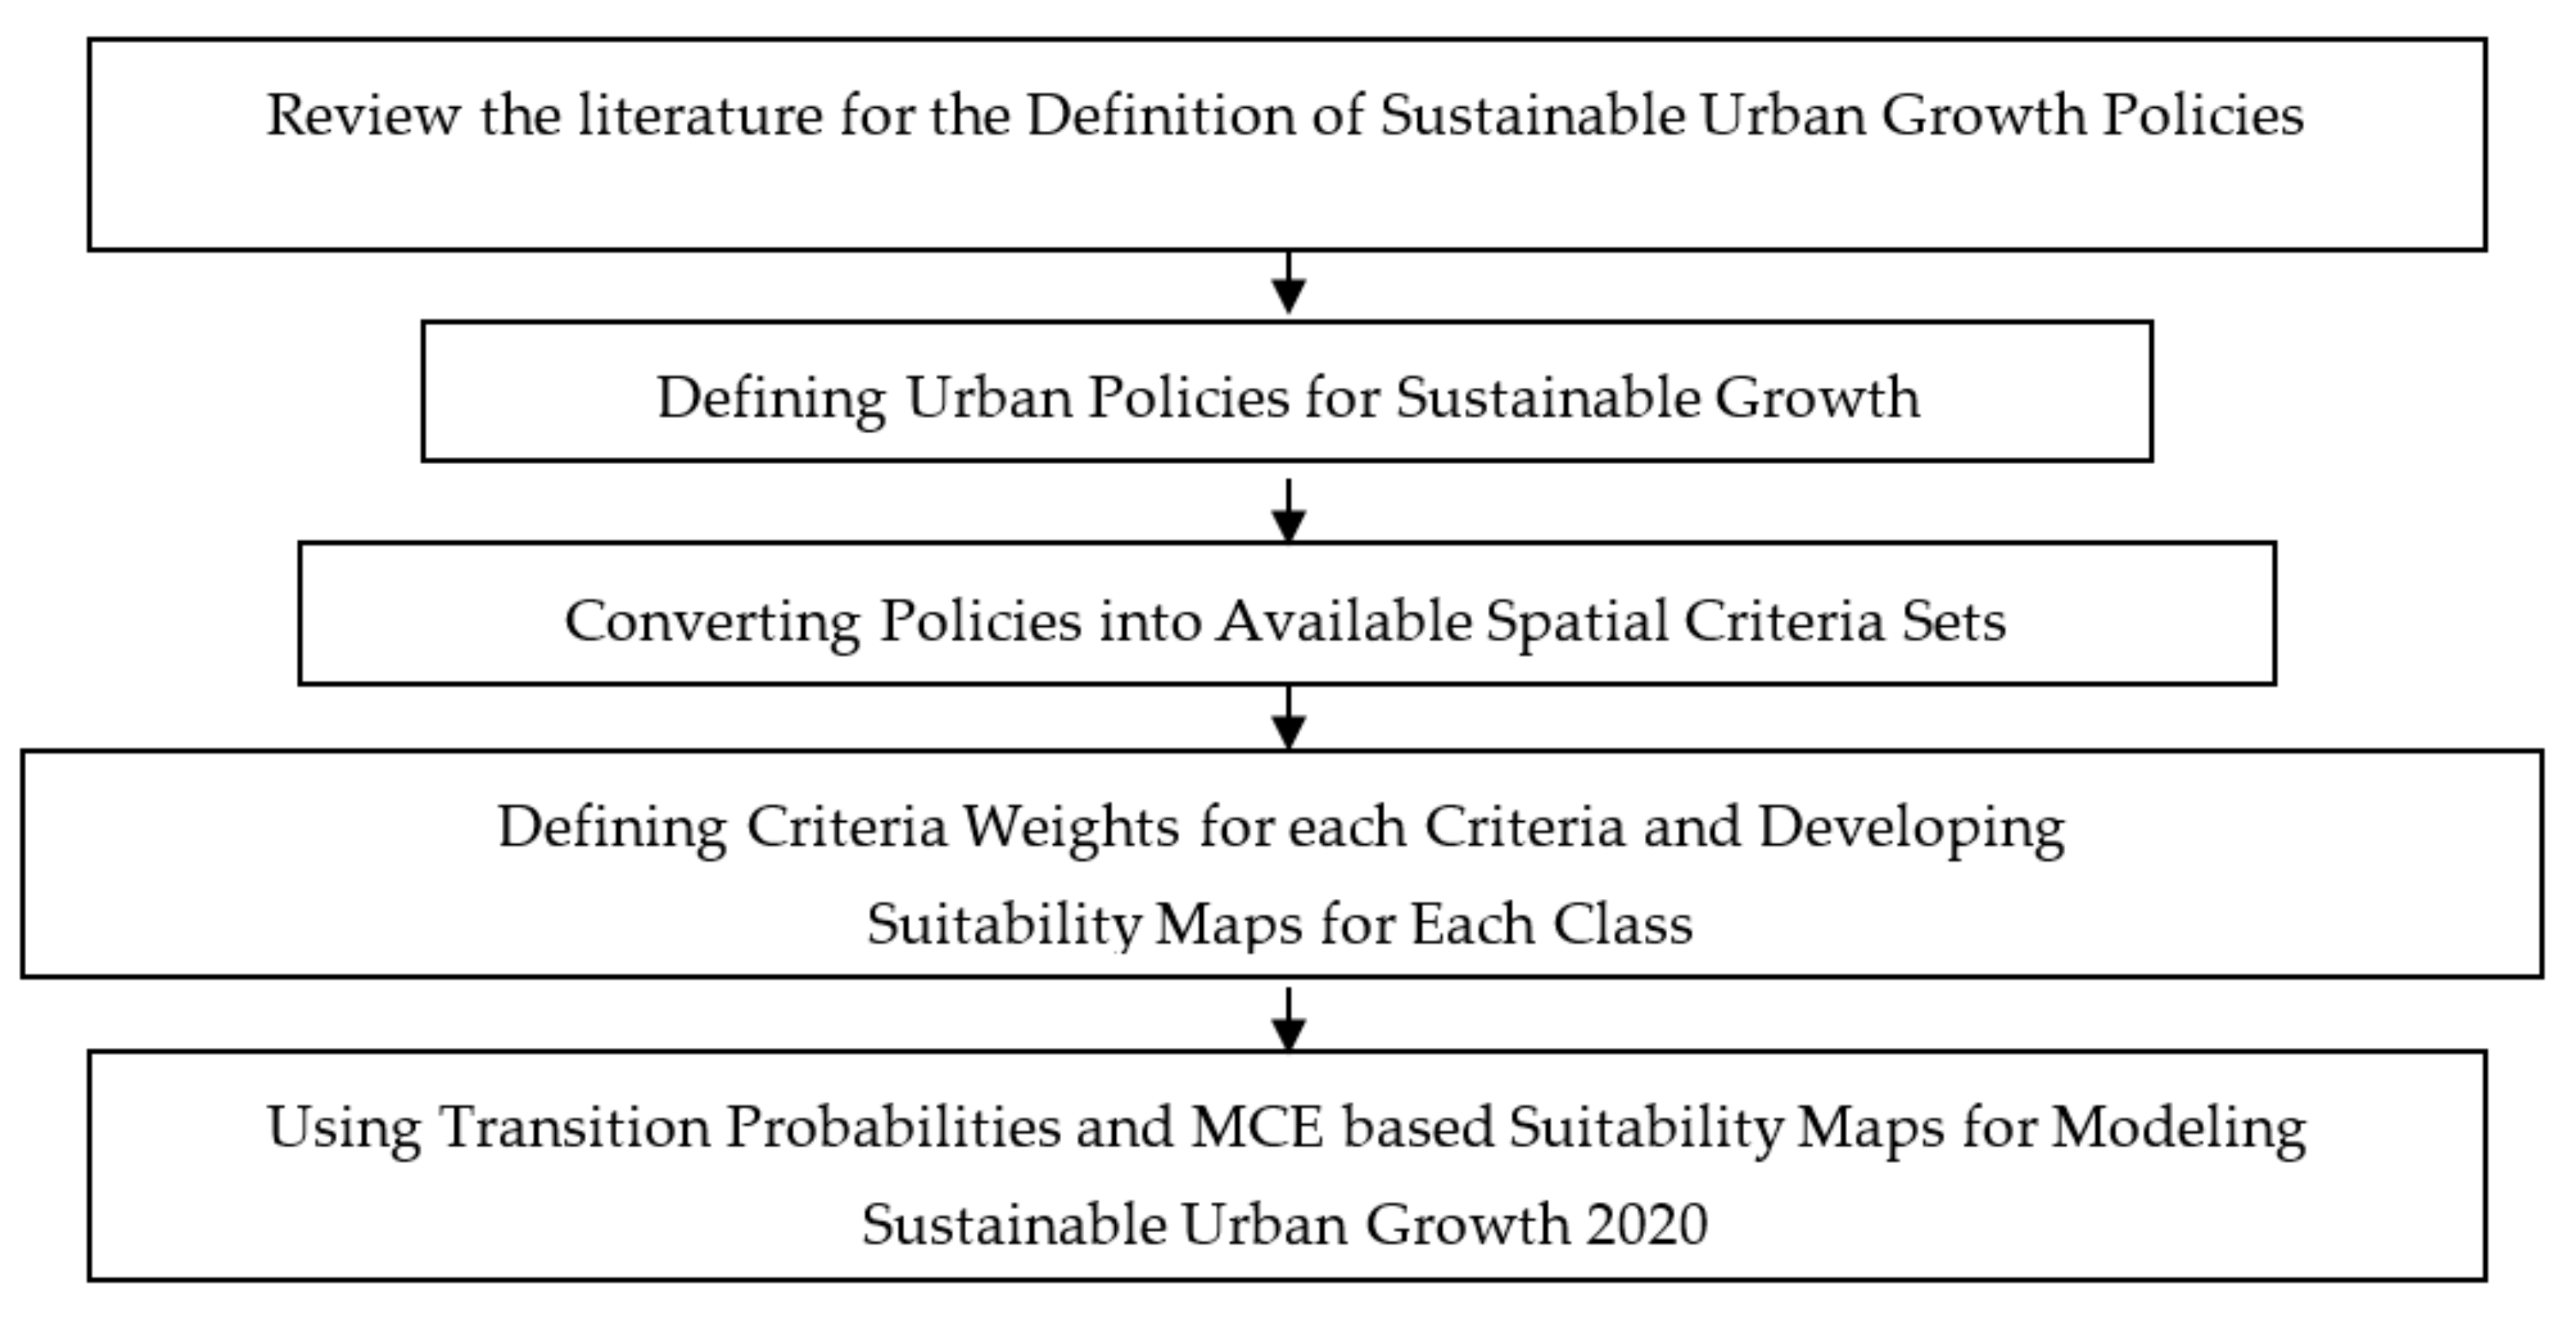
4.1.4. Using MCE and AHP to Develop Suitability Maps
- Wj = Relative importance weight of criteria j;
- Xji = the standardizing value of area i under criterion j;
- n = is the number of criteria.
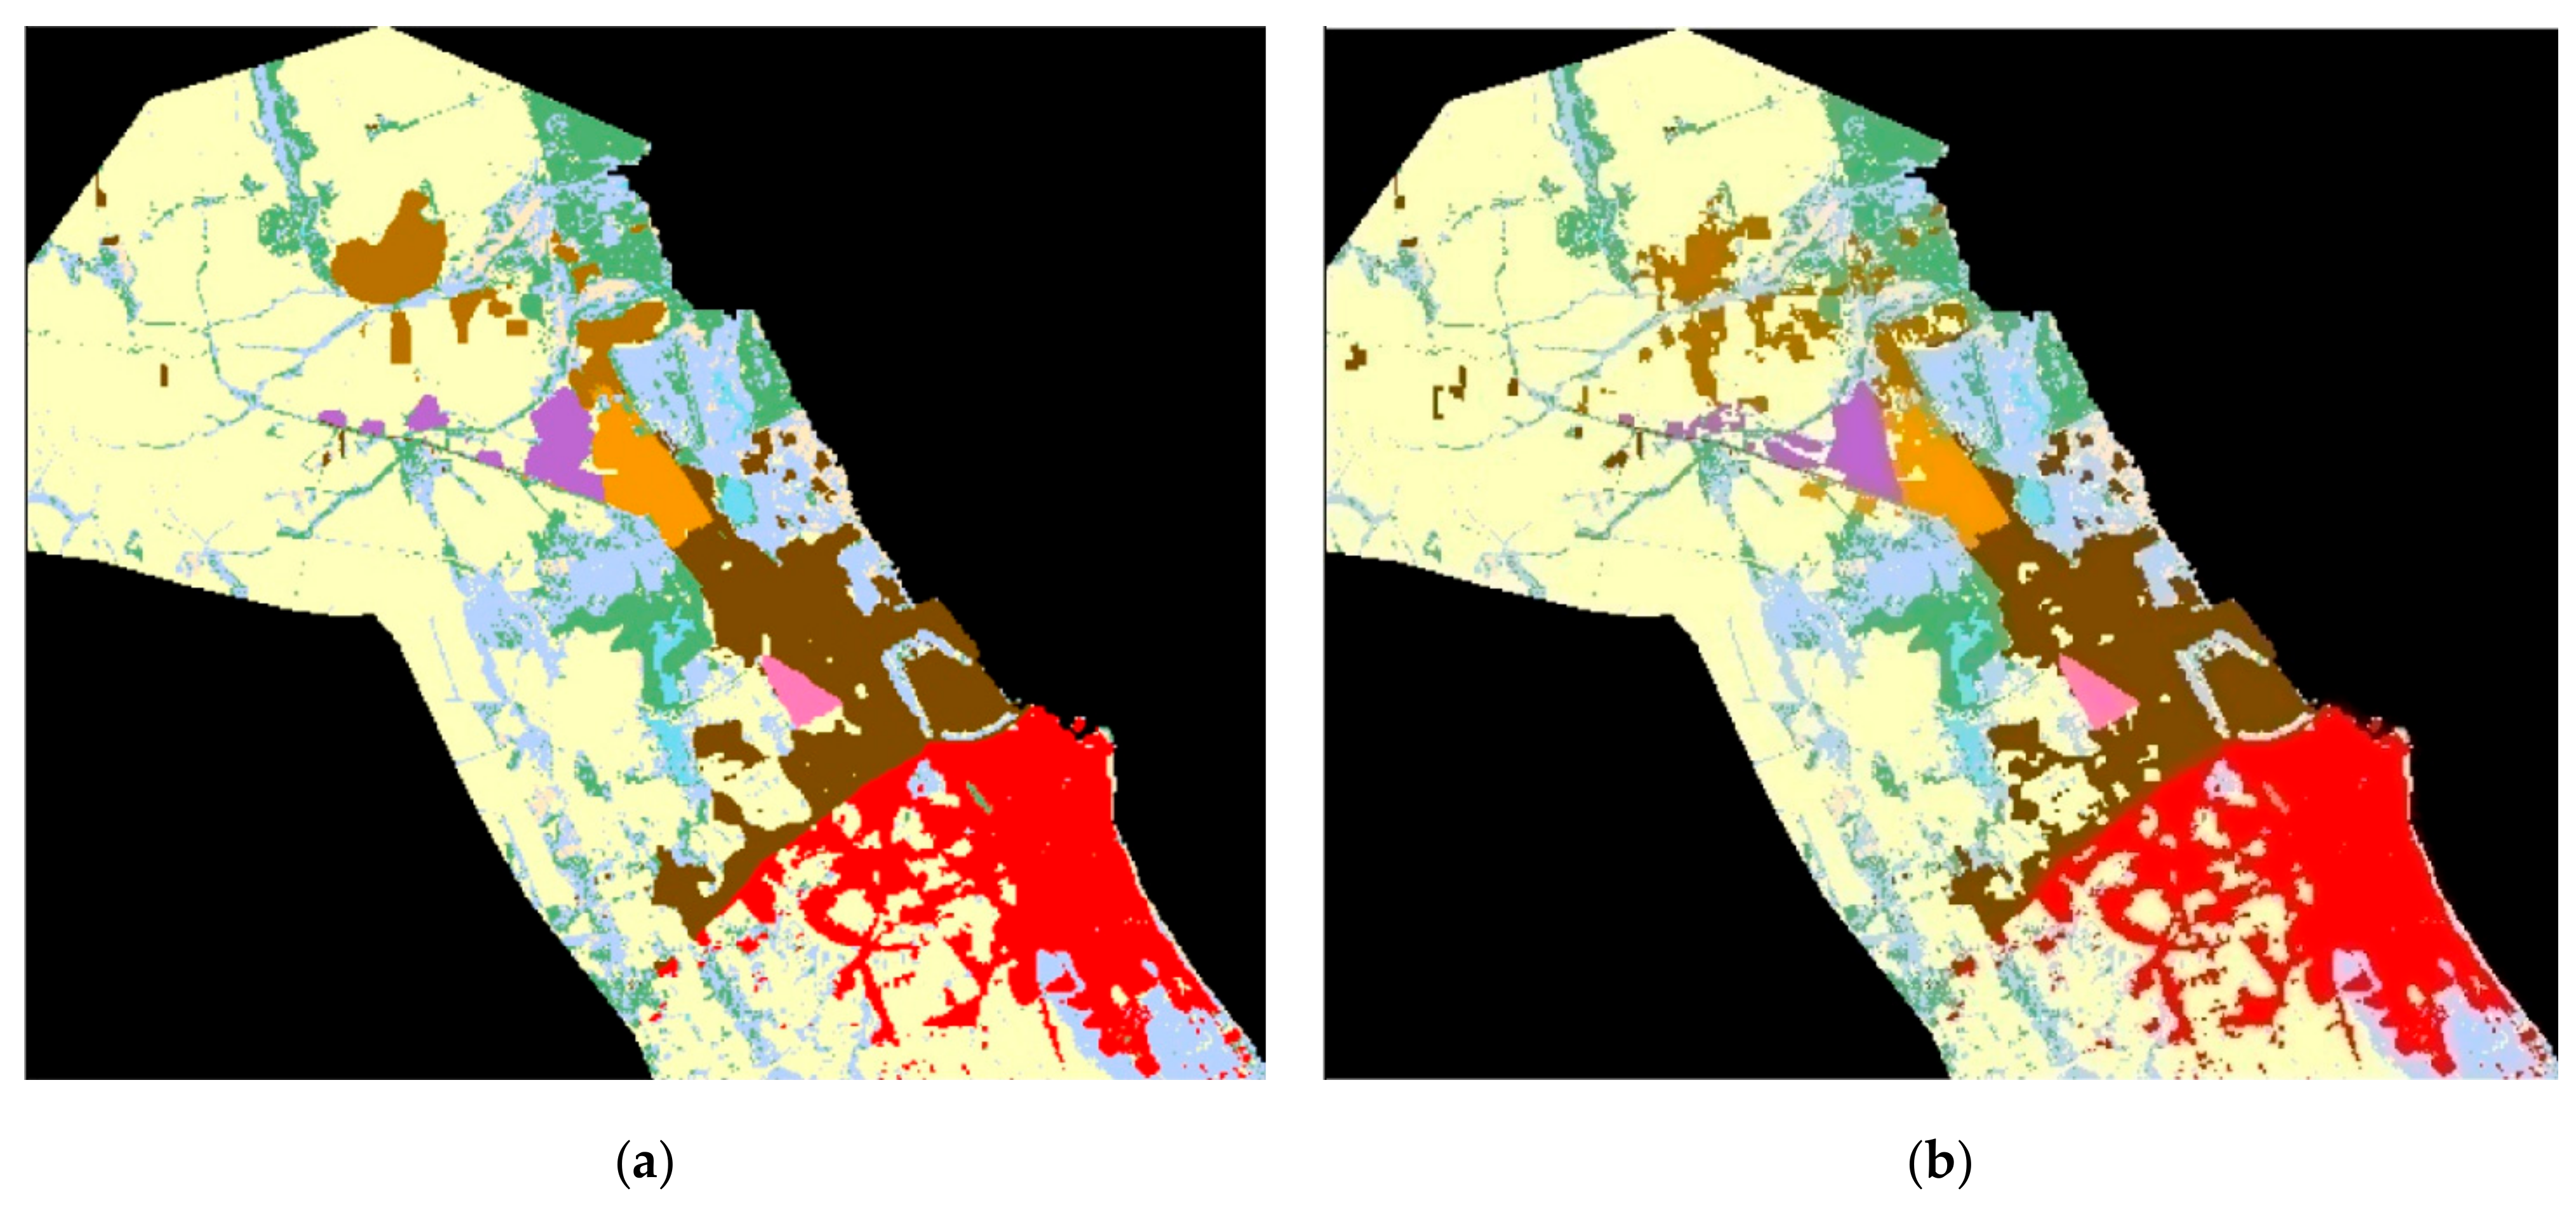
4.1.5. Comparison for Accuracy
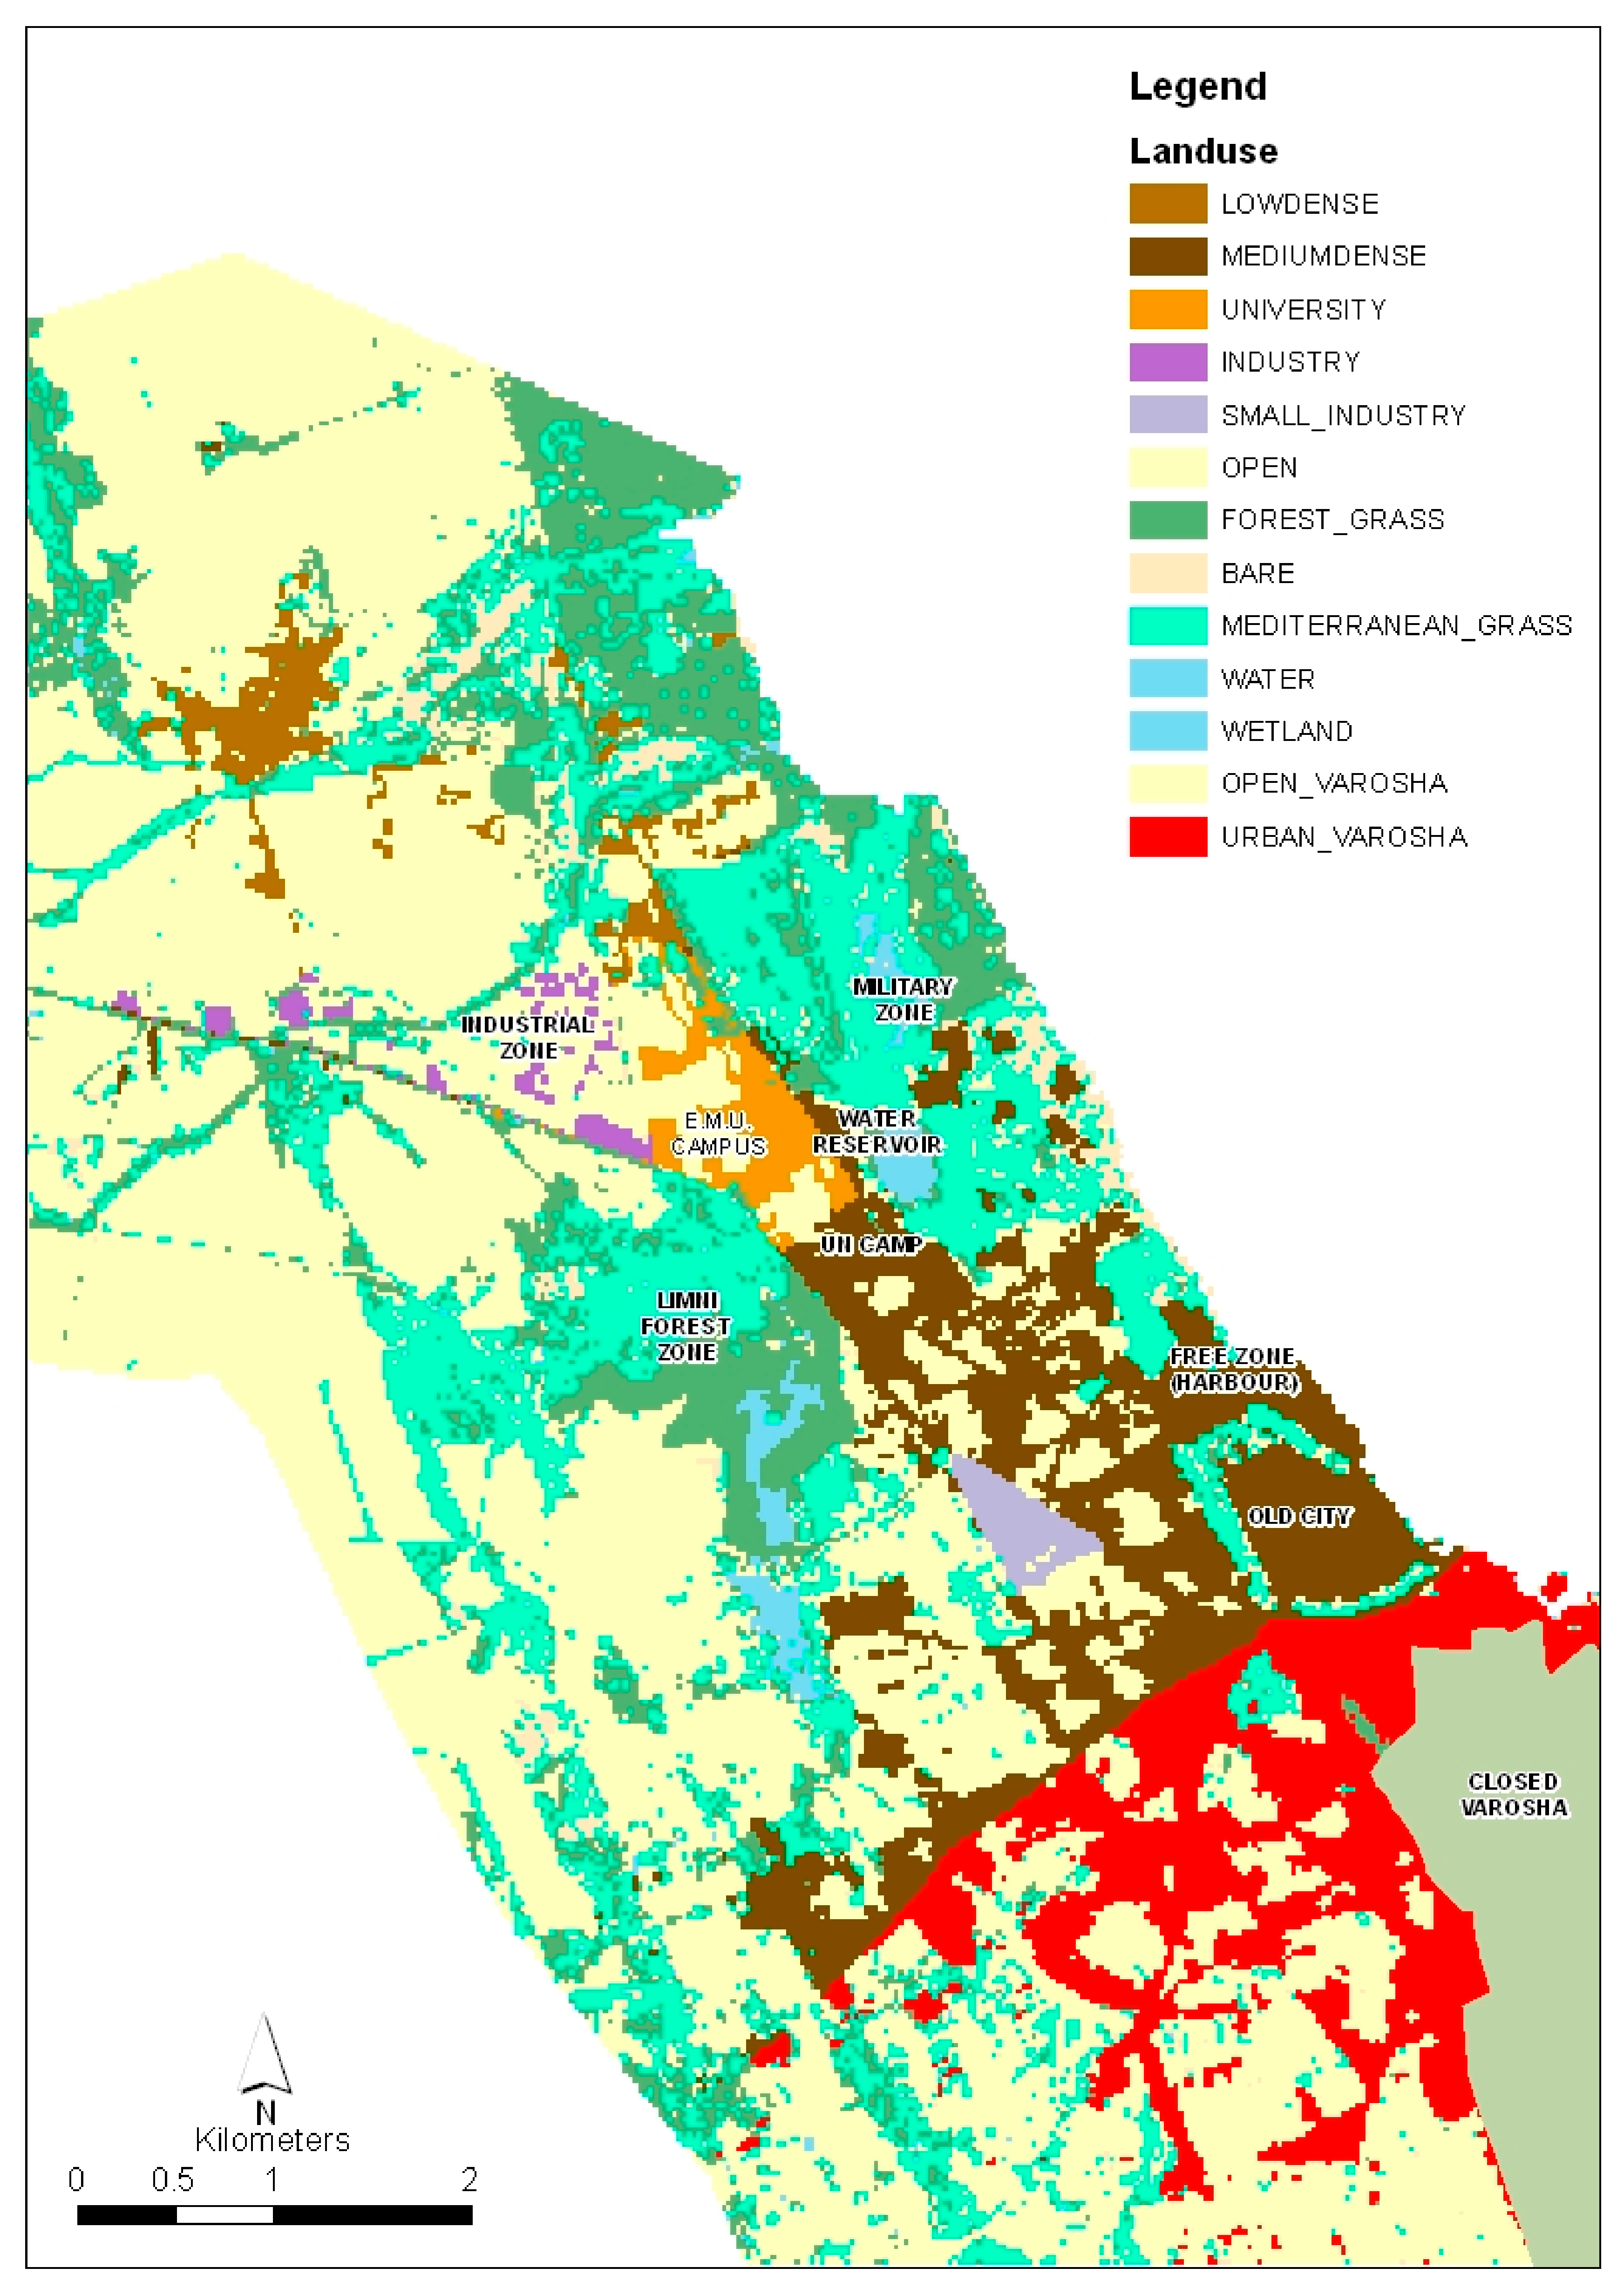
4.2. Simulate Sustainable Urban Growth for Famagusta City
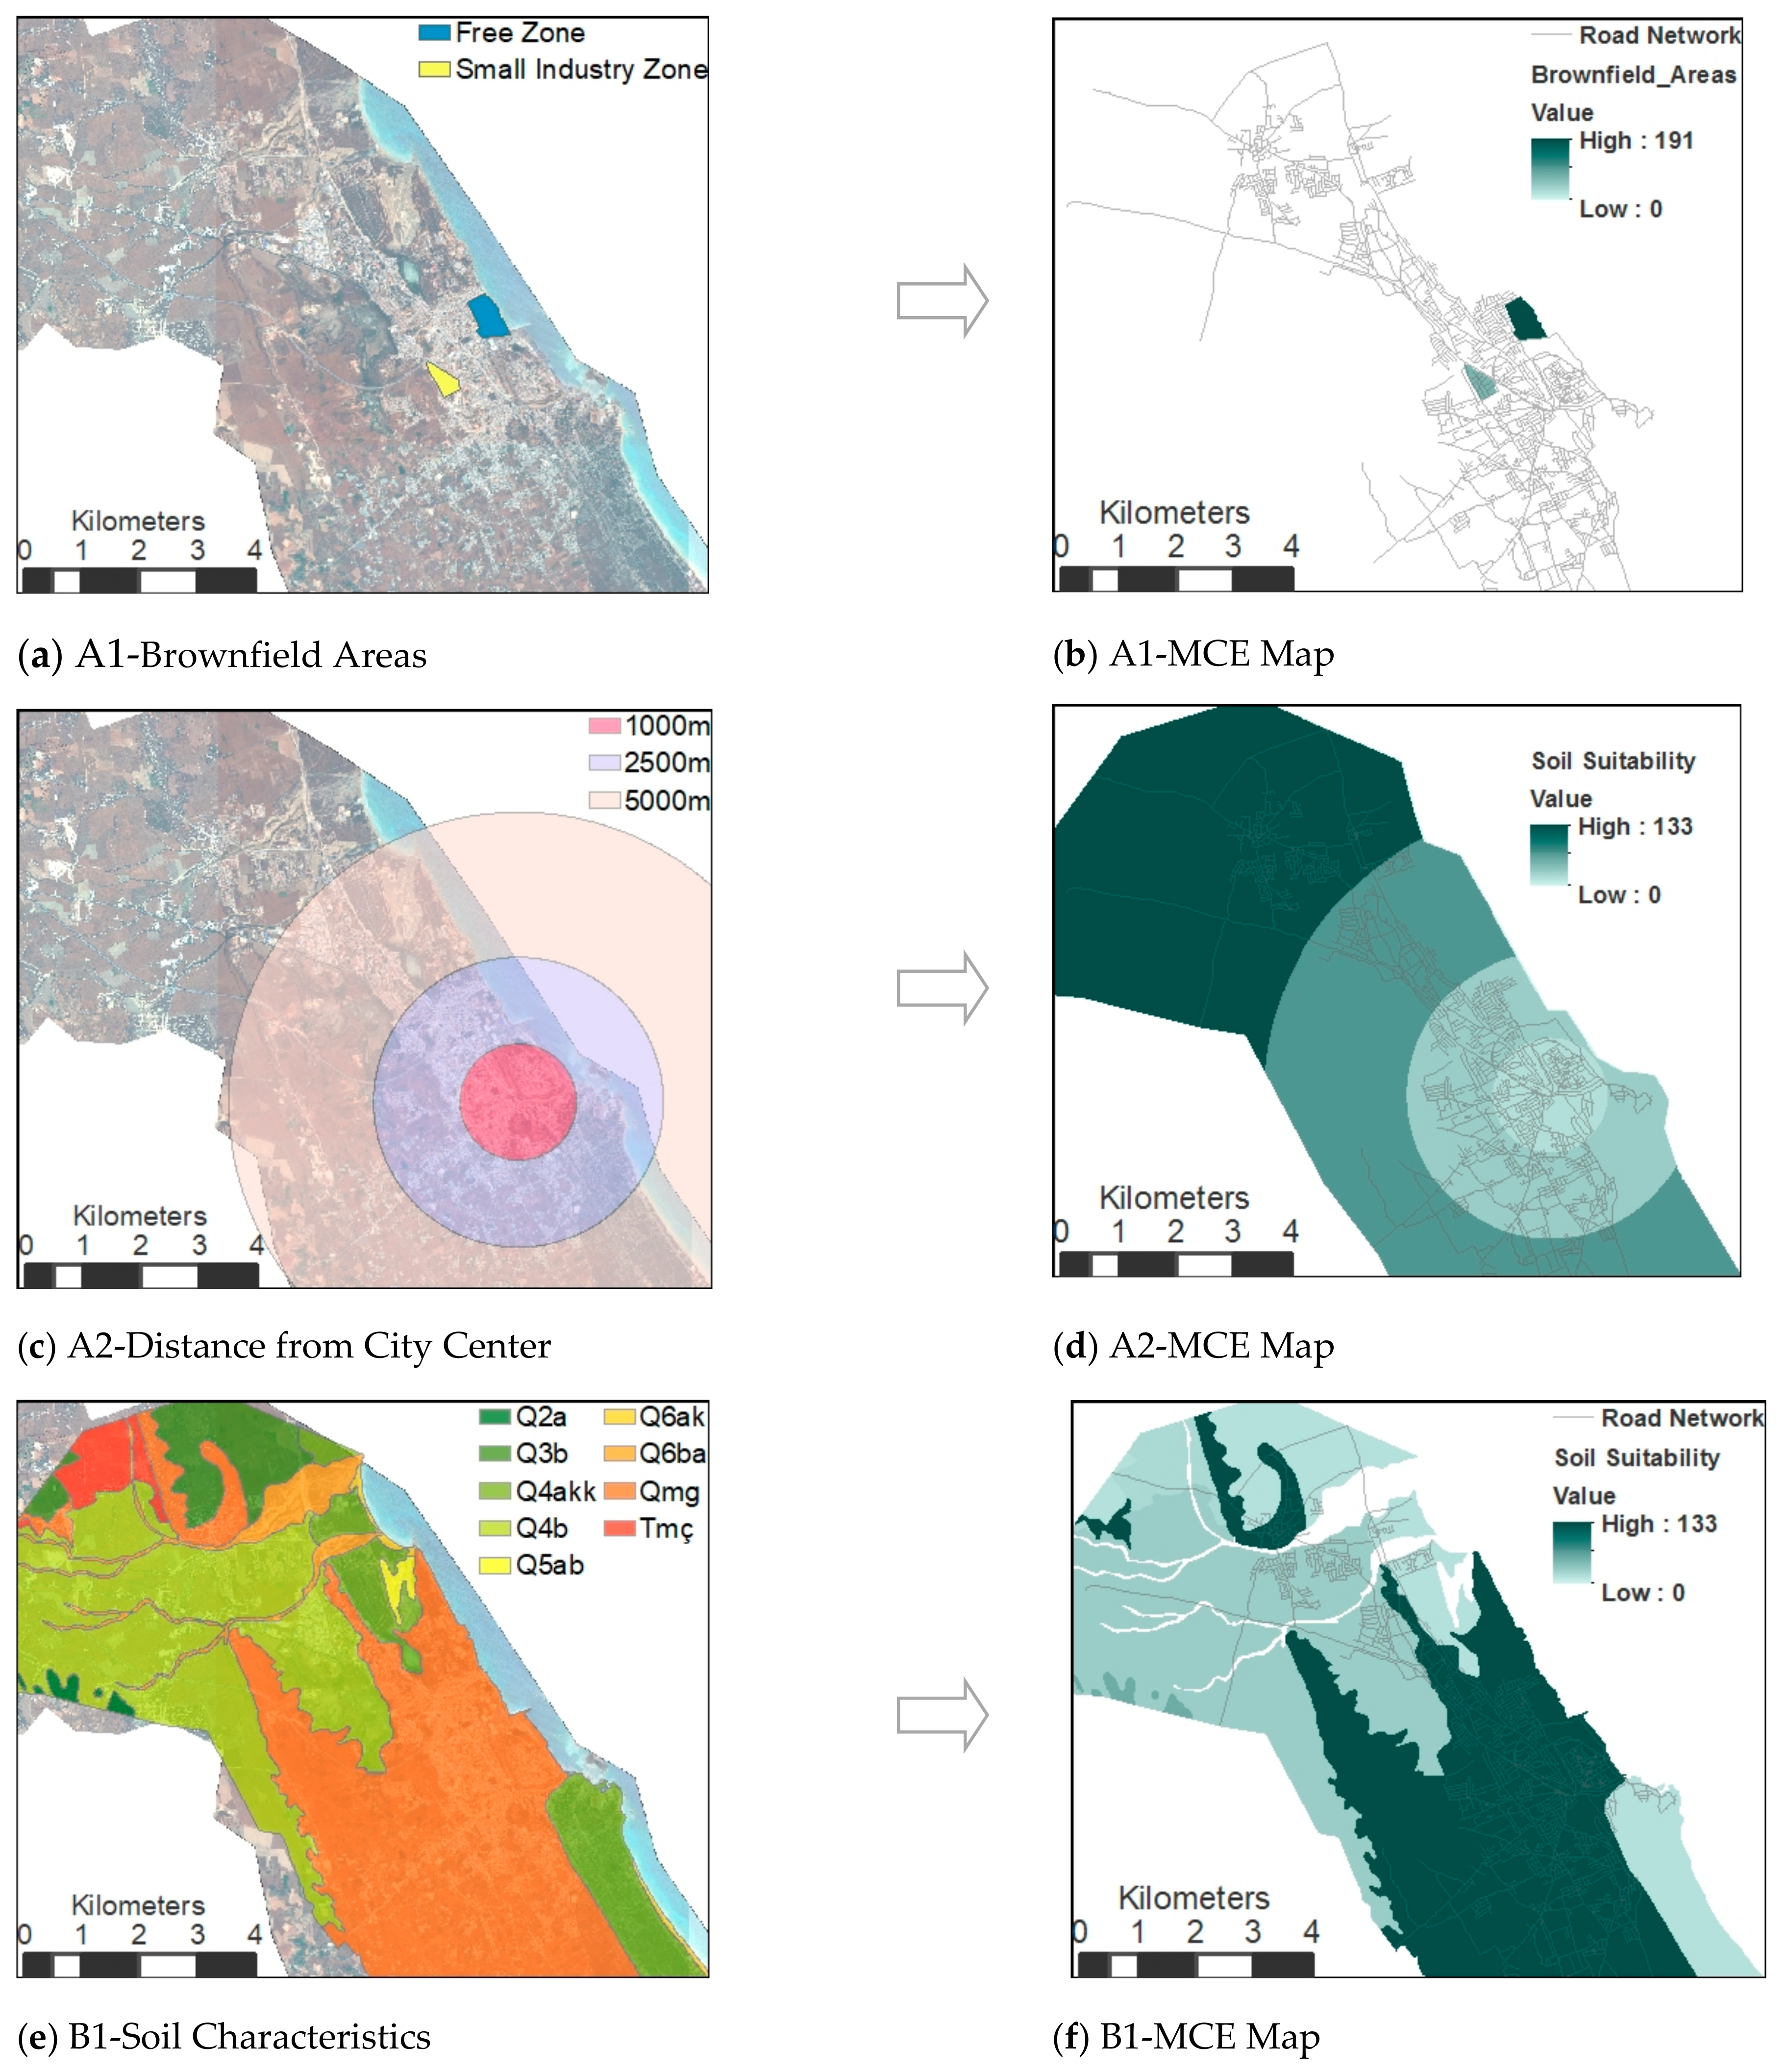
4.2.1. Criteria Description
Brownfield Areas
Distance from CBD (City Center)
Soil Characteristics
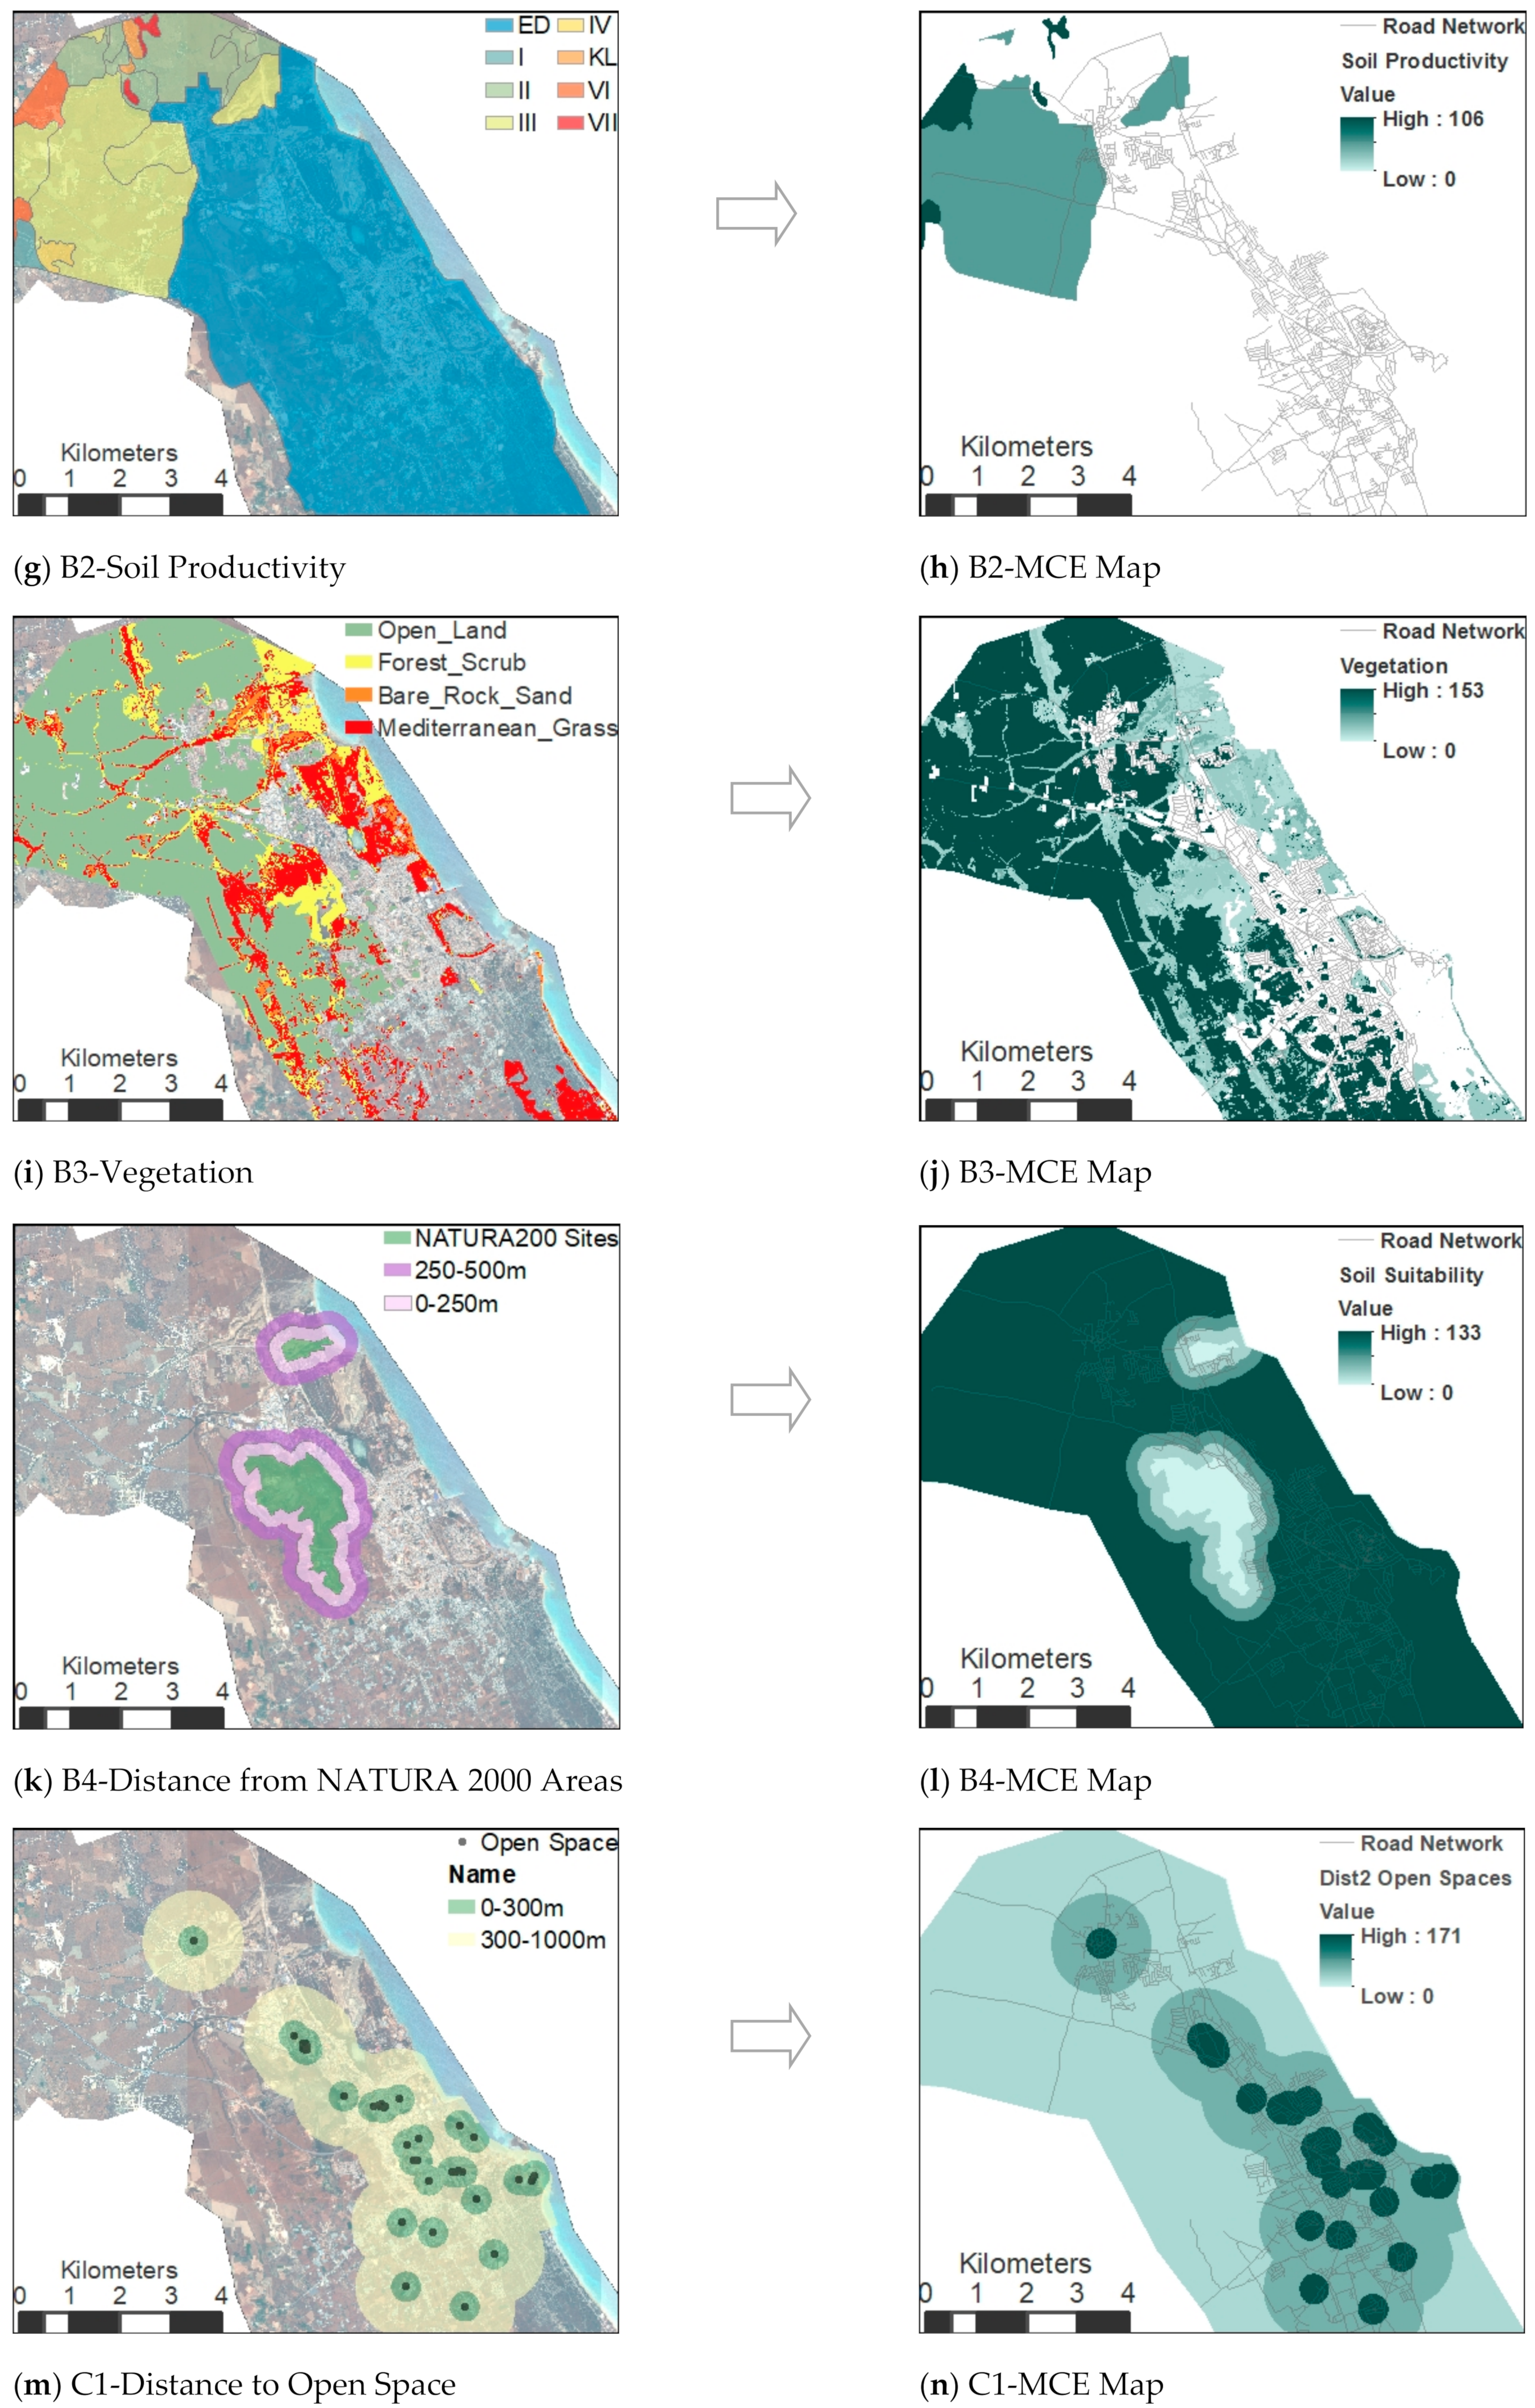
Soil Productivity
Vegetation
Environmental Protection Areas
Distance to Public Open Areas
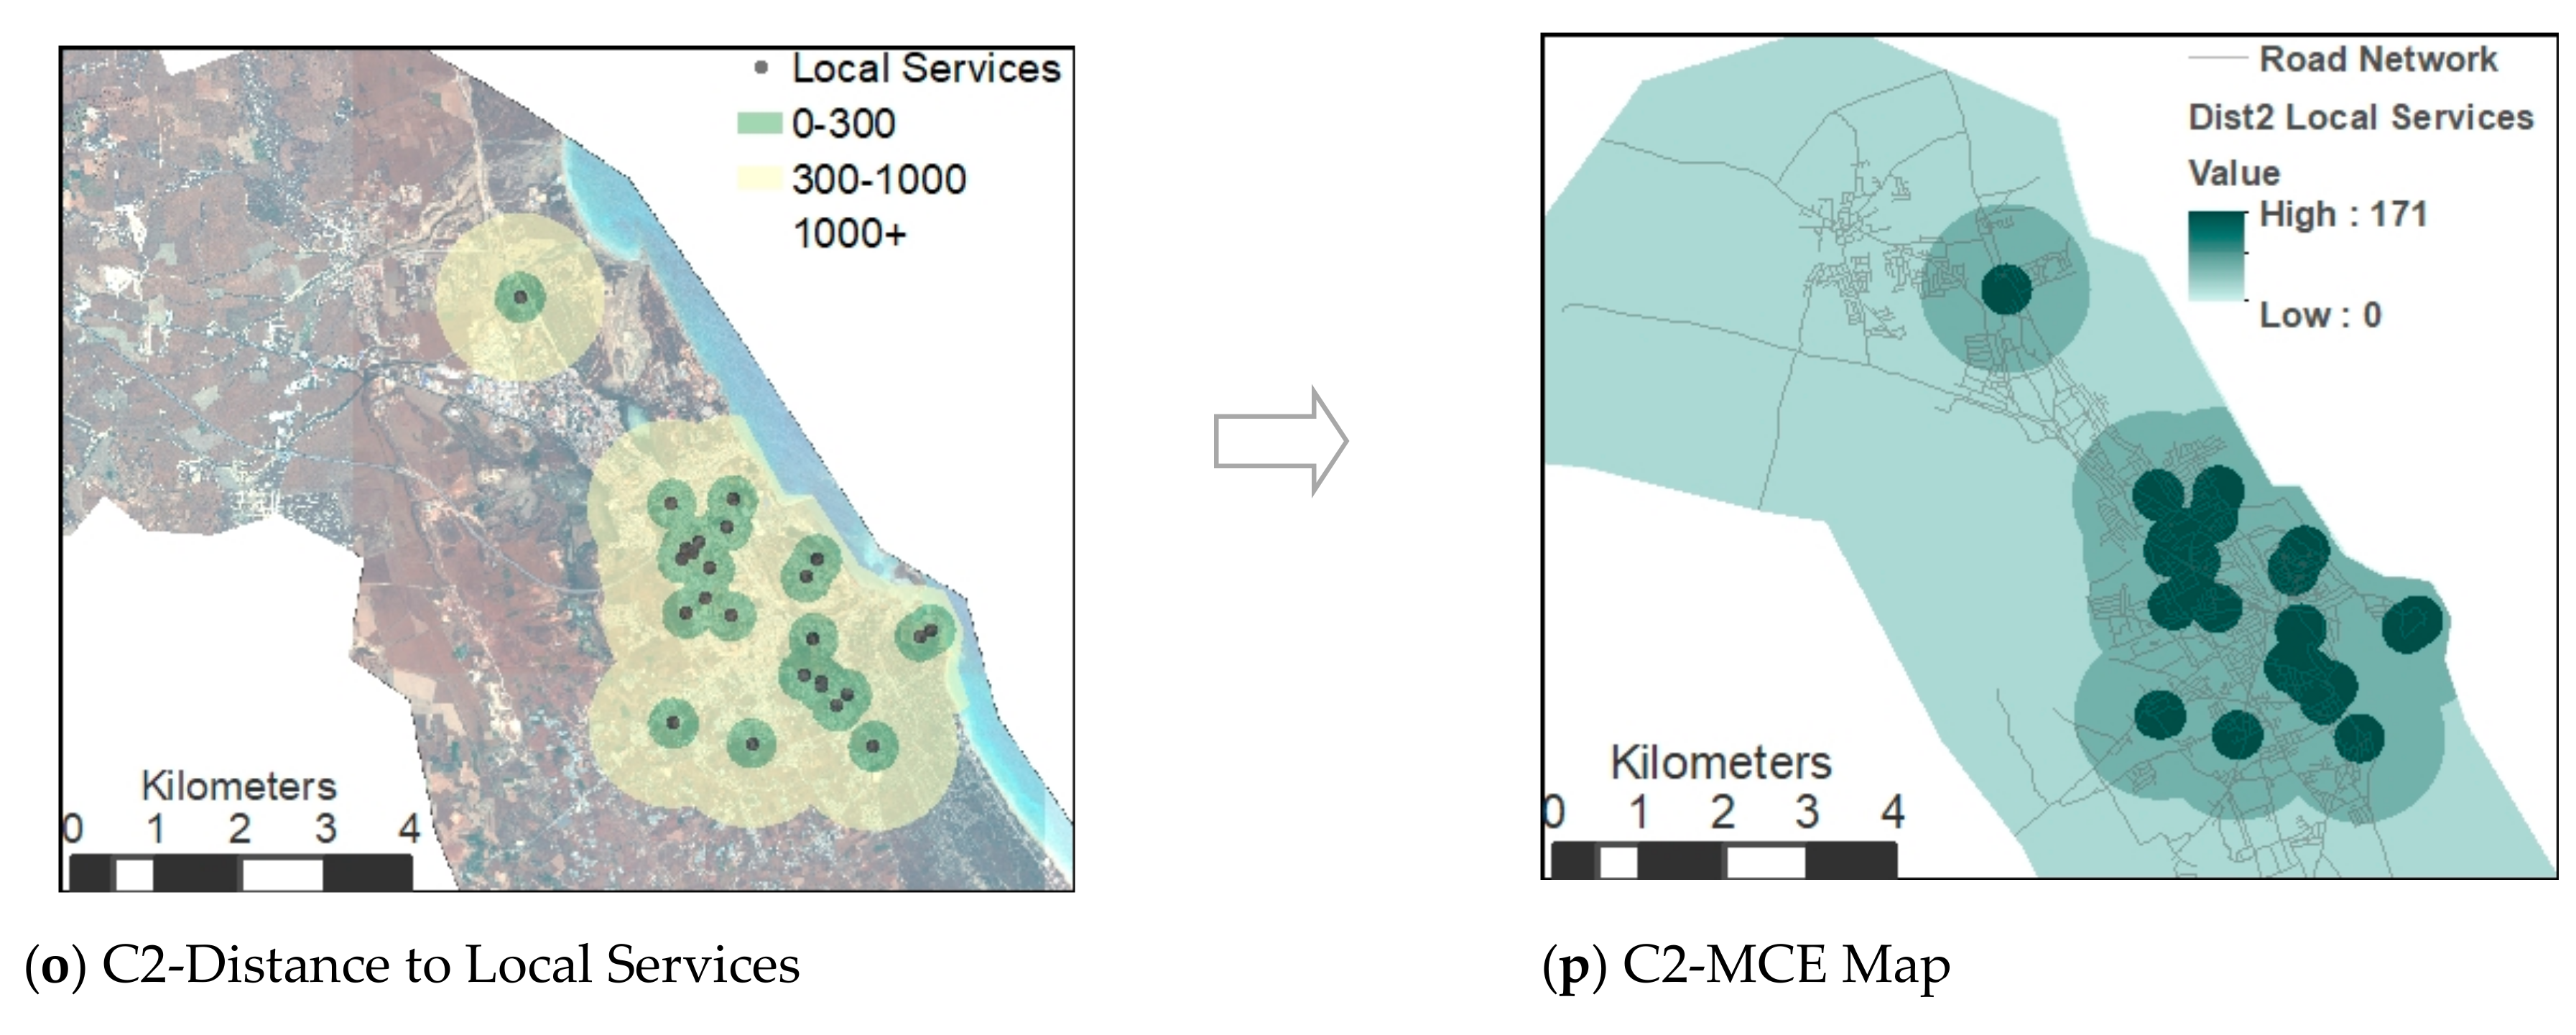
Distance to Local Services
4.2.2. Pairwise Comparison
5. Results and Discussion
6. Conclusions
Author Contributions
Funding
Institutional Review Board Statement
Informed Consent Statement
Data Availability Statement
Acknowledgments
Conflicts of Interest
Appendix A
| LOW | MEDIUM | UNI | IND | SMALL IND | OPEN | FOREST | BARE | MEDI GRASS | WATER | WETLAND | OPEN VAROSHA | URBAN VAROSHA | |
| LOW | 1 | 0 | 0 | 0 | 0 | 0 | 0 | 0 | 0 | 0 | 0 | 0 | 0 |
| MEDIUM | 0 | 1 | 0 | 0 | 0 | 0 | 0 | 0 | 0 | 0 | 0 | 0 | 0 |
| UNIVERSITY | 0 | 0 | 1 | 0 | 0 | 0 | 0 | 0 | 0 | 0 | 0 | 0 | 0 |
| INDUSTRY | 0 | 0 | 0 | 1 | 0 | 0 | 0 | 0 | 0 | 0 | 0 | 0 | 0 |
| SMALL_IND. | 0 | 0 | 0 | 0 | 1 | 0 | 0 | 0 | 0 | 0 | 0 | 0 | 0 |
| OPEN | 0.027 | 0.0425 | 0.0148 | 0.0173 | 0.0007 | 0.8977 | 0 | 0 | 0 | 0 | 0 | 0 | 0 |
| FOREST | 0.0049 | 0.004 | 0.0013 | 0.0022 | 0 | 0 | 0.9876 | 0 | 0 | 0 | 0 | 0 | 0 |
| BARE | 0 | 0.0052 | 0.0016 | 0.0052 | 0 | 0 | 0 | 0.988 | 0 | 0 | 0 | 0 | 0 |
| MEDI GRASS | 0.0127 | 0.0046 | 0.0001 | 0.0006 | 0 | 0 | 0 | 0 | 0.982 | 0 | 0 | 0 | 0 |
| WATER | 0 | 0 | 0 | 0 | 0 | 0 | 0 | 0 | 0 | 1 | 0 | 0 | 0 |
| WETLAND | 0 | 0.0032 | 0 | 0 | 0 | 0 | 0 | 0 | 0 | 0 | 0.9968 | 0 | 0 |
| OPEN VAR. | 0 | 0 | 0 | 0 | 0 | 0 | 0 | 0 | 0 | 0 | 0 | 0.9373 | 0.0627 |
| URBAN VAR. | 0 | 0 | 0 | 0 | 0 | 0 | 0 | 0 | 0 | 0 | 0 | 0 | 1 |
Appendix B

| Criteria | Physical Compactness | Environmental Protection | Social Equity | Weights |
|---|---|---|---|---|
| Physical Compactness | 1 | 1/3 | 1/3 | 0.14 |
| Environmental Protection | 3 | 1 | 1 | 0.43 |
| Social Equity | 3 | 1 | 1 | 0.43 |
| Criteria | Brownfield Development | Distance to City Center | Weights |
|---|---|---|---|
| Brownfield Development | 1 | 2 | 0.33 |
| Distance to City Center | 1 | 1 | 0.67 |
| Criteria | Soil Permeability | Soil Productivity | Vegetation | EPA | Weights |
|---|---|---|---|---|---|
| Soil Permeability | 1 | 3 | 2 | 1 | 0.36 |
| Soil Productivity | 1/3 | 1 | 1/2 | 1/2 | 0.12 |
| Vegetation | 1/2 | 2 | 1 | 0.23 | |
| EPA (Natura2000) | 1 | 2 | 1 | 1 | 0.29 |
| Criteria | Distance from Local Services | Distance from Open Spaces | Weights |
|---|---|---|---|
| Distance from Local Services | 1 | 1 | 0.50 |
| Distance from Open Spaces | 1 | 1 | 0.50 |
| Criteria | Free Zone | Small Industry Zone | Weights |
|---|---|---|---|
| Free Zone | 1 | 3 | 0.75 |
| Small Industry Zone | 1/3 | 1 | 0.25 |
| Criteria | 0–1000 | 1000–2500 m | 2500–5000 m+ | 5000 m+ | Weights |
|---|---|---|---|---|---|
| 0–1000 | 1 | 2 | 5 | 8 | 0.55 |
| 1000–2500 m | 1/2 | 1 | 3 | 5 | 0.28 |
| 2500–5000 m | 1/5 | 1/3 | 1 | 2 | 0.11 |
| 5000 m+ | 1/8 | 1/5 | 1/2 | 1 | 0.06 |
| Criteria | Qmg | Q2a | Q4b | Tmç | Q3b | Q4ak | Weights |
|---|---|---|---|---|---|---|---|
| Qmg | 1 | 3 | 5 | 7 | 8 | 9 | 0.52 |
| Q2a | 1/3 | 1 | 2 | 4 | 5 | 6 | 0.20 |
| Q4b | 1/5 | 1/2 | 1 | 2 | 3 | 4 | 0.11 |
| Tmç | 1/7 | 1/4 | 1/2 | 1 | 2 | 3 | 0.07 |
| Q3b | 1/8 | 1/5 | 1/3 | 1/2 | 1 | 2 | 0.05 |
| Q4ak | 1/9 | 1/6 | 1/4 | 1/3 | 1 | 0.05 |
| Criteria | 3rd and 4th Classes | 5th, 6th, 7th Classes | Weights |
|---|---|---|---|
| 3rd and 4th Classes | 1 | 1/4 | 0.20 |
| 5th, 6th, 7th Classes | 4 | 1 | 0.80 |
| Criteria | Open/Dry Pasture | Bare/Sand/Rock | Grassland | Forest Scrub | Weights |
|---|---|---|---|---|---|
| Open/Dry Pasture | 1 | 3 | 5 | 7 | 0.60 |
| Bare/Sand/Rock | 1/3 | 1 | 2 | 4 | 0.21 |
| Grassland | 1/5 | 1/2 | 1 | 2 | 0.12 |
| Forest Scrub | 1/7 | 1/4 | 1/2 | 1 | 0.07 |
| Criteria | 0–250 m | 250–500 m | 500 m+ | Weights |
|---|---|---|---|---|
| 0–250 m | 1 | 1/3 | 1/6 | 0.10 |
| 250–500 m | 3 | 1 | 1/2 | 0.30 |
| 500 m+ | 6 | 2 | 1 | 0.60 |
| Criteria | 0–300 | 300–1000 m | 1000 m+ | Weights |
|---|---|---|---|---|
| 0–300 m | 1 | 3 | 7 | 0.67 |
| 300–1000 m | 1/3 | 1 | 4 | 0.24 |
| 1000 m+ | 1/7 | 1/4 | 1 | 0.09 |
| Criteria | 0–300 | 300–1000 m | 1000 m+ | Weights |
|---|---|---|---|---|
| 0–300 m | 1 | 3 | 7 | 0.67 |
| 300–1000 m | 1/3 | 1 | 4 | 0.24 |
| 1000 m+ | 1/7 | 1/4 | 1 | 0.09 |
References
- WCED. Our Common Future, Brundtland Report; Oxford University Press: Oxford, MI, USA; New York, NY, USA, 1987. [Google Scholar]
- UN. Agenda 21, Report of the United Nations Conference on Environment & Development; United Nations: Rio de Janerio, Brazil, 1992. [Google Scholar]
- FAO. Planning for Sustainable Use of Land Resources: Towards a New Approach; FAO: Rome, Italy, 1995; Available online: http://www.fao.org/docrep/v8047e/v8047e00.htm (accessed on 2 April 2009).
- Soltani, A. Towards Modeling Urban Growth with Using Cellular Automata (CA) and GIS; University of South Australia: Adelaide, Australia, 2005. [Google Scholar]
- Liu, Y.; Lva, X.; Qin, X.; Guo, H.; Yu, Y.; Wang, J.; Mao, G. An integrated GIS-based analysis system for land-use management of lake areas in urban fringe. Landsc. Urban Plan. 2007, 82, 233–246. [Google Scholar] [CrossRef]
- Alshuwaikhat, H.; Nassef, K. A GIS-based Spatial Decision Support System for Suitability Assessment and Land Use Allocation. Arab. J. Sci. Eng. 1996, 21, 525–543. [Google Scholar]
- Pettit, J.C. Use of a Collaborative GIS-Based Planning Support System to Assist in Formulating a Sustainable-Development Scenario for Hervey Bay, Australia. Environ. Plan. B Plan. Des. 2005, 32, 523–546. [Google Scholar] [CrossRef]
- Asgary, A.; Klosterman, R.; Razami, A. Sustainable Urban Growth Management Using What-if? Int. J. Environ. Res. 2007, 1, 218–230. [Google Scholar]
- Li, Y. Planning Support for Urban Spatial Development: A Case Study of Zhenning County. 2003. Available online: http://www.itc.nl/library/papers_2003/msc/upla/yuan_li.pdf (accessed on 5 September 2012).
- Luo, J.; Wei, D.Y. Modeling Spatial Variations of Urban Growth Patterns in Chinese Cities. The Case of Nanjing. Landsc. Urban Plan. 2009, 91, 51–64. [Google Scholar] [CrossRef]
- Wu, F.; Yeh, A. Changing spatial distribution and determinants of land development in Chinese cities in the transition from a centrally planned economy to a socialist market economy: A case study of Guangzhou. Urban Stud. 1997, 34, 1851–1879. [Google Scholar] [CrossRef]
- Lopez, E.; Bocco, G.; Mendoza, M.; Duhau, E. Predicting land-cover and land-use change in the urban fringe. A Case in Morelia City, Mexico. Landsc. Urban Plan. 2001, 55, 271–285. [Google Scholar] [CrossRef]
- Silva, E.; Clarke, K. Calibration of the SLEUTH Urban Growth Model for Lisbon and Porto, Portugal. Comput. Environ. Urban Syst. 2002, 26, 525–552. [Google Scholar] [CrossRef]
- Feng, H.; Liu, H. Scenario Prediction of Urban Growth Based on the SLEUTH Model. Adv. Intell. Soft Comput. 2012, 117, 945–952. [Google Scholar]
- Rafiee, R.; Mahiny, A.S.; Khorasani, N.; Darvishsefat, A.A.; Danekar, A. Simulating Urban Growth in Mashad City, Iran through the SLEUTH Model (UGM). Cities 2009, 26, 19–26. [Google Scholar] [CrossRef]
- Batty, M.; Xie, Y. From Cells to Cities. Environ. Plan. B Plan. Des. 1994, 21, 31–48. [Google Scholar] [CrossRef]
- Wu, F. Simland: A prototype to simulate land conversion through the integrated GIS and CA with AHP-derived transition rules. Int. J. Geogr. Inf. Sci. 1998, 12, 63–82. [Google Scholar] [CrossRef]
- Yeh, A.G.-O.; Li, X. A Constrained Model for the Simulation and Planning of Sustainable Urban Forms by Using GIS. Environ. Plan. B 2001, 28, 733–753. [Google Scholar] [CrossRef]
- Zhang, Q.; Ban, Y.; Liu, J.; Hu, Y. Simulation and Analysis of Urban Growth Scenarios for the Greater Shanghai. Comput. Environ. Urban Syst. 2011, 35, 126–139. [Google Scholar] [CrossRef]
- Vaz, E.d.; Nijkamp, P.; Painhoa, M.; Caetanoa, M. A Multi-scenario Forecast of Urban Change: A Study on Urban Growth in the Algarve. Landsc. Urban Plan. 2012, 104, 201–211. [Google Scholar] [CrossRef]
- Barredo, J.; Kasanko, M.; Lavelle, C.; McCormick, N. Modelling Dynamic Spatial Processes: Simulation of Urban Future Scenarios Through Cellular Automata. Landsc. Plan. 2003, 64, 145–160. [Google Scholar] [CrossRef]
- Adhikari, S.; Southworth, J. Simulating forest cover changes of Bannerghatta national park based on a CA-Markov Model: A remote sensing approach. Remote Sens 2012, 4, 3215–3243. [Google Scholar] [CrossRef]
- Kityuttachai, K.; Tripathi, N.K.; Tipdecho, T.; Shrestha, R. CA-Markov Analysis of Constrained Coastal Urban, Growth Modeling: Hua Hin Seaside City, Thailand. Sustainability 2013, 5, 1480–1500. [Google Scholar] [CrossRef]
- Ozturk, D. Urban Growth Simulation of Atakum (Samsun, Turkey) Using Cellular Automata-Markov Chain and Multi-Layer Perceptron-Markov Chain Models. Remote Sens 2015, 7, 5918–5950. [Google Scholar] [CrossRef]
- Vaz, E.; Arsanjani, J.J. Predicting Urban Growth of the Greater Toronto Area-Coupling a Markov Cellular Automata with Document Meta-Analysis. J. Environ. Inform. 2015, 25, 71–80. [Google Scholar] [CrossRef]
- Wang, S.; Jiao, X.; Wang, L.; Gong, A.; Sang, H.; Salahou, M.K.; Zhang, L. Integration of Boosted Regression Trees and Cellular Automata—Markov Model to Predict the Land Use Spatial Pattern in Hotan Oasis. Sustainability 2020, 12, 1396. [Google Scholar] [CrossRef]
- State Planning Organization (SPO). 2013. Available online: http://www.ktoeos.org/wp-content/uploads/2013/08/nufus_ikinci_.pdf (accessed on 5 March 2020).
- Eastman, J. Guide to GIS and Image Processing; Clark University: Worcester, MA, USA, 2001; Volume 2. [Google Scholar]
- Saaty, T. The Analytic Hierarchy Process; McGraw-Hill International: New York, NY, USA, 1980. [Google Scholar]
- EEA. Europe’s Environment: The Dobris Assessment; European Environment Assessment: Copenhagen, Demark, 1995. [Google Scholar]
- APA. Policy Guide on Smart Growth. 2002. Available online: https://www.planning.org/policy/guides/adopted/smartgrowth.htm (accessed on 10 August 2009).
- EC. European Spatial Development Perspective; European Commission: Luxembourg, 1999. [Google Scholar]
- EC. Guiding Principles for Sustainable Spatial Development of the European Continent. 2000. Available online: https://rm.coe.int/1680700173 (accessed on 10 June 2012).
- European Union. Charter of European Cities and Towns Towards Sustainability, Aalborg Charter. 1994. Available online: https://sustainablecities.eu/fileadmin/repository/Aalborg_Charter/Aalborg_Charter_English.pdf (accessed on 3 March 2020).


| Name. | Map (Data Formats) | Source |
|---|---|---|
| Road Network |
| Famagusta Municipality |
| Urban Areas (Residential, Industrial, Tourism, etc.) |
| Town Planning |
| Surface Water Resources (Dams, Rivers, etc.) |
| Waterworks |
| Ground Water Resources (Aquifers) |
| Geology-Mining |
| Environmentally Sensitive Areas |
| Environmental Protection |
| Cultural Heritage Sites |
| Antiquities |
| Soil Classification (Primary Soil, Secondary Soil, etc.) |
| Agriculture |
| Vegetation (Forestry, Sandy Dunes, etc.) |
| TPD |
| Slope and Aspect |
| Mapping Office |
| Low Dense | Medium Dense | University | Industry | Small Industry | |
|---|---|---|---|---|---|
| Constraints | |||||
| Existing Land use developments | * | * | * | * | * |
| Free Zone and Harbour | * | * | * | * | * |
| Military Zones | * | * | * | * | * |
| The campus of EMU | * | * | * | * | |
| Surface Waters | * | * | * | * | * |
| Cultural Heritage Zones | * | * | * | * | * |
| Factors | |||||
| Distance to roads | * | * | * | * | * |
| Distance to similar class | * | * | * | * | * |
| Existing 2011 | Simulated 2011 | Modeling Accuracy | ||
|---|---|---|---|---|
| CELLS | OVERLAYED CELLS | PERCENT | ||
| LAND USE TYPES | LOW DENSE | 2513 | 1605 | 0.63867887 |
| MEDIUM HOUSING | 8636 | 7943 | 0.919754516 | |
| UNIVERSITY | 1436 | 1260 | 0.877437326 | |
| INDUSTRY | 1205 | 941 | 0.780912863 | |
| SMALL_INDUSTRY | 402 | 388 | 0.965174129 | |
| TOTAL | 14,192 | 12,137 | 0.855200113 | |
| LAND COVER TYPES | OPEN | 40,668 | 40,668 | 1 |
| FOREST | 9186 | 9186 | 1 | |
| BARE | 1895 | 1895 | 1 | |
| MEDI GRASS | 13,882 | 13,882 | 1 | |
| WATER | 500 | 500 | 1 | |
| WETLAND | 315 | 315 | 1 | |
| OPEN_VAROSHA | 7555 | 7555 | 1 | |
| URBAN_UVAROSHA | 11,031 | 11,031 | 1 | |
| GOAL | POLICY | SUB-POLICY | SPATIAL CRITERIA |
|---|---|---|---|
| Sustainable Urban Development | Physical Compactness (Compact Urban Form) | Re-use (re-develop) existing urban areas | Brownfield Areas |
| Increasing density of areas close to city center | Distance from city center | ||
| Environmental Protection | Selecting suitable soil for urban development | Soil Characteristics | |
| Protection of Soil Productivity | Soil Productivity | ||
| Discourage growth in natural areas | Vegetation | ||
| Protection of Natural 2000 Sites | Protection of Natural Areas | ||
| Social Equity | Ensuring equal accessibility of basic services | Distance from local services | |
| Ensuring equal accessibility to open spaces | Distance from open spaces |
| Q6ba | Quaternary |
| Q2a | young quaternary |
| Qmg | early Pleistocene |
| Q4b | young quaternary |
| Q6ak | Quaternary |
| Tmç | young Pliocene |
| Q4akk | young quaternary |
| Q5ab | young quaternary |
| Main Criteria | Weight | CR | Criteria | Weight | CR | Sub-Criteria | Weight | CR |
|---|---|---|---|---|---|---|---|---|
| (A) Compactness | 0.14 | 0.00 | Brownfield Development | 0.33 | 0.00 | Free Zone | 0.75 | 0.00 |
| Small Ind. Zone | 0.25 | |||||||
| Distance from Center | 0.67 | 0–1000 m | 0.55 | |||||
| 1000–2500 m | 0.28 | |||||||
| 2500–5000 m | 0.11 | |||||||
| 5000 m+ | 0.06 | |||||||
| (B) Environmental Protection | 0.43 | 0.018 | Soil Characteristics | 0.36 | 0.018 | Qmg | 0.52 | 0.029 |
| Q2a | 0.20 | |||||||
| Q4b | 0.11 | |||||||
| Tmç | 0.07 | |||||||
| Q3b | 0.05 | |||||||
| Q4ak | 0.05 | |||||||
| Soil Productivity | 0.12 | 3rd and 4th Classes | 0.20 | 0.00 | ||||
| 5th, 6th, 7th Classes | 0.80 | |||||||
| Vegetation | 0.23 | Open/Dry Pasture | 0.60 | 0.017 | ||||
| Bare/Sand/Rock | 0.21 | |||||||
| Grassland | 0.12 | |||||||
| Forest Scrub | 0.07 | |||||||
| EPA | 0.29 | 0–250 m | 0.10 | 0.00 | ||||
| 250–500 m | 0.30 | |||||||
| 500 m+ | 0.60 | |||||||
| (C) Social Equity | 0.43 | 0.00 | Distance from Local Services | 0.50 | 0.00 | 0–300 m | 0.67 | 0.00 |
| 300–1500 m | 0.24 | |||||||
| 1500 m+ | 0.09 | |||||||
| Distance from Open Space | 0.50 | 0–300 m | 0.67 | 0.00 | ||||
| 300–1500 m | 0.24 | |||||||
| 1500 m+ | 0.09 |
Publisher’s Note: MDPI stays neutral with regard to jurisdictional claims in published maps and institutional affiliations. |
© 2021 by the authors. Licensee MDPI, Basel, Switzerland. This article is an open access article distributed under the terms and conditions of the Creative Commons Attribution (CC BY) license (https://creativecommons.org/licenses/by/4.0/).
Share and Cite
Kara, C.; Doratlı, N. Predict and Simulate Sustainable Urban Growth by Using GIS and MCE Based CA. Case of Famagusta in Northern Cyprus. Sustainability 2021, 13, 4446. https://doi.org/10.3390/su13084446
Kara C, Doratlı N. Predict and Simulate Sustainable Urban Growth by Using GIS and MCE Based CA. Case of Famagusta in Northern Cyprus. Sustainability. 2021; 13(8):4446. https://doi.org/10.3390/su13084446
Chicago/Turabian StyleKara, Can, and Naciye Doratlı. 2021. "Predict and Simulate Sustainable Urban Growth by Using GIS and MCE Based CA. Case of Famagusta in Northern Cyprus" Sustainability 13, no. 8: 4446. https://doi.org/10.3390/su13084446
APA StyleKara, C., & Doratlı, N. (2021). Predict and Simulate Sustainable Urban Growth by Using GIS and MCE Based CA. Case of Famagusta in Northern Cyprus. Sustainability, 13(8), 4446. https://doi.org/10.3390/su13084446