Article

A Pathway for Sustainable Agriculture

1
Department of Biological and Ecological Engineering, College of Agricultural Science, Oregon State University, Corvallis, OR 97331, USA
2
Department of Soil and Water Resource, College of Agriculture, Al-Qasim Green University, Al-Qasim District 964, Babylon 51013, Iraq
3
North Willamette Research and Extension Center, Department of Horticulture, College of Agricultural Science, Oregon State University, Aurora, OR 97201, USA
*
Author to whom correspondence should be addressed.
Sustainability 2021, 13(8), 4328; https://doi.org/10.3390/su13084328
Submission received: 20 January 2021 / Revised: 1 April 2021 / Accepted: 8 April 2021 / Published: 13 April 2021

Abstract

:
Expanding populations, the impacts of climate change, availability of arable land, and availability of water for irrigation collectively strain the agricultural system. To keep pace and adapt to these challenges, food producers may adopt unsustainable practices that may ultimately intensify the strain. What is a course of technological evolution and adoption that can break this cycle? In this paper we explore a set of technologies and food production scenarios with a new, reduced-order model. First the model is developed. The model combines limitations in the sustainable water supply, agricultural productivity as a function of intensification, and rising food demands. Model inputs are derived from the literature and historical records. Monte Carlo simulation runs of the model are used to explore the potential of existing and future technologies to bring us ever closer to a more sustainable future instead of ever farther. This is the concept of a moving sustainability horizon (the year in the future where sustainability can be achieved with current technological progress if demand remains constant). The sustainability gap is the number of years between the present and the sustainability horizon. As demand increases, the sustainability horizon moves farther into the future. As technology improves and productivity increases, the sustainability horizon is closer to the present. Sustainability, therefore, is achieved when the sustainability horizon collides with the present, closing the sustainability gap to zero. We find one pathway for water management technology adoption and innovation that closes the sustainability gap within the reduced-order model’s outputs. In this scenario, micro-irrigation adoption, minimal climate change impacts, reduced food waste, and additional transformative innovations such as smart greenhouses and agrivoltaic systems are collectively needed. The model shows that, in the absence of these changes, and continuing along our current course, the productivity of the agricultural system would become insufficient in the decade following 2050.

1. Introduction

Irrigation and water management can be used to alleviate or exacerbate the largest global resource management challenges. On the positive side, water management practices can increase food production and sustainability [1]. Food production needs to increase. By 2050, nine billion people will require 13.5 billion metric tons of food annually [2], 10% of whom will receive inadequate nutrition [3]. The requisite increases in food production [4] can be attained partly through efficient irrigation [5]. Secondly, irrigation can be used to offset the negative impacts of climate change on the food supply [6]. Climate change alters precipitation patterns and increases the frequency of extreme weather which reduces crop production [7], and increases food prices [8]. Irrigation can mitigate [9] climate change’s impacts on our food supply but would require a 40–100% increase in water use for irrigation [10].
On the negative side, the expansion of irrigated lands can strain global water sustainability [11]. Water consumption in agriculture currently accounts for 87% of the world’s consumptive water use [12] of which approximately 30% is drawn from unsustainable sources [13]. Improvements in irrigation efficiency do not necessarily lead to basin-scale changes in water availability, and restrictions on irrigation withdrawals have been suggested as a viable path toward reduced agricultural water consumption [11]. Secondly, the expansion of irrigated areas can contribute to global warming [6]. Agricultural land already occupies 40% of the Earth’s land surface [14]. Twenty percent of that area is irrigated, and produces 40% of the world’s food [15], [16]. Further expansion of the total agricultural land is limited by climatic and soil constraints [14], would increase CO2 production, and would contribute to climate change [6].
The combined view of resource needs and constraints in the food–energy–water nexus (discussed above) seem to indicate that agriculture will need to both expand and restrict irrigation at the same time to achieve sustainability in a changing climate. This paradox may be subverted through the development of either additional sustainable water resources or agricultural technologies and practices that substantially improve the efficiency of water use. Improved irrigation efficiencies can be achieved through technological innovation and technological adoption. The aim of this effort is to explore how the adoption of existing irrigation technology or emergent agricultural technologies can contribute to resolving this paradox.
Irrigation efficiency is defined as the ratio of the volume of water that is taken up by the crop to the volume of irrigation water applied. This water use efficiency is affected by irrigation technology and approach. These technologies are grouped into three main categories: surface (75% of ag. land), sprinkler (20% of ag. land), and micro-irrigation (5% of ag. land) [17]. The application efficiencies of these general categories vary greatly. Micro-irrigation is generally the most efficient (80–91%) and surface irrigation is the least (50–70%). Sprinkler irrigation efficiency is 54–80% [18]. That is, the most efficient irrigation approach is used the least and vice versa. There is a rich literature that explores the links between irrigation technology, water use efficiency and crop productivity.
The seed-lint cotton yield production was 10–19% higher and water use efficiency increased by 35–103% with micro-irrigation relative to furrow irrigation [19]. Grain yields (Zea mays L.) in micro, sprinkler, and surface irrigated fields of 11.8 t/ha, 10.5 t/ha, and 10.1 t/ha were measured in 2004–2005 [20]. The associated net irrigation water productivity was increased by 1.7 t/ML, 1.4 t/ML, and 1.3 t/ML for micro, sprinkler, and furrow irrigation, respectively [20]. They reported water savings of 30% for micro-irrigation and 8% for sprinkler irrigation compared with surface irrigation. Similar results were reported by Humphreys et al. 2008 [21]. Net irrigation water productivity and maize production were increased by small amounts (averages of 0.5 t/ha and 0.2 t/ML, respectively) compared to flood irrigation [21].
Emerging technologies, such as smart greenhouses, agrivoltaic systems [22], and technological innovation in irrigation, may further increase efficiencies and productivities within the food–energy–water nexus. Greenhouse vegetable production has been shown to increase yields and reduce water demands and has been implemented at scale in Southern Europe and the Netherlands [23,24]. New irrigation technologies designed to increase application efficiency have been patented [25] and demonstrated. Two examples are a new dynamic elevation spray application (DESA) for overhead irrigation systems that responds to the growth of the crop canopy [26], and a variable rate drip irrigation (VRDI) emitter that can be used to customize water irrigation amounts and timings to individual plants [27].
Given that the current agricultural system is not sustainable in water [13], it is natural to ask the question: what is the role of irrigation technology in a future, sustainable food system? How is the potential for water sustainability in agriculture impacted by this technological mix? In addition, what innovations are required to usher in this more sustainable future? The first objective of this manuscript is to quantify the potential of irrigation technology to influence global food sustainability. This is achieved by deriving and applying a simplified model that compares past, present, and future agricultural inputs (e.g., irrigation), and outputs (e.g., calories). The second objective is to reconstruct past trends in irrigation technology from ~10,000 BCE to the present to give context to the future scenarios that are explored within the third objective. This is achieved through literature synthesis and interpolation. The third objective is to deploy the completed model on a single case study to demonstrate the capabilities of the model. This is achieved by envisioning a current course scenario, where all rates of change remain constant. The fourth scenario is to deploy the model in a series of alternative future scenarios to evaluate what technological advancement pathways may lead to food sustainability. These scenarios explore water limitations, potential agricultural land expansion, agricultural productivity (depending on practice), and resulting supportable population. The fourth objective is achieved by developing and using a new concept: a “sustainability horizon” which we express as the year in which sustainability would be reached at the pace of current technological adaptation assuming all other exogenous factors remain constant (population, climate, per capita consumption, etc.). Sustainability can then be defined as when the sustainability horizon is co-located with the present time.

2. Methodology

2.1. Objective 1: Model Construction

A new, reduced-order model is constructed to explore the connection between technological advancement and adoption and sustainability. This model must incorporate the limitations of sustainably available water for irrigation, the expected irrigated land expansion, technological efficiencies (both productivity and use), and food demands. The model is constructed in three stages outlined below. First, the overall sustainable water limitation for the global irrigated agriculture is incorporated and enforced. Next, the expected changes in agricultural production attributable to technological intensification are incorporated. Finally, the expected rise in food demand with population is incorporated. The result is a reduced-order model that can quickly explore past, current, and future irrigation technology scenarios and predict how these scenarios could impact macro-level food sustainability.
The reduced-order model is constructed as follows:
Water limitations: the total irrigation water withdrawal is the sum of water required to service each technological class (micro, sprinkler, and surface irrigation). The 0th order model (Equation (1)) is the ratio of withdrawals such that relative water savings can be calculated against a known historical reference. This approach does not address the diversity and disposition of resources and demands but does enable an aggregated 0th order analysis of irrigation technology.
W t o t a l , 1 W t o t a l , 2 = A I , 1 D A I , 2 D (   f M , 1 E M   + f S p , 1 E S p + f S u , 1 E S u f M , 2 E M + f S p , 2 E S p + f S u , 2 E S u )
where the subscripts 1 and 2 are the reference and interrogated times, respectively. W t o t a l is the total irrigation water withdrawn [km3]; A I is the total irrigated area [Mha]; D is the water depth applied to the rooting zone [cm];   E M , E S p , and E S u and f M ,   f S p , and f S u are the efficiencies and the area fractions of surface, sprinkler, and micro-irrigation, respectively. Scenarios are defined relative to a 2019 baseline which is found through synthesis and projection of historical data shown in Supplementary Materials (Table S1). Input parameter values from the literature are given in Table 1.
Production: productivity per hectare increases with irrigation efficiency. Rainfed land has similar productivity to surface irrigated lands, and micro-irrigated lands are 20–90% more productive than surface irrigated lands [29]. A literature summary of irrigation technology-specific productivities is presented in Table 1. The total productivity of agriculture must balance the consumption minus the waste.
n P 1 = ( M M + M S p + M S u + M R W ) ρ f
where P 1 is the population now, n is the average annual per-capita calorie needs, W is the mass of wasted food, ρ f is the average calorie density of food in calories per kilogram, and M M , M S p , M S u , and M R are the masses of food produced per year in micro-irrigated, sprinkler irrigated, surface irrigated, and rainfed agriculture, respectively.
The productivity of each agricultural practice can be further refined from Equation (2):
n P 1 ρ f = q R { ( C M C S u f M , 1 + C S p C S u f S p , 1 + C S u f S u , 1 ) A I , 1 + A R , 1 } W
where q R is the rainfed agricultural productivity expressed in terms of a mass flux [kg/(Mha-y)]; C M , and C S p are the relative productivity of micro and sprinkler to surface irrigated lands, and C S u is the relative productivity of surface irrigated lands to rainfed lands, respectively; A R , 1 is the area of rainfed agriculture globally [Mha].
The food waste is expressed as a fraction of the total production, W f [31]. Upon substation, Equation (3) becomes:
n P 1 ( 1 W f ) ρ f q R = ( C M C S u f M , 1 + C S p C S u f S p , 1 + C S u   f S u , 1 ) A I , 1 + A R , 1
In addition, we define the constant:
n ( 1 W f ) ρ f q R = α ,
for later simplicity in notation. The relative supported population to a known reference is expressed by normalizing a potential future’s scenario population, P 2 , by a historical reference P 1 :
P 2 P 1   = α 1 α 2 [ ( C M f M , 2 + C S p f S p , 2 + f S u , 2 ) C S u A I , 2 + A R , 1 ( C M f M , 1 + C S p f S p , 1 + f S u , 1 ) C S u A I , 1 + A R , 1 ] ,  
assuming that the non-irrigated agricultural expansion is limited, resulting in A R , 1 = A R , 2 (the rainfed agricultural areas in the future scenario and the reference are equal). Equation (6) is combined with Equation (1) to complete a model that projects potential future supportable populations as a function of agricultural water use practices. This model contains two unknowns: the projected future supportable population P 2 , and C S u , the relative productivity of surface irrigated lands to rainfed lands. To close the model, an additional equation or relationship is required for C S u .
The relative productivity of rainfed vs. surface irrigated lands is constructed from available relationships and literature data. The starting point is the assertion that 20% of agricultural land is irrigated but that irrigated land produces 40% of the total food, globally [32,33]. We can express this statement mathematically as
0.2   P i r r i g a t e d A t o t a l = 0.4   P a v e r a g e A t o t a l ,
Thus, by inference, 80% of the agricultural land is not irrigated and that the non-irrigated (rainfed) land produces 60% of the food, globally. We can express this statement mathematically as
0.8   P r a i n f e d A t o t a l = 0.6   P a v e r a g e A t o t a l
Taking the ratio of Equations (7) and (8), we find
0.4   P a v e r a g e A t o t a l 0.6   P a v e r a g e A t o t a l = 0.2   P i r r i g a t e d A t o t a l 0.8   P r a i n f e d A t o t a l
This simplifies the productivity ratio between irrigated and rainfed agricultural lands (global average)
8 3 = P i r r i g a t e d P r a i n f e d
The productivity of irrigated agriculture is a composite of its constituent productivities. These are: the productivities of micro, sprinkler, and surface irrigation. We define these relative productivities individually as
p M i c r o = C M p S u r f a c e ,
p S p r i n k l e r = C S p p S u r f a c e ,  
And
p S u r f a c e = C S u p r a i n f e d ,
The total productivity of the irrigated land can then be expressed as an area-weighted sum of Equations (11)–(13)
C M C S u     P r a i n f e d A M A I + C S p C S u     P r a i n f e d A S p A I + C S u   P r a i n f e d A S u A I = P i r r i g a t e d ,  
which, when combined with Equation (7) becomes
C M C S u     P r a i n f e d A M A t o t a l + C S p   C S u   P r a i n f e d A S p A t o t a l + C S u   P r a i n f e d A S u A t o t a l P r a i n f e d = 8 3 .
Equation (15) is rearranged to express C S u as a function of known quantities
C S u = 8 3   ( 1 C M A M A t o t a l + C S p A S p A t o t a l + A S u A t o t a l )
This we use to find that C S u ( 2.37 , 2.57 ) if we use a full range of literature values associated with C M and C S p (Table 1). This is the value range for C S u that we report in Table 1.
The model is now closed, and a Monte Carlo simulation is performed [34]. The model outputs: the water demand and supportable populations are plotted for all possible permutations of area fractions for surface, sprinkler, and micro-irrigation. Some of these scenarios (e.g., 100% micro-irrigation) are unrealistic because an agriculturalist’s choice of irrigation method is often based on a range of economic issues, crop, economic, imposed restrictions, and cultivation methods, [35,36] access to capital, incentives, and risk [37,38], but are nonetheless included for completeness.

2.2. Objective 2: Historical Data

Historical scenarios of technological adoption and advancement were synthesized from available historical and literature sources (shown in the Supplemental Materials). Gaps in the dataset were filled with cubic spline interpolation in MatlabTM. Future rates of technological expansion were linearly extrapolated from the available data. The raw and interpolated data are available for inspection and use in Supplemental Materials.

Definition of Sustainability Horizon and Gap

The potential for sustainability increases as technology advances and efficiencies improve. Likewise, the demand for food is expected to increase with the growing population. Our future sustainability targets become harder to obtain as demand increases, whilst technological advancement can experience diminishing returns. Thus, we are technologically pursuing a sustainability target, but that target recedes into the future. If we consider the hypothetical situation whereby all exogenous factors remain constant (from a given starting point in time present, future, or past), then the sustainability target remains fixed. This sustainability target could potentially be met by many combinations of technologies. We define this ensemble of technological combinations as the sustainability horizon.
Permutations of the technological mix (percent of micro, sprinkler, and surface irrigation) can therefore be explored with the model constructed above. The technological combinations that satisfy the sustainability horizon definition can then be identified for any starting point. Technological starting points are gleaned from the historical data described above. The current pace of technological change can also be found from the historical data.
Finally, we can find the “technological distance” between any given start point and the closest point on the sustainability horizon. These technological distances are found as the shortest line between the start point and the sustainability horizon in the tertiary plots below. If we divide this technological distance by the rate of technological advancement, the result is the “sustainability gap”. The sustainability gap is the length of time required for the current rate of technological advancement to achieve sustainability if all exogenous factors remain constant.

3. Results and Discussion

3.1. Objective 3: Single Scenario Model Demonstration

The total potential water savings (Equation (1)), relative to 2019 levels, are plotted for all potential irrigation technology mixes (fraction of micro, sprinkler, and surface). The model results are plotted in a tertiary fashion because the total of the three respective technological fractions must add to 1. Of course, the greatest irrigation water savings (>50%) occurs when 100% of the farms adopt the most efficient technology (micro-irrigation). Conversely, negative water savings (additional demands) would result if 100% of the irrigated lands used surface irrigation (<−10%). The remaining potential water savings for the technological mix permutations are contained between these two extrema.
Prior studies have shown the benefits of irrigation expansion as a means to meet the nutritional needs of the global population or as a mitigation strategy for climate change, but only under the condition that the water is sourced sustainably [3,11]. Recall that 30% of the irrigation water in 2019 was drawn from unsustainable sources [13], a percentage that is within the bounds of the plot. Thus, we can conclude that there are technological mixes that would correspond to a sustainable irrigation volume in 2019, that is, there are irrigation mixes that would correspond to a 30% less irrigation water demand. This technological mix is represented by the black line in Figure 1. The historical trajectory of irrigation technology adoption is also plotted and projected to 2050 at current rates of technological adoption (Table S2). We see that the trend of technological adoption is toward increased water savings, but the current rate of technological adoption is not sufficient to reduce the irrigation demand to sustainable levels by 2050. The isoline at 30% reduction shows the minimum requirement to achieve water sustainability for 2019 levels. We expect this restriction to be more strict in the future as water is redirected as a result of climate change [10,13].
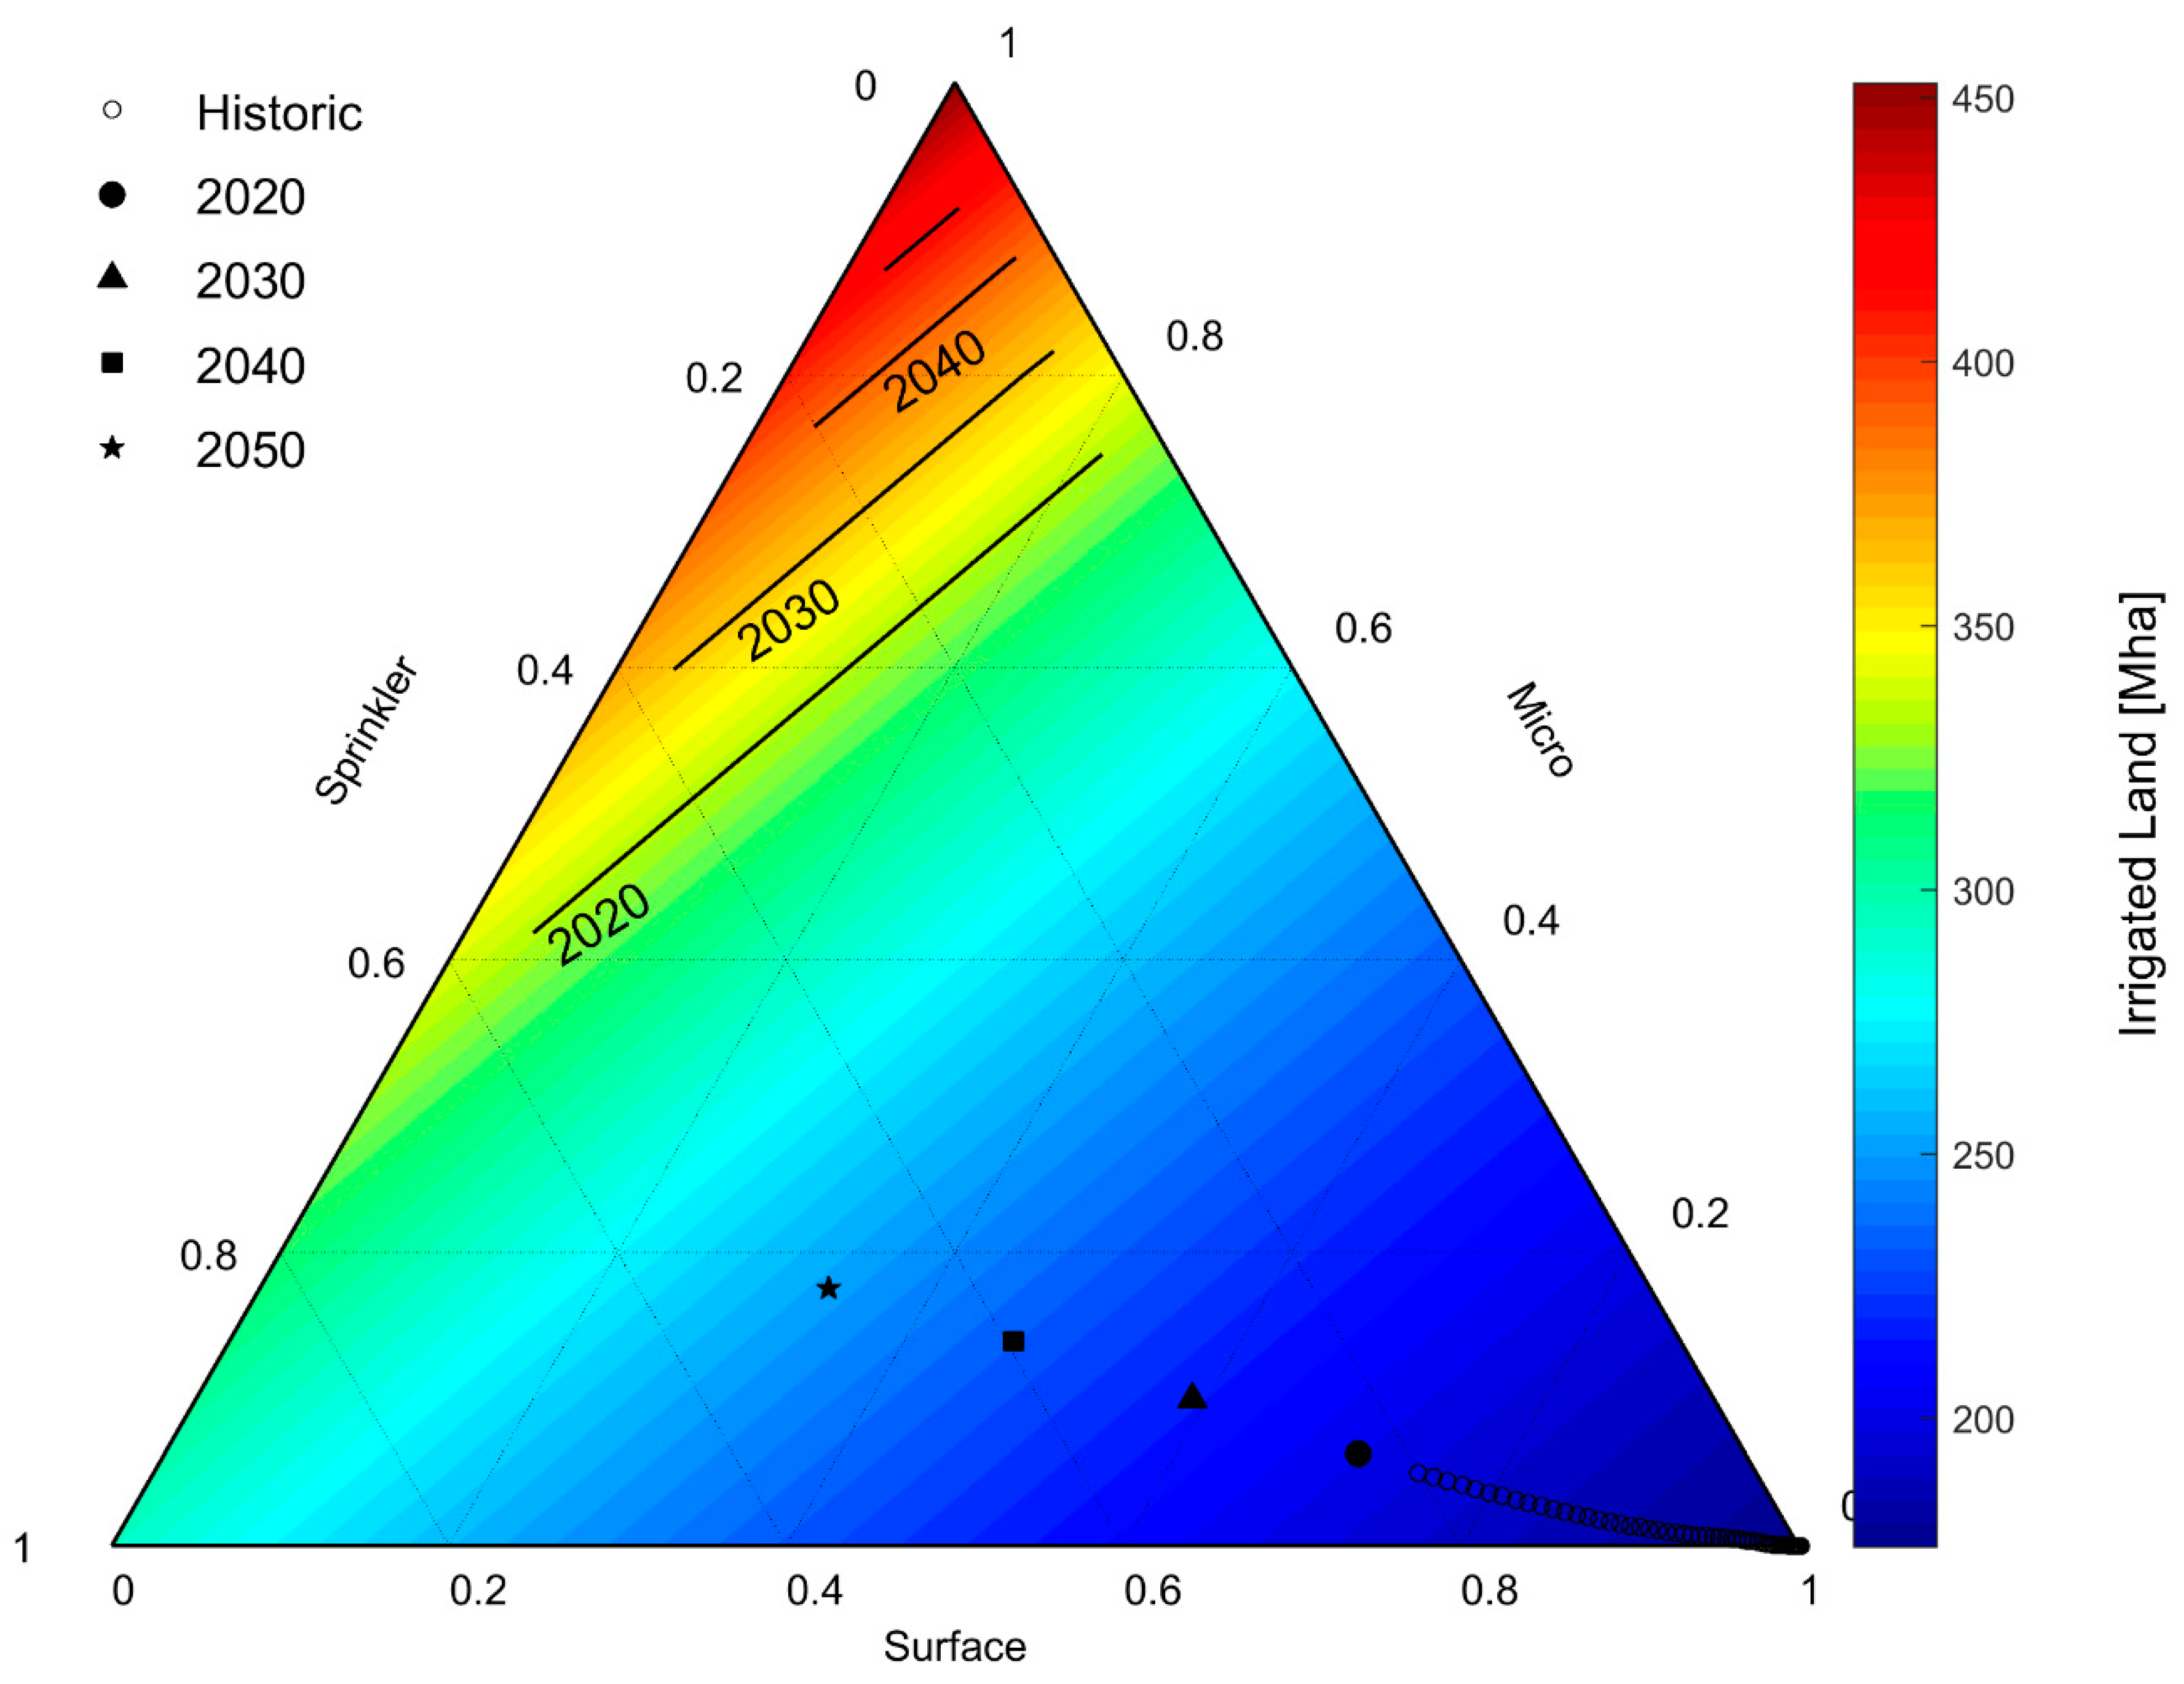
As we move from water consumption by agriculture to food production by agriculture we will assume that any additional irrigation savings beyond the water sustainability horizon (>30%) are assumed to expand the irrigated land area, a likely outcome [11]. As water savings increases, so can irrigated areas increase sustainably. We plot the total sustainable irrigated land as a function of the irrigation technology mix in Figure 2. Here, the second dataset of future projected irrigated areas [39] is plotted within the same framework. Note that all contemporary irrigated areas reside within the section of the plot above the location of the water sustainability threshold. This is because we have enforced within our model that expansion of irrigated areas must occur with sustainable irrigation water. Again, the historic and future trajectory of irrigation technology adoption is plotted for reference. From Figure 1 and Figure 2 we can see that the expansion of irrigated land is expected to outpace the adoption of more irrigation water efficient technologies.
As the total irrigated area expands, the global productivity per acre increases. This is because irrigated lands are more productive than non-irrigated, rainfed lands. Furthermore, micro-irrigated fields are more than sprinkler irrigated fields, and sprinkler irrigated fields are more productive than surface irrigated fields, generally. The total irrigated area, coupled with the productivity data, represents the full model formulation presented in the Methods Section. In Figure 3, we plot the total supportable population increases as the total agricultural productivity increases. To make this plot, some assumptions about the future trajectory of food consumption were made. We assumed continuing course outlook: 10% of the population does not receive sufficient nutrition [3], 25% of agricultural production is wasted [6], no alternative sources of calories are created, and limited action is taken on climate change. Figure 3 shows the supportable population as a function of the irrigation methods overlaid with isolines of the projected future population projections. These population isolines define the sustainability horizon.
Here, the total future supportable isolines are not as restricted (from an irrigation sustainability perspective) as the irrigated area lines in Figure 2. This is because of the increased productivity per hectare as we move to more efficient irrigation approaches. From this plot, we see that irrigation technology can play a significant role in the increase of the potential supported population, but there is a limit to contemporary irrigation technology’s potential. We also see that the distance between the projected technological mix (points) is advancing more slowly than the associated population projection. For example, the 2030 expected irrigation technology mix (black triangle) is closer to its sustainability horizon than the respective 2050 technological mix (star). That is, there is an ever-increasing gap between the current expected state of the system and the sustainable state of the system. For this paper, we call this the “sustainability gap”. Furthermore, the maximum supportable population estimate from this approach is ~10.5 billion which may be exceeded in the future. We cannot rely solely on existing technologies and current rates of technological adoption to satisfy the growing food needs of the world’s population.
The constructed model outputs suggest three key takeaways and one central inference (within the defined scenario and considering the model’s limitations) from Figure 1, Figure 2 and Figure 3. (1) Current rates of technological adoption in irrigation will not close the water sustainability gap in the next three decades even if the food demand remained stagnant (from Figure 1); (2) expansion of irrigated land is sustainably achievable in a macro sense (local water constraints and the disposition of resources are not tracked within this analysis), but this expansion can only be achieved through a rapid acceleration of irrigation efficiency (from Figure 2), and (3) global food sustainability will not be achievable after 2050 even if the most efficient micro-irrigation was adopted universally. We note that the sustainability gap for available water, land and food resources is widening through time across all three figures. We interpret this as an insufficient technological advancement and adoption velocity. That is, the sustainability horizon proceeds forward in time faster than we can ever catch.
Several assumptions were made to arrive at these findings, and all the model’s input parameters have errors and ranges of values as reported in the literature. For Figure 3, we used the median values in all cases. However, this does not give a complete picture. Changes in assumptions and model parameters (e.g., productivity of irrigated lands) would result in alternative structures within the results. We, therefore, perform a Monte Carlo simulations that randomly change the input parameters within their ranges (as defined by literature values, see Table 1). Two and a half million model run permutations were performed and analyzed for the scenario presented above in Figure 3. Within these plots, the sustainability gap, as a function of the year, fluctuated. For each permutation, the sustainability gap was recorded as a function of the year. The resulting potential ranges in the sustainability gap are presented in Figure 4a.
Figure 4a can be interpreted as the evolution of the agricultural system away from or toward sustainability. There are constraints on this future trajectory. Firstly, the system is bound by the limits of the plotting axis in Figure 3 (there cannot be more than 100% of any technological allocation). This “technological” limit is denoted by the red area. Secondly, the sustainability gap is measured from a point in time. As we progress through the model, and advance in time, the relative position of this starting point changes. This is the lower bound represented by the green area in the plot. The sustainability gap, as plotted, is the minima of the set of sustainability gaps within the ensemble of model results (grey zone). The full range of the potential model trajectories is plotted as the blue field. The model trajectories must overlap with the green zone (and subsequently force the sustainability gap to zero) if the system is to reach a projected sustainable state. Within Figure 4a, the sustainability gap grows in width from 2020 to about 2040, and then asymptotes to a constant width. This means that of the 2.5 million scenarios interrogated, exactly 0 become sustainable by 2050, and the sustainability gap is not closing. That is, we are not expected to make progress toward sustainability in the food production system under the “current course” scenario.

3.2. Objective 4: Exploring Alternative Technological Scenarios

Additional scenarios were then constructed. The scenarios are defined as follows: (a) current course, (b) optimistic climate, (c) optimistic food, (d) transformative agriculture innovation, (e) agrivoltaics, (f) optimistic food and agrivoltaics. The current course is the scenario as defined above. An optimistic climate assumes that additional irrigation is not required to mitigate the impacts of climate change. Optimistic food assumes that 100% of the people are fed, 10% of our calories come from alternative food sources, such as lab-created meat [40], insect protein [41], high protein seaweed [42], and food waste is halved. Transformative agriculture innovation assumes that water productivity of agriculture is increased through new management strategies: deficit irrigation, or vertical farming, or largescale greenhouse implementation. The agrivoltaic [43] scenario combines the transformative agriculture innovation scenario with the optimistic climate scenario. In addition, the optimistic food and agrivoltaics scenario combines the agrivoltaic scenario and the optimistic food scenario. Monte Carlo simulations for each scenario were performed with 2.6 million runs and randomized selection of model parameters within the bounds of the literature values. The sustainability gaps for each scenario, respectively, are presented in Figure 4a–f.
The optimistic climate scenario results, presented in Figure 4b, can be interpreted as follows. The reduced pressure on irrigation creates a set of scenarios slightly more optimistic than the current course scenario. Although the sustainability gap is not eliminated, the side of the gap begins to diminish between 2030 and 2040. We do conclude that climate action alone is insufficient to achieve sustainability by 2050 for any of the model runs. The optimistic food scenario is presented in Figure 4c. Within this plot, the sustainability gap is shorter than those of the previous two scenarios; however, no model trajectory closed the sustainability gap before 2050. The transformative agricultural change scenario’s results are presented in Figure 4d. Again, this action alone has no model trajectories that close the sustainability gap. We do observe that the sustainability gap is reduced the most by this scenario thus far.
Combinations of the above scenarios are presented in the remaining panels of Figure 4. The agrivoltaic scenario (a combination of the optimistic climate and transformative innovation scenarios) is the first in which a single model trajectory closed the sustainability gap. Although this is encouraging, the most desirable outcome would be if all model trajectories closed the sustainability gap. This can be seen in the agrivoltaic and optimistic food scenario (the most optimistic scenario overall). The model results indicate that any individual sustainability success (with climate change, with reduced food waste, or with new technological adoption) was not sufficient in isolation to close the sustainability gap. Rather, success in all areas was required.

4. Conclusions

The concept of the sustainability horizon and sustainability gap were useful tools to explore future trajectories of technological progress. These concepts could be expanded to other systems with dynamic demands and technological advances. In combination with a simplified production model (constructed from literature data), the analysis presented suggests that the current course of agriculture is not closing the sustainability gap and that action is needed in technological innovation, reduced food waste, alternative calorie sources, and climate change mitigation, collectively. Progress in isolation within each of these areas did not lead to a change of sufficient significance to close the sustainability gap by 2050. There is a potential pathway to sustainable agriculture and that pathway requires transformative innovations that increase the water productivity of our agricultural systems, widespread adoption of alternative calorie sources, and actions to reduce the impacts of climate change.
It is important to note that the results presented rely on a simplified model based on available literature data. Though this model is useful to study the trends of global agricultural sustainability, it does not contain or acknowledge the heterogenous nature of localized food production and food distribution networks. The model formulation also focused on the water limitations to global sustainable food production and there are other potential limitations to agricultural sustainability (e.g., arable lands).
Further research is also needed. The synthetic model created for this study relied on key variables as defined in the literature: production efficiency, water application efficiency, water productivity, irrigated areas, food wastage rates, and more. Further, these data were deployed dynamically, where possible. That is, they were allowed to change in time to reflect historical rates of change. These highly valuable data must be appended and expanded. Furthermore, one of the main conclusions of this study is that current agricultural and food system technologies are insufficient to address future needs. Applied research in technologies, agricultural practices that increase the efficiency of the food production system need to be created, vetted, and deployed. With the efficiency of these technologies known, the reduced-order model, derived for this study, could easily explore the macro-sustainability impact of new innovations.

Supplementary Materials

The following are available online at https://www.mdpi.com/article/10.3390/su13084328/s1, Table S1: Table 1. Global population, Agriculture land, Actual irrigated area, Rain-fed area, Surface irrigation, Localized irrigation, and Sprinkler irrigation, and Table S2. Fraction of irrigated area by technological category.

Author Contributions

Conceptualization, C.W.H. and H.A.A.-a.; methodology, H.A.A.-a.; software, C.W.H. and H.A.A.-a.; validation, C.W.H. and H.A.A.-a.; formal analysis, C.W.H. and H.A.A.-a.; investigation, H.A.A.-a. and C.W.H.; resources, C.W.H.; data curation, H.A.A.-a.; writing—original draft preparation, H.A.A.-a. and C.W.H.; writing—review and editing, H.A.A.-a., L.N., and C.W.H.; visualization, C.W.H. and H.A.A.-a.; supervision, C.W.H.; project administration, C.W.H.; funding acquisition, C.W.H. All authors have read and agreed to the published version of the manuscript.

Funding

This research was funded by US National Science Foundation NSF-GEO 1740082.

Institutional Review Board Statement

Not applicable.

Informed Consent Statement

Not applicable.

Data Availability Statement

Data attached.

Acknowledgments

The work was supported by the Ministry of Higher Education and Scientific Research and Al-Qasim Green University in Iraq through a government scholarship. The authors would like to thank Lloyd L. Nackley to review and editing the paper. This research was funded by US National Science Foundation NSF-GEO 1740082.

Conflicts of Interest

The authors declare no conflict of interest.

References

  1. Finley, J.W.; Seiber, J.N. The Nexus of Food, Energy, and Water. J. Agric. Food Chem. 2014, 62, 6255–6262. [Google Scholar] [CrossRef]
  2. FAO. Building a Common Vision for Sustainable Food and Agriculture; FAO: Roma, Italy, 2014. [Google Scholar]
  3. Hillebrand, E. Poverty, Growth, and Inequality Over The Next 50 Years. In Proceedings of the Expert Meeting How to Feed World, Rome, Italy, 24–26 June 2009; Volume 2050, pp. 159–190. [Google Scholar]
  4. Koohafkan, P.; Altieri, M.A. Globally Important Agricultural Heritage Systems a Legacy for the Future; Rome Food Agriculture Organization United Nations (FAO): Roma, Italy, 2018. [Google Scholar]
  5. Goudie, A.S. Human Impact on the Natural Environment, 8th ed.; John Wiley & Sons: Hoboken, NJ, USA, 2018. [Google Scholar]
  6. Olsson, L.; Barbosa, H.; Bhadwal, S.; Cowie, A.; Delusca, K.; Flores-Renteria, D.; Hermans, K.; Jobbagy, E.; Kurz, W.; Li, D. 2019: Land Degradation. In Climate Change and Land: An IPCC Special Report on Climate D.J. Sonwa, L. Stringer, and Greenhouse Gas Fluxes in Change, Desertification, Land Degradation, Sustainable Land Management, Food Security, P.Z. Terrestrial Ecosystems; Shukla, P.R., Skea, J., Buendia, E.C., Masson-Delmotte, V., Pörtner, H.-O., Roberts, D.C., Slade, J.P.P.R., Connors, S., van Diemen, R., Ferrat, M., et al., Eds.; 2019, in press. Vyas, P.; Huntley, E.; Kissick, K.; Belkacemi, M.; Malley, J.; Land Degradation: IPCC Special Report on Climate Change, Desertification, Land 5 Degradation, Sustainable Land Management, Food Security, and 6 Greenhouse gas fluxes in Terrestrial Ecosystems; The Intergovernmental Panel on Climate Change: Geneva, Switzerland, 2019; p. 5043189. [Google Scholar]
  7. Kukal, M.S.; Irmak, S. Climate-Driven Crop Yield and Yield Variability and Climate Change Impacts on the U.S. Great Plains Agricultural Production. Sci. Rep. 2018, 8, 3450. [Google Scholar] [CrossRef] [Green Version]
  8. Flavelle, B.C. Climate Change Threatens the World’s Food Supply; United Nations Warns; The New York Times: New York, NY, USA, 2019. [Google Scholar]
  9. Malek, K.; Adam, J.C.; Stöckle, C.O.; Peters, R.T. Climate change reduces water availability for agriculture by decreasing non-evaporative irrigation losses. J. Hydrol. 2018, 561, 444–460. [Google Scholar] [CrossRef]
  10. Turral, H.; Burke, J.; Faurès, J.M. Climate Change, Water and Food Security; Water Reports, No. 36; Food and Agriculture Organization of the United Nations (FAO): Rome, Italy, 2011; p. 174. [Google Scholar]
  11. Grafton, R.Q.; Williams, J.; Perry, C.J.; Molle, F.; Ringler, C.; Steduto, P.; Udall, B.; Ann Wheeler, S.; Wang, Y.; Garrick, D.; et al. The paradox of irrigation efficiency. Science 2018, 361, 748–750. [Google Scholar] [CrossRef] [PubMed] [Green Version]
  12. Villalobos, F.J.; Fereres, E. Principles of Agronomy for Sustainable Agriculture; Springer: New York, NY, USA, 2016; p. 443457. [Google Scholar]
  13. Liu, J.; Hertel, T.W.; Lammers, R.B.; Prusevich, A.; Baldos UL, C.; Grogan, D.S.; Frolking, S. Achieving sustainable irrigation water withdrawals: Global impacts on food security and land use. Environ. Res. Lett. 2017, 12, 104009. [Google Scholar] [CrossRef]
  14. Owen, J. Farming Claims Almost Half Earth’ s Land, New Maps Show. Natl. Geogr. News 2005, 9, 100–125. [Google Scholar]
  15. UNESCO. The United Nations World Water Development Report 3: Water in a Changing World; UNESCO/Earthscan: Paris, France; London, UK, 2009. [Google Scholar]
  16. Rosegrant, M.W.; Cai, X.; Cline, S.A.; Nakagawa, N. The Role of Rainfed Agriculture in the Future of Global Food Production; No. 581-2016-39482; International Food Policy Research Institute: Washington, DC, USA, 2002. [Google Scholar]
  17. Mateos, L. Irrigation Systems BT—Principles of Agronomy for Sustainable Agriculture; Villalobos, F.J., Fereres, E., Eds.; Springer International Publishing: Cham, Switzerland, 2016; pp. 255–267. [Google Scholar]
  18. Chimonides, S.J. Irrigation management under water shortage conditions. In Proceedings of the EWRA 95 Symposium, Nicosia, Cyprus, 14–18 March 1995; pp. 73–78. [Google Scholar]
  19. Ibragimov, N.; Evett, S.R.; Esanbekov, Y.; Kamilov, B.S.; Mirzaev, L.; Lamers, J.P.A. Water use efficiency of irrigated cotton in Uzbekistan under drip and furrow irrigation. Agric. Water Manag. 2007, 90, 112–120. [Google Scholar] [CrossRef]
  20. O’Neill, C.J.; Humphreys, E.; Louis, J.; Katupitiya, A. Maize productivity in southern New South Wales under furrow and pressurised irrigation. Aust. J. Exp. Agric. 2008, 48, 285–295. [Google Scholar] [CrossRef]
  21. Humphreys, E.; White, R.J.G.; Smith, D.J.; Godwin, D.C. Evaluation of strategies for increasing irrigation water productivity of maize in southern New South Wales using the MaizeMan model. Aust. J. Exp. Agric. 2008, 48, 304–312. [Google Scholar] [CrossRef]
  22. Al-agele, H.A.; Proctor, K.; Murthy, G.; Higgins, C. A Case Study of Tomato (Solanum lycopersicon var. Legend) Production and Water Productivity in Agrivoltaic Systems. Sustainability 2021, 13, 2850. [Google Scholar] [CrossRef]
  23. Thompson, R.B.; Incrocci, L.; van Ruijven, J.; Massa, D. Reducing Contamination of Water Bodies from European Vegetable Production Systems; Elsevier: Amsterdam, The Netherlands, 2020. [Google Scholar]
  24. Berkhout, P.; van Bruchem, C. Agricultural Economic Report 2009 of the Netherlands: Summary; No. 2009-066; LEI WUR: The Hague, The Netherlands, 2009. [Google Scholar]
  25. Parod, R.W.; Provaznik, R.E.; Cook, K.I. Automated Adjustable Drop Hose for Mechanized Irrigation. U.S. Patent 9,974,245, 22 May 2018. [Google Scholar]
  26. Al-agele, H.A.; Mahapatra, D.M.; Prestwich, C.; Higgins, C.W. Dynamic Adjustment of Center Pivot Nozzle Height: An Evaluation of Center Pivot Water Application Pattern and the Coefficient of Uniformity. Appl. Eng. Agric. 2020, 36, 647–656. [Google Scholar] [CrossRef]
  27. AL-agele, H.A.A.; Nackley, L.; Higgins, C. Testing Novel New Drip Emitter with Variable Diameters for a Variable Rate Drip Irrigation. Agriculture 2021, 11, 87. [Google Scholar] [CrossRef]
  28. Shamshery, P.; Wang, R.Q.; Tran, D.V.; Winter, V.A.G. Modeling the future of irrigation: A parametric description of pressure compensating drip irrigation emitter performance. PLoS ONE 2017, 12, e0175241. [Google Scholar] [CrossRef] [PubMed]
  29. Gustavsson, J.; Cederberg, C.; Sonesson, U.; Van Otterdijk, R.; Meybeck, A. Global Food Losses and Food Waste; FAO: Rome, Italy, 2011. [Google Scholar]
  30. Siebert, S.; Döll, P. Quantifying blue and green virtual water contents in global crop production as well as potential production losses without irrigation. J. Hydrol. 2010, 384, 198–217. [Google Scholar] [CrossRef]
  31. Siebert, S.; Kummu, M.; Porkka, M.; Döll, P.; Ramankutty, N.; Scanlon, B.R. A global data set of the extent of irrigated land from 1900 to 2005. Hydrol. Earth Syst. Sci. 2015, 19, 1521–1545. [Google Scholar] [CrossRef] [Green Version]
  32. Sivanappan, R.K. Irrigation Water Management for Sugarcane; Vasantdada Sugar Institute: Maharashtra, India, 1998; p. II. [Google Scholar]
  33. Rudnick, D.; Irmak, S. Impact of water and nitrogen management strategies on maize yield and water productivity indices under linear-move sprinkler irrigation. Trans. ASABE 2013, 56, 1769–1783. [Google Scholar]
  34. Press, W.H.; William, H.; Teukolsky, S.A.; Saul, A.; Vetterling, W.T.; Flannery, B.P. Numerical Recipes 3rd Edition: The Art of Scientific Computing; Cambridge University Press: Cambridge, UK, 2007. [Google Scholar]
  35. Turner, R.K.; Georgiou, S.; Clark, R.; Brouwer, R.; Burke, J.J. Economic Valuation of Water Resources in Agriculture: From the Sectoral to a Functional Perspective of Natural Resource Management; Food and Agriculture Organization of the United Nations: Roma, Italy, 2004. [Google Scholar]
  36. Parlin, B.W. Farmer Participation And Irrigation Organization; CRC Press: Boca Raton, FL, USA, 2019. [Google Scholar]
  37. O’Brian, D.M.; Lamm, F.R.; Stone, L.R.; Rogers, D.H. The Economics of Converting from Surface to Sprinkler Irrigation for Various Pumping Capacities. 2000. Available online: http://hdl.handle.net/2097/21774 (accessed on 10 December 2020).
  38. Nakawuka, P.; Langan, S.; Schmitter, P.; Barron, J. A review of trends, constraints and opportunities of smallholder irrigation in East Africa. Glob. Food Sec. 2018, 17, 196–212. [Google Scholar] [CrossRef]
  39. Okada, M.; Iizumi, T.; Sakamoto, T.; Kotoku, M.; Sakurai, G. Earth’s Future Varying Bene fits of Irrigation Expansion for Crop Production Under a Changing Climate and Competitive Water Use Among Crops. Earth’s Future 2018, 9, 1207–1220. [Google Scholar] [CrossRef]
  40. Murray, A. Meat cultures: Lab-grown meat and the politics of contamination. Biosocieties 2018, 13, 513–534. [Google Scholar] [CrossRef]
  41. Liceaga, A.M. Approaches for Utilizing Insect Protein for Human Consumption: Effect of Enzymatic Hydrolysis on Protein Quality and Functionality. Ann. Entomol. Soc. Am. 2019, 112, 529–532. [Google Scholar] [CrossRef]
  42. Fleurence, J.; Morançais, M.; Dumay, J. 9—Seaweed Proteins. In Proteins in Food Processing; Woodhead Publishing: Sawston, Cambridge, UK, 2018; pp. 245–262. [Google Scholar]
  43. Adeh, E.H.; Selker, J.S.; Higgins, C.W. Remarkable agrivoltaic influence on soil moisture, micrometeorology and water-use efficiency. PLoS ONE 2018, 13, e0203256. [Google Scholar]
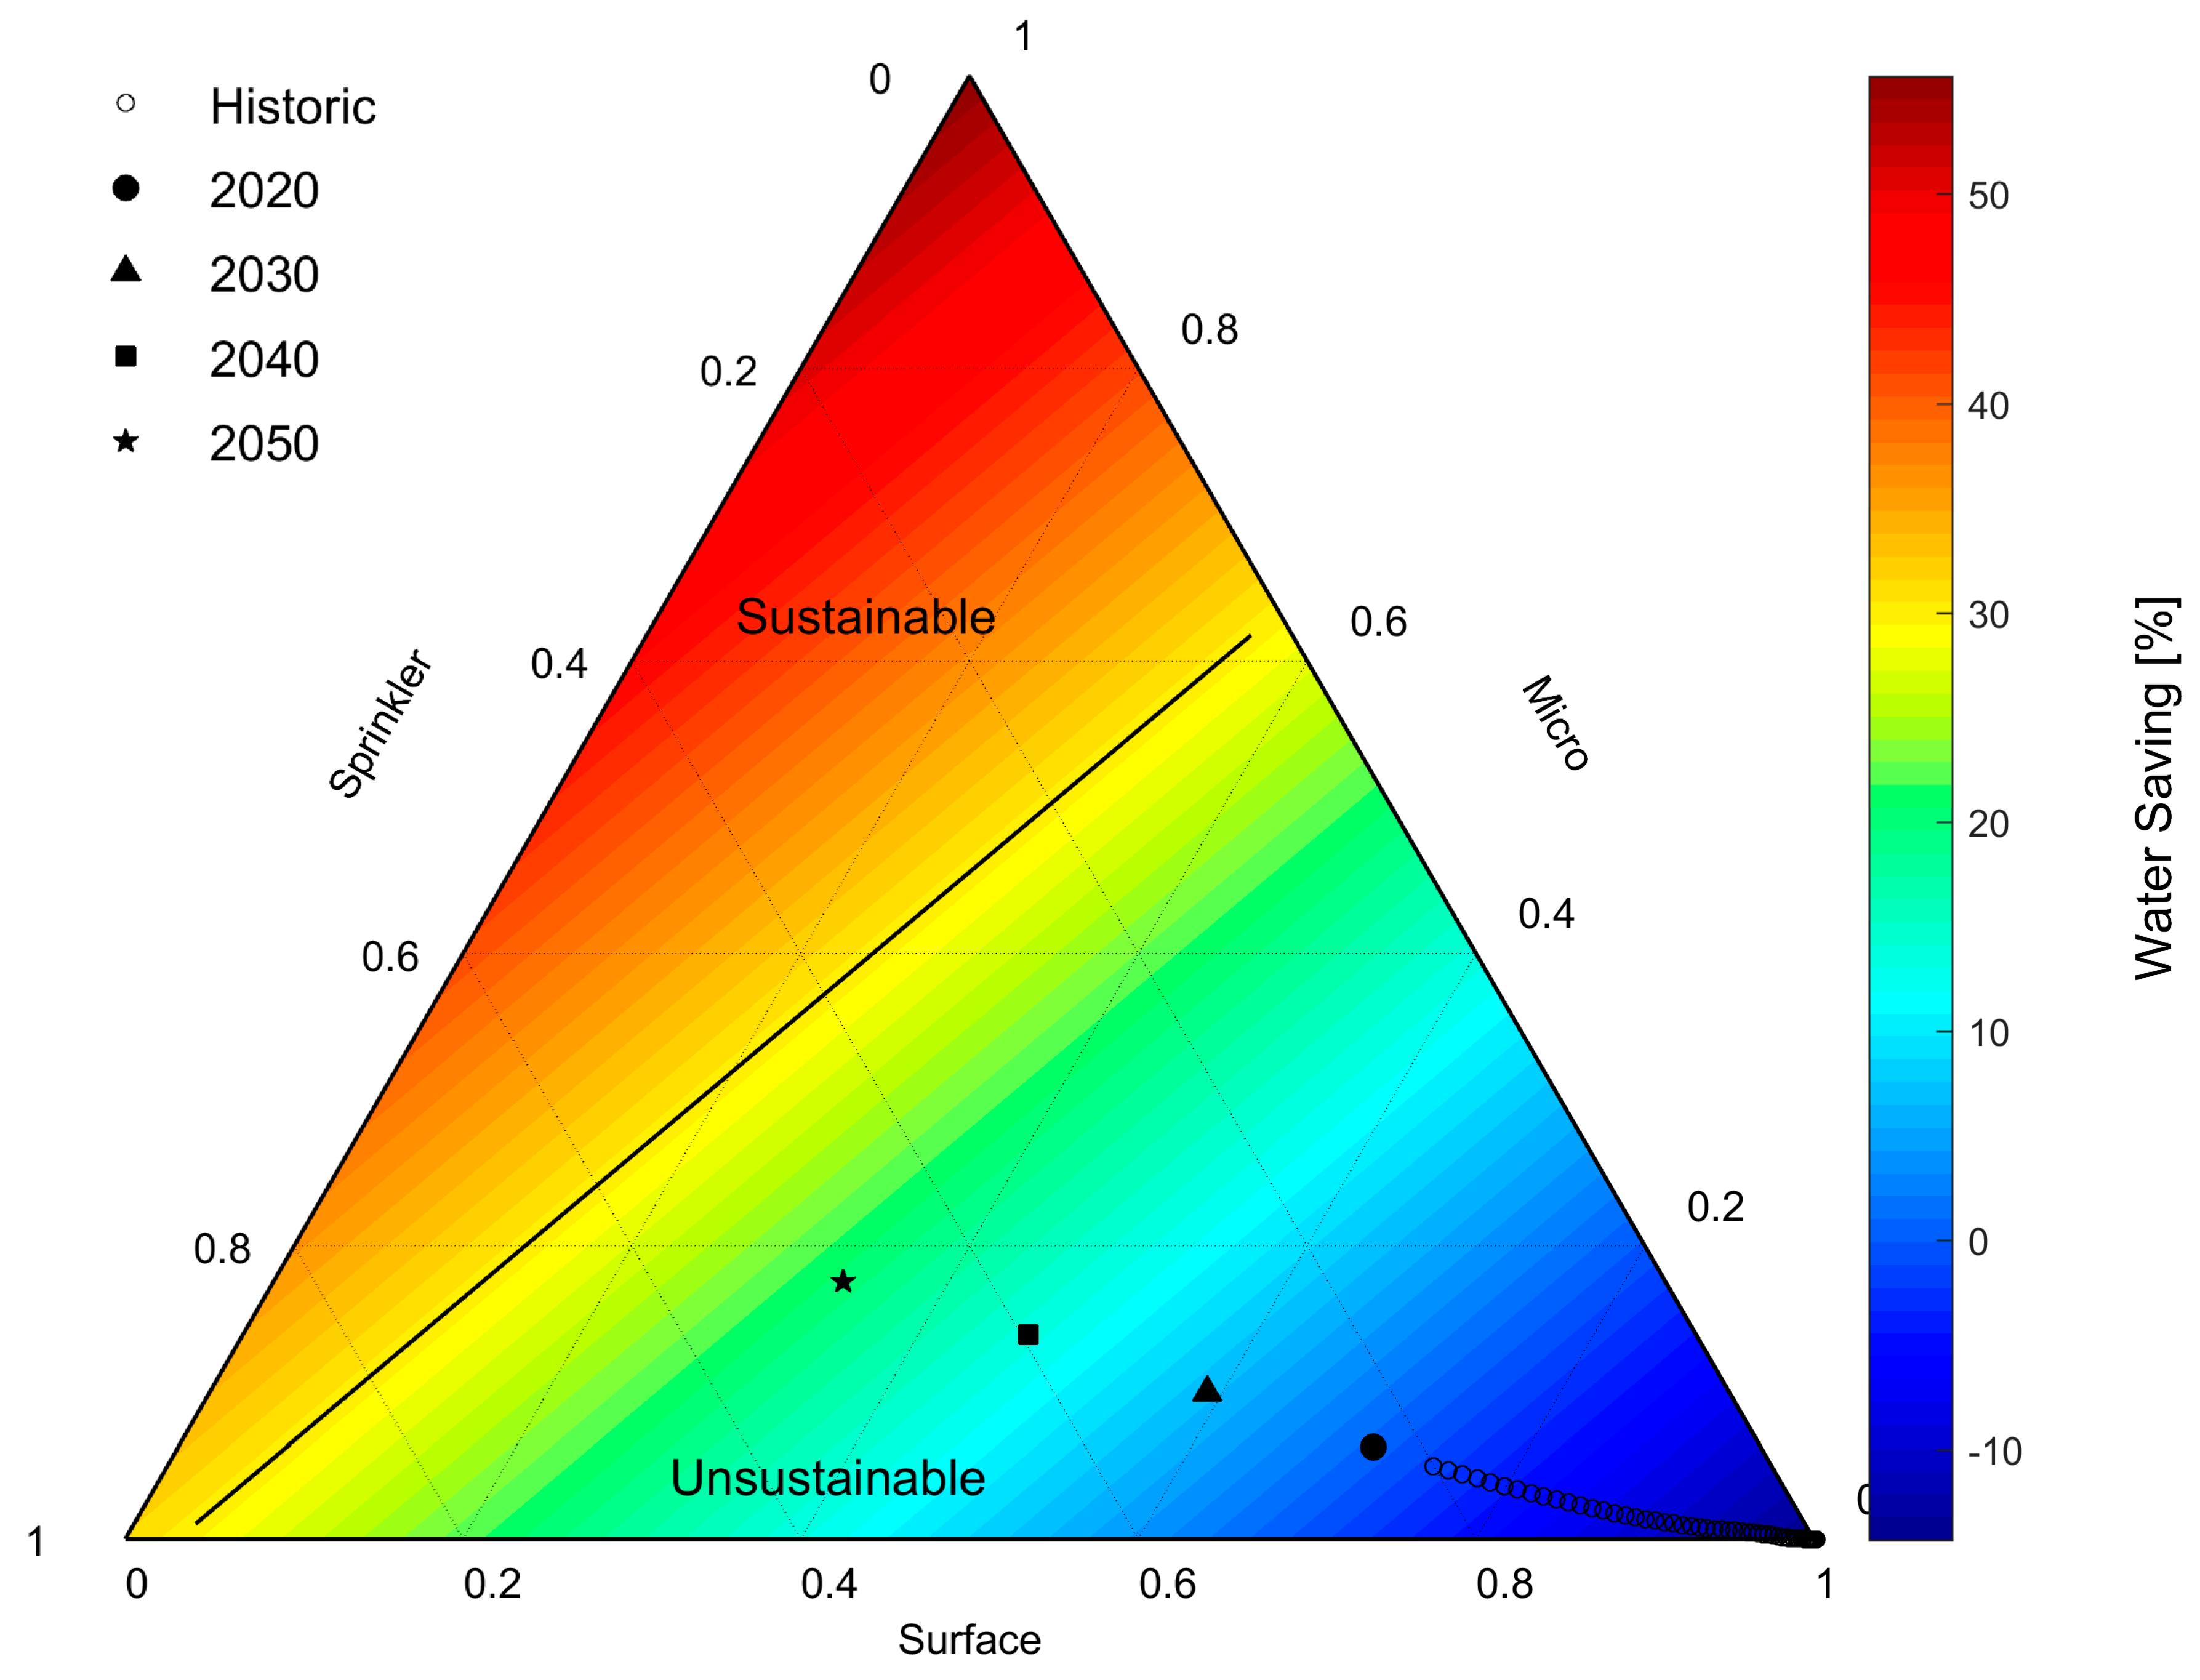
Figure 1. Water savings in the future for irrigation technology scenarios.
Sustainability 13 04328 g001
Figure 2. Irrigated land expansion with imposed water constraint for irrigation technology scenarios.
Sustainability 13 04328 g002
Figure 3. Supportable population as a function of irrigation methods with isolines of the projected populations into the future.
Sustainability 13 04328 g003
Figure 4. Sustainability horizon ranges for (a) current course, (b) optimistic climate, (c) optimistic food, (d) transformative agricultural change, (e) agrivoltaic, and (f) agrivoltaic and alternative food.
Sustainability 13 04328 g004
Table 1. Irrigation efficiencies and relative productivity by irrigation class.
ParameterValue RangeReferences
E M 0.80–0.90[28]
E S p 0.50–0.60[28]
E S u 0.30–0.35[28]
C M 1.2–1.9[29]
C S p 1.12–1.40[30]
C S u 2.37–2.57[15,16]
Publisher’s Note: MDPI stays neutral with regard to jurisdictional claims in published maps and institutional affiliations.