1. Introduction
A city as a system constitutes an important area of functioning for people. It provides space for work, living, leisure, and shopping, as well as cultural life. Predominantly, it may facilitate fulfillment of many life needs of its residents, as well as other city users (visitors or entrepreneurs), ensuring appropriate conditions for that [
1]. Such life needs in particular include the need for efficient transport and access to a wide range of consumer goods, as well as resources. Due to that, the transport function is one of the major tasks of any city.
Contemporary cities constitute a huge market for distribution companies focused on meeting the needs in the area of deliveries of goods, parcels/consignments, and stocks replenishment, among other things [
2]. Most measures taken by the public sector with regard to urban freight transport are aimed at reducing the negative social and environmental effects resulting from transport activities. To that end, decision-makers dealing with the transport policy take up numerous initiatives that concentrate on the physical infrastructure, road traffic, vehicle design, or basic logistic operations. However, the organization of freight traffic is often chaotic and uncoordinated, which is a result of the lack of analyses regarding, e.g., the traffic levels in specific hours [
3]. It is the task of urban logistics to address any problems related to deliveries made within city areas. Properly organized deliveries of goods and services, which form the basis of commercial activity, can make urban transport an important element that ensures the city’s economic development. An efficient freight transport system plays a fundamental role in increasing the region’s competitiveness. It also streamlines the functioning of supply chains, where the basic factor of success (achieving a competitive advantage) is meeting the timeliness requirements of the customers. The majority of transport in urbanized areas is generated by industrial, commercial, and service companies [
3].
For the purposes of this article, the adopted definition of urban logistics is the one conceived by E. Taniguchi [
4], according to which it is the process for totally optimizing the logistics and transport activities by private companies in city areas, considering the traffic environment, the traffic congestion and the energy savings within the framework of a market economy. Urban deliveries play a key role in the functioning of cities, being a decisive factor of their competitiveness, and they have a direct impact on the life quality perceived by city residents and users [
5,
6]. Following that, urban logistics is focused on urban freight transport (UFT), defined as “the delivery of consumer goods (not only by retail but also by other sectors, such as manufacturing) in city and suburban areas, including the reverse flow of used goods in terms of clean waste” [
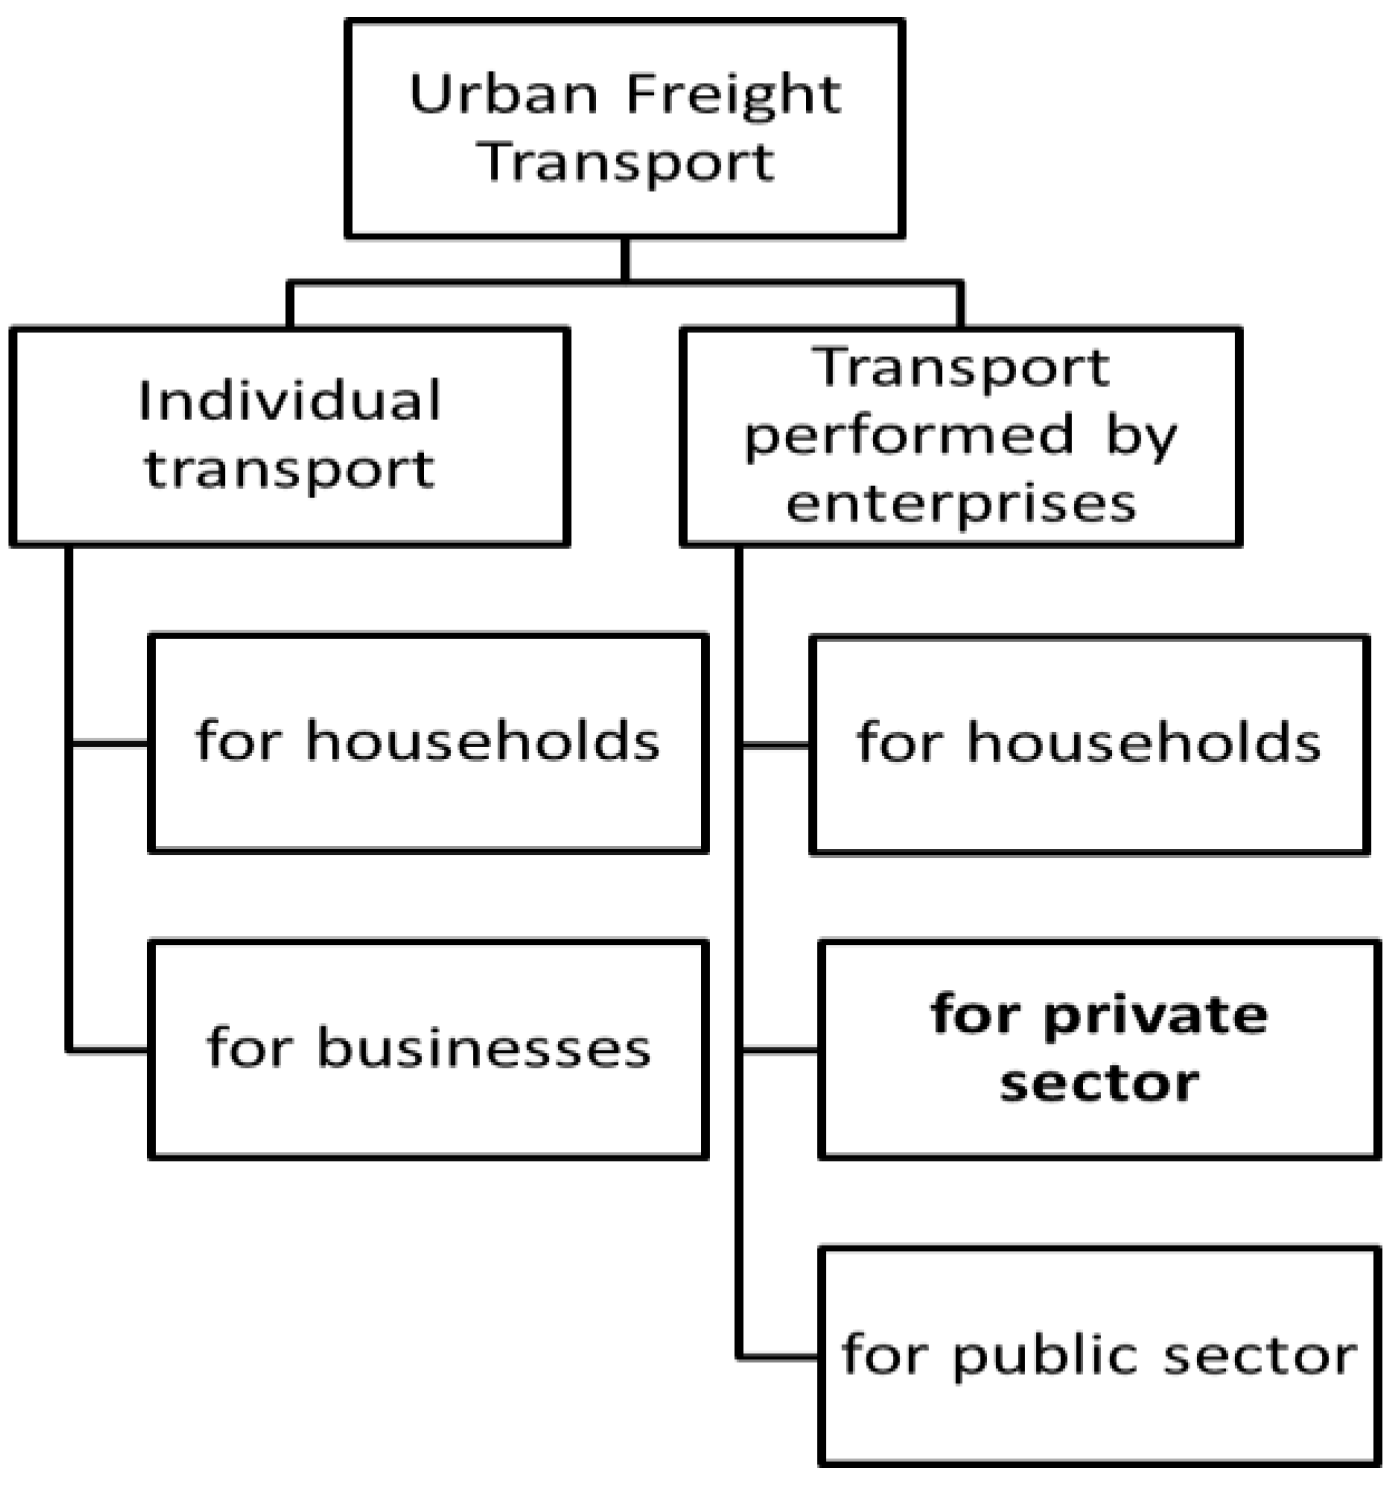
7]. Nevertheless, urban logistics significantly constitutes the last element of a supply chain which comprises deliveries to the end consumer, referred as last mile deliveries. It should be underlined that last mile deliveries focus on both household deliveries being the outcome of commercial transactions (most often online shopping) and deliveries necessary for day-to-day business of enterprises operating within the city (i.e., deliveries of goods, components, parts, consumables, documents, postal delivery services, etc.) [
8,
9]. Considering the delivery realization, urban freight transport may be divided into two main categories (
Figure 1):
individual transport, including transport:
- ○
to meet the needs of households (which usually pertains to deliveries of products purchased by individual consumers and made to their home addresses);
- ○
to meet the needs of businesses (predominantly deliveries of supplies to shops, service outlets, catering outlets, etc., made individually by owners of such entities);
commercial transport (provided by third-party, commercial carriers), including:
- ○
deliveries of goods to households (i.e., delivering the products purchased by individual customers in online stores);
- ○
deliveries to meet the needs of the private sector, including any and all deliveries made to business entities (shops, enterprises, service outlets, etc.);
- ○
deliveries to meet the needs of the public sector, including any and all deliveries made to administration entities and other non-commercial entities (schools, colleges, hospitals, etc.).
Despite many problems generated by freight transport within the cities (like congestion, pollution, noise, etc.), it cannot be eliminated. Due to that, it must be managed in a systemic manner, while bearing in mind that any activities taken within cities should be performed in compliance with the principles of sustainability [
10,
11]. The tasks faced by urban logistics stakeholders include, first and foremost, improvement of life quality for the city community in economic, social, and ecological terms [
1]. The research studies completed over the past several years have confirmed that sustainable UFT should, therefore, be defined as a system that meets the following objectives [
12]:
guarantees transport accessibility for UFT;
reduces pollutant emissions and noise to the level that does not have an adverse effect on human health and the natural environment;
seeks energy efficiency and cost efficiency of urban freight transport, taking into account the external costs;
participates in improving the attractiveness and quality of living in a city by reducing the number of accidents.
The objectives mentioned above are one of the most important challenges for urban logistics stakeholders, especially considering the increasing number of home deliveries, realized under e-commerce.
It should be mentioned that different expectations of e-commerce stakeholders generates many problems for urban logistics managers, especially in the context of city users’ needs and their quality of life. The clients expect that the parcels will be delivered directly to their household fast and on preferred delivery times; on the other hand, it is hard for freight carriers to establish the delivery schedules to fully fulfill that [
13,
14]. It resulting with significant number of failed deliveries. Next, it influences on lower efficiency of delivery processes. Today, there is a lack of broaden approach and methodology to support urban logistics managers in this context. To fulfill this gap, the purpose of this paper is to apply the Six Sigma method as a support in last mile delivery management.
Six Sigma is considered to be one of the latest quality management concepts. It was developed by Bob Galvin and Bill Smith, who, in the 1980s, implemented it in Motorola [
15]. Management based on the Six Sigma principles was first applied in production operations [
16], but, now, it is successfully used in other areas, such as: hotel industry [
17], services [
18], and finance [
19], as well as logistics. The in-depth analysis of the studies of Tjahjano [
20] or De Carvalho [
21] provides for a possibility of applying the Six Sigma method in logistics processes. The examples of logistic processes management on the basis of Six Sigma are related particularly to production logistics [
22] or supply chain management [
23,
24]. Additionally, Cheng described the use of Six Sigma in process assessment by the Chinese postal service provider China Express [
25]. In addition, the use of Six Sigma in process improvement is declared by, among others, DHL or FedEx [
26]. Moreover, taking to the account the city environment and sustainability, in 2000, the city of Fort Wayne was the first that successfully implemented the Six Sigma concept in city management [
27]. In addition,, Shokri [
28] pointed out the implementation of Six Sigma in green production. It should be mentioned that utilization of Six Sigma method brings significant financial benefits to the organization. Interesting results related to the usefulness of Six Sigma in service delivery were introduced in [
29,
30]. Nevertheless, the examples mentioned above are not directly related to the urban logistics, especially considering the last mile deliveries specificity. Since it is possible to manage a city according to Six Sigma, as well as logistics processes, there are reasons to verify the possibility of managing urban logistics processes based on Six Sigma in the context of deliveries to the final client on the last mile of delivery process.
The Authors express their conviction that the Six Sigma method could be efficient approach in the last mile delivery processes’ analysis in the context of their efficiency. It helps positioning the customer satisfaction level and quantify the delivery processes defects, related to the failed deliveries. The presented case study will make it possible to introduce the possibilities of applying some selected tools used in Six Sigma method to evaluate some processes taking place in last mile delivery. Implementation of this method may bring numerous benefits, such as increased customer satisfaction, higher quality of goods, greater reliability and stability of processes, elimination of time wasting, and improved efficiency and enhanced flexibility of the system, as well as reduced operating costs.
The structure of the paper is based on four sections. Firstly, the Authors introduced the methodological assumptions. Next, the general Six Sigma background has been presented. The research section includes the chosen case study related to the last mile delivery in the chosen city: Szczecin, Poland. The last part of the paper is focused on general conclusions and case study analysis results, as well as the future work direction.
2. Research Methodology
The general methodological assumptions for the work introduced in the paper was to analyze the chosen last mile delivery processes in the context of their efficiency. In the process quality context, the major quantifier of the mentioned above processes efficiency is the number of failed deliveries. According to that, this aspect was taken to the account as a reference for the analysis realized in the research.
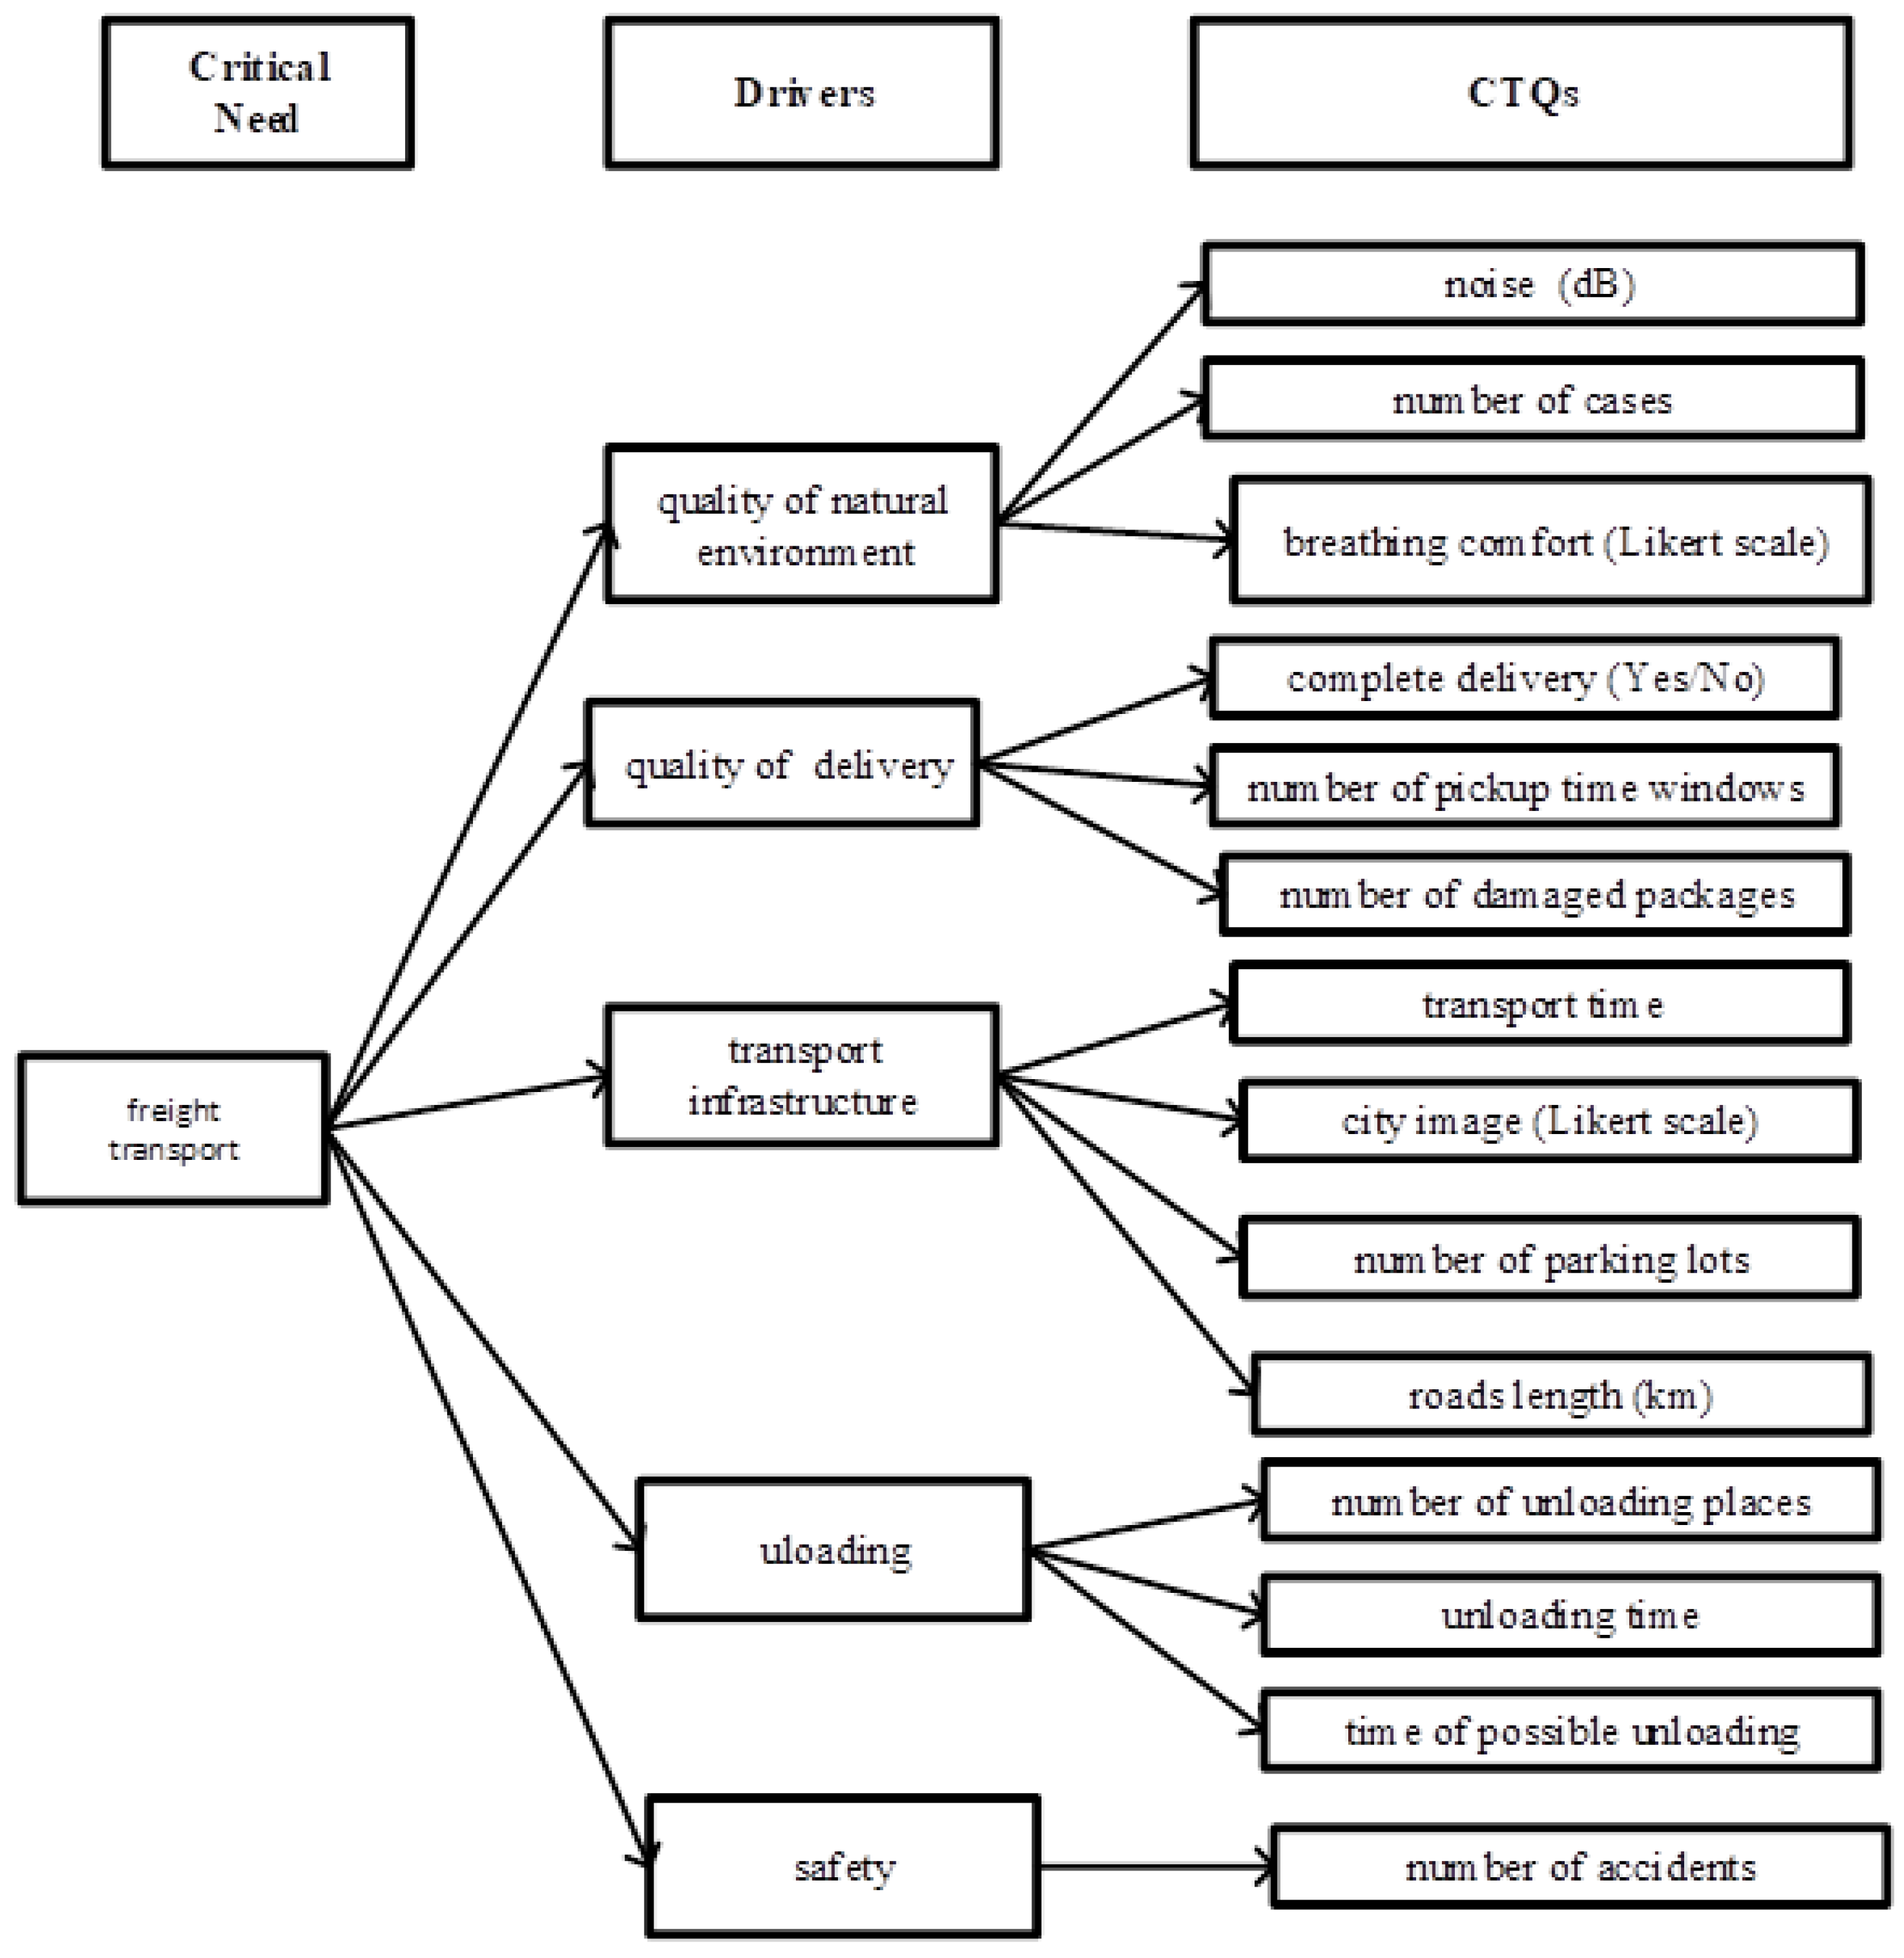
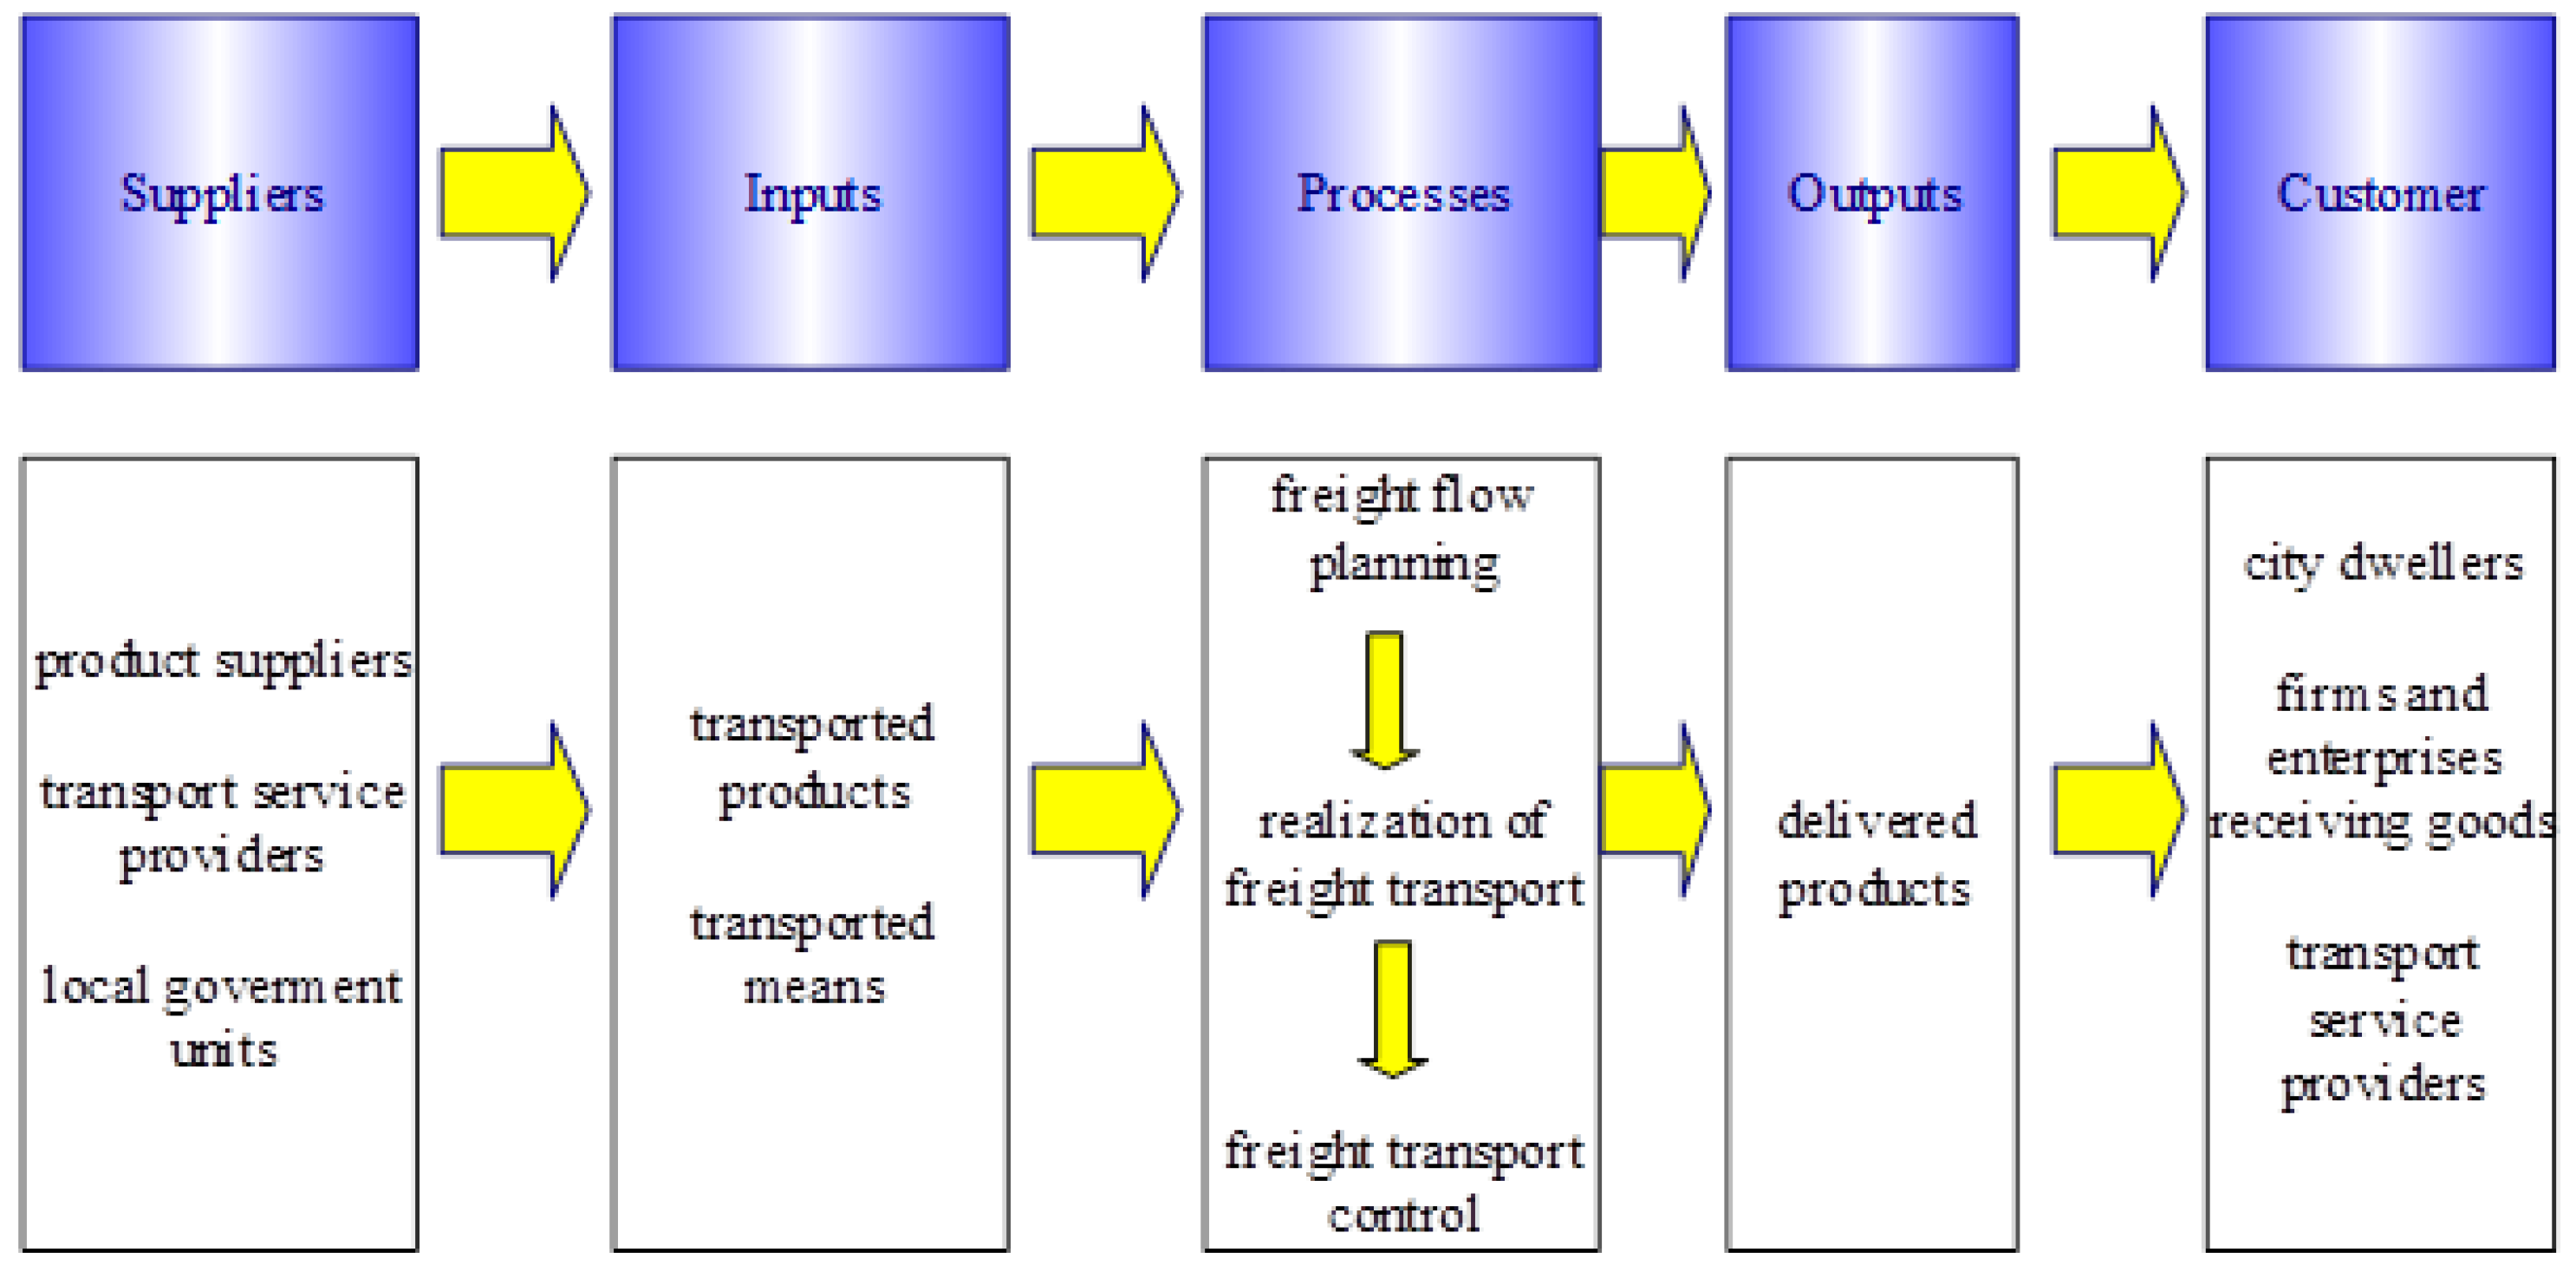
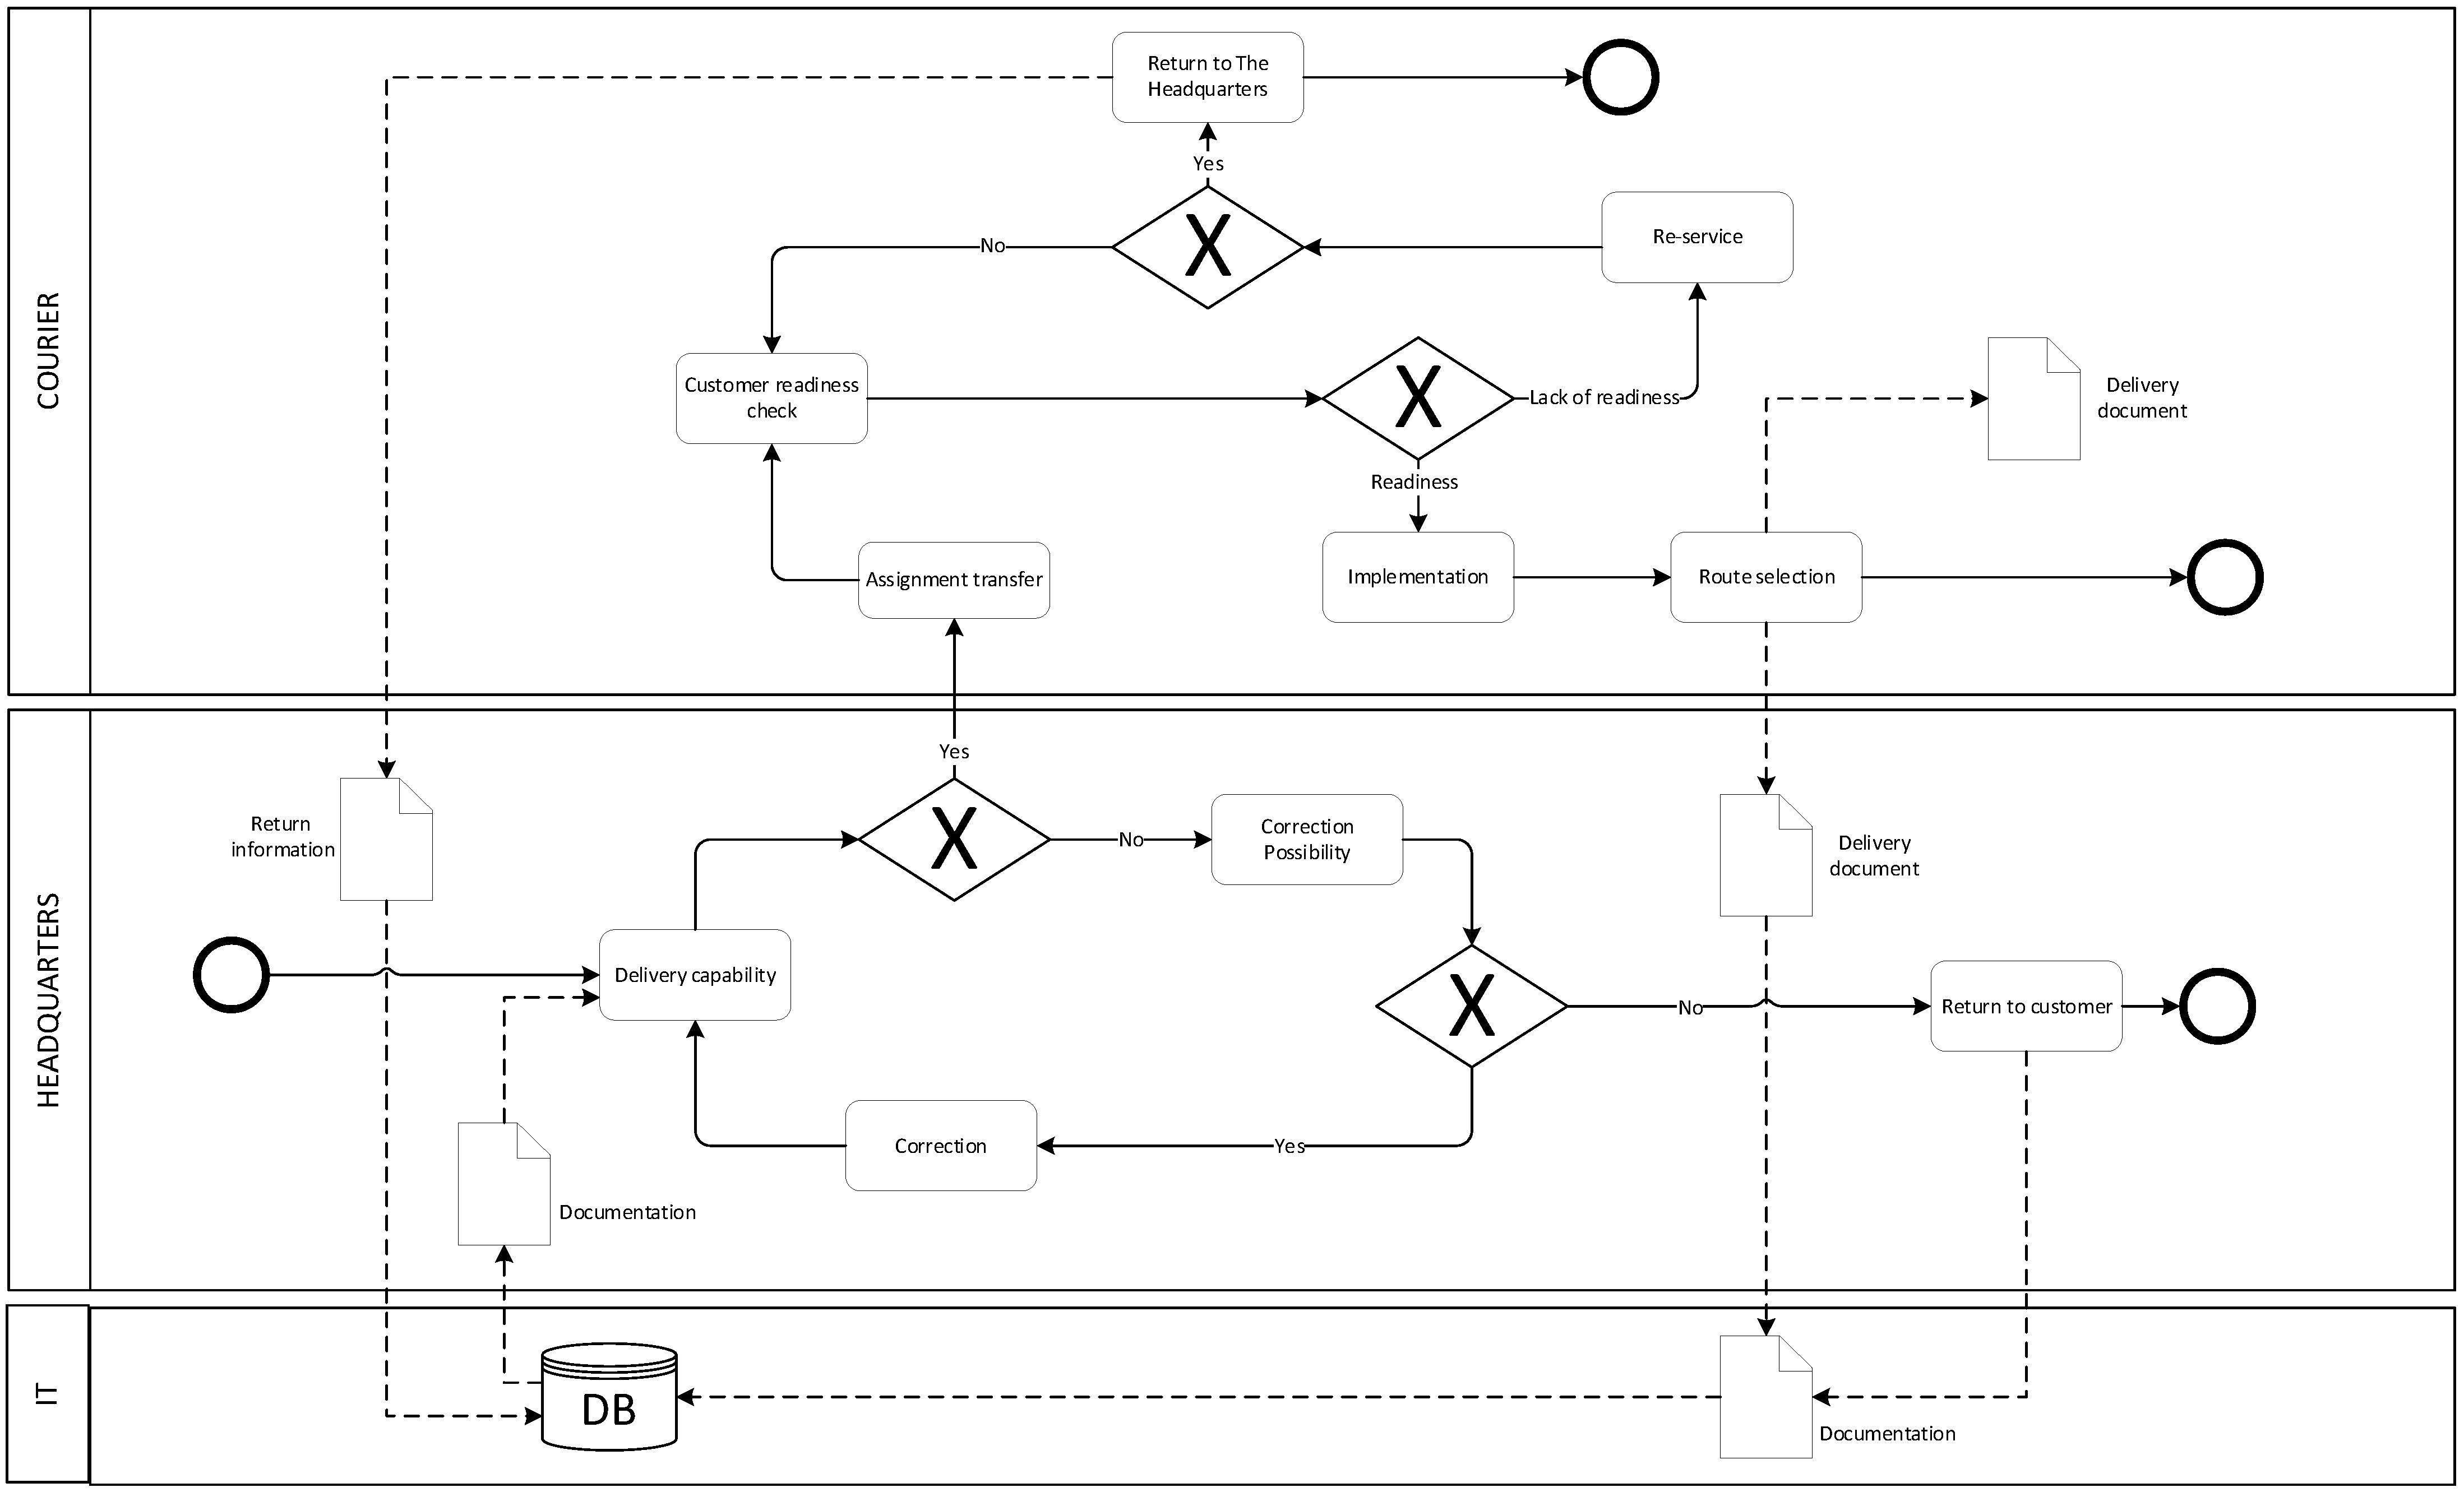
During the first stage of the work, the urban logistics processes were mapped, and the processes client and its needs were defined. To that end, a SIPOC (Supplier Input Process Output Client) diagram was applied along with BPMN (Business Process Model and Notation) mapping and a CTQ (Critical to Quality) tree. The client’s needs were defined based on the literature review.
Next, the case study method has been applied as a research approach for the work. Case study method helps to identify and analyze the processes in the real environment. This method gives the practical drivers and better analyzed area understanding. Moreover, considering in the analysis the quantitative indicators, it allows general conclusions to be drawn on the basis of only one case [
31]. In addition to the research carried out to describe a certain community, so-called holistic case studies [
32], the embedded case studies are mentioned, as well [
33]. This kind of research could be realized as a single-case designs, especially in a situation where the theory does not exist and the study is pilot and aimed at verifying the initial concept [
34]. The case introduced in the paper was chosen on the basis of the data availability. The courier company analyzed under this work cooperated with the Authors in the European Project EUFAL (Electric Urban Freight and Logistics), which was focused on the utilization of electric vehicles for last mile delivery. Due to that, it was possible to collect the data related to the delivery processes in the context of their successes or failures. which resulted in the case study approach being identified as the most interesting and valuable for that research work.
It is important to note that the analyzed company has not implemented the Six Sigma management system. The data used in the process evaluation were obtained from the operating IT (Information Technology) system. The analysis covered three months chosen randomly from year 2018. The purpose of the analysis was to specify the delivery process capability, which eventually meant designation of the Sigma process level. Source data received from the company’s IT system included the delivery date, courier’s identification number and the delivery status (“effective delivery” or “undelivered”). In addition, in the case of undelivered status, the reason for failed delivery was given. As the process defect consisting in failed delivery is a datum described as a feature, the Sigma level should be specified based on the DPMO (Defect per Million Opportunities) ratio. For this purpose, the total number of deliveries was calculated for each of the analyzed months. The number of defects was identified and calculated. The number of possible faults was determined. The DPMO index was calculated, and, on its basis, the process Sigma level was calculated. The Sigma level allowed to determine to what extent the process meets the customer’s requirements. It should be noted that the benefits of Six Sigma are obtained by meeting customer satisfaction. Therefore, the information about the Sigma level is also an indicator of the effectiveness of the process. At the same time, the analysis also considered the reasons for delivery failures. All the diagrams were prepared using Microsoft Visio 2016; Microsoft Excel was used to calculate the DPMO, and the Sigma level was read from the Statistica calculator.
3. Six Sigma as a Processes Management Method
The Six Sigma methodology focuses on process improvement so as to eliminate any defects, losses and any quality issues found on the basis of actual data [
35,
36]. One of the main assumptions is that quality may cost nothing, in terms of comparing quality assurance costs and costs resulting from bad quality. Outlays made to cover the former will help avoid losses resulting from the latter. At the same time, it should be emphasized that quality should not be an end in itself. With Six Sigma, any and all activities should focus on increased capability of the process to satisfy the customer needs, as well as to maintain the process stability, which consequently will lead to increased profits. Besides, this regards both the external customer and the internal process. Moreover, the process should be correctly completed the first time around, and any possible mistakes should be identified and eliminated as early as possible. Information on whether or not the process is able to meet the customer’s requirements, or if and where wastage is taking place, is obtained via continuous measurement and control of the process. The idea behind it is that, if something is not measured, its functioning cannot be evaluated. Any observed irregularities in the process should be the starting point for streamlining it.
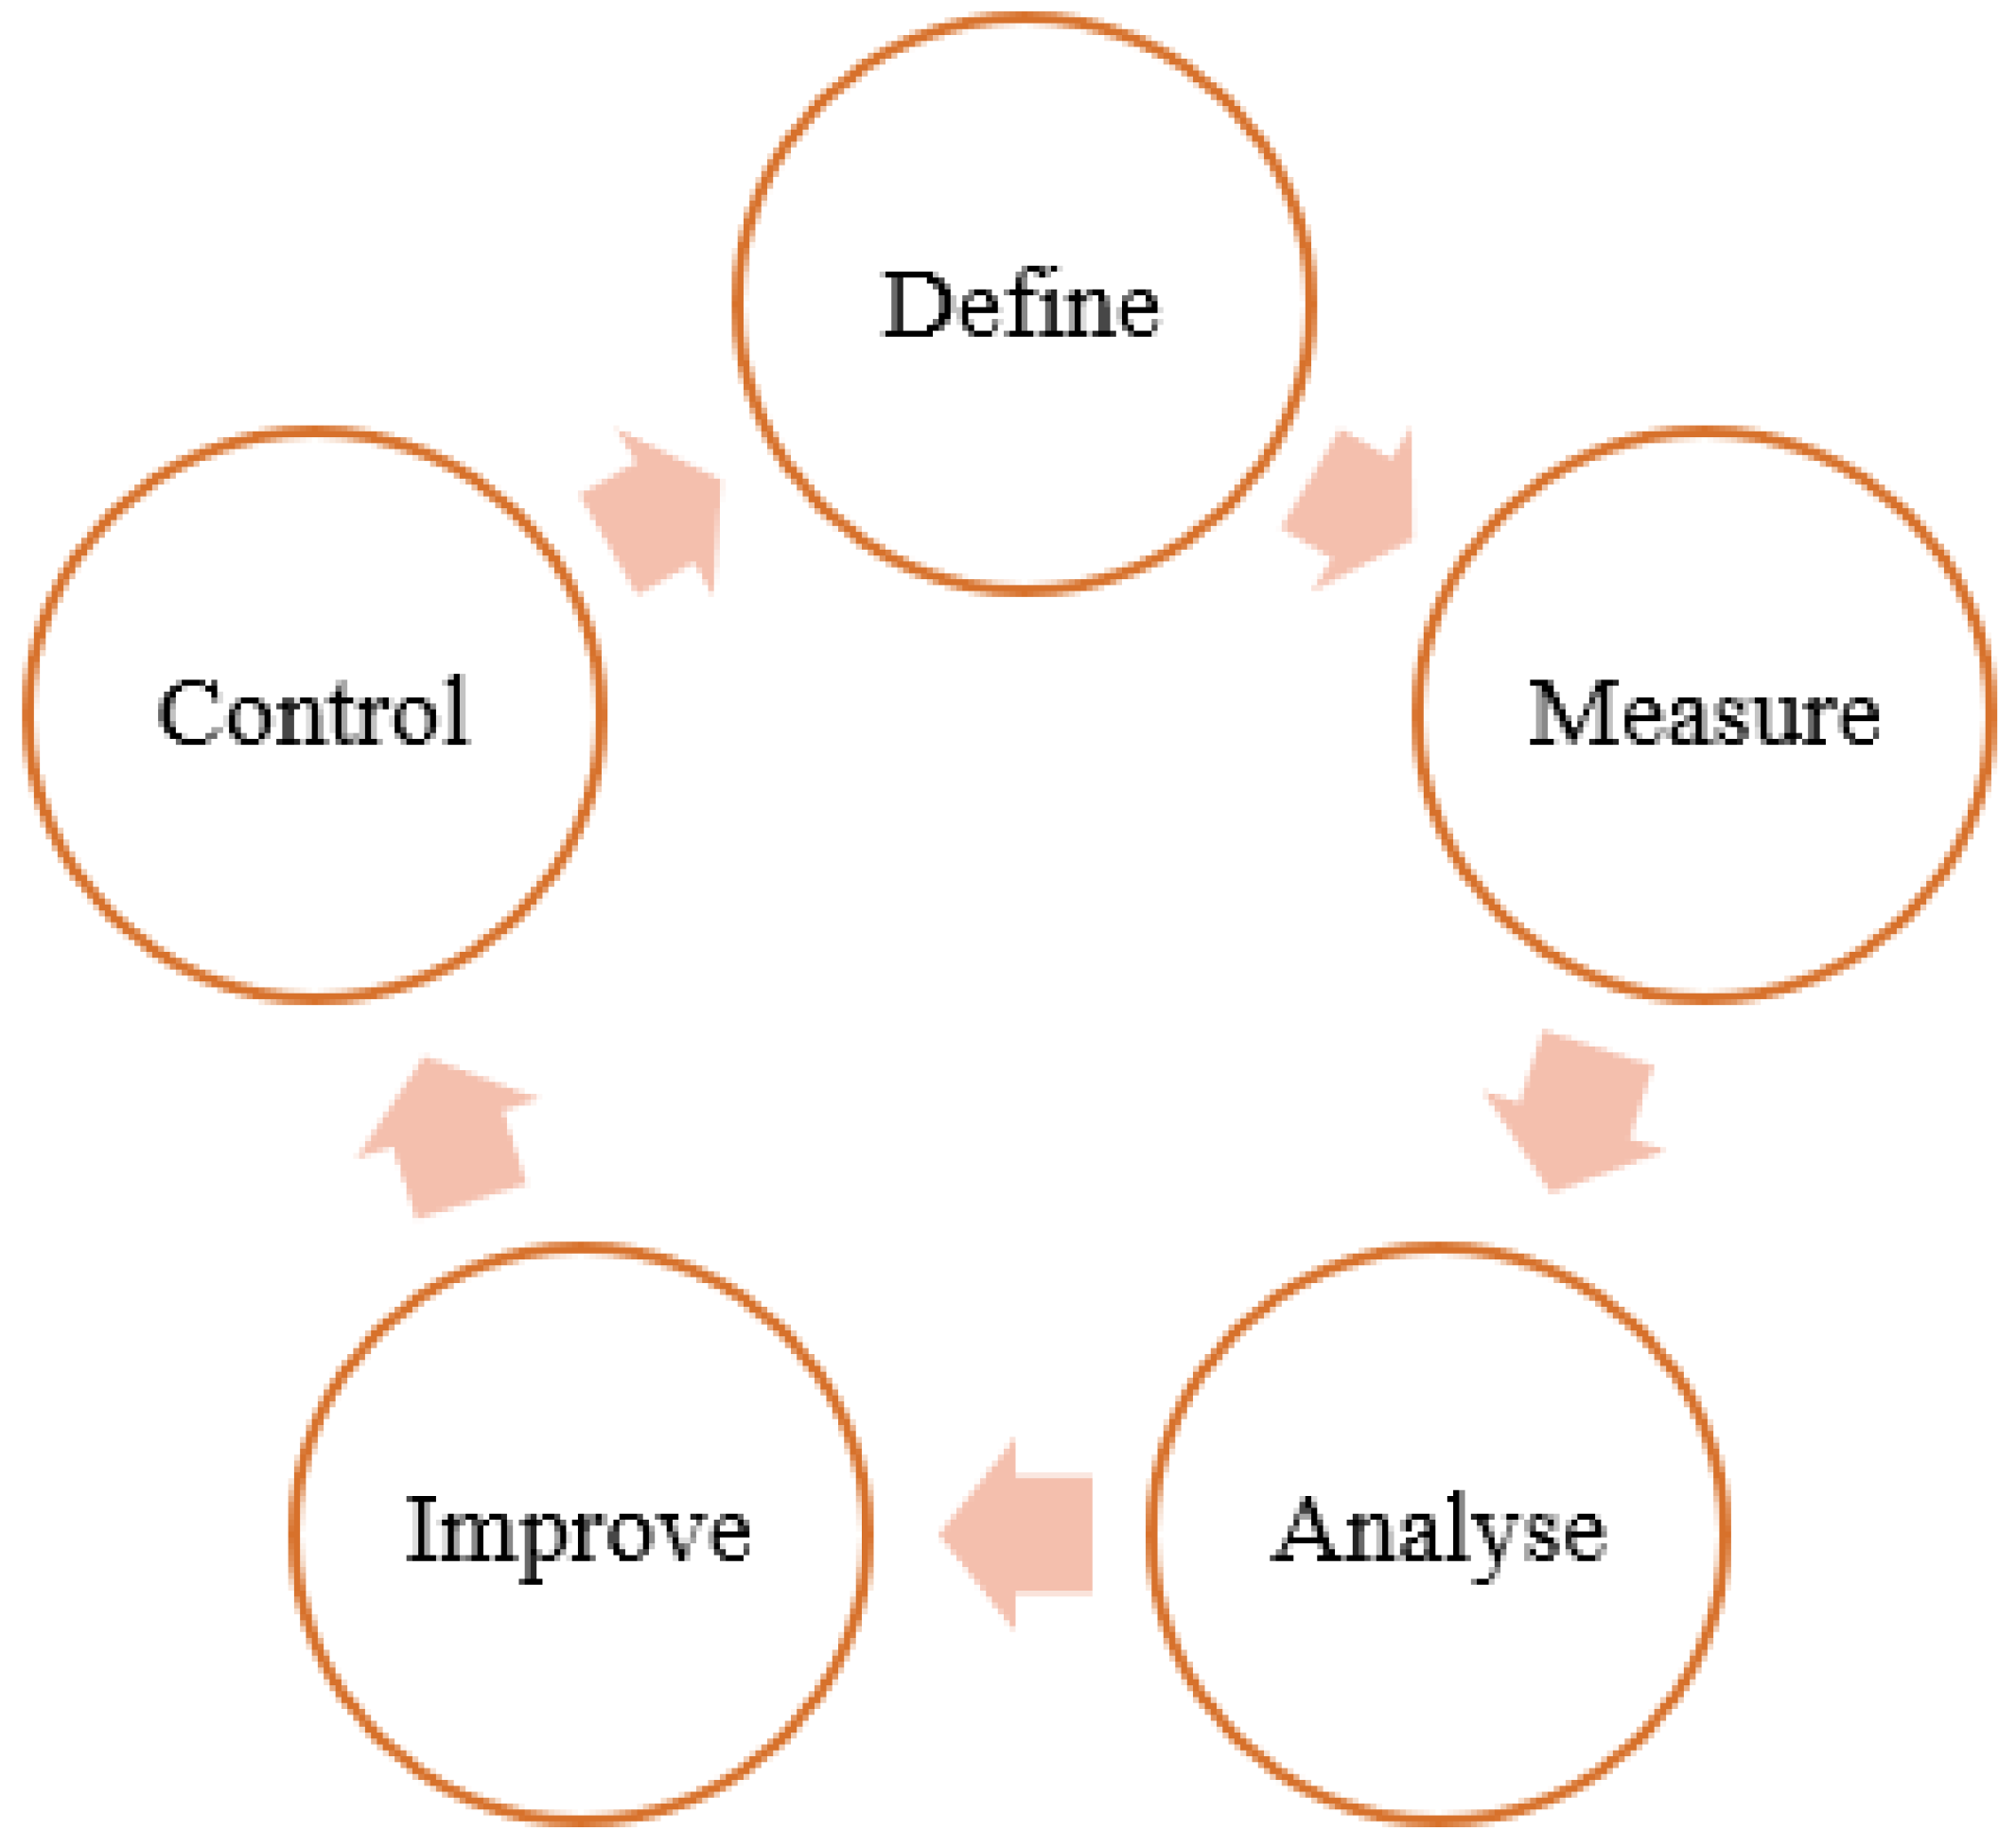
3.1. DMAIC (Define, Measure, Analyze, Improve, Control) Cycles with Six Sigma
It is recommended to manage the processes via projects carried out in accordance with the DMAIC cycle (
Figure 2). The cycle name is the acronym of its subsequent phases: Define, Measure, Analyze, Improve, and Control. This approach enables integration of the three key areas in Six Sigma: customer, process, and employees [
37].
At this point, it should be noted that in accordance with the rules of each management cycle, a signal to commence another cycle (which in Six Sigma means the project commencement) is its last phase. In DMIAC, it is the control phase, during which durability of the effects of the solutions generated and implemented in the previous phases is evaluated. Should there be any deviations from the desired outcomes, the problem definition phase is recommenced, and the cycle is restarted. At each stage of the DMAIC cycle, the project team have at their disposal a number of tools (
Table 1).
In view of the purpose and scope of this article, it addresses only some of the DMAIC cycle phases, and it discusses some selected tools applied there. In the “Define” phase, the problem and project objectives are specified [
38]. Projects are most often focused on cost reduction, improving the customer satisfaction, increasing the efficiency or waste elimination. At this stage, customers and their needs are also specified. The particularly helpful tools and techniques include VoC (Voice of Client) or CTQ (Critical to Quality) tree applied in the further analysis of the case study. At this point, the process map is developed, which is to help to obtain a precise specification of the customer needs to make sure that what the customer gets is what the customer needs. It is important that the course of the process, as well as its inputs and outputs, be defined. At the same time, the map should present the current state rather than a representation of the process. In many cases, any errors in the process may be noticed already at the stage of developing such a map. However, no corrections to the process are allowed before finishing the DMAIC cycle. A too fast attempt to implement solutions to improve the process without a prior in-depth analysis of the process is one of the more frequent causes of Six Sigma project failures.
3.2. Measure of Process
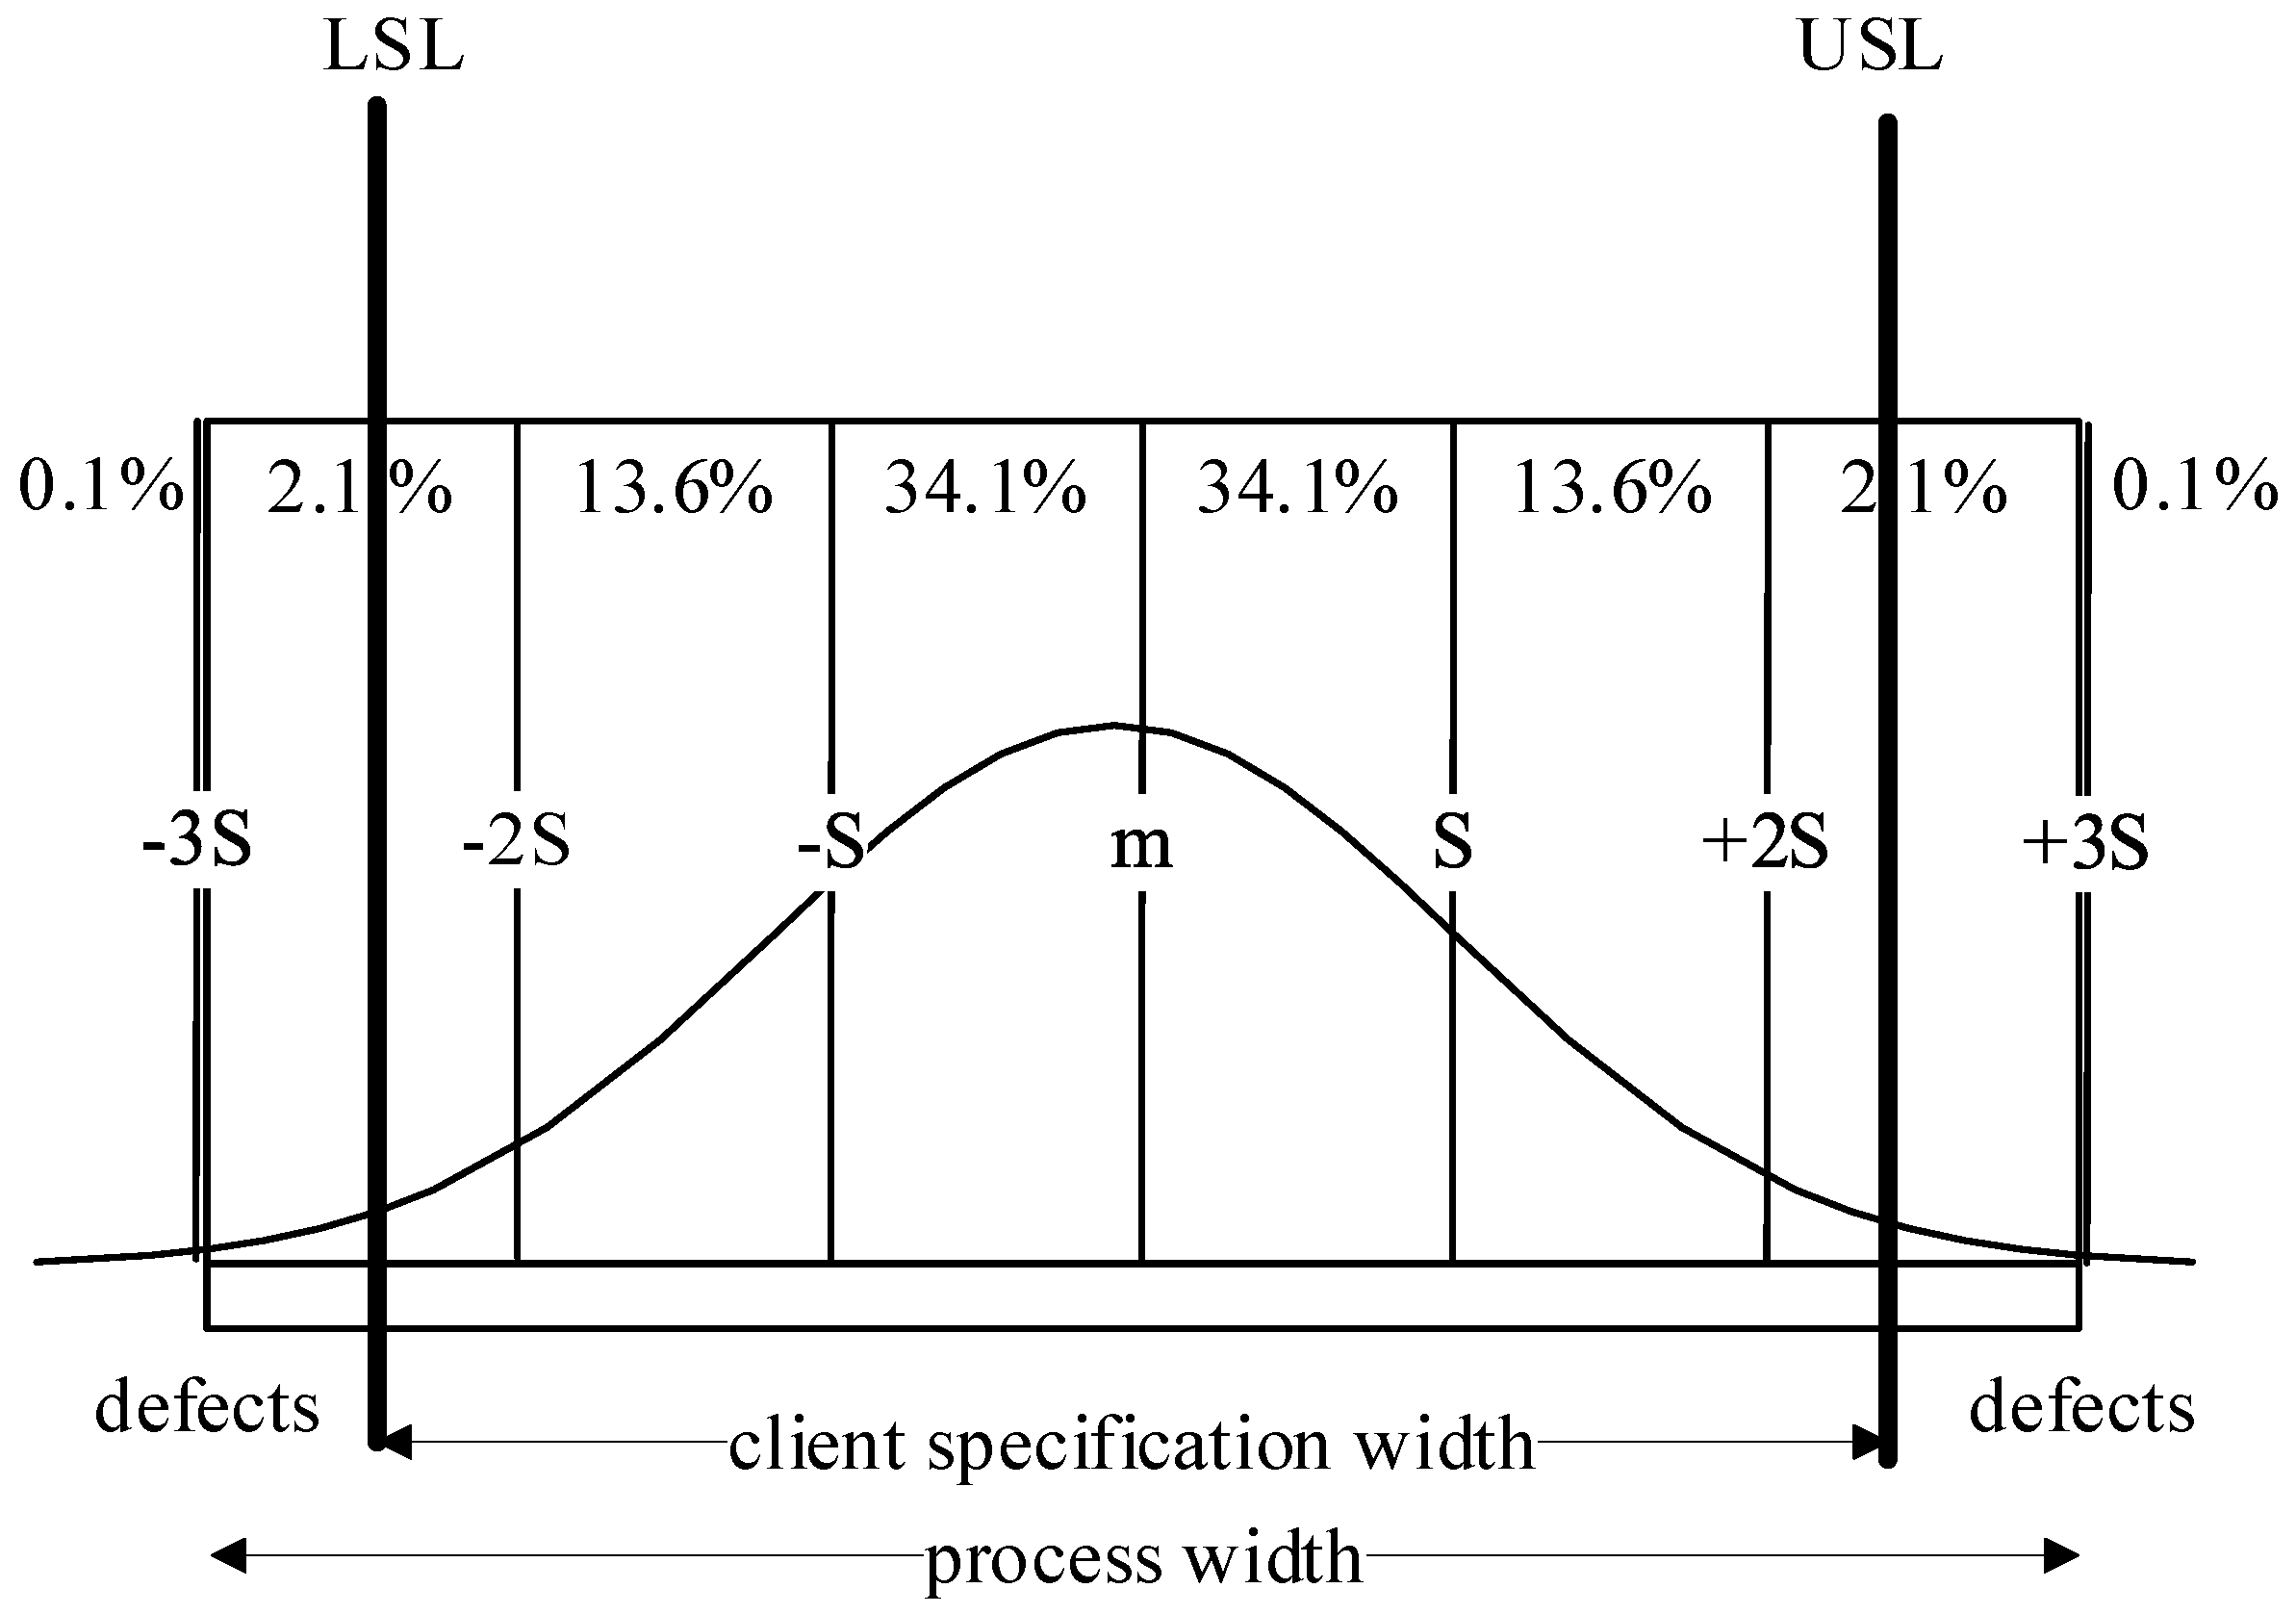
Having recognized the problem, the customer and the process, it is time to move on to the next step in the DMAIC cycle, i.e., “Measure”, where the process output is measured and evaluated. The measures selected for further analysis should be critical for the process and overlap with the customer’s expectations specified in the “Define” phase. Having determined the measures, as well as the values expected by the customer, it is now possible to move on to source the needed data and carry out an in-depth analysis of the process output. In the Six Sigma concept, the basic indicator in evaluating the process output is its capability. The measure of the process capability is referred to as the process sigma (or sigma level). The procedure for determining and evaluating the process capability differs depending on the characteristics of the evaluated data. In the case of continuous data, such as delivery time or consumed fuel, it is advisable to analyze the frequency graph. Assuming that the process is characterized by normal distribution, over 90% measurements of the given measure will show values falling within the range of plus/minus three standard deviations from the mean (
Figure 3).
The process capability may be evaluated by putting the lower and upper customer specification limits (marked as LSL and USL in
Figure 3) on the normal distribution curve. All the values of the measured process output, which fall between LSL and USL, are considered to be acceptable for the customer. Any values of the process output measure, which fall outside the range of the customer specifications, are considered to be defects. In the context of the process capability, a correct process is the one where half of the graph falls within the range from the mean to the nearer limit of the customer specification. Moreover, the mean of the graph is the same as the mean of the customer specification. Such a process is referred to as a 3-sigma level process, whereas 6 sigma means a situation where a half of the graph can fit twice within the band from the mean to the nearer customer specification limit. Such a graph demonstrates a smaller dispersion, and dispersion is more perceptible to customers. Making a process graph narrower is considered to be much more difficult than shifting its mean. Visual analysis of graphs is very useful and often applied, as it makes it possible to evaluate the process quite quickly in terms of its purposefulness and coherence. Nevertheless, a process graph analysis should be supported by computation of potential process capability (
Cp, Equation (1)) and actual process capability index (
Cpk, Equation (2)) [
39].
where:
USL—Upper Specification Limit,
LSL—Lower Specification Limit,
σ—standard deviation,
µ—mean value.
The process capability analysis assumes that its distribution is more or less normal [
40]. In the literature on the subject, any process with a value of
Cp < 1 is considered a low capability process. The chart width is greater than the client’s specification width. The processes with the
Cp ratio falling between 1 and 1.33 are considered to be of medium capability, whereas
Cp > 1.33 means a high process capability [
41]. The
Cpk ratio value informs where the process mean is located in relation to the specification’s limits. Interpretation of the
Cpk ratio is shown in
Table 2 [
42].
However, a full picture of the process can be obtained via combined interpretation of
Cp and
Cpk ratios. Comparing the values of
Cp and
Cpk, it is possible to draw conclusions on overlapping the chart mean with the specification mean [
43].
Table 3 shows how the ratio should be interpreted.
The process sigma level can be found in the process capability table, based on Process Capability Index (
Cpk) [
44]. A 6-sigma level is achieved by a process described by the equation expressed by Formula (3).
The process is not only coherent, but also the mean of its graph falls in the middle of the customer specifications. At this point, it should be noted that many processes, especially transaction or service processes, do not follow the normal distribution. Aldowaisan proposed a method for evaluating such processes [
45].
A different course of action should be taken when the process is evaluated on the basis of discrete data such as, e.g., damaged parcel. In this case, the customer does not care to which extent the parcel was damaged; the only thing that matters is that it has been damaged. This is a zero-one option. In this case, a DPMO (Defects Per Million Opportunities) indicator should be determined (Equation (4)) [
46] and used as the basis for identifying the sigma level in the process capability table [
44].
where:
D—number of defects,
U—number of units,
OPU—number of defects opportunities per unit.
An ideal process is the one which generates maximum 3.4 DPMO [
47]. The sigma level for this process is 6 in the short term and 4.5 in the long run [
48].
Having completed the detailed examination of the process output, it is possible to move to another phase of the DMAIC cycle, i.e., “Analyze”. The final result of this step is determining the root cause of the problem specified in the “Define” phase. The search starts with finding potential causes, even those least probable. The useful methods to help create an extensive list of possible causes could be brainstorm, Ishikawa diagram, or 5Why. Next, the list is shortened to a few causes which are subject to a further quantitative analysis. Correlations between the result and any individual cause are identified. Ultimately, there should be one cause left, which then should be eliminated via proposing an improvement solution in the next step of the DMAIC cycle. The “Improve” phase ends with implementing the solution that eliminates the root cause and consequently the problem. We could say that this is where the Six Sigma project comes to an end. The last phase of the DMAIC cycle—“Control”—is a systematic measurement of the process and verification whether or not the proposed solution has brought a durable effect. At this stage, actions are simultaneously taken so as to maintain the improved process at the right level.
Further on, this article presents a concept of applying the Six Sigma methodology in urban logistics processes management. The issue of the process evaluation will be discussed in detail on the basis of a case study of a courier company.
5. Discussion and Conclusions
Transport of goods within cities usually takes place in an uncoordinated and chaotic manner [
2,
51]. This is mainly due to the fact that urban freight transport is carried out by individual entities focused predominantly on fulfilling their own needs, without taking into account other UFT stakeholders; they are also unwilling to share knowledge with each other [
52,
53]. It results with the significant impact on the city environment, especially in the context of congestion and pollution [
12]. The important part of the city freight movements is realized by couriers under the last mile delivery processes. Year-by-year, it becomes more significant issue due to the increase of e-commerce [
53,
54]. Among other problems related to the last mile delivery, like traffic congestion, unsustainable delivery modes, or limited parking availability [
55], the important issue is the number of failed deliveries. It could be called as a major defect of the last mile delivery processes. This issue seems to be the most important challenge for the urban logistics managers. Failure deliveries result in a negative impact on congestion and environmental pollution. Due to that, improvement of the processes aimed at reducing undelivered parcels, in addition to financial benefits for the company, should also bring benefits to the city and its users.
It should be noted that the optimization of urban logistics activities should be applied by various entities, including local authorities or partnerships, as well as by individual enterprises. In addition, it should be emphasized that even though optimization enables to achieve the best measure from among the possible ones under the given restrictive conditions, development of optimizing models is often costly and time-consuming, and, due to the fast-changing external conditions, they quickly become obsolete. Although there is no certainty that a specific improvement will be the best solution, a consistent analysis of the process and implementation of improvement projects in a long run may lead to the same results as in the case of optimization, but at a lower cost.
The example presented in the paper illustrates the effective, structured and process-oriented way to streamline the functioning of urban logistics, so as to achieve the expected outcomes. The presented analysis shows application of Six Sigma in the process of deliveries made by a courier company within a city. The research study was carried out in order to exemplify the possibilities of applying Six Sigma in urban logistics processes management. The focus was on the process evaluation. The case study analysis emphasized the significance of the quality of data sourced for the purposes of the process evaluation. In the introduced case study, the process with a level equal to 3 is considered to be a process that meets the client’s expectations. One could agree that when the sigma level is from 2.6 to 2.8, the company is close to success. However, the management should not feel complacent. Firstly, the result is below the critical level of 3, which means that (assuming the normal distribution for that process) more than 0.2% of deliveries are expected to fail. Secondly, the company should persistently continue to improve its process and strive to obtain the sigma level of 6 for the process. For the purposes of comparison, a Chinese delivery company in 2016 obtained a DPMO ratio of 31,250, which means a sigma level of 3.36 [
25]. In order to streamline the process, it would be necessary to analyze it in more depth. It would also be advisable to analyze the process variability. To this end, it is possible to use control charts (p-charts). Moreover, it is necessary to have a closer look at the reasons for failed deliveries. In this context, particular attention should be paid to recipient’s absence. On average, 2193 deliveries a month are not made for that reason. This is more than 6% of all deliveries. It is advisable to find the root cause of recipient’s absence.
When implementing Six Sigma management in the analyzed courier company, it would be necessary to modify the IT system so that it makes it possible to identify the number of deliveries completed correctly the first time around, as well as the number of various defects per consignment. In relation to this courier company, it should be considered whether the chosen research sample is representative. Moreover, including just one company in a case study limits the possibility of generalization of any conclusions to the whole urban logistics process. Examination of similar processes at other courier service providers may indicate a problem other than the absence of the recipient of the delivery. Six Sigma is a comprehensive approach to management. This means that all processes taking place in the organization can be managed in accordance with this method [
56]. Therefore, indicating the usefulness of Six Sigma in the management of urban logistics processes requires further research on other processes, such as the transport planning process or the transport control process. Therefore, the Authors plan to extend the research to include other entities that represent UFT stakeholders. The future studies will make it possible to run a complete DMAIC cycle. In particular, it is expected that problems occurring in urban logistics processes will be identified, and the measures which are critical to the process and require continuous monitoring will be specified in more detail. At this point, it is especially important to avoid the mistake of “measuring everything that moves”. At the same time, a Six Sigma implementation model is expected to be developed in entities which carry out the urban logistics processes. It should be noted that many Six Sigma projects fail to deliver the desired result. The reasons for the failure include, among others, the lack of commitment of leaders and management, lack of competences, incorrect selection of projects for implementation, resistance to change or mistakes in understanding the client’s needs [
57,
58]. Furthermore, applying Six Sigma in urban logistics processes management is hindered by lack of data, while the concept effectiveness relies on the data quality. A rational solution in this respect would be developing an IT system that gathers the necessary data via, e.g., a system that monitors the streets, which enables generation of correct data necessary for process evaluation in real time. Application of Six Sigma may be successful provided that cooperation is assured in each link of a supply chain. A hallmark in this respect is the automotive industry. Development of solutions that would encourage the entities involved in urban logistics processes to implement Six Sigma and to cooperate with each other seems to be indispensable for successful urban logistics management in accordance with the Six Sigma concept.


