
Seismic Performance of a Green Roof Structure

Abstract
1. Introduction
1.1. Background
1.2. Study Approach
2. Materials and Methods
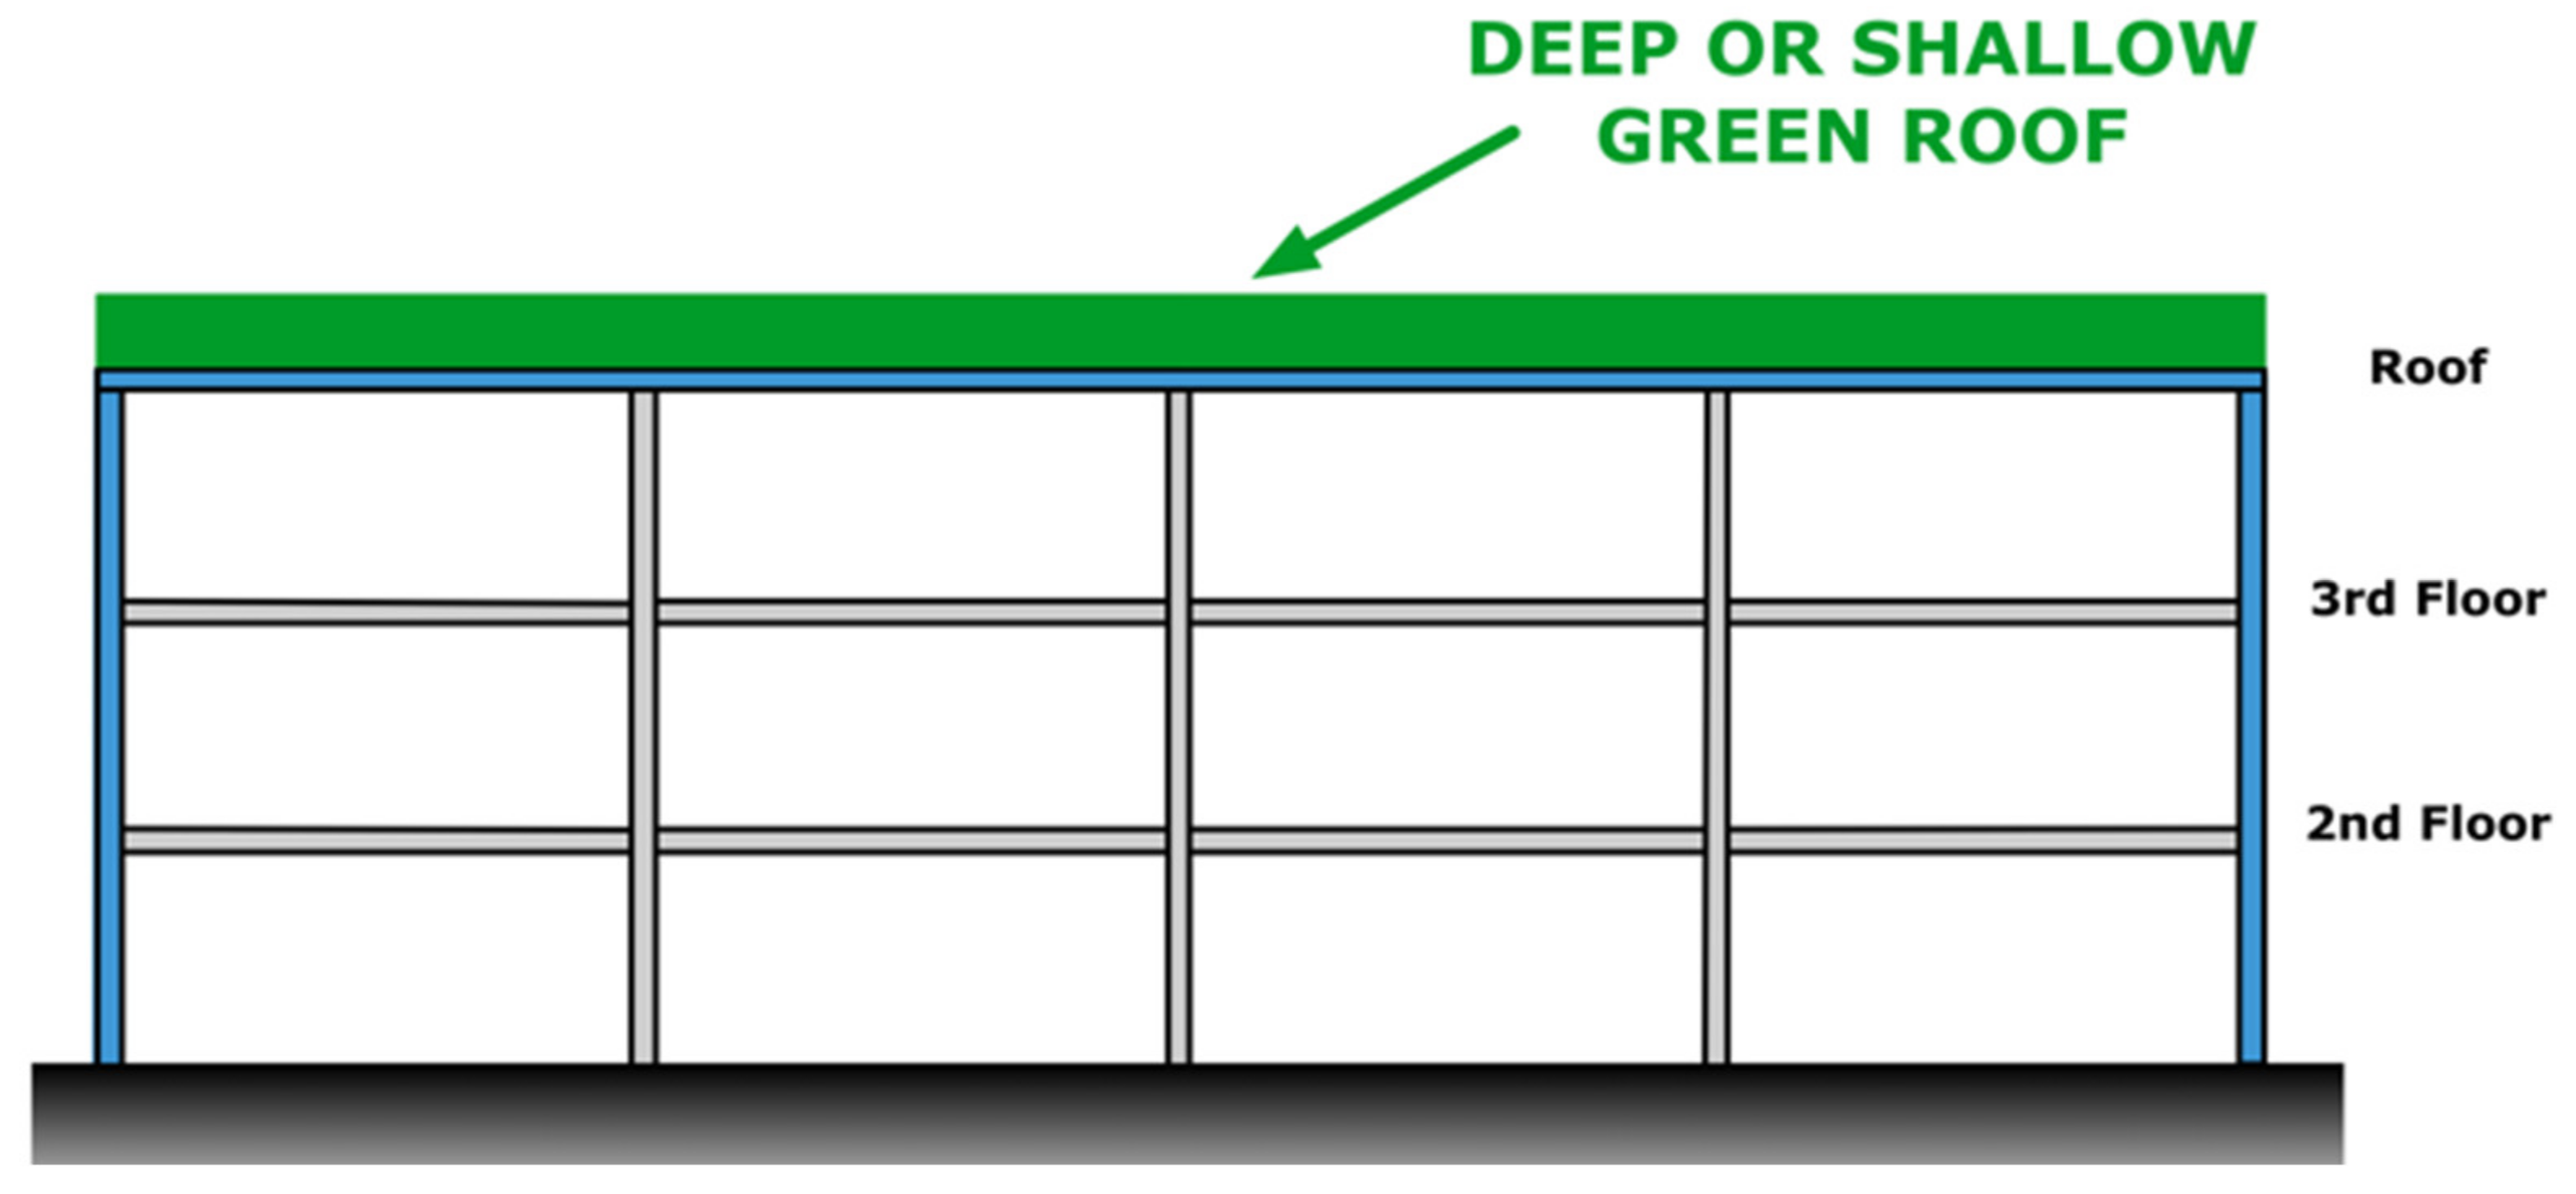
2.1. System Details
2.2. Ground Motions
2.3. Numerical Modeling
3. Results
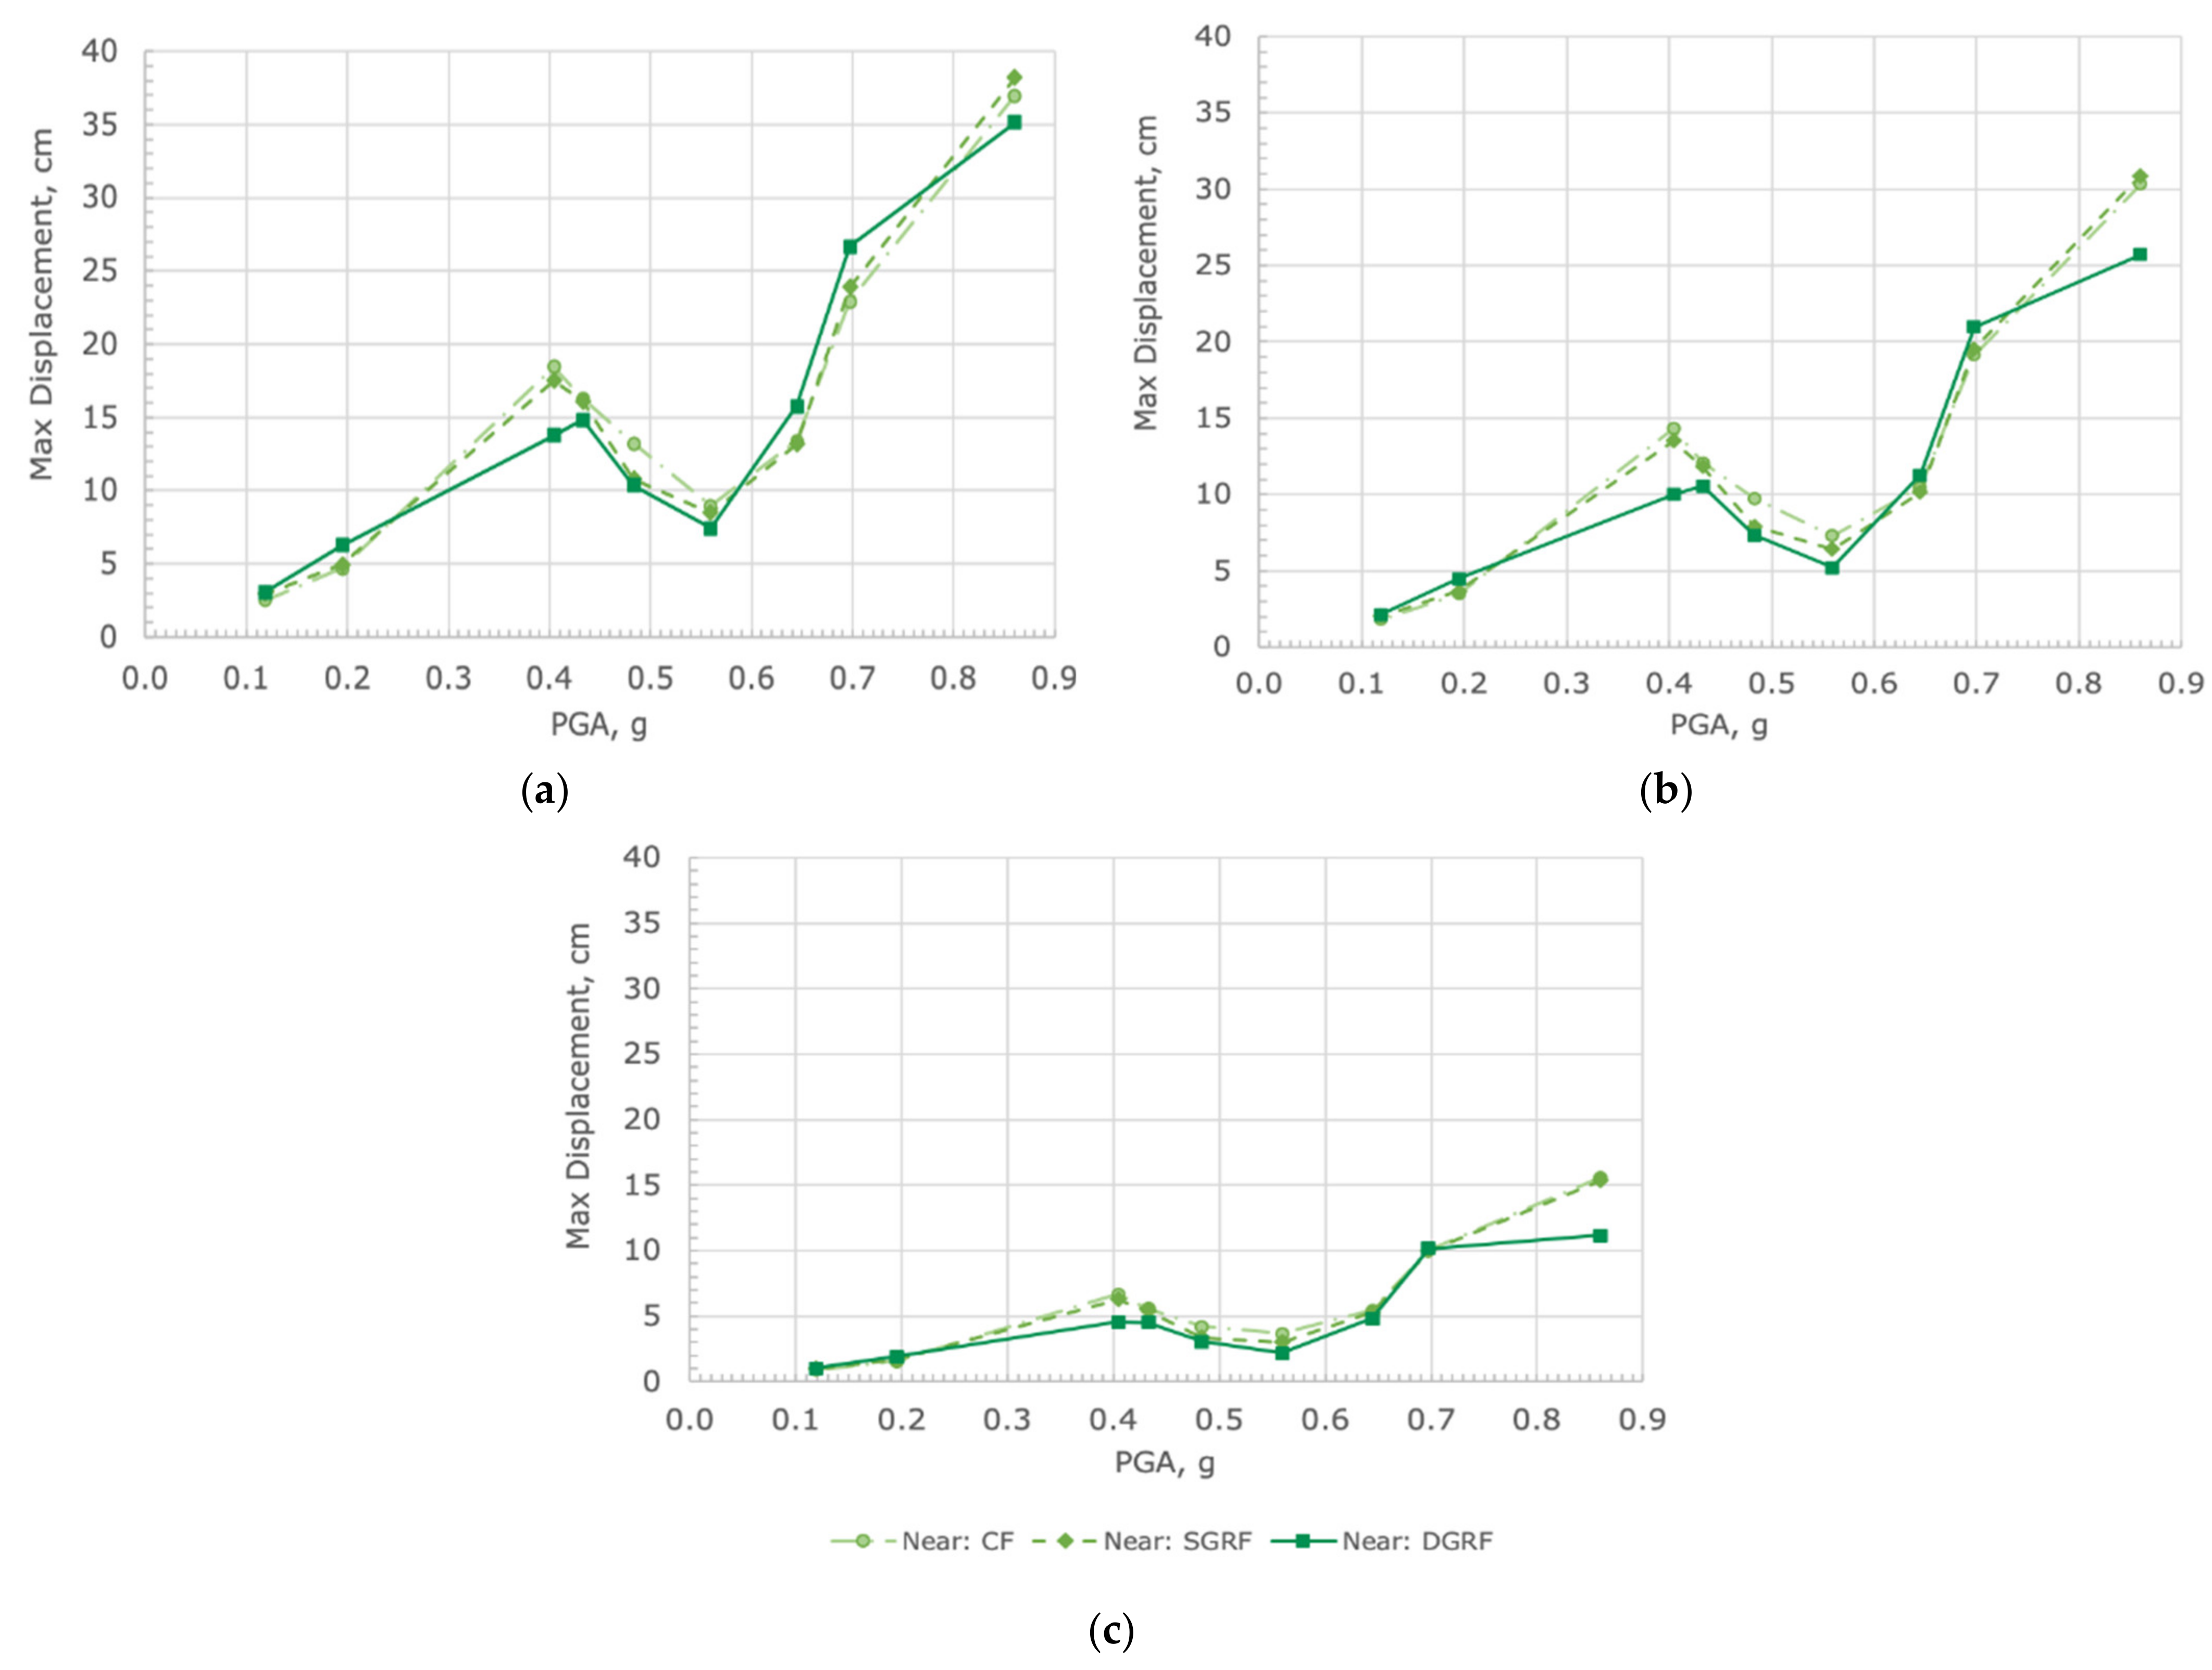
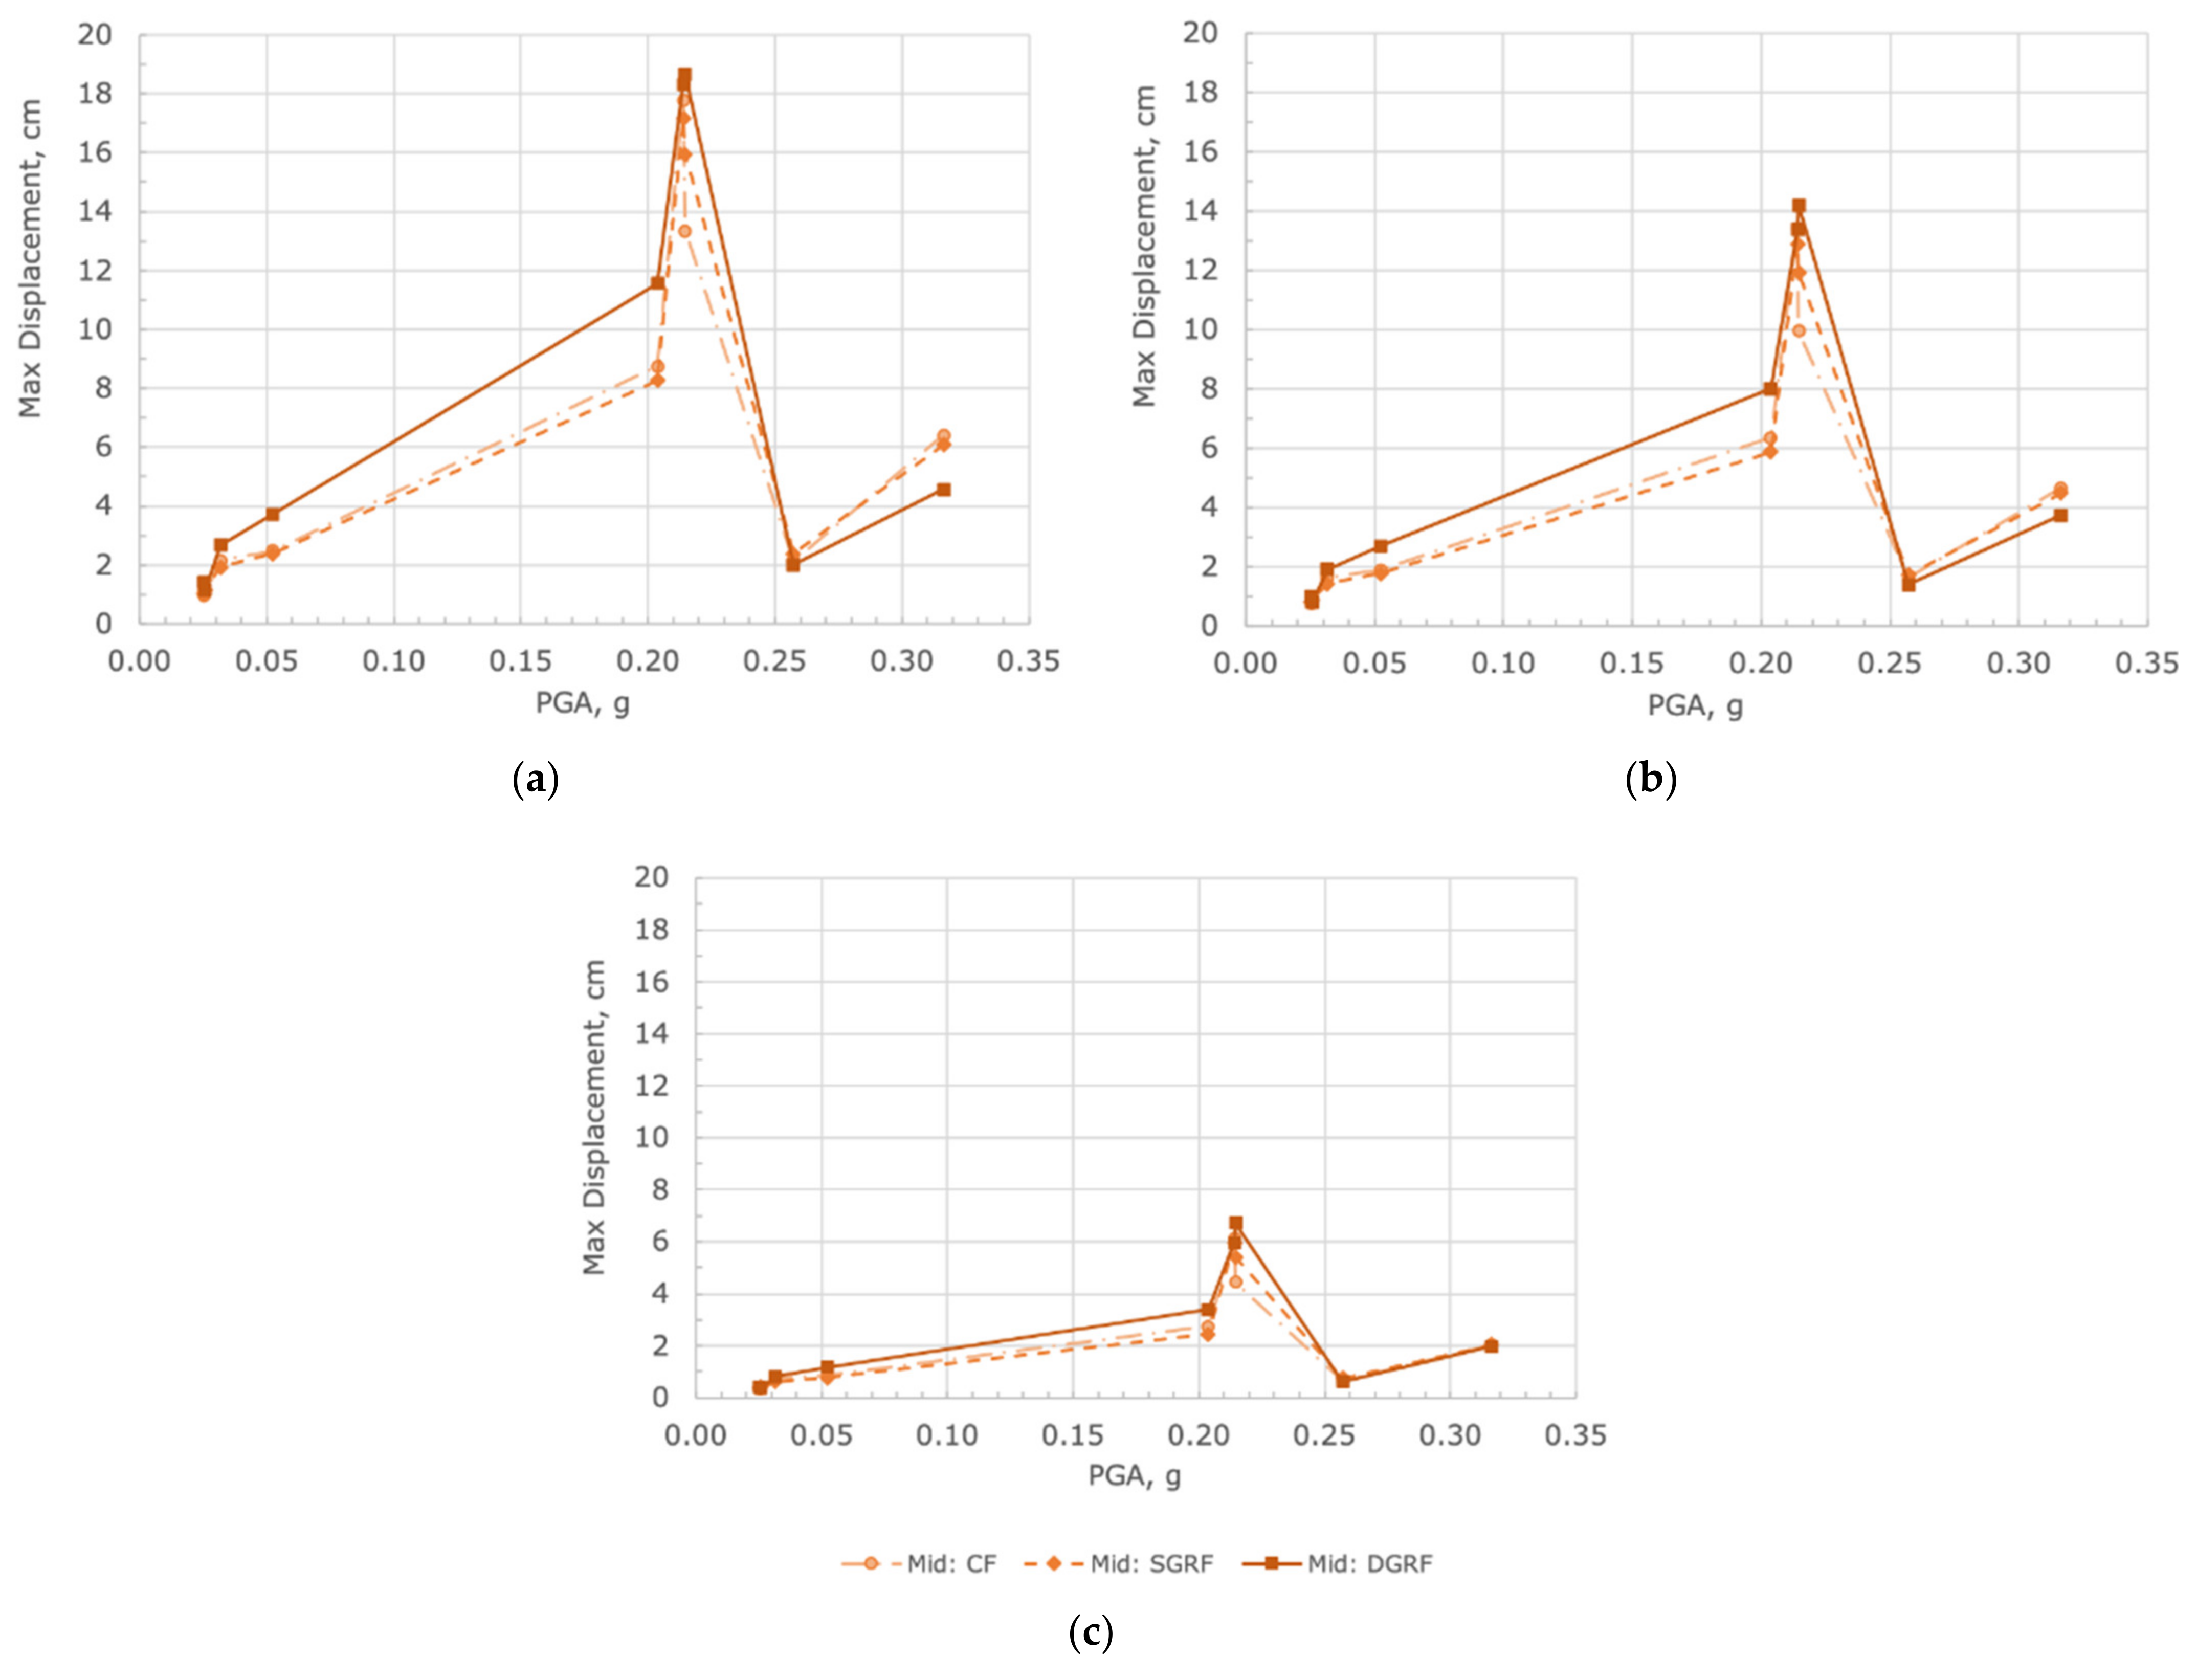
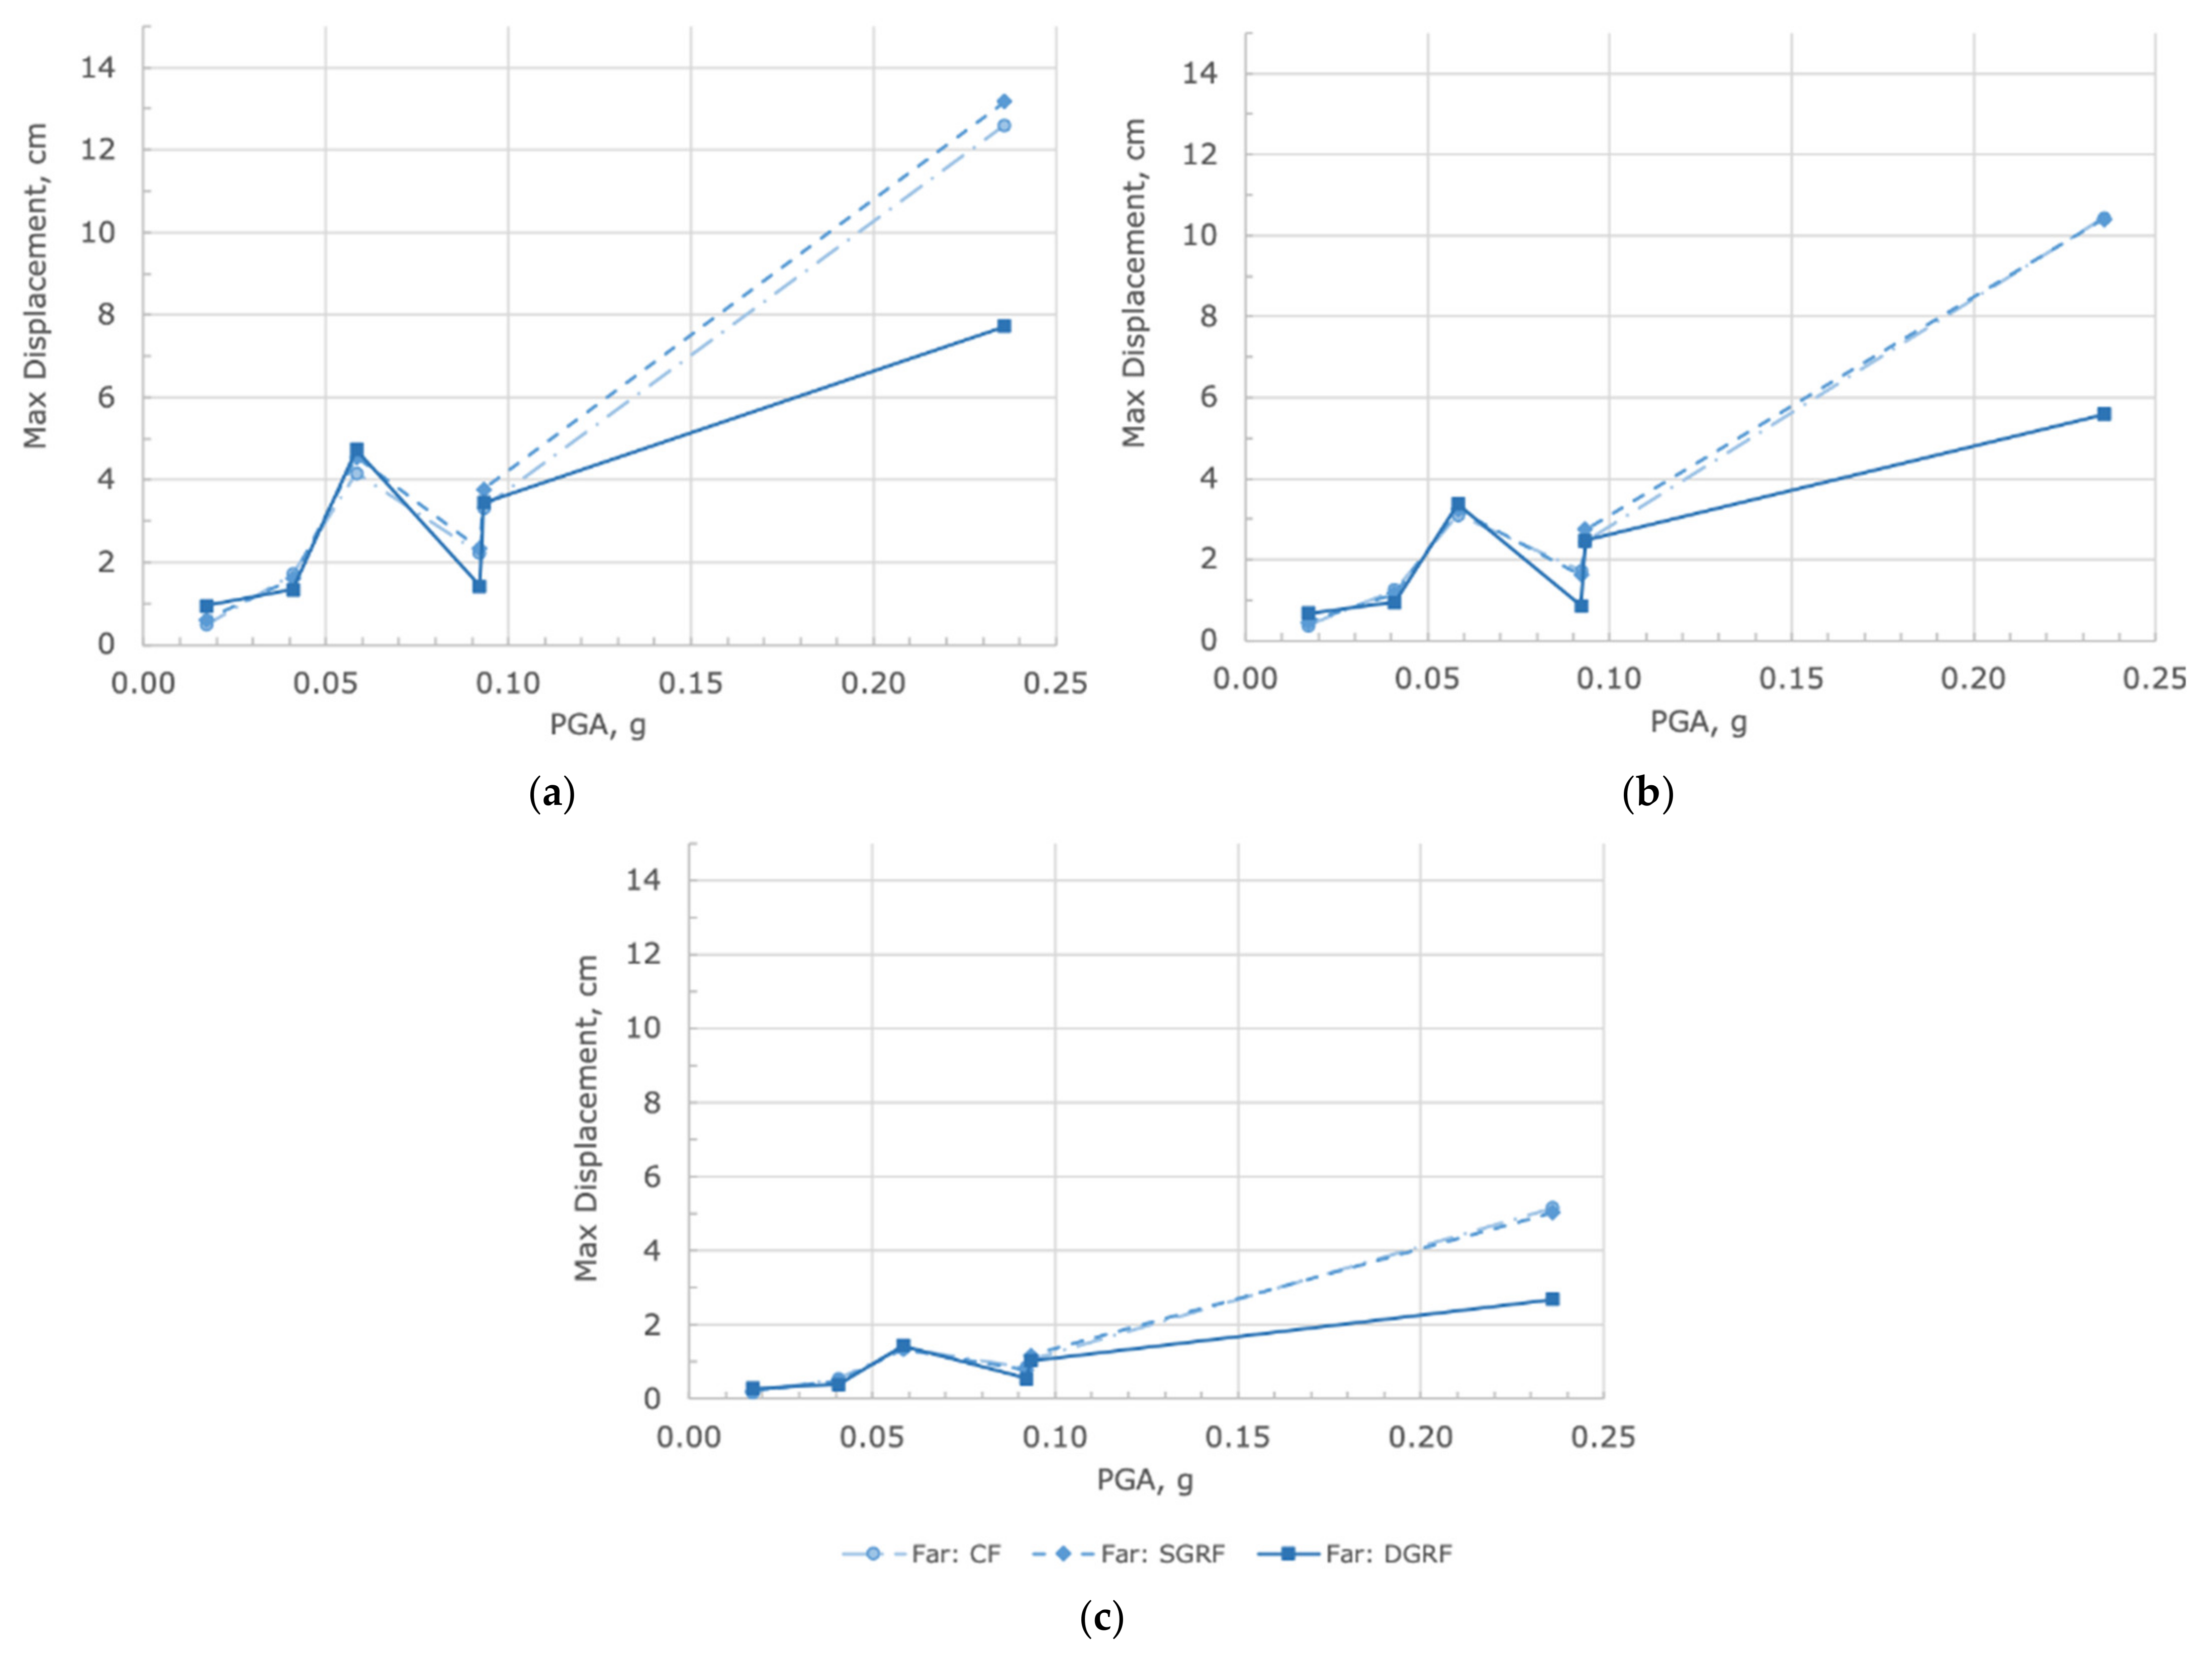
3.1. Maximum Floor Displacements
3.1.1. Near-Field (NF)
3.1.2. Mid-Field (MF)
3.1.3. Far-Field (FF)
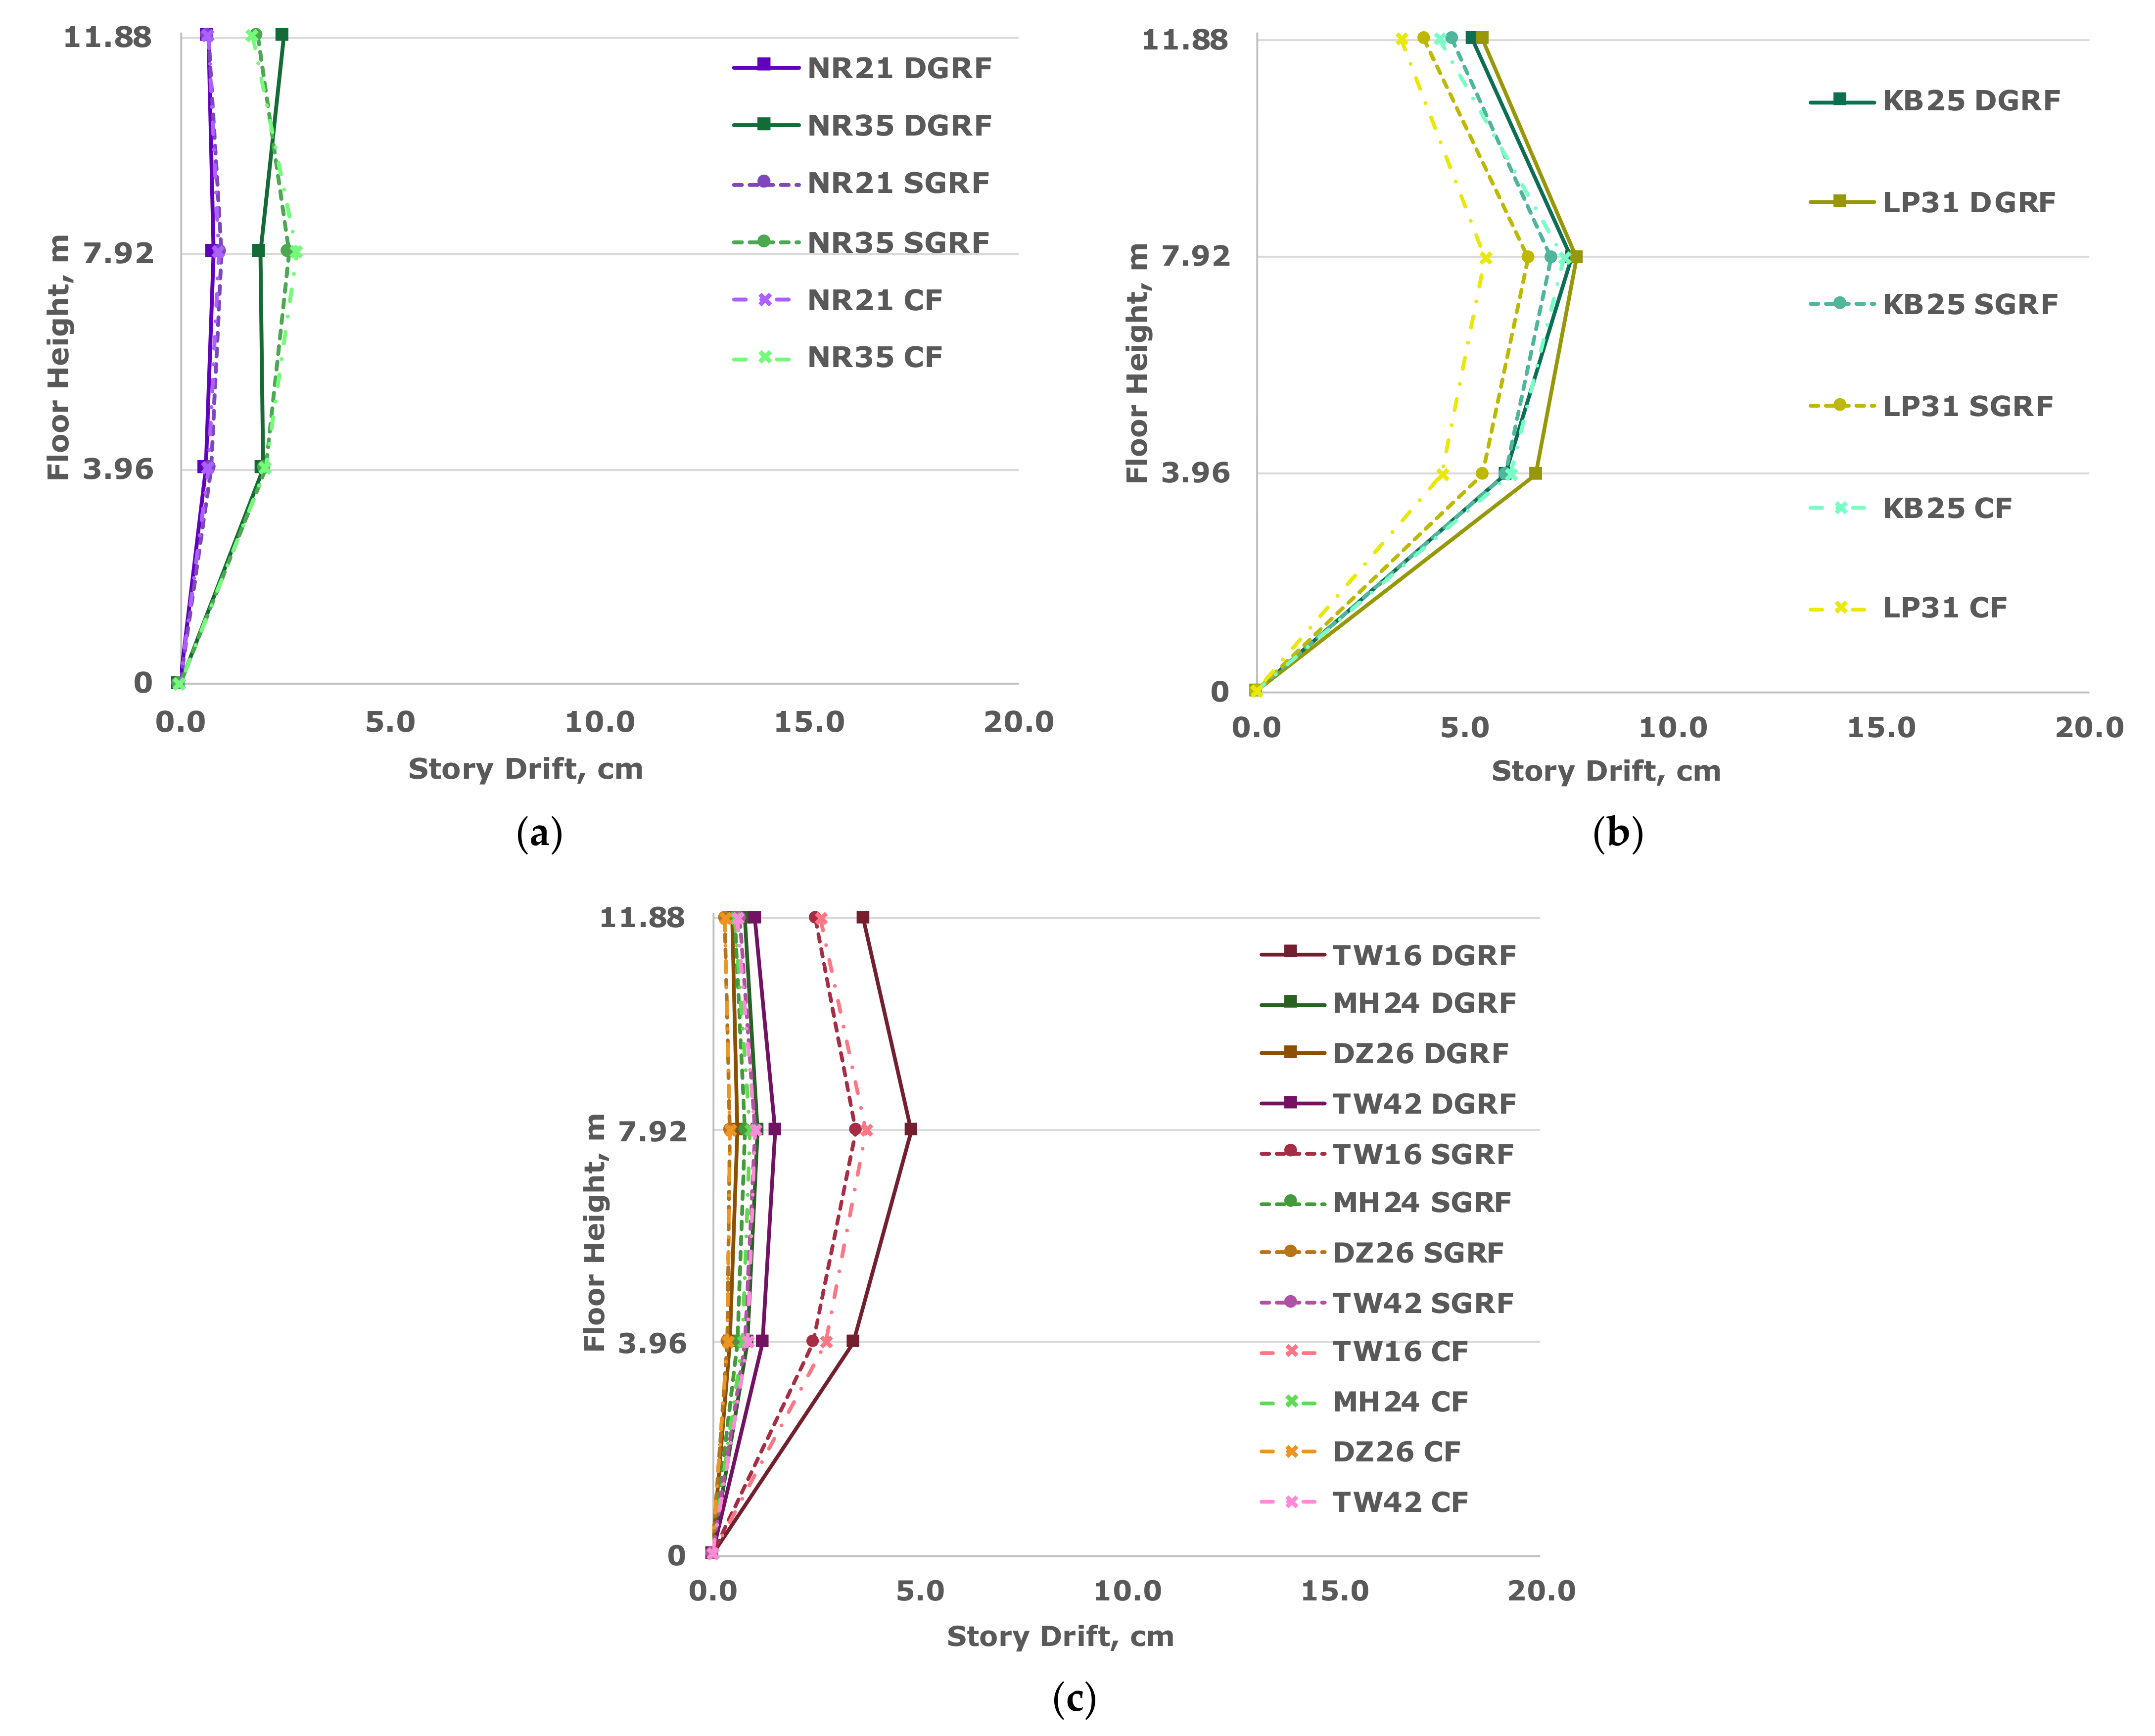
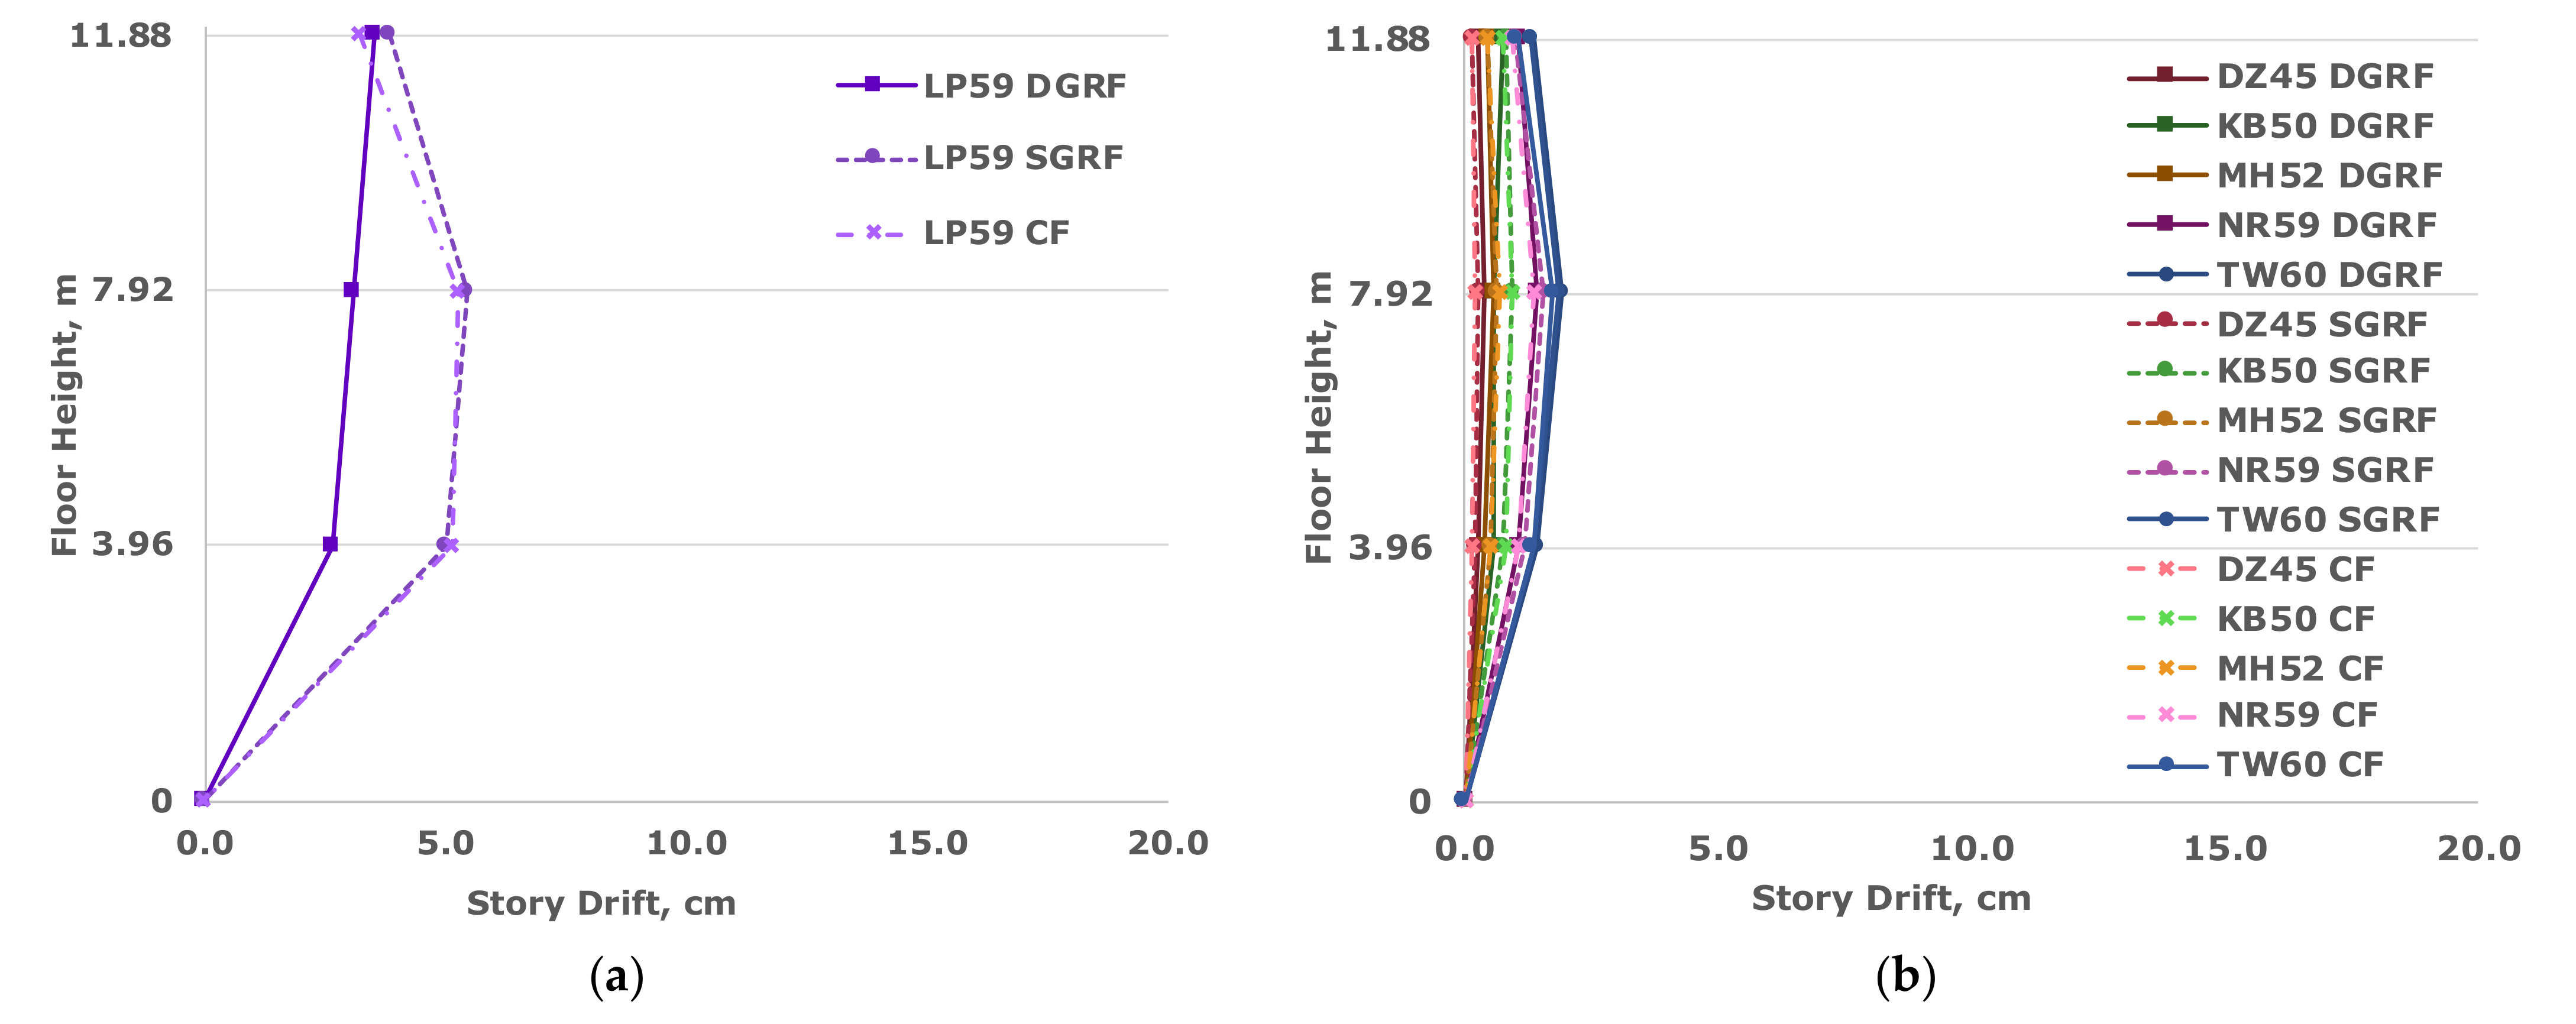
3.2. Interstory Drifts (IDs)
3.2.1. Near-Field (NF)
3.2.2. Mid-Field (MF)
3.2.3. Far-Field (FF)
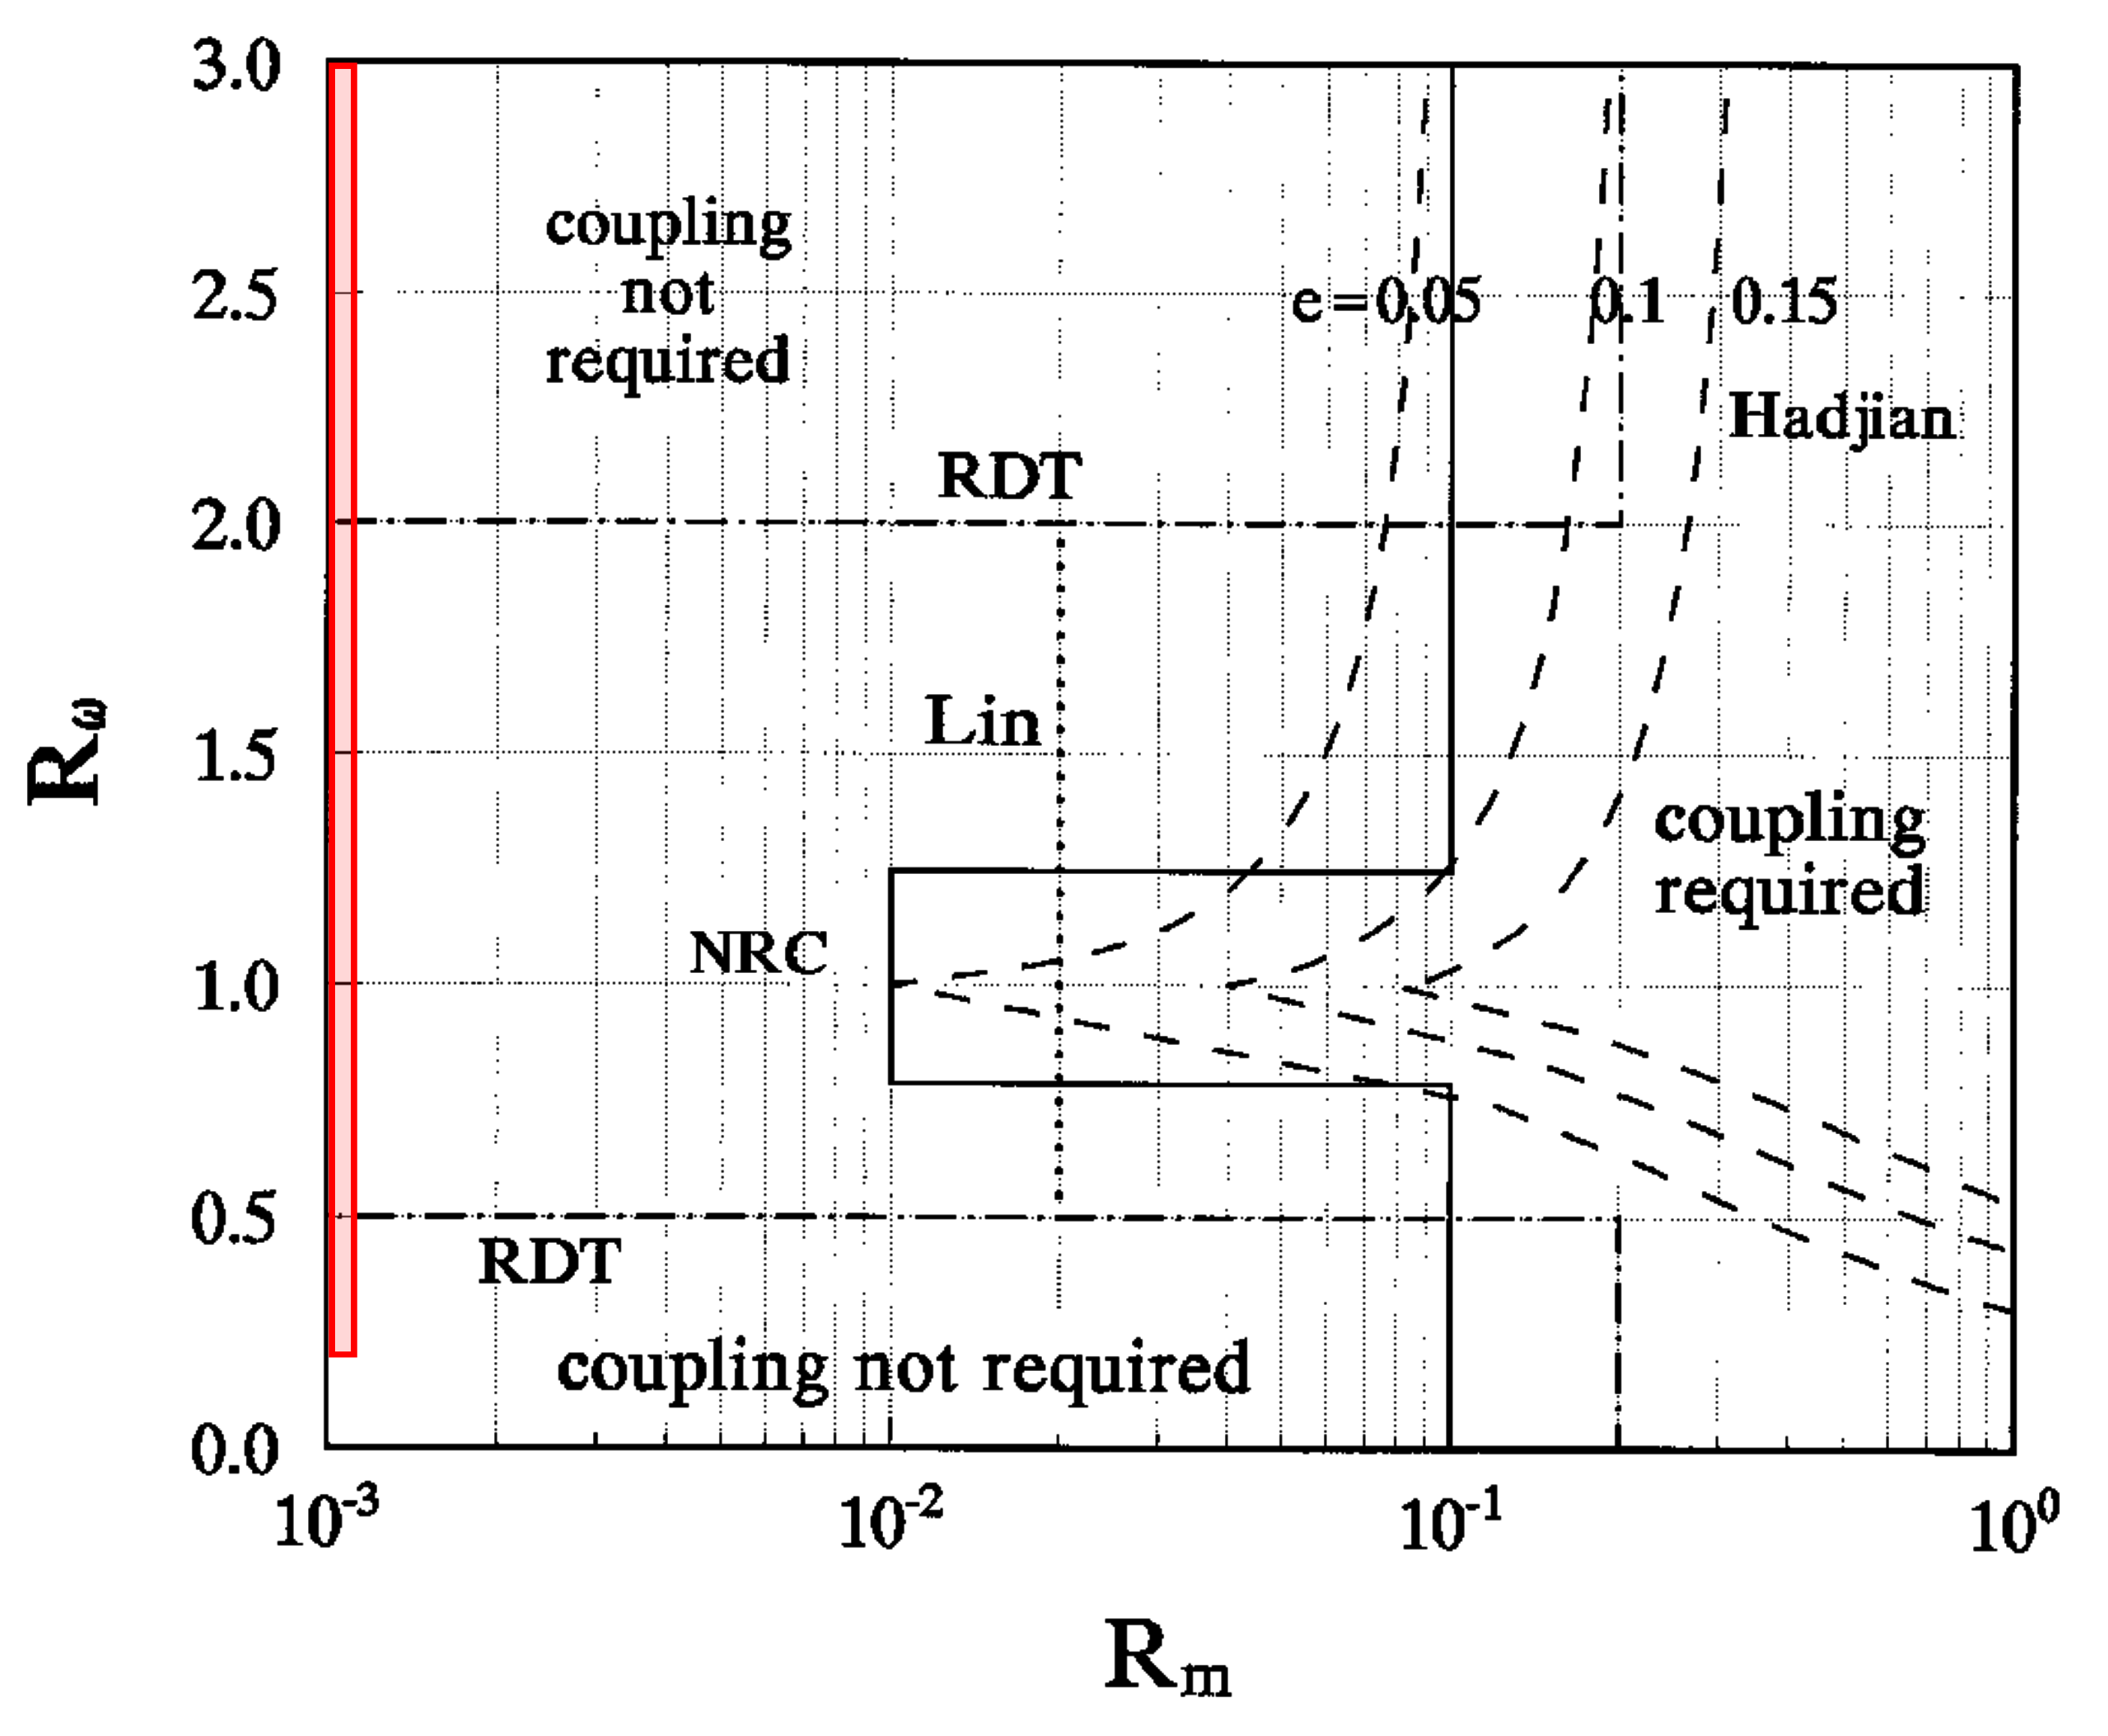
3.3. Dynamic Coupling
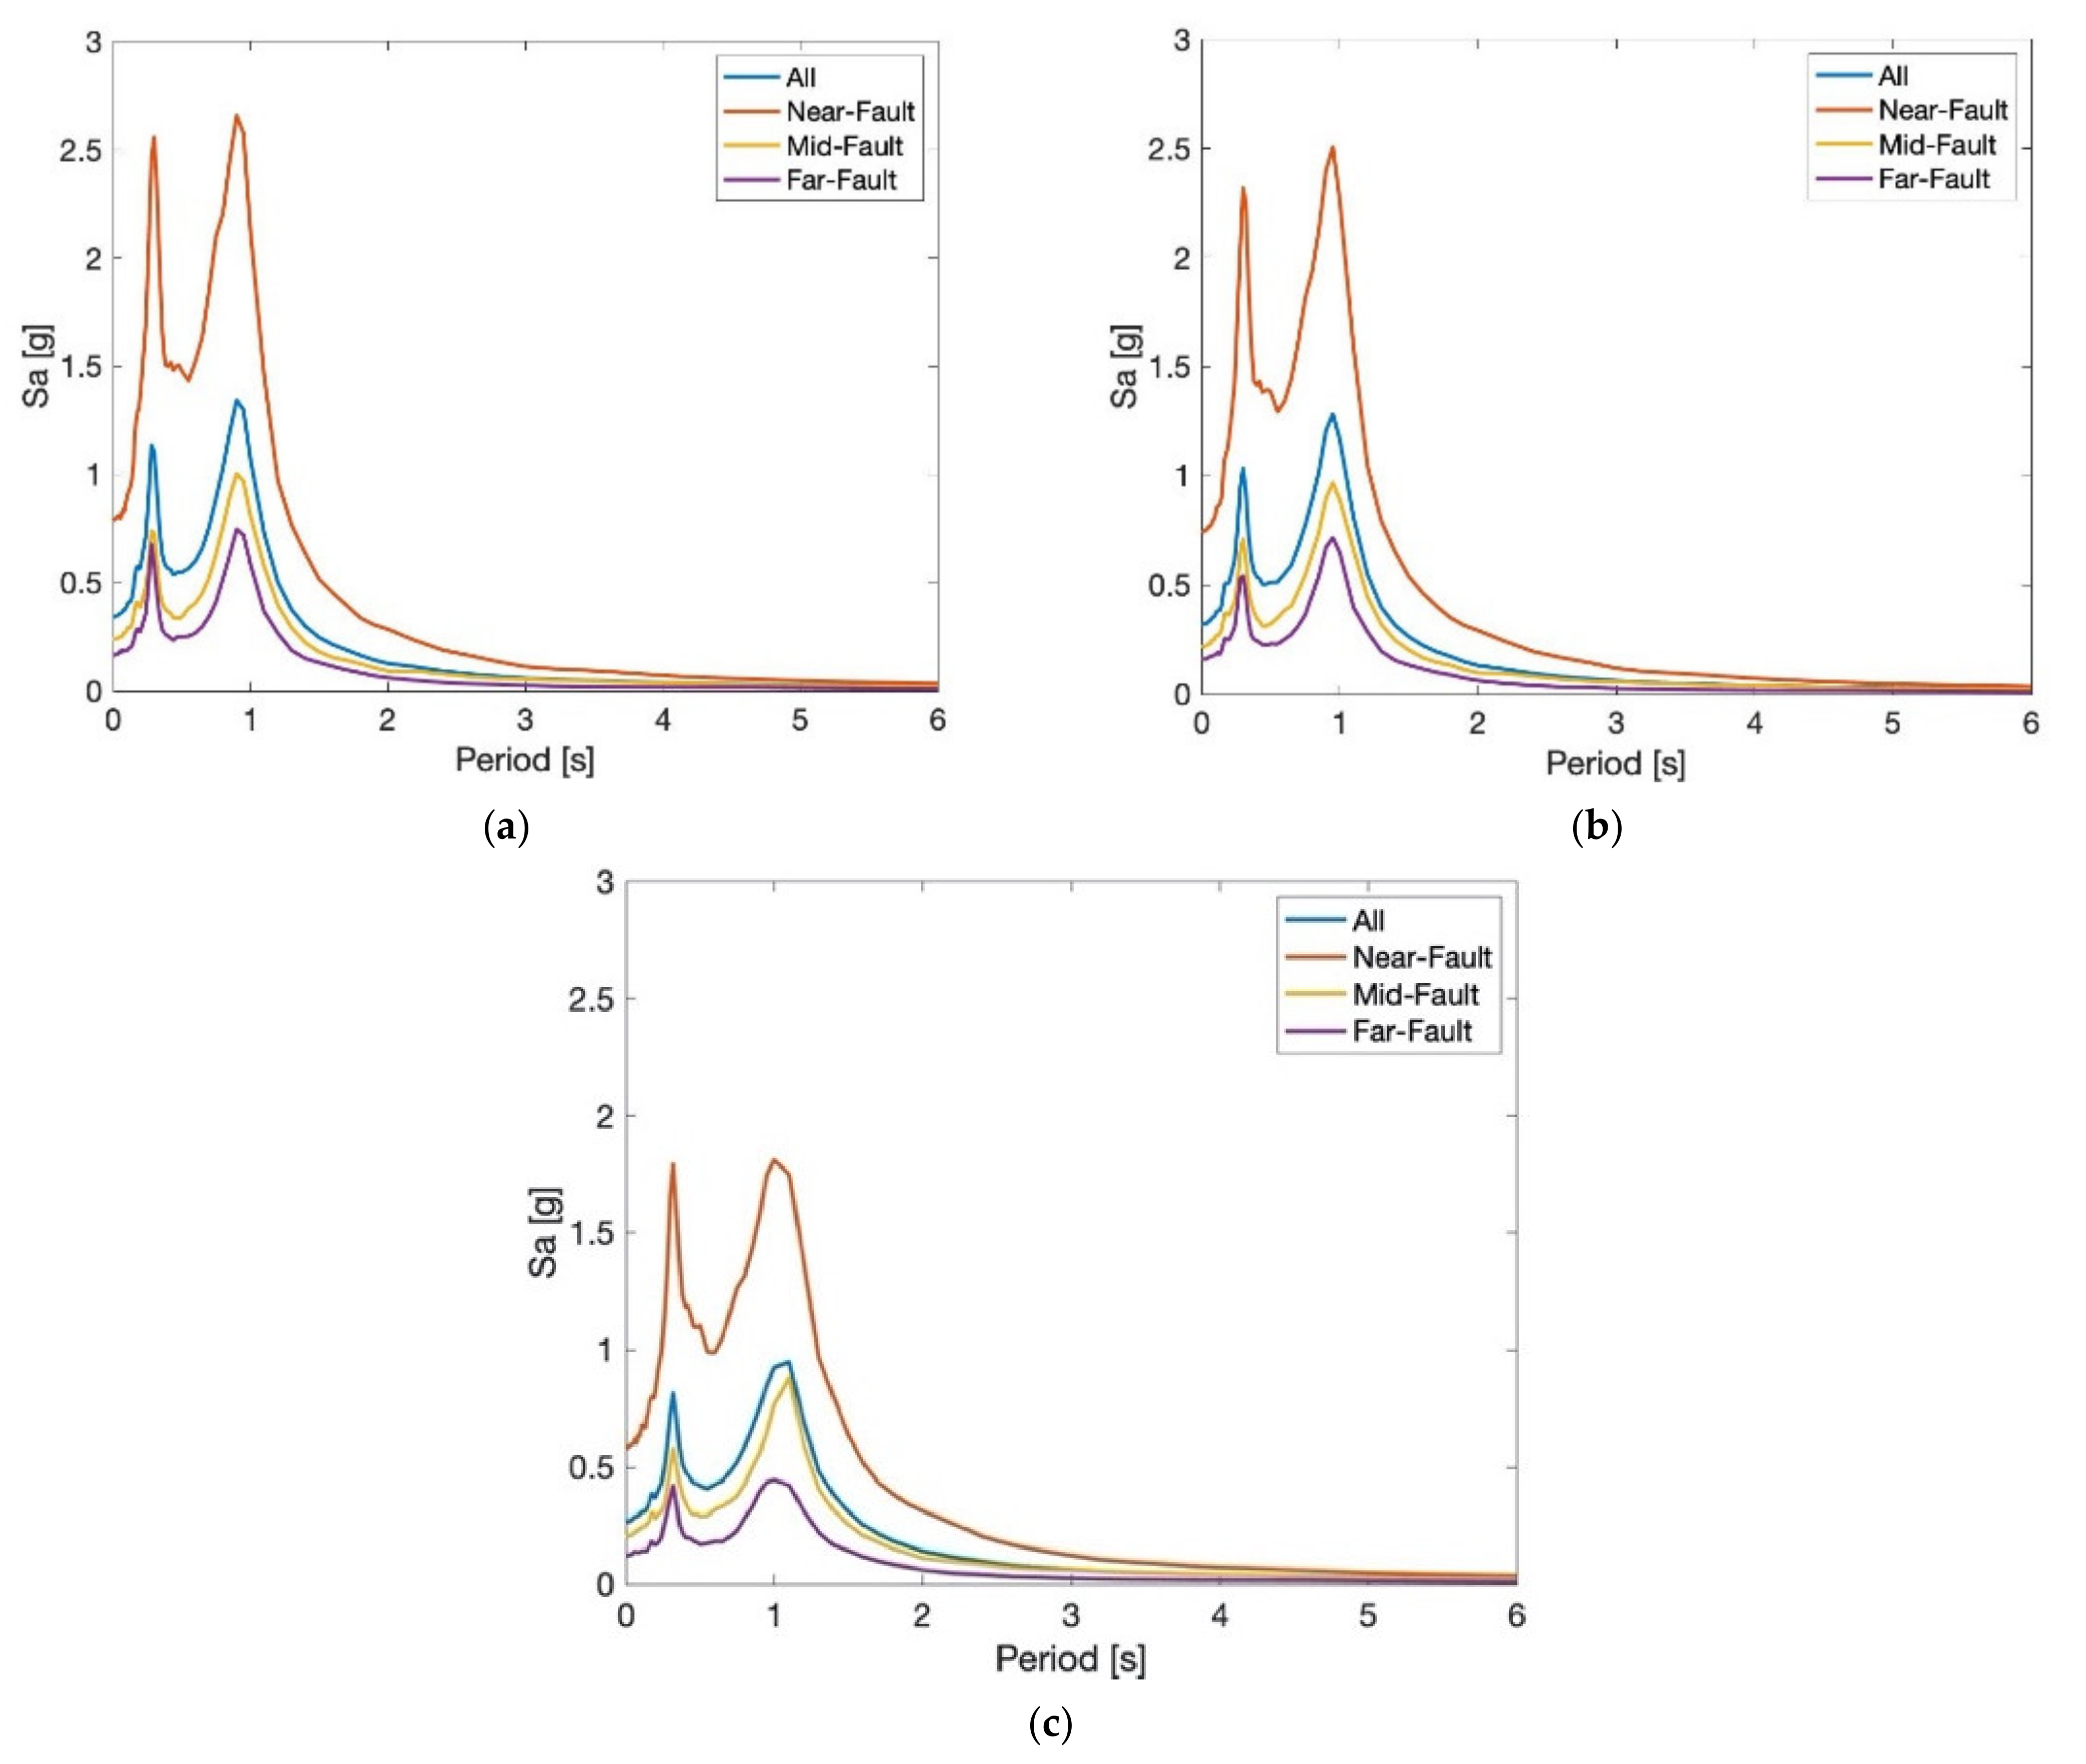
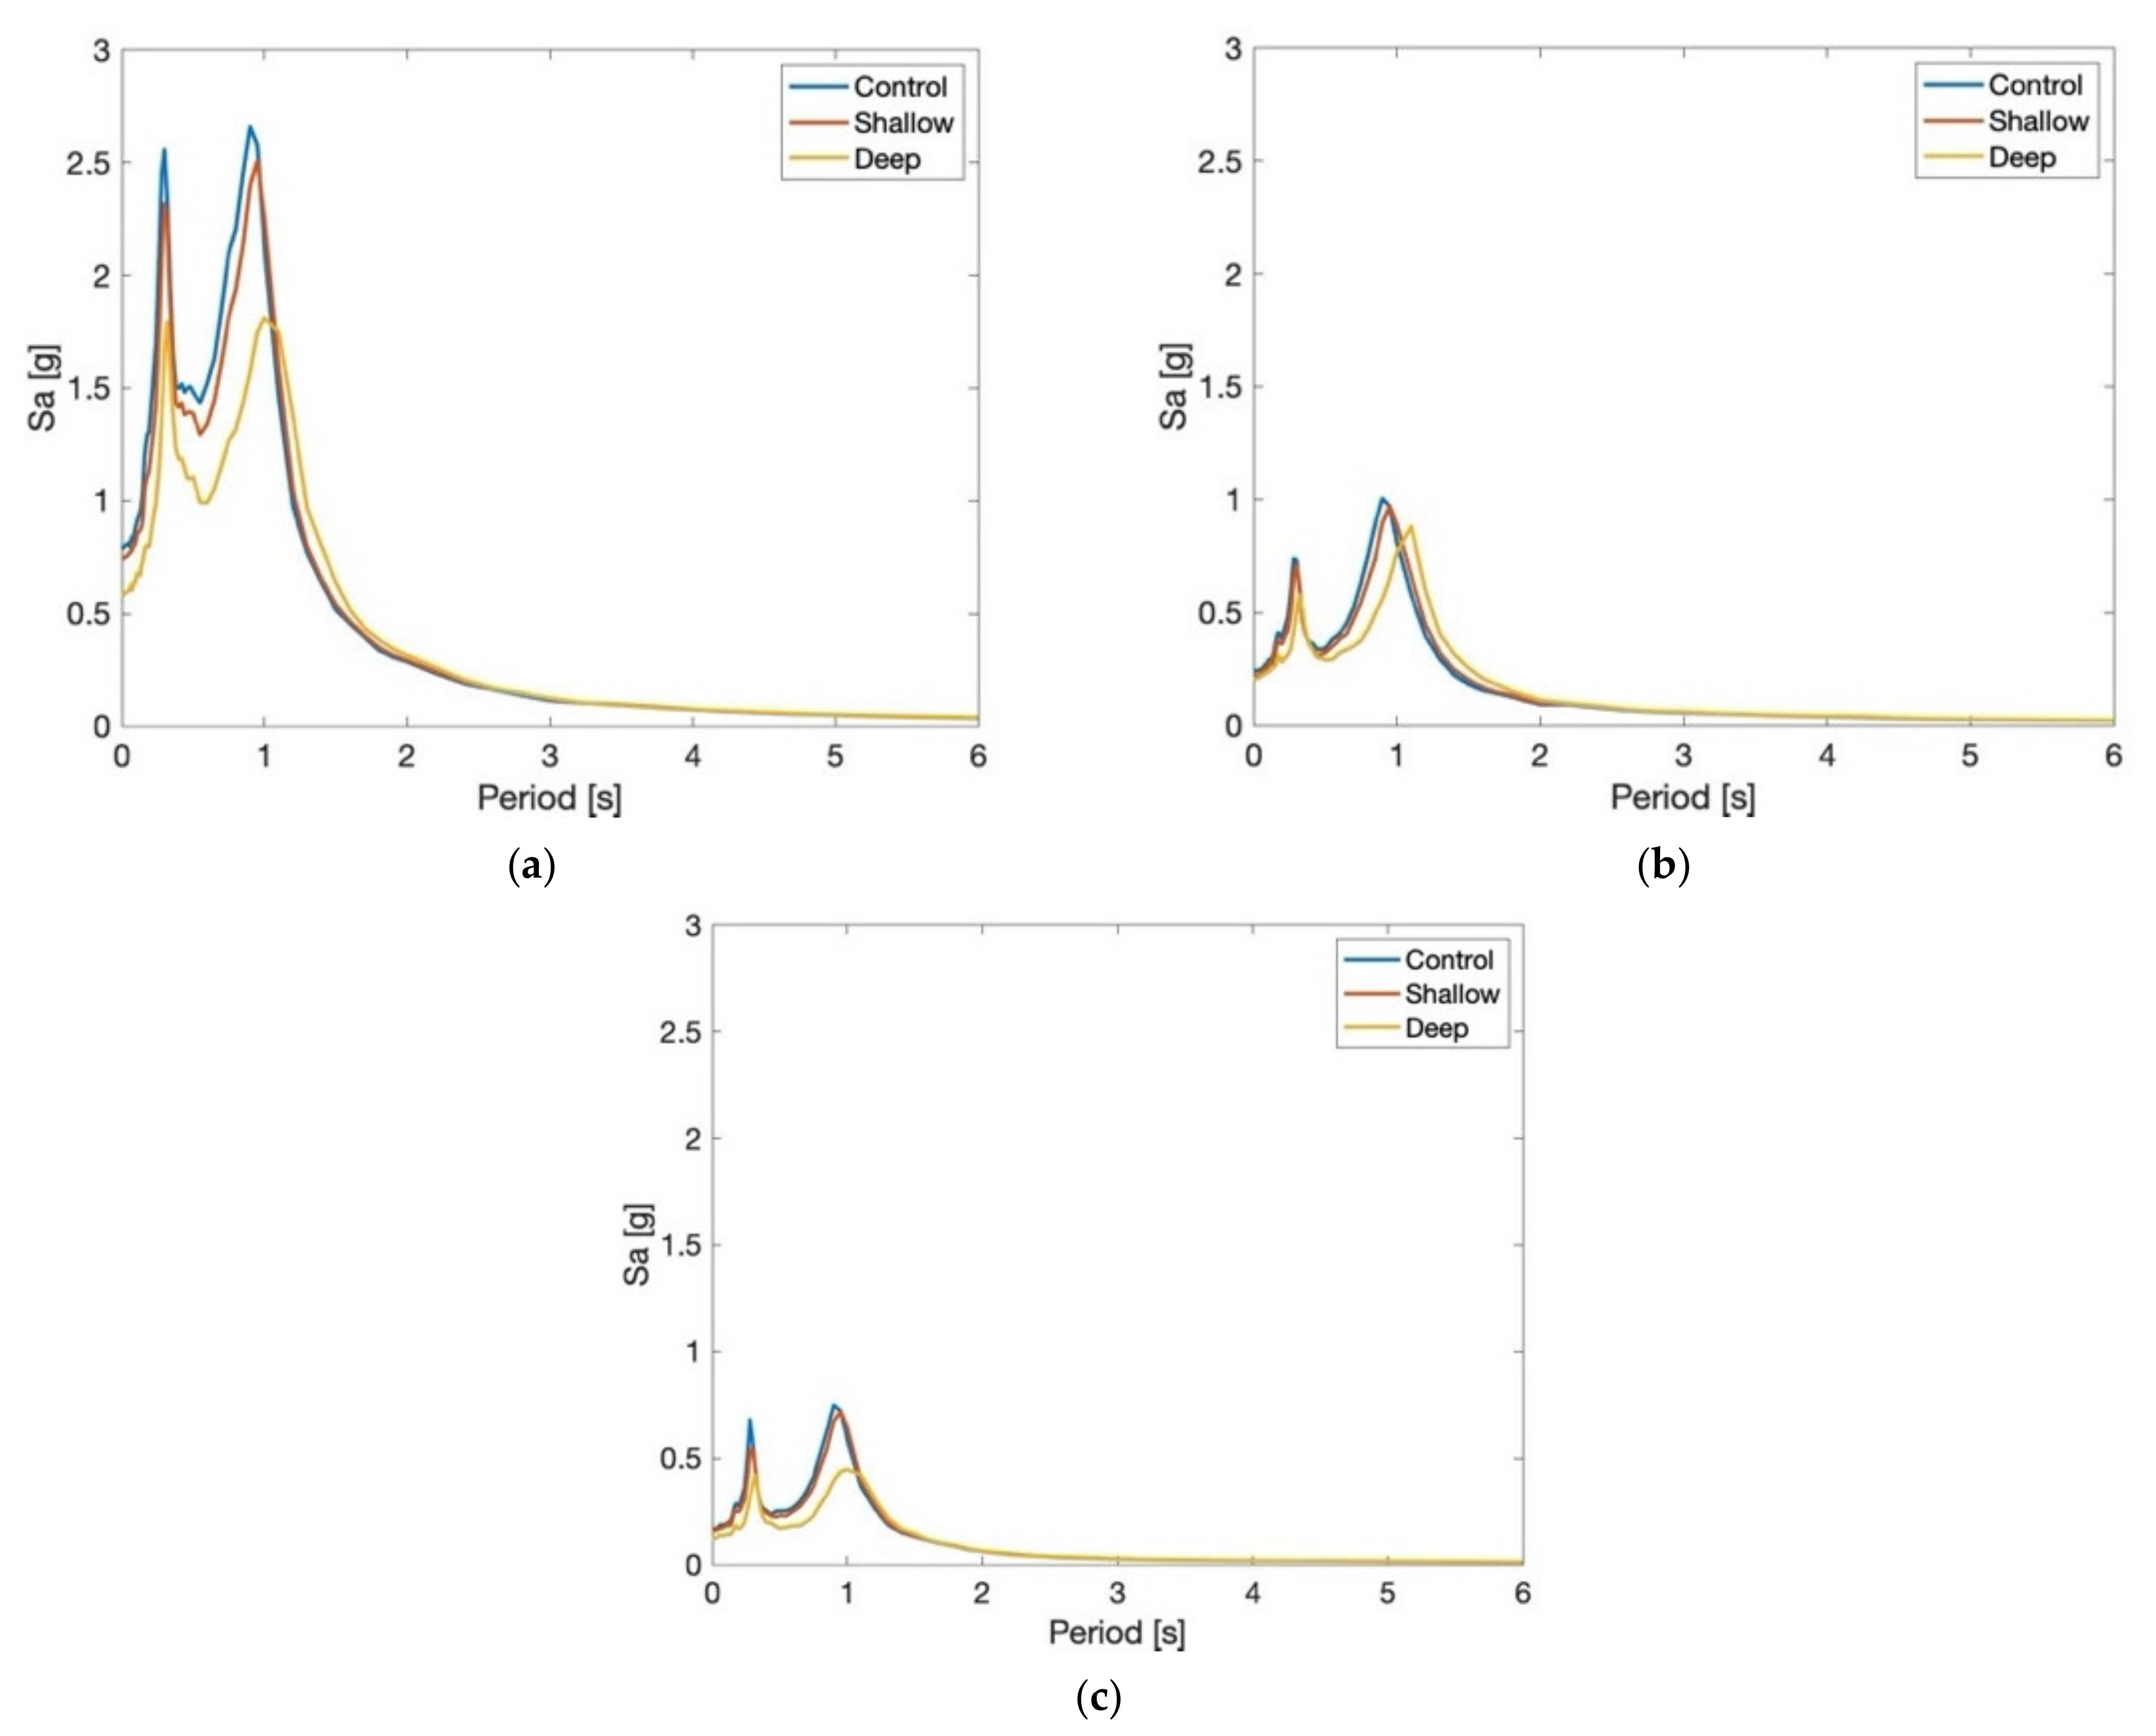
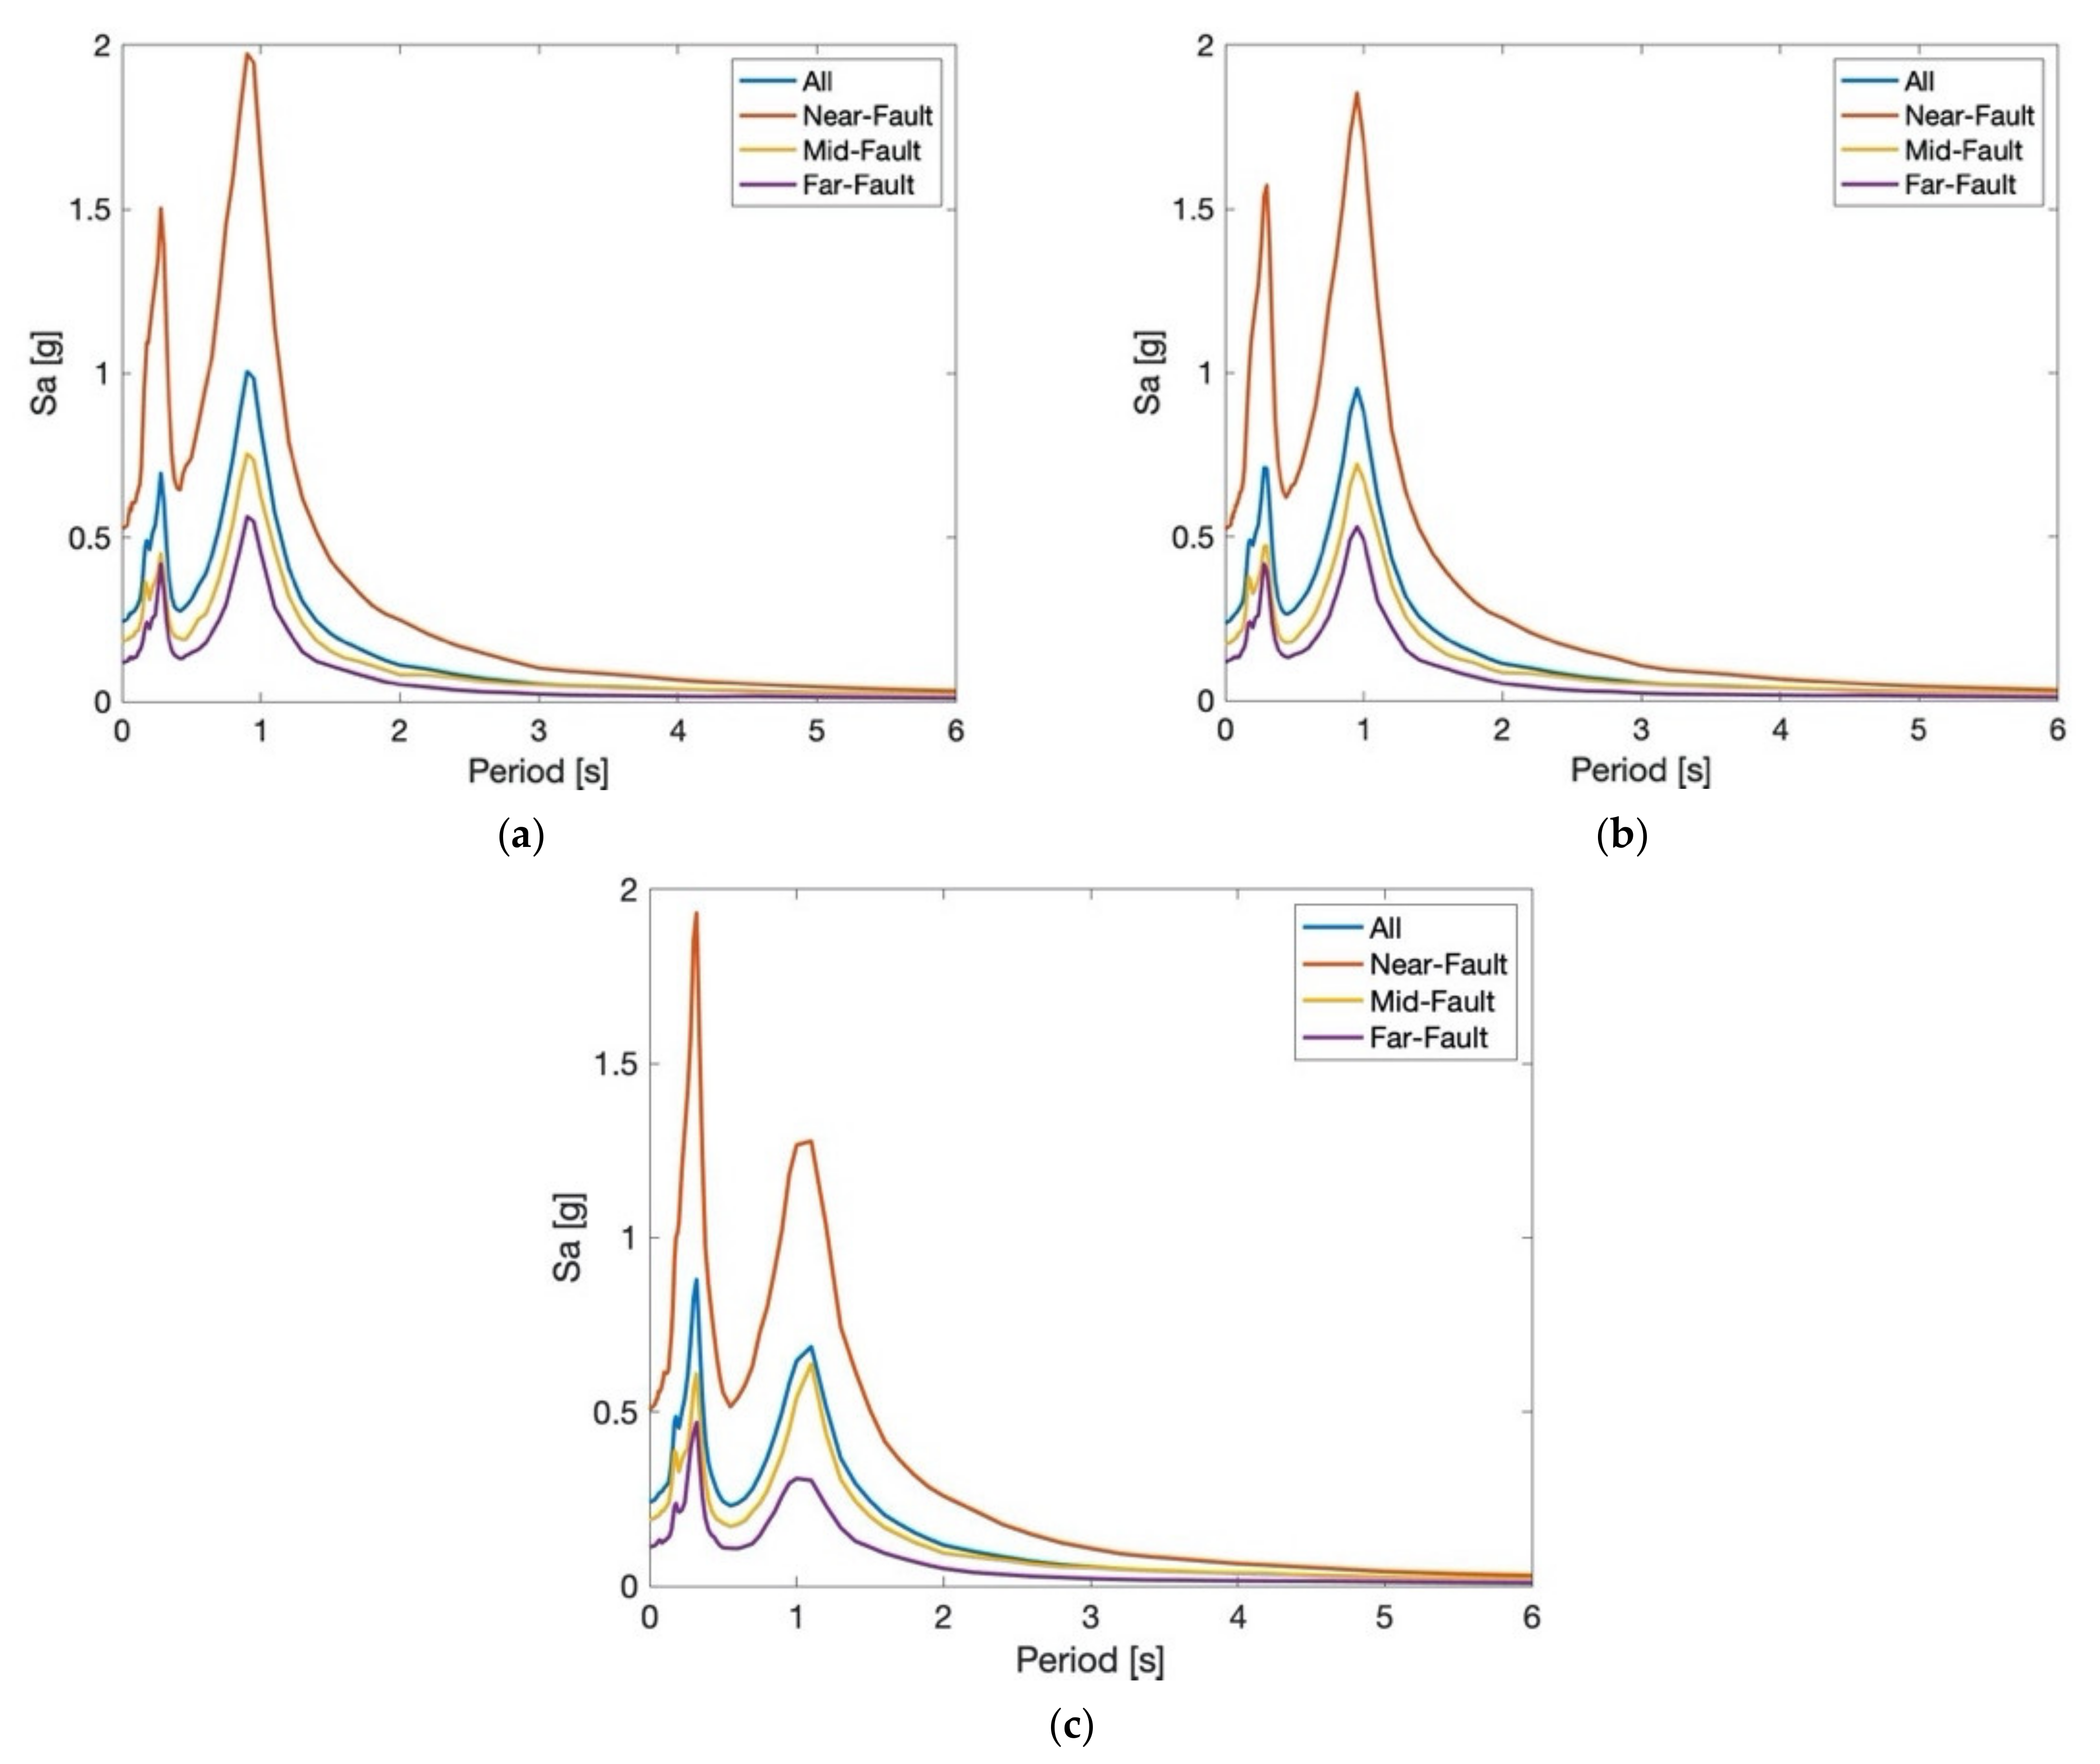
3.4. Floor Response Spectra
3.4.1. Roof
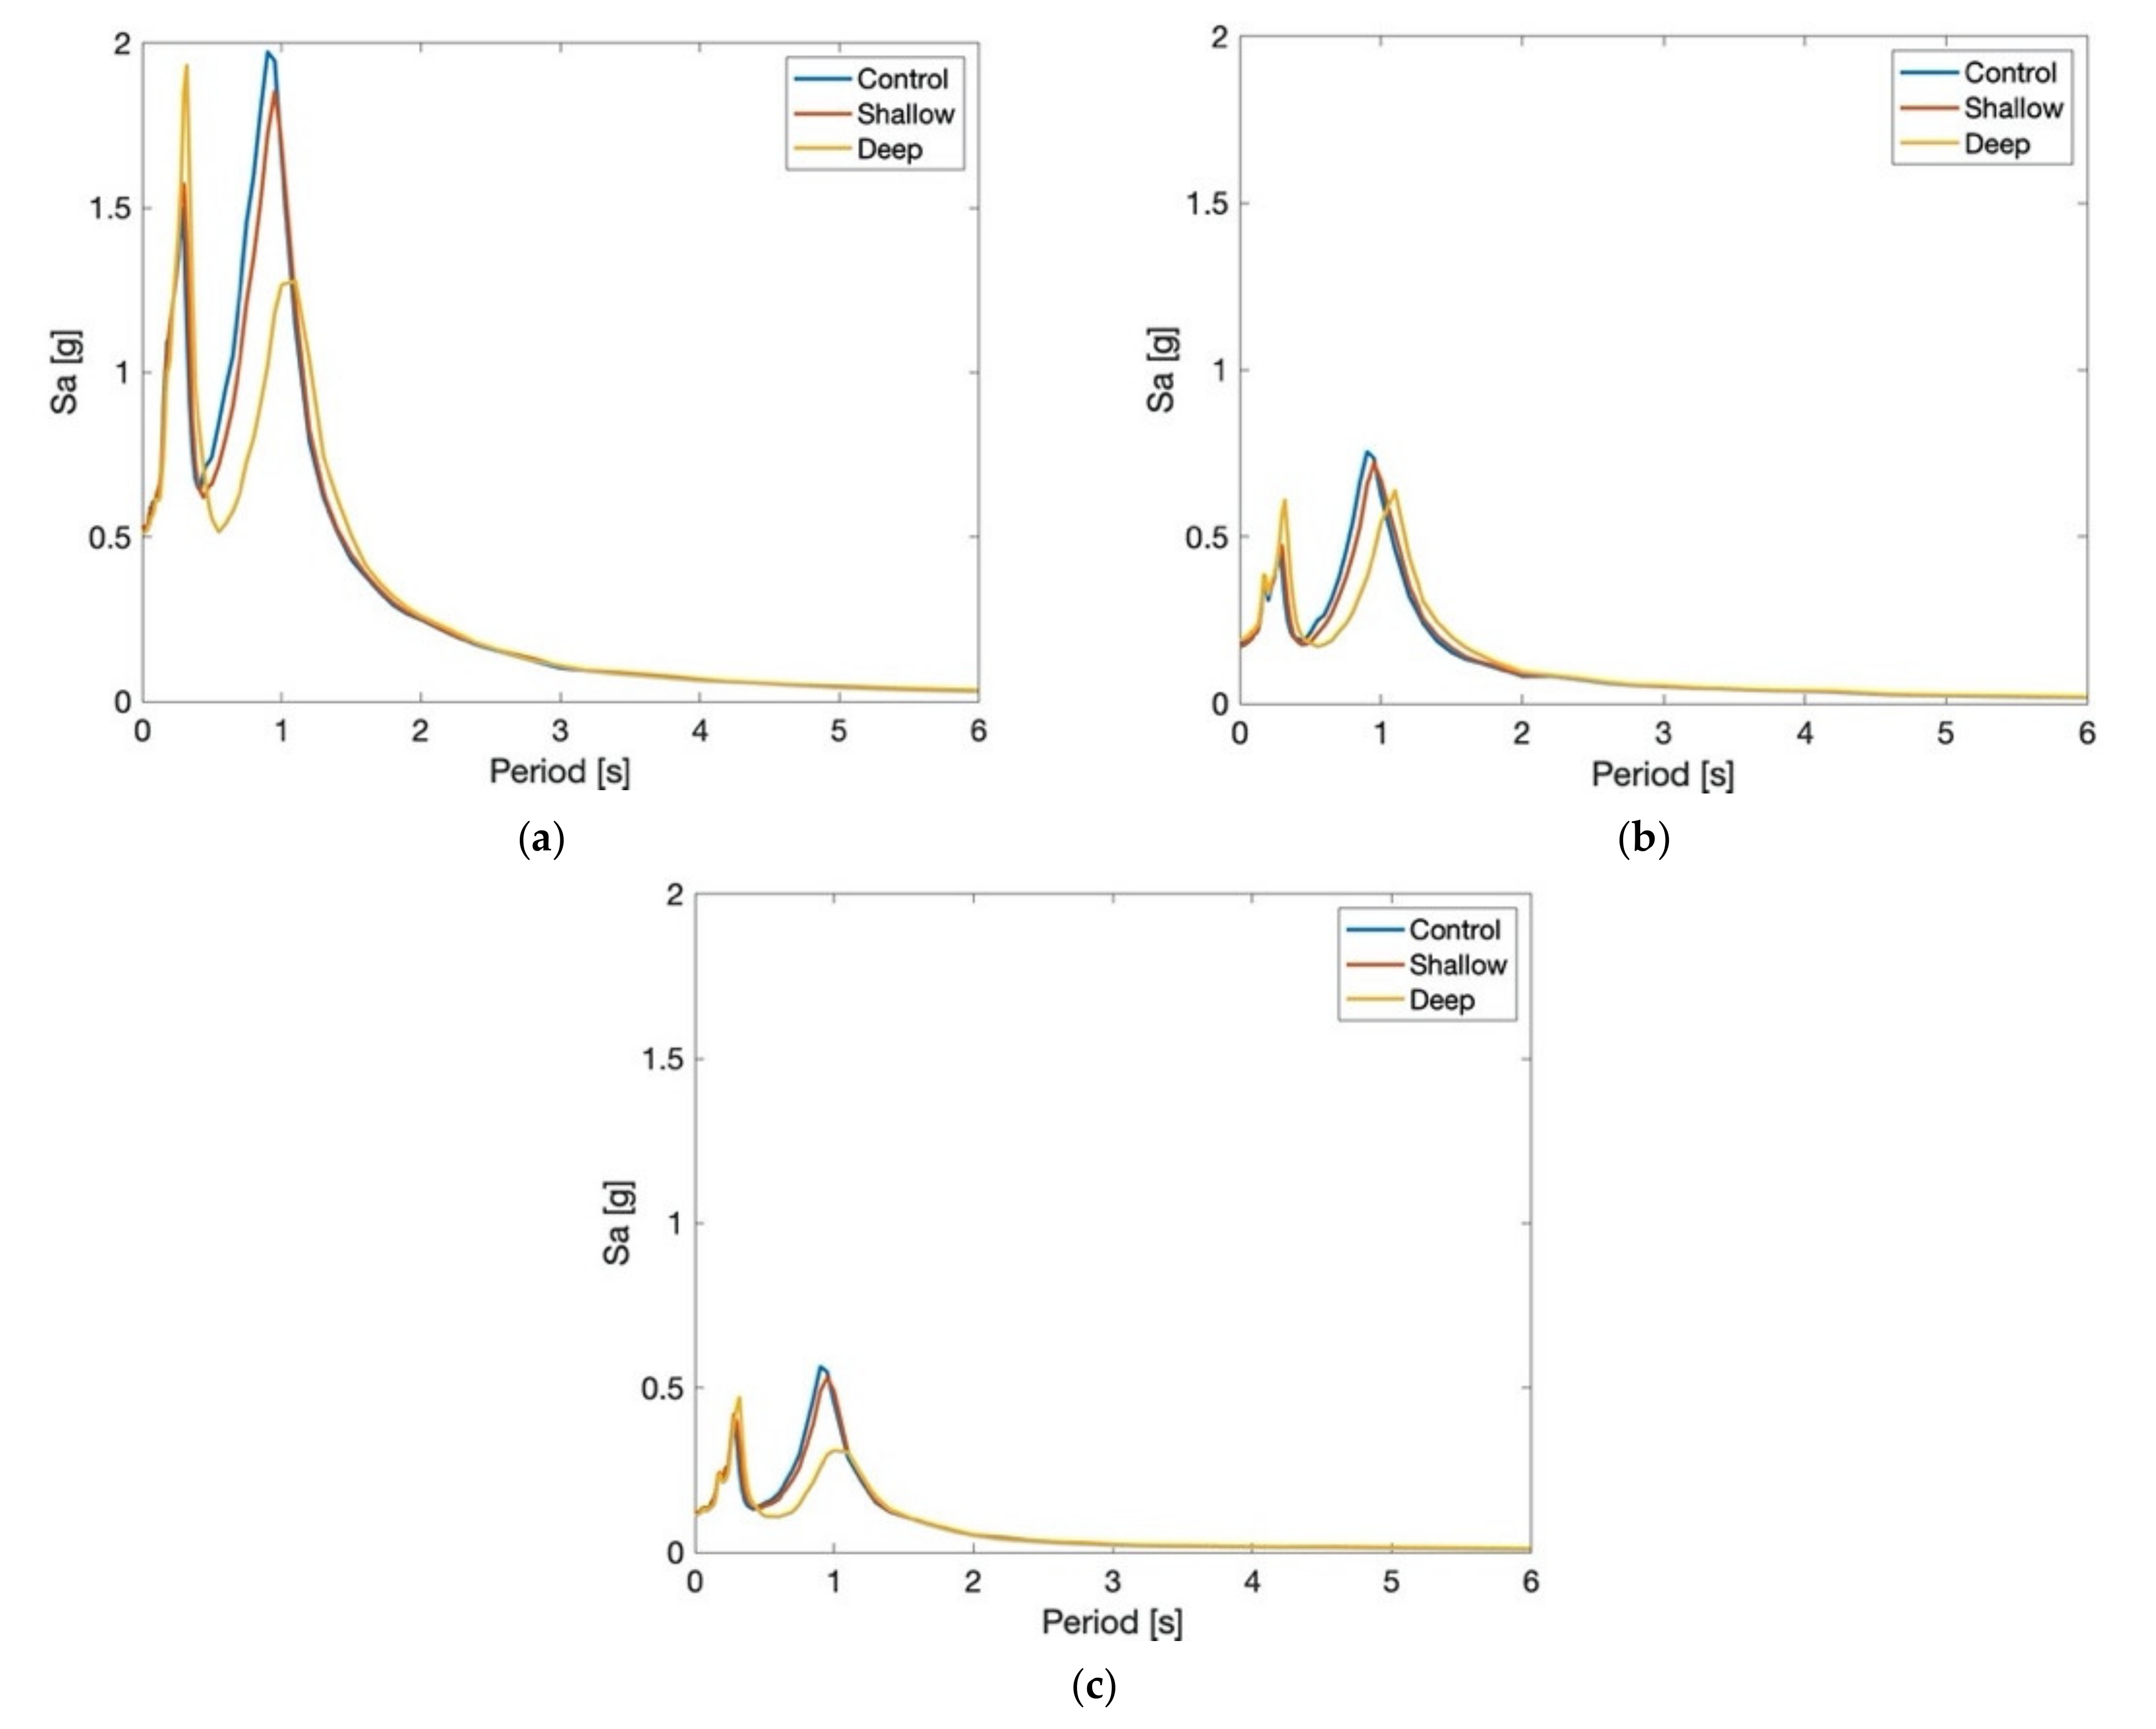
3.4.2. 3rd Floor
4. Conclusions
Author Contributions
Funding
Institutional Review Board Statement
Informed Consent Statement
Data Availability Statement
Acknowledgments
Conflicts of Interest
References
- Beilic, D.; Casotto, C.; Nascimbene, R.; Cicola, D.; Rodrigues, D. Seismic fragility curves of single storey RC precast structures by comparing different Italian codes. Earthq. Struct. 2017, 12, 359–374. [Google Scholar] [CrossRef]
- Filiatrault, A.; Sullivan, T. Performance-based seismic design of nonstructural building components: The next frontier of earthquake engineering. Earthq. Eng. Eng. Vib. 2014, 13, 17–46. [Google Scholar] [CrossRef]
- Nascimbene, R. Numerical Model of a Reinforced Concrete Building: Earthquake Analysis and Experimental Validation. Period. Polytech. Civ. Eng. 2015, 59, 521–530. [Google Scholar] [CrossRef]
- Sullivan, T.J.; Calvi, P.M.; Nascimbene, R. Towards improved floor spectra estimates for seismic design. Earthq. Struct. 2013, 4, 109–132. [Google Scholar] [CrossRef]
- Taghavi, S.; Miranda, E. Response Assessment of Nonstructural Building Elements; PEER Report 2003/05; University of California: Berkeley, CA, USA, 2003. [Google Scholar]
- National Roofing Contractors Association. The NRCA Green Roof Systems Manual; National Roofing Contractors Association: Rosemont, IL, USA, 2007. [Google Scholar]
- Peck, S.; Kuhn, M. Design Guidelines for Green Roofs; Ontario Association of Architects: Ottawa, ON, Canada, 2003. [Google Scholar]
- Dinardo, K. The Green Revolution Spreading Across Our Rooftops. The New York Times, 9 October 2019. [Google Scholar]
- United States Department of Energy. 2011 Buildings Energy Data Book; D&R International Ltd.: Silver Spring, MD, USA, 2012.
- Junnila, S.; Horvath, A. Life-cycle environmental effects of an office building. J. Infrastruct. Syst. 2003, 9, 157–166. [Google Scholar] [CrossRef]
- Thormark, C. Energy and resources, material choice and recycling potential in low energy buildings. In Proceedings of the International CIB Conference SB07 Sustainable Construction, Materials and Practices, Lisbon, Portugal, 12–14 September 2007. [Google Scholar]
- GBA. Green Roofs. Where All People Can Thrive. Available online: www.go-gba.org/resources/green-building-methods/green-roofs/ (accessed on 6 June 2020).
- Dunnett, N.; Nagase, A.; Hallam, A. The dynamics of planted and colonizing species on a green roof over six growing seasons 2001–2006: Influence of substrate depth. Urban Ecosyst. 2008, 11, 373–384. [Google Scholar] [CrossRef]
- Hutchinson, D.; Abrams, P.; Retzlaff, R.; Liptan, T. Stormwater Monitoring Two Ecoroofs In Portland, Oregon, USA; Greening Rooftops for Sustainable Communities: Chicago, IL, USA, 2003. [Google Scholar]
- MacMullan, E.; Reich, S.; Puttman, T.; Rodgers, K. Cost-benefit evaluation of ecoroofs. In Proceedings of the 2008 International LID Conference, ASCE, Seattle, WA, USA, 16–19 November 2008. [Google Scholar]
- Stovin, V.; Dunnett, N.; Hallam, A. Green roofs-getting sustainable drainage off the ground. In Proceedings of the 6th NOVATECH International Conference of Sustainable Techniques and Strategies in Urban Water Mangement, NOVATECH, Lyon, France, 25–28 June 2007; pp. 11–18. [Google Scholar]
- United States Green Building Council. LEED Credit Library. LEED BD+C: v4.1—LEEDv4.1; United States Green Building Council: Washington, DC, USA, 2020. [Google Scholar]
- Liu, K.K.Y.; Baskaran, B.A. Thermal performance of extensive green roofs in cold climates. In Proceedings of the 2005 World Sustainable Building Conference, Tokyo, Japan, 27–29 September 2005. [Google Scholar]
- Gerrity, J.; Hall, K.; Leasia, J.; Rogers, D.; Stanley, L.; Van Epps, C. Green Roofing at the University of Michigan Final Report; University of Michigan: Ann Arbor, MI, USA, 2012. [Google Scholar]
- Vijayaraghavan, K. Green roofs: A critical review on the role of components, benefits, limitations and trends. Renew. Sustain. Energy Rev. 2016, 57, 740–752. [Google Scholar] [CrossRef]
- Carson, T.B.; Marasco, D.E.; Culligan, P.J.; McGillis, W.R. Hydrological performance of extensive green roofs in New York City: Observations and multi-year modeling of three full-scale systems. Environ. Res. Lett. 2013, 8, 024036. [Google Scholar] [CrossRef]
- DiGiovanni, K.; Gaffin, S.R.; Montalto, F.; Rosenzweig, C. Low Impact Development (LID) Technologies for Sustainable Stormwater Management: Green Roofs. In Proceedings of the 2010 Watershed Management Conference: Innovations in Watershed Management under Land Use and Climate Change Location, Madison, WI, USA, 23–27 August 2010. [Google Scholar]
- DiGiovanni, K.; Montalto, F.; Gaffin, S.; Rosenzweig, C. The applicability of classical predictive equations for the estimation of evapotranspiration from urban green spaces: Green roof results. J. Hydrol. Eng. 2013, 18, 99. [Google Scholar] [CrossRef]
- Gaffin, S.R.; Imhoff, M.; Rosenzweig, C.; Khanbilvardi, R.; Pasqualini, A.; Kong, A.Y.Y.; Grillo, D.; Freed, A.; Hillel, D.; Hartung, E. Bright is the new black—multi-year performance of high-albedo roofs in an urban climate. Environ. Res. Lett. 2012, 7, 014029. [Google Scholar] [CrossRef]
- Susca, T.; Gaffin, S.R.; Dell’Osso, G.R. Positive Effects of Vegetation: Urban Heat Island and Green Roofs. Environ. Pollut. 2011, 159, 2119. [Google Scholar] [CrossRef]
- Wang, J.W.; Poh, C.H.; Tan, C.Y.T.; Lee, V.N.; Jain, A.; Webb, E.L. Building biodiversity: Drivers of bird and butterfly diversity on tropical urban roof gardens. Ecosphere 2017, 8, e01905. [Google Scholar] [CrossRef]
- San Francisco Planning. Better Roofs. Available online: https://sfplanning.org/project/better-roofs (accessed on 12 June 2020).
- City of Chicago. Chicago Planning and Development. Chicago Sustainable Development Policy Handbook. Available online: https://www.chicago.gov/city/en/depts/dcd/supp_info/sustainable_development/chicago-sustainable-development-policy-handbook0.html (accessed on 12 June 2020).
- Green Roofs and LEED Certification. LEED and Green Roofs. Available online: https://www.greenrooftechnology.com/leed/leed_Greenroofs (accessed on 12 June 2020).
- Berke, P.R. Natural hazard reduction and sustainable development: A global assessment. J. Plan. Lit. 1995, 9, 370–382. [Google Scholar] [CrossRef]
- Bokalders, V.; Block, M. The Whole Building Handbook; Earthscan: London, UK, 2010. [Google Scholar]
- Schwab, A.K.; Brower, D.J. Sustainable Development and Natural Hazards Mitigation; Division of Emergency Management: Raleigh, NC, USA, 1999. [Google Scholar]
- Almufti, I.; Willford, M. REDi Rating System: Resilience-Based Earthquake Design Initiative for the Next Generation of Buildings; Arup: London, UK, 2013. [Google Scholar]
- USRC. Available online: http://www.usrc.org/ (accessed on 12 June 2020).
- Porter, K.A. An Overview of PEER’s Performance-based Earthquake Engineering Methodology. In Proceedings of the Ninth International Conference on Applications of Probability and Statistics in Engineering, San Francisco, CA, USA, 6–9 July 2003. [Google Scholar]
- Moehle, J.; Deierlein, G.G. A framework methodology for performance-based earthquake engineering. In Proceedings of the 13th World Conference on Earthquake Engineering, Vancouver, BC, Canada, 1–6 August 2004. Paper No. 679. [Google Scholar]
- Welsh-Huggins, S.J.; Liel, A.B. Integrating green and resilient building design for enhanced disaster recovery. In Proceedings of the 3rd International Conference on Urban Disaster Reduction, Earthquake Engineering Research Institute, Boulder, CO, USA, 28 September–1 October 2014. [Google Scholar]
- Welsh-Huggins, S.J.; Liel, A.B. Integrating hazard-induced damage and environmental impacts in building life-cycle assessments. In Proceedings of the 2014 International Symposium of Life-Cycle Civil Engineering, Tokyo, Japan, 16–19 November 2014. [Google Scholar]
- Kraupa, T.J.; Mason, H.B.; Stuedlein, A.W.; Higgins, C. Characterization of ecoroofs and ecoroof soils. In Proceedings of the GeoCongress 2014, Geotechnical Special Publication 234: Geo-Characterization and Modeling for Sustainability, Atlanta, GA, USA, 23–26 February 2014; p. 3571. [Google Scholar] [CrossRef]
- Kraupa, T.J.; Stuedlein, A.W.; Mason, H.B.; Higgins, C.C. Engineered Ecoroof Systems: Geotechnical Considerations. ASCE J. Infrastruct. Syst. 2016, 22. [Google Scholar] [CrossRef]
- Court, A.; Simonen, K.; Webster, M.; Trusty, W.; Morris, P. Linking next-generation performance-based seismic design criteria to environmental performance (ATC-86 and ATC-58). Struct. Congr. 2012, 2012, 922–928. [Google Scholar] [CrossRef]
- Permitting Guide for Green Roofs, City of Berkeley Green Building Initiative. 2011. Available online: https://www.cityofberkeley.info/uploadedFiles/Planning_and_Development/Level_3_ (accessed on 12 June 2020).
- United States, Congress, Environmental Affairs Department. Green Roofs—Cooling Los Angeles, A Resource Guide; United States, Congress, Environmental Affairs Department: Washington, DC, USA, 2006.
- Weiler, S.K.; Scholz-Barth, K. Green Roof Systems; Wiley: Hoboken, NJ, USA, 2009. [Google Scholar]
- Gromala, D.S.; Kapur, O.; Kochkin, V.; Line, P.; Passman, S.; Reeder, A.; Trusty, W. Natural Hazards and Sustainability for Residential Buildings; FEMA P-798; FEMA: Washington, DC, USA, 2010. [Google Scholar]
- Fountain, H. Green Roof Collapses in Illinois. New York Times, 18 February 2011. [Google Scholar]
- Baltic Course. Latvia: Civil Engineer Sergets Sentenced to Six Years in Jail for Zolitude Store Collapse. 2020. Available online: http://www.baltic-course.com/eng/legislation/doc=154160 (accessed on 12 June 2020).
- Global Post. Design Fault Likely Caused Latvia Roof Cave-In; Global News Enterprises LLC: Boston, MA, USA, 2013. [Google Scholar]
- Matta, E.; De Stefano, A. Robust design of mass-uncertain rolling-pendulum TMDs for the seismic protection of building. Mech. Syst. Signal Process. 2007, 23, 127–147. [Google Scholar] [CrossRef]
- Matta, E.; De Stefano, A. Seismic performance of pendulum and translational roof-garden TMDs. Mech. Syst. Signal Process. 2009, 23, 127–147. [Google Scholar] [CrossRef]
- Carmody, M.O.; Jasarevic, M.; Omenzetter, P.; Clifton, G.C.; Fassman, E.A. Seismic Response of Green Roofs. In Proceedings of the 2009 New Zealand Society for Earthquake Engineering, Auckland, New Zealand, 4–5 September 2009. [Google Scholar]
- Carmody, M.O. Seismic Response of Green Roofs; Department of Civil and Environmental Engineering, University of Auckland: Auckland, New Zealand, 2009. [Google Scholar]
- Reed, D.A.; Yeh, H.; Ju, H.; Yu, J.; Gardarsson, S.M. Performance of Tuned Liquid Dampers under Large Amplitude Excitation. J. Wind Eng. Ind. Aerodyn. 1998, 74–76, 923–930. [Google Scholar] [CrossRef]
- Welsh-Huggins, S.J.; Abbie, L.B. A Life-Cycle Framework for Integrating Green Building and Hazard-Resistant Design: Examining the Seismic Impacts of Buildings with Green Roofs. Struct. Infrastruct. Eng. 2016, 13, 19–33. [Google Scholar] [CrossRef]
- McCallen, D.; Larsen, S. NEVADA—A Simulation Environment for Regional Estimation of Graound Motion and Structural Response; UCRL-ID-152115; Lawrence Livermore National Lab: Livermore, CA, USA, 2003. [Google Scholar]
- Ancheta, T.D.; Darragh, R.B.; Stewart, J.P.; Seyhan, E.; Silva, W.J.; Chiou, B.S.J.; Wooddell, K.E.; Graves, R.W.; Kottke, A.R.; Boore, D.M.; et al. PEER 2013/03-PEER NGA-West2 Database; Pacific Earthquake Engineering Research Center: Berkeley, CA, USA, 2013. [Google Scholar]
- McKenna, F.; Fenves, G.L. Open System for Earthquake Engineering Simulation; University of California: Berkeley, CA, USA, 2000. [Google Scholar]
- Chen, G.; Wu, J. Transfer-Function-Based Criteria for Decoupling of Secondary Systems. J. Eng. Mech. 1999, 125, 340–346. [Google Scholar] [CrossRef]
- Bardopoulos, F.; Papagiannopoulos, G.; Pnevmatikos, N. Design considerations for photovoltaic panel arrays made from aluminum: A case study. Steel Constr. 2020, 13, 52–60. [Google Scholar] [CrossRef]
- United States Nuclear Regulatory Commission. Regulatory Guide 1.122; United States Nuclear Regulatory Commission: Rockville, MD, USA, 1978.
- Pinkawa, M.; Hoffmeister, B.; Feldmann, M. Floor Response Spectra Considering Influence of Higher Modes and Dissipative Behaviour. In Seismic Design of Industrial Facilities; Klinkel, S., Butenweg, C., Lin, G., Holtschoppen, B., Eds.; Springer: Wiesbaden, Germany, 2014. [Google Scholar] [CrossRef]
- Vukobratovic, V.; Fajfar, P. Floor spectra for analysis of acceleration-sensitive equipment in buildings. In Proceedings of the International Conference on Earthquake Engineering and Structural Dynamics, Reykjavik, Iceland, 12–14 June 2017. [Google Scholar]
- Haymes, K.; Sullivan, T.; Chandramohan, R. Developing Procedures for the Prediction of Floor Response Spectra; University of Canterbury: Christchurch, New Zealand, 2018. [Google Scholar]
- Gabbianelli, G.; Perrone, D.; Brunesi, E.; Monteiro, R. Seismic Acceleration and Displacement Demand Profiles of Non-structural Elements in Hospital Buildings. Buildings 2020, 10, 243. [Google Scholar] [CrossRef]
- Baker, J.W.; Cornell, C.A. Which Spectral Acceleration Are You Using? Earthq. Spectra 2006, 22, 293–312. [Google Scholar] [CrossRef]


| Event | Year | Abbreviation | PGA | Magnitude | Station | Distance (km) |
|---|---|---|---|---|---|---|
| Duzce, Turkey | 1999 | DZ00 | 0.40 g | 7.14 | Duzce | 0 |
| DZ09 | 0.12 g | 7.14 | Lamont1062 | 9.14 | ||
| DZ26 | 0.03 g | 7.14 | Lamont1060 | 25.78 | ||
| DZ45 | 0.02 g | 7.14 | Sakarya | 45.16 | ||
| Kobe | 1995 | KB00 | 0.69 g | 6.9 | Takarazuka | 0 |
| KB07 | 0.48 g | 6.9 | Nishi-Akashi | 7.08 | ||
| KB25 | 0.21 g | 6.9 | Morigawachi | 24.78 | ||
| KB50 | 0.09 g | 6.9 | Chihaya | 49.91 | ||
| LomaPrieta | 1989 | LP00 | 0.65 g | 6.93 | Corralitos | 0.16 |
| LP12 | 0.56 g | 6.93 | GilroyArray#3 | 12.23 | ||
| LP31 | 0.22 g | 6.93 | PaloAlto-1900Embarc. | 30.56 | ||
| LP59 | 0.24 g | 6.93 | SFIntern.Airport | 58.52 | ||
| MorganHill | 1984 | MH13 | 0.20 g | 6.19 | GilroyArray#3 | 13.01 |
| MH24 | 0.03 g | 6.19 | AgnewsStateHospital | 24.48 | ||
| MH31 | 0.03 g | 6.19 | Fremont-MissionSanJose | 31.34 | ||
| MH52 | 0.04 g | 6.19 | APEEL1E-Hayward | 51.68 | ||
| Northridge | 1994 | NR05 | 0.43 g | 6.69 | PacoimaKagelCanyon | 5.26 |
| NR21 | 0.26 g | 6.69 | LakeHughes#12A | 20.77 | ||
| NR35 | 0.32 g | 6.69 | LA-CityTerrace | 35.03 | ||
| NR59 | 0.09 g | 6.69 | BuenaPark-LaPalma | 59.35 | ||
| Chi-Chi | 1999 | TW00 | 0.86 g | 7.62 | CHY080 | 0.11 |
| TW16 | 0.20 g | 7.62 | CHY036 | 16.04 | ||
| TW42 | 0.05 g | 7.62 | CHY027 | 41.99 | ||
| TW60 | 0.06 g | 7.62 | CHY058 | 59.79 |
| Model: | Period, s | Frequency, Hz | ||||
|---|---|---|---|---|---|---|
| I | II | III | I | II | III | |
| Control | 0.91 | 0.29 | 0.17 | 1.10 | 3.49 | 5.96 |
| Shallow | 0.95 | 0.30 | 0.17 | 1.05 | 3.38 | 5.92 |
| Deep | 1.07 | 0.32 | 0.17 | 0.93 | 3.16 | 5.85 |
Publisher’s Note: MDPI stays neutral with regard to jurisdictional claims in published maps and institutional affiliations. |
© 2021 by the authors. Licensee MDPI, Basel, Switzerland. This article is an open access article distributed under the terms and conditions of the Creative Commons Attribution (CC BY) license (https://creativecommons.org/licenses/by/4.0/).
Share and Cite
Tam, S.; Wong, J. Seismic Performance of a Green Roof Structure. Sustainability 2021, 13, 4278. https://doi.org/10.3390/su13084278
Tam S, Wong J. Seismic Performance of a Green Roof Structure. Sustainability. 2021; 13(8):4278. https://doi.org/10.3390/su13084278
Chicago/Turabian StyleTam, Svetlana, and Jenna Wong. 2021. "Seismic Performance of a Green Roof Structure" Sustainability 13, no. 8: 4278. https://doi.org/10.3390/su13084278
APA StyleTam, S., & Wong, J. (2021). Seismic Performance of a Green Roof Structure. Sustainability, 13(8), 4278. https://doi.org/10.3390/su13084278