Abstract
There has been long and ongoing interest in the impacts of high-speed rail (HSR) on regional spatial development. Most existing studies, however, reported findings at relatively coarse geographic scales, i.e., at the prefecture-city or above level in the Chinese context. This paper presents the empirical evidence of HSR impacts from the county-level cities in China’s Mid-Yangtze River City-Cluster Region (MYRCCR). The study utilized rail time data and the socio-economic data for MYRCCR’s 185 county-level cities in the years of 2006 (without HSR) and 2014 (with HSR) and analyzed the impacts of HSR on inter-city travel times, accessibility, spatial inequality, and regional economic linkages among the MYRCCR cities. The results show that, from 2006 to 2014, HSR reduced city-to-city average travel time by 34.5% or 124 min and improved accessibility to all cities in the MYRCCR. HSR’s impacts on accessibility and spatial equality exhibited a scale-differentiated pattern. MYRCCR-wide, HSR transformed a pattern of spatial polarization towards the one of corridorization. Cities located on major HSR corridors became more balanced in 2014 than in 2006. Nevertheless, at the county-city level, the gap between cities with the most and the least accessibility gains was much greater than the gap between those with the largest and the smallest travel time savings. Attributable to HSR services, the intensity of economic linkage increased between MYRCCR cities, especially between the provincial capital cities and those on the major lines of the national HSR grid, which implies an emerging process towards territorial cohesion in MYRCCR. National, provincial, and local governments should consider transportation as well as non-transportation policies and measures to direct HSR impacts towards further enhanced spatial development and regional equality.
1. Introduction
High-speed rail (HSR) has experienced a phenomenal growth in China in the past two decades. Investing in HSR is an essential part of China’s national spatial development strategy [1,2,3]. The recent update of national spatial strategy highlights city-cluster regions as the main form to promote coordinated development between cities of different sizes and to reduce rural-urban as well as inter-regional disparities. HSR together with other transportation systems are anticipated to enhance the accessibility of people, jobs, and capital within and between city-cluster regions and to strengthen local and regional competitiveness in the global economy [4,5].
How and to what extent does HSR affect the spatial development of city regions? This question has long been of interest to academia and policy makers in China and abroad [6,7,8,9,10,11]. In Europe, much research has been done concerning HSR’s impacts on passenger travel, accessibility, and local and regional economies [12,13,14,15,16,17,18]. In recent years, there has been increasing research on China’s HSR effects in terms of compressions of inter-city travel time, cost, distance, competition with civil aviation, regional economic growth, and spatial inequity [19,20,21,22,23]. Nevertheless, the empirical knowledge on China’s HSR impacts remains relatively inadequate given the large territory and diverse rural-urban settings of the country. Most existing studies on China’s HSR impacts dwelled at the prefecture-city or above level (for detailed explanations on China’s urban hierarchy, see [24]). A prefecture-city may contain one or as many as 24 counties or county-level cities (City of Baoding in Hebei Province). Hence, findings from studies at this level are important, but still limited due to the rather coarse spatial scale. This paper aims to enhance the knowledge base by presenting the empirical evidence of HSR impacts learned from a study at the county-city level in China’s Mid-Yangtze River City-Cluster Region (MYRCCR). The study utilizes two years of data, before and after HSR in 2006 and 2014, respectively, and assesses HSR impacts around four topics of most concerns: travel time savings, accessibility changes, trends of spatial inequality, and economic linkage as an indicator of territorial cohesion. Based on the empirical findings, the study draws implications for spatial development and regional integration in MYRCCR and beyond. Being one of the 19 designated city-cluster regions and centrally located in China, MYRCCR plays a critical role in the country’s path towards the next higher level of economic development and social harmony. Lessons learned from MYRCCR are informative not only to China for its new phase of HSR project implementation and regional integration, but also to many other countries that are considering HSR investments [25,26].
The paper includes five parts. After this introduction, Section 2 reviews related studies. Section 3 provides an overview about MYRCCR, followed by the description of data and analytical methods used for the study. Section 4 presents analysis results and findings. Finally, the paper ends with concluding remarks.
2. Literature Review
There are voluminous studies concerning the direct and wider impacts of HSR. The following review focuses on those directly related to the topics of this study.
2.1. HSR Impacts on Travel Time
HSR services offer a variety of strong performing characteristics, for instance, high operating speed and large carrying capacity, safe and comfortable riding quality, punctuality, and less energy consumption and low eco-impacts compared to the competing travel modes. The direct impacts of HSR measure the magnitude of travel time savings brought by HSR. For instance, travel from Paris to London takes 2 h and 15 min by Eurostar, but nearly six hours by driving. Similarly, AVE train services between Madrid and Seville shorten travel time by nearly 60%, from 5 h 55 min to 2 h 30 min. Travel along the major inter-city corridors of China, for example, Beijing-Shanghai, Beijing-Wuhan, and Guangzhou-Wuhan, take 10~12 h by conventional trains for the distances of 1100–1300-km. HSR services compress the travel times in these corridors to 3~5 h [23,27]. Japan and South Korea have reported HSR-led travel time reductions in the range of 30–60% [28].
While travel time savings brought by HSR are widely evident along the trunk lines between major cities, the extent to which HSR reduces travel times between the tertiary or lower levels of cities (by size or administrative classification) is likely to vary significantly. Many factors affect the realization of HSR’s time-saving benefits for the low-rank cities. For example, in highly urbanized regions, these cities are apart in short distances (relative to those between major cities), which are not advantageous for HSR operations. The time-saving margins tend to be small. In addition, the low-rank cities have relatively small sizes of population and business that do not have enough demand to support frequent HSR services. Furthermore, the rather rigid geometric requirements for HSR route design make it difficult to connect all the low-rank cities through their city centers. As a result, many HSR stations are located far away from areas where residents and business concentrate. The added station access time discounts significantly the time-saving effects of HSR [29].
2.2. HSR Impacts on Accessibility
The effects of HSR on accessibility have been studied extensively in countries currently operating HSR services and in other countries where HSR lines are under construction or consideration [30]. These studies analyzed the extent to which HSR services improved access to jobs, services, labor markets, and other opportunities. Issues of great policy interests pertain to the differentiation of access improvements along the spatial and social dimensions. Vickerman, et al., for instance, reported that HSR elevated regional accessibility and supported economic development while at the same time HSR widened the gap in accessibility between the centrally located and the peripheral regions [17,18]. Ortega López and Monzón also observed that HSR services had positive cohesion effects at the national and corridor levels. At the regional level, however, both balancing and polarization effects occurred [31]. A recent study by Monzon et al. [32], applied the accessibility analytic to assess the territorial effects of HSR in Spain over a 25-year timeframe. Spain’s HSR, as the authors found, has enhanced the accessibility to most destinations in the country and contributed to achieving the policy goals of territorial cohesion set by the European Union.
The number of studies on HSR impacts in Asia and in China specifically has been growing rapidly [27,33,34,35]. To review a couple of them, Jiao et al. [36] and Cao et al. [37] studied the HSR effects in China at the national and regional scale. The study by Jiao, et al. examined HSR impacts on accessibility for prefecture level cities and reported the co-existence of substantial improvements and increased inequality in accessibility between regions and cities. Cao et al. used weighted average travel times and travel costs, contour measurements, and potential accessibility to quantify the accessibility impacts of China’s HSR network. The authors showed that HSR enhanced accessibility for the cities along the Beijing–Shanghai corridor and in the Pearl River Delta Region more than for other cities.
The empirical studies from the European and Asian cases suggest the varying patterns of HSR effects on accessibility at different spatial scales. Findings from one level of geography do not necessarily hold true with other levels [31,38]. The issue is known as the modifiable area unit problem [39]. Therefore, it is important to investigate HSR impacts at multiple scales in order to gain a full scope of knowledge, which was the motivation behind this study.
2.3. HSR Impacts on Spatial Development
Researchers have utilized a variety of methods and data to examine the wider impacts of HSR on urban and regional spatial development beyond travel time savings and accessibility modification [40,41,42]. New economic geography provides theoretical underpinning to these empirical efforts. In the European context, researchers have reported that HSR enhanced the overall status of the second and third-tier cities along HSR lines, changed the hierarchical structure of cities along the HSR, and promoted regional integration and territorial cohesion [32]. In the Asian cases, Kim analyzed the Seoul-Busan HSR line and identified the role of HSR in the spatial restructuring of the urban corridor [43]. Wang Wei et al. analyzed the HSR impacts on spatial agglomeration of industries and found that HSR reinforced the industrial agglomeration in central cities, but significantly reduced the industrial agglomeration in non-central cities [44]. HSR could widen regional spatial differences and induce spatial re-sorting [22]. The gravity model was commonly used to analyze the changing economic mass and market potential associated with HSR [45]. Several studies assessed the total external economic connections of cities as an indicator of city status in the regional spatial network [46,47,48]. Liu et al. [49] investigated China’s HSR impacts on regional disparities on the scale of territorial regions, city tiers grouped by population sizes, and city-clusters. The authors observed that disparities between regions and within city-clusters decreased after HSR arrived; however, the third-tier cities not in proximity to major metropolises fell farther behind as a result of HSR network expansion. In the study by Liu, et al., the third-tier cities refer mostly to those at the prefecture-level.
Despite a good number of studies already existing, the knowledge on HSR impacts in China remains limited relative to the sheer size of the country and the drastic variation among regions of different development stages. Specifically, there have been inadequate efforts concerning HSR’s impacts on medium and small sized cities in the fourth level (county-level cities) of China’s urban hierarchy. This study aims to fill the gap through the case study of MYRCCR.
3. Methodology
3.1. Study Case and Data
3.1.1. The Mid-Yangtze River City-Cluster Region
MYRCCR is composed of three provinces: Hubei, Hunan, and Jiangxi with a total land area of 317,000 km2. The city-cluster region includes 28 prefecture level cities and 185 county level cities. There are three provincial capital cities, Wuhan, Changsha, and Nanchang, that form a triangular territory similar to the Texas Triangle mega-region (which consists of Houston, Dallas/Ft. Worth, and San Antonio) in the United States [50]. MYRCCR is centrally located in China, situating in the approximate midpoint between Beijing and Guangzhou/Hong Kong on the north-south transportation backbone of China, and the east-west midpoint between Shanghai and Chongqing along the Yangtze River (Figure 1). Because of this critical location, MYRCCR is anticipated to develop as a growth engine in central China during the next stage of the country’s urbanization and progress. MYRCCR is also expected to foster regional integration and reduce rural-urban disparity through tri-province coordination and cooperation.
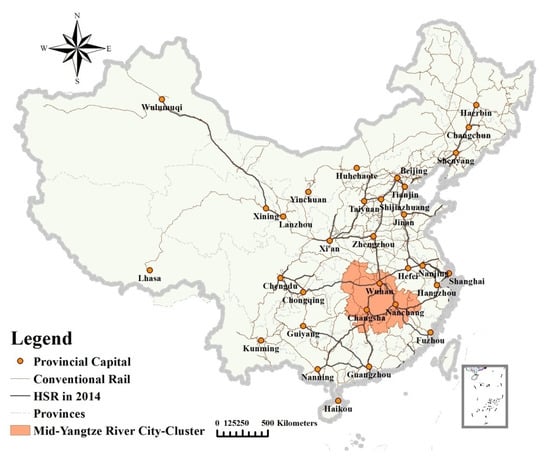
Figure 1.
High-Speed Rail Network and the Location Mid-Yangtze River City-Cluster Region (MYRCCR) in China.
3.1.2. Data on the Socioeconomics and Travel Times
As of 2014, 40 of MYRCCR’s 185 county-level cities had HSR stations, whereas 57 of them were served by conventional railways. The remaining 88 cities had no direct rail connection (Figure 2). The study compiled demographic and economic data for these cities from the 2006 and 2014 China Statistics Yearbooks, with supplementary data from provincial bureaus of statistics from Hubei, Hunan, and Jiangxi. Data on rail travel times for cities in MYRCCR came from the published operating timetables. For cities without HSR stations, we estimated with the ArcGIS Network Analysis tool the travel times by roadways, assuming an average speed of 40 km/h for county roads and the connecting streets from/to the nearest HSR stations in adjacent cities. The vector data of county-city boundaries, roadway and rail networks were extracted from the topographic map of China available from the National Geographic Information Center.
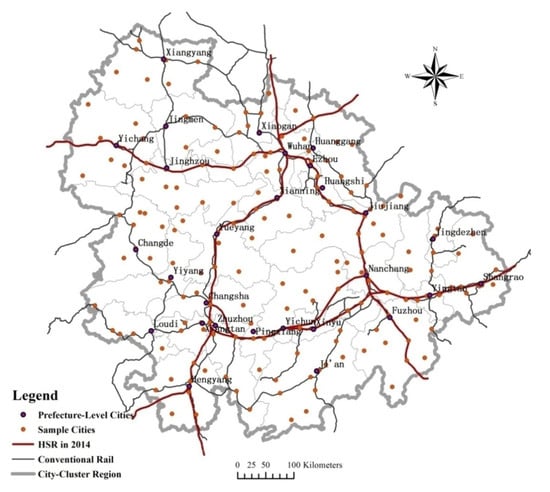
Figure 2.
Sample County-Level Cities (shown as dots on the map, with high-speed rail (HSR) network).
We chose the year of 2006 as the beginning point of the study’s timeframe considering the history of China’s HSR planning and investments. China Ministry of Railway announced the first national HSR plan in 2004 [51]. Implementing the plan relied predominately on the national transportation budget, which comes in a five-year cycle known as the national Five-Year Plan. The year 2006 was the commencing year of China’s 11th Five-Year Plan from which HSR development received the first wave of major investments. Before 2006, China’s rail operations went through five rounds of upgrading, elevating the speed limits on the conventional tracks. Resulting from the upgrades, the fast trains, coded as D-trains, run at the cruise speed of 200 km/h. The final, seventh round of rail upgrade came in 2007, with a number of major rail routes across the country operating trains up to 250 km/h. It was not until 2008 when the first HSR line of new generation trains began passenger services at the speed of 300~350 km/h. Nevertheless, the first line’s service market was rather limited to a distance of 117 km, connecting Tianjin with Beijing to serve initially the 2008 Olympic Games. China’s first line of HSR services for travel between city-cluster regions, coded as G-trains, started operating in 26 December 2009, beginning from Wuhan (Hubei provincial capital in MYRCCR) to the north, going through Changsha (Hunan provincial capital in MYRCCR), and ending in Guangzhou (a major city in the Peral River Delta City-Cluster Region) to the south for a distance of 1069 km (refer to Figure 1). In 2012, the Beijing-Wuhan HSR line began operating, completing China’s major north-south trunk line (in a total length of 2298 km) in the country’s HSR grid. Considering these historical events of HSR development pertaining to MYRCCR, we took the year of 2010 as the midpoint and the years of 2006 and 2014 as the starting and the ending point, respectively, of our study’s timeframe.
3.2. Analytical Methods
3.2.1. Travel Times
For the purpose of measuring the space-time compression by HSR, the study used average travel time from a county-level city to other cities in MYRCCR. The calculation takes the following form:
where TAi is the average travel time from city i to other cities; Tij is the minimum travel time from city i to city j; and n is the total number of cities.
3.2.2. Accessibility
Accessibility denotes the ease of access to opportunities, where opportunities can refer to population, employment, services, etc., depending on the purpose of analysis. This study applies the commonly used gravity model to measure accessibility [52]. The model takes the following form:
where PAi represents the potential accessibility of city i; Ej is the employment in city j; and Tij is the impedance measured by travel time from city i to city j. The parameter value of a reflects people’s sensitivity to increase in travel time, cost, or generalized price. It is usually obtained from local travel surveys. Unfortunately, inter-city travel surveys in MYRCCR were not available when this study was carried out (and are still unavailable as of today). This study took the value of 1, which was used by The World Bank [6] in its study of China’s HSR and also by other studies on accessibility modeling [53].
3.2.3. Inequality Measured by Coefficient of Variation (CV)
CV is given by the ratio of the standard deviation to the mean of a frequency distribution. It is one of the commonly used indicators for measuring inequality [54]. This study examines the CV of accessibility to analyze the degree and changes of inequality in MYRCCR from 2006 to 2014.
where SD and MN denote the standard deviation and the mean of employment accessibility, respectively.
3.2.4. Economic Linkage
To assess the strength and the changing pattern of economic linkage between MYRCCR cities, we applied the gravity model type of measure that has been used widely in other studies [47,48], as shown below:
where Pi and Pj represent the population of cities i and j, respectively; and represent the income of cities i and j, respectively; is the shortest travel time from city i to j; represents the economic linkage intensity between the two cities; Li represents the total economic linkage of city i with the rest of MYRCCR. The data on population and income of MYRCCR cities needed for calculating economic linkage came from the provincial statistics books in 2006 and 2014.
4. Results
4.1. Travel Time Impacts of HSR
Table 1 reports average travel times aggregated up to three levels of geography: MYRCCR, HSR or non-HSR cities, and county-level cities. Travel time reductions resulting from HSR services are evident across the city-cluster. Several observations follow:

Table 1.
Average Travel Time (minutes) (relative changes for the top 10 and bottom 10 cities).
- The overall average travel time at the city-cluster level decreased by more than two hours (124 min), from 359 min in 2006 to 235 min in 2014, a 34.5% reduction. HSR shortened the time distance between MYRCCR cities and shrank their spatial separation.
- Cities with HSR stations enjoyed greater time savings (150 min on average) than other cities. Non-rail cities also benefited by having an average time reduction of 121 min because the residents in these cities could access the HSR stations in the neighboring cities. The counties/cities receiving the least time-saving benefits (i.e., the Bottom 10 shown in Table 1) are mostly those located in the remote areas of the region. For instance, Suichuan, Xiushui, and Jinggangshan, had travel time reductions from 2006 to 2014 by 16.9%, 18.5%, and 19.1%, respectively. This result raises concerns over possible increase in spatial inequality associated with HSR services between the Bottom 10 and the Top 10 groups of cities.
- The biggest winners on travel time savings were those cities with newly built HSR stations, for example, Nanfeng, Qidong, Qianjiang, and Xiantao. This is due to the fact that these cities had no rail connection at all in 2006. Being connected with HSR gave them a bigger jump in time reductions than those previously connected by the conventional rail.
4.2. Accessibility Effects of HSR
Table 2 reports changes in job accessibility before- (2006) and after- (2014) HSR. All cities in MYRCCR had their accessibility to job opportunities enhanced. Economic growth (job increase) coupled with HSR-enabled travel time reductions led to an increase in accessibility, while the magnitude of accessibility enhancement varied dramatically across MRYCCR counties-cities.
Table 2.
Average Accessibility (relative changes for the top 10 and the bottom 10 cities).
- Accessibility improved all over the city-cluster, at the average level of increase by 36.1% from 2006 to 2014. HSR cities enjoyed much greater improvement on accessibility than the non-HSR cities. Specifically, the accessibility of HSR cities increased by 64.3%, well above that (about 25%) for cities without HSR or any rail connections.
- The gap in accessibility increment (ranging from 2.2% to 128%) between the top 10 and the bottom 10 group of cities was much bigger than that in travel time savings (ranging from 16.9% to 54%) noted in the previous section. Furthermore, the cities in the top 10 and the bottom 10 groups of accessibility changes differed from those two respective groups of travel time savings. This result confirms that travel time savings are beneficial but the measure does not capture the broader impacts of HSR on the wellbeing of people and places. Accessibility, which is determined jointly by transportation services and the distribution of opportunities, presents a more informative measure than travel times to policy discussions on the implications of major transportation investments, i.e., HSR in the current discussion.
To better understand the spatial implications of accessibility changes associated with HSR, we mapped the average scores of job accessibility for the years before- (2006) and after-HSR (2014). Notably, Figure 3a displays a core-periphery pattern with the high-accessibility cores concentrating largely at three provincial capital cities of Wuhan, Changsha, and Nanchang. HSR services have modified the pattern. As Figure 3b illustrates, a pattern of multiple corridors associated with HSR has emerged. In other words, HSR services helped reduce polarization effects and redistributed benefit gains to a wider spatial scope along the HSR corridors in MYRCCR. The spatial effects are similar to that observed in other countries, e.g., [38].
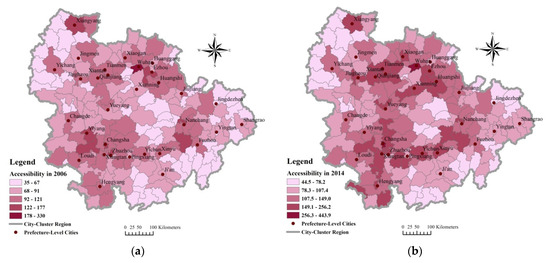
Figure 3.
Accessibility Surface of MYRCCR in 2006 (a) and 2014 (b).
4.3. Equality Impacts of HSR
We quantified the impacts of HSR on spatial inequality by calculating the CV associated with accessibility in MYRCCR. Table 3 shows that CV increased overall by 17.7%, displaying a fairly large increase in the gap between MYRCCR cities from 2006 to 2014. Increased spatial disparity was also evident in the sub-groups of cities, including those with only conventional rail services or with no rail services at all. Cities with HSR, however, exhibited the opposite trend. From 2006 to 2014, the CV value decreased by 16.4%, suggesting reduced disparity among them after HSR arrived. The results agreed with the findings by Gutiérrez who reported that HSR contributed to the equality of cities on the European HSR corridors [52].
Table 3.
Coefficient of Variation for MYRCCR Cities
The bottom portion of Table 3 reports the results of analysis that looked into the HSR impacts on between-county spatial inequality for each prefecture-level city in MYRCCR (CV measures variations and therefore no within-county CV can be calculated unless data are available at the spatial unit below the county-city scale). The majority of the provincial-level cities in MYRCCR saw an increase in disparity indicated by within-city CV of accessibility. Eight cities (those with negative percentage changes from the bottom of Table 3) appeared to be the exceptions, displaying more equal level of accessibility in 2014 than in 2006. The results suggest that, in China’s next phase of HSR development or transportation investments in general, resources should be channeled towards those cities that were relatively left-behind as a result from the prior HSR programs.
4.4. HSR Effects on Inter-City Economic Linkage
4.4.1. The Network-Level Economic Linkage
HSR services shrink space-time distances, which translates into reduced costs and consequently increased flows of factor movements, such as population and freight flows, information flows, and capital flows. The differentiated impacts of HSR on travel times and accessibility as shown in previous sections would likely change city rankings in the spatial system of the region. To explore the spatial linkage pattern associated with HSR in MYRCCR, we mapped the total economic linkages for the No-HSR (2006) and the HSR (2014) conditions (Figure 4a,b, respectively).
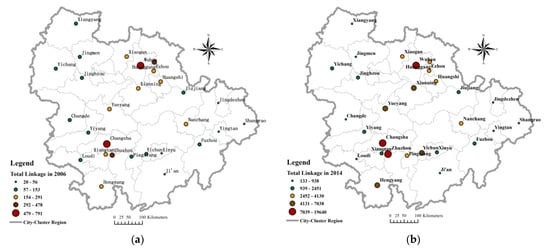
Figure 4.
Total Economic Linkage in Prefecture-Level Cities of MYRCCR in 2006 (a) and 2014 (b).
In Figure 4a, the size of the dot for a city indicates the amount of total spatial linkages associated with the city. Figure 4a shows that the first level of cities are two provincial capital cities, Wuhan and Changsha, which had higher total linkages than all other MYRCCR cities in 2006. The second level cities of high economic linkages include Zhuzhou and Huang’gang, which governed a relatively large number of county-level cities and had close proximity to provincial capital cities. Cities with lower levels of linkages are those scattered throughout MYRCCR in relatively isolated locations. Note that, Nanchang, the third provincial capital city in MYRCCR, did not make the top level when ranked by economic linkages.
The pattern of economic linkage in MYRCCR changed in 2014, as Figure 4b illustrates. The intensity of economic connections has increased for all cities. Zhuzhou moved up to the group of the first level, joining Changsha and Wuhan. The number of second-level cities increased significantly, including mostly those located on major HSR lines such as Yueyang, Hengyang, and Yichun. Nanchang, the provincial capital of Jiangxi, did not gain additional strength and remained in the group with the third-level intensity of economic linkage.
4.4.2. The Pattern of Spatial Linkage
Figure 5a,b visualize the pattern of spatial linkage between MYRCCR cities. Figure 5a portrays a core-periphery pattern with the cores largely being the dominating cities of the city-cluster. For example, in 2006 with no HSR services, the Wuhan Metropolitan area to the north of MYRCCR displayed a strong controlling position. To the south, three cities of Changsha, Zhuzhou, and Xiangtan formed a mini-triangle with strong links to the nearby cities.
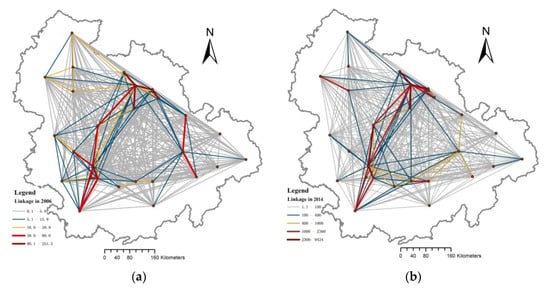
Figure 5.
Visualization of Economic Linkages between MYRCCR Cities in 2006 (a) and 2014 (b).
By 2014, as shown in Figure 5b, a corridor pattern emerged along the north-south HSR corridor. The most striking change was the strengthening direct link between Changsha and Wuhan. Yueyang, a city between Changsha and Wuhan, has gained significant interactions owing to its location on the HSR line. This finding implies the HSR-induced process of territorial cohesion similar to that observed in the coastal, advanced city-cluster regions of China and in European countries [32,55].
Overall, cities in MYRCCR have formed multi-core and multi-level network connections fostered by HSR lines going through the region. HSR modified MYRCCR’s spatial structure of its urban system by elevating relative strength of the cities on the main HSR corridor, for instance, Yueyang, Xianning, and Yichun and by reinforcing the core position of provincial capitals of Wuhan and Changsha. However, the position of Nanchang, the capital city of Jiangxi Province, did not change. While Nanchang has been served by rail for decades, it has remained at a relatively low level of integration with the national HSR grid until in 2016 when the Shanghai-Kunming HSR line started operating and in 2020 when the latest national HSR trunk line, the Fuzhou-Yinchuan line, was completed. The two new HSR trunk lines go through MYRCCR, providing a direct HSR link between Changsha and Nanchang, and between Wuhan and Nanchang. By now, the triangle of MYRCCR’s anchor cities has become closed with direct HSR services. An updated study with the most recent HSR information and city data would show a pattern of economic linkage very much different from that shown in Figure 5b above. It is a study that warrants further efforts.
5. Discussion and Conclusions
MRYCCR is the first city-cluster region served by the long-haul HSR line in China (not counting the short HSR line for travel within the Beijing-Tianjin-Hebei city-cluster region). Being strategically located in central China, MRYCCR plays a critical role in achieving the nation’s spatial development goals. Despite this historical and locational significance of MYRCCR, the empirical knowledge on HSR’s impacts in MYRCCR is very limited. A few studies analyzed the regional or local impacts of HSR in portions of MYRCCR, for instance, in the Changsha-Zhuzhou-Xiangtan area of Hunan [56,57]. To our knowledge, there have been no prior empirical studies examining the HSR impacts focusing on the entire MYRCCR. This study contributes to filling the knowledge gap. Another contribution of the study lies in the empirical evidence reported from the county-level cities, a finer spatial scale than prefecture-level cities that most existing studies explored. The study utilized data collected at two time points in 2006 and 2014, which roughly evenly spread from the inauguration year of China’s first trans-city-cluster HSR line. The main study findings are:
First, HSR reduced city-to-city travel time by 34.5% or 124 min on average. All cities in MYRCCR benefited from HSR-enabled travel time savings, while variations existed in the magnitude of time savings, depending on whether the cities had direct HSR connections. Second, HSR improved job accessibility for all cities. On average, accessibility increased by 36.1% for the entire region. HSR modified MYRCCR’s spatial pattern of accessibility from a core-periphery type to a multi-corridor structure. The study confirmed the findings presented by the studies elsewhere that cities without direct HSR connections gained much less than those with HSR stations. It is worth noting that the cities with the most/least accessibility gains largely differed from those with the most/least travel time savings. Third, the study found that MYRCCR became more spatially imbalanced from 2006 to 2014 based on the measure of HSR-induced changes in accessibility. One specific set of cities located on the HSR network became more balanced (i.e., reduced spatial inequality) in 2014 than in 2006. Other cities, however, experienced increased spatial disparity. Finally, HSR changed the hierarchical structure of MYRCCR urban system. Cities on the main HSR corridors gained prominence and moved up in the ranking levels of economic linkage. Other cities, for example, Nanchang, remained relatively low in the urban system of MYRCCR despite its status of being provincial capital city. This situation of Nanchang likely has improved however, due to newly completed HSR lines after 2016 that has connected Nanchang directly with Wuhan and Changsha.
HSR services reduce travel times and enhance spatial access. The distribution of these direct and wider impacts, however, has never been even across space and along socio-economic dimensions. Being one specific travel means in the transportation systems, HSR also has its limitations. The findings of this study suggest a number of policy implications for the interest of maximizing the benefits of HSR investments. First, it is extremely important to integrate HSR with other travel modes to develop a multi-modal transportation system. Due to the limitations of capital and technology, it is infeasible and inefficient for all sizes of cities to connect HSR directly. Different transportation modes, for example, airplane, subway, bus, car, and bicycle, have their mode-specific strengths and therefore have their own market niches with competitive performance efficiencies. An integrated multi-modal system can help the people and business in non-HSR cities to enjoy HSR-enabled travel time savings and accessibility gains. Second, improving mobility by reducing travel times is important and necessary, but insufficient to support regional spatial development. This study found that the between-city accessibility gap coming along with HSR services in MYRCCR was much larger than the gap measured by travel time savings. To people and business, accessing the destination opportunities is the primary purpose of travel. Assessing the impacts of HSR, therefore, should focus on accessibility implications more than on travel time reductions. HSR plans in terms of route selections and station sitting decisions should be integrated with planning for land uses (location and development for housing, services, and industries) for the goal of maximizing access rather than minimizing time per se. Third, evident in the MYRCCR study, the HSR network alters the structure of urban system in city-cluster regions. There remain a large portion of population being non-urbanized in MYRCCR and in other regions of China. The development of HSR offers a great opportunity to guide the future urbanization process along a sustainable path.
The study presented in this paper has several limitations, suggesting directions for improvement in future research. First of all, the analysis of HSR-enabled travel time savings and accessibility changes can be enhanced with refined assessment of HSR level-of-service for cities in MYRCCR. As it was pointed out earlier in the paper, medium- and small-sized cities in general have a relatively low level of HSR services because of low train frequency and poor local access to HSR stations compared to large cities (Wuhan has three HSR stations all connected by in-town metros. Both Changsha and Nanchang have two rail stations operating HSR trains). The travel times derived from train timetables for this study did not capture fully the differences in HSR level-of-service between cities of different sizes. In addition, monetary costs (e.g., train fares) can be incorporated with travel times to derive general travel cost index, which can be applied to evaluate the robustness of the results presented in this study. Furthermore, the analysis can be extended from the spatial dimension as carried out in this study to the social dimension. In so doing, the distributional impacts of HSR can be adequately evaluated across cities of different income and demographic characteristics (there are diverse ethnic minorities living in the western parts of Hubei and Hunan provinces). Lastly, the analysis can be updated with most recent data. New HSR lines have been added to MYRCCR along with the national HSR network expansion since 2014. A panel data could be constructed by integrating the new socioeconomic and transportation datasets with the 2006/2014 database used in this study. With the updated panel data over a relatively long timeframe, analysts could perform rigorous modeling to improve understanding of the fixed and dynamic effects of HSR investments on the spatial development of city-regions (for example, as the studies done by Li, et al. [58] and Coronada, et al. [59]). This study did not explore any changes in travel behavior in response to HSR services in MYRCCR. It is certainly an important direction to research on HSR impacts when such data become available.
China is entering into the next phase of urbanization and a new round of HSR investments. The case study of MYRCCR presented in this paper offers important lessons that can help inform planning and decision making for the future development of MYRCC and for other city-cluster regions as well. Many Asian countries are in the stage of urbanization and development similar to that in China. A growing number of countries are investing or considering to invest in HSR. The Chinese experience of HSR-regional spatial development can also offer informative lessons to these countries and others in the rest of the world.
Author Contributions
L.L. compiled data, conducted analysis and developed the initial draft of the paper. M.Z. formulated the aims and the scope of this work. M.Z. was instrumental for editing, reviewing and introducing quality and continuous improvements. All authors have read and agreed to the published version of the manuscript.
Funding
This research was funded by The National Natural Science Youth Foundation of China, grant number 51908258. The University Transportation Center of Cooperative Mobility for Competitive Megaregions (CM2) provided in-kind support.
Institutional Review Board Statement
Not applicable.
Informed Consent Statement
Not applicable.
Data Availability Statement
The data presented in this study are available on request from the authors.
Acknowledgments
We thank the anonymous reviewers for their valuable comments and suggestions that helped improve this manuscript.
Conflicts of Interest
The authors declare no conflict of interest.
References
- National Development and Reform Commission (NDRC, China). China Mid-/Long-Range Rail Network Plan (2008 Update); NDRC, China: Beijing, China, 2009. Available online: https://www.ndrc.gov.cn/xxgk/zcfb/qt/200906/W020190905544996836255.pdf (accessed on 8 April 2021). (In Chinese)
- National Development and Reform Commission (NDRC, China). China Mid-/Long-Range Rail Network Plan; NDRC, China: Beijing, China, 2016. Available online: https://www.ndrc.gov.cn/fggz/zcssfz/zcgh/201607/W020190910670620449319.pdf (accessed on 8 April 2021). (In Chinese)
- Yang, Z.; Li, C.; Jiao, J.; Liu, W.; Zhang, F. On the joint impact of high-speed rail and megalopolis policy on regional economic growth in China. Transp. Policy 2020, 1, 20–30. [Google Scholar] [CrossRef]
- Dezan Shira & Associates. China to Undertake Massive 10,000 Km Domestic Rail Network Expansion to Link Key City Clusters. In China Briefing; Dezan Shira & Associates: Hong Kong, China, 2020; Available online: https://www.china-briefing.com/news/china-rail-network-10000-km-domestic-expansion-link-key-city-clusters/ (accessed on 12 March 2021).
- Biggiero, L.; Pagliara, F.; Patrone, A.; Peruggini, F. Spatial equity and high-speed rail systems. Int. J. Transp. Dev. Integr. 2017, 1, 194–202. [Google Scholar] [CrossRef]
- The World Bank. Regional Economic Impact Analysis of High Speed Rail in China; The World Bank: Washington, DC, USA, 2014. [Google Scholar]
- Chen, C.L.; Anastasia, L.S.; de Urena, J.M.; Roger, V. Spatial Short and Long-Term Implications and Planning Challenges of High-Speed Rail. Eur. Plan. Stud. 2019, 27, 415–433. [Google Scholar] [CrossRef]
- Blum, U.; Haynes, K.E.; Karlsson, C. Introduction to the special issue the regional and urban effects of high-speed trains. Ann. Reg. Sci. 1997, 31, 1–20. [Google Scholar] [CrossRef]
- Vickerman, R. High-speed rail in Europe: Experience and issues for future development. Ann. Reg. Sci. 1997, 31, 21–38. [Google Scholar] [CrossRef]
- Yin, M.; Bertolini, L.; Duan, J. The effects of the high-speed railway on urban development: International experience and potential implications for China. Prog. Plan. 2015, 98, 1–52. [Google Scholar] [CrossRef]
- Sands, B. The Development Effects of High-Speed Rail Stations and Implications for California. Built Environ. 1993, 19, 257–284. [Google Scholar]
- Chen, C.-L.; Hall, P. The wider spatial-economic impacts of high-speed trains: A comparative case study of Manchester and Lille sub-regions. J. Transp. Geogr. 2012, 24, 89–110. [Google Scholar] [CrossRef]
- Chen, C.-L.; Hall, P. High-speed trains and spatial-economic impacts: A British–French comparison on two scales: Intra- and inter-regional. In Handbook on Transport and Development; Edward Elgar Publishing: Cheltenham, UK, 2015; pp. 301–317. [Google Scholar]
- Garmendia, M.; Cecilia, R.; Ureña, J.M. High Speed Rail: Implication for Cities. Cities 2012, 29, S26–S31. [Google Scholar] [CrossRef]
- Pagliara, F.; Vassallo, J.M.; Román, C. High-Speed Rail versus Air Transportation. Transp. Res. Rec. J. Transp. Res. Board 2012, 2289, 10–17. [Google Scholar] [CrossRef]
- Fröidh, O. Perspectives for a future high-speed train in the Swedish domestic travel market. J. Transp. Geogr. 2008, 16, 268–277. [Google Scholar] [CrossRef]
- Vickerman, R. High-speed rail and regional development: The case of intermediate stations. J. Transp. Geogr. 2015, 42, 157–165. [Google Scholar] [CrossRef]
- Vickerman, R.W.; Spiekermann, K.; Wegener, M. Accessibility and Economic Development in Europe. Regional Studies. Reg. Stud. 1999, 33, 1–15. [Google Scholar] [CrossRef]
- Yuan, Y.; Xu, J.; Wang, Z. Spatial Equity Measure on Urban Ecological Space Layout Based on Accessibility of Socially Vulnerable Groups—A Case Study of Changting, China. Sustainability 2017, 9, 1552. [Google Scholar] [CrossRef]
- Li, T.; Zhang, S.; Cao, X.; Witlox, F. Does a circular high-speed rail network promote efficiency and spatial equity in transport accessibility? Evidence from Hainan Island, China. Transp. Plan. Technol. 2018, 41, 779–795. [Google Scholar] [CrossRef]
- Sun, Z.; Zacharias, J. Transport equity as relative accessibility in a megacity: Beijing. Transp. Policy 2020, 92, 8–19. [Google Scholar] [CrossRef]
- Li, Y.; Chen, Z.; Wang, P. Impact of high-speed rail on urban economic efficiency in China. Transp. Policy 2020, 97, 220–231. [Google Scholar] [CrossRef]
- Liu, L.; Zhang, M. The Impacts of High-Speed Rail on Accessibility and Regional Economy in China. Urban Plan. Int. 2017, 04, 76–81. [Google Scholar] [CrossRef]
- Donaldson, J.A. China’s Administrative Hierarchy: The Balance of Power and Winners and Losers within China’s Levels of Government; Routledge: London, UK, 2017. [Google Scholar]
- Binti, S.; Sazrul, L.; Sakdirat, K.; David, J. Operational Readiness for Climate Change of Malaysia High-Speed Rail. Proc. Inst. Civ. Eng.-Transp. 2016, 169, 308–320. [Google Scholar] [CrossRef]
- Raghuram, G.; Udayakumar, P.D. Dedicated High Speed Rail Network in India: Issues in Development; Indian Institute of Management Ahmedabad: Ahmedabad, India, 2016. [Google Scholar]
- Shaw, S.-L.; Fang, Z.; Lu, S.; Tao, R. Impacts of high speed rail on railroad network accessibility in China. J. Transp. Geogr. 2014, 40, 112–122. [Google Scholar] [CrossRef]
- Albalate, D.; Bel, G. High-Speed Rail: Lessons for Policy Makers from Experiences Abroad. Public Adm. Rev. 2012, 72, 336–349. [Google Scholar] [CrossRef]
- Wang, J.J.; Xu, J.; He, J. Spatial Impacts of High-Speed Railways in China: A Total-Travel-Time Approach. Environ. Plan. A Econ. Space 2013, 45, 2261–2280. [Google Scholar] [CrossRef]
- Chandra, S.; Vadali, S. Evaluating accessibility impacts of the proposed America 2050 high-speed rail corridor for the Appalachian Region. J. Transp. Geogr. 2014, 37, 28–46. [Google Scholar] [CrossRef]
- Ortega, E.; López, E.; Monzón, A. Territorial Cohesion Impacts of High-Speed Rail at Different Planning Levels. J. Transp. Geogr. 2012, 24, 130–141. [Google Scholar] [CrossRef]
- Monzon, A.; Elena, L.; Emilio, O. Has HSR Improved Territorial Cohesion in Spain? An Accessibility Analysis of the First 25 Years: 1990–2015. Eur. Plan. Stud. 2019, 27, 513–532. [Google Scholar] [CrossRef]
- Komikado, H.; Morikawa, S.; Bhatt, A.; Kato, H. High-speed rail, inter-regional accessibility, and regional innovation: Evidence from Japan. Technol. Forecast. Soc. Chang. 2021, 167, 120697. [Google Scholar] [CrossRef]
- Andersson, D.E.; Shyr, O.F.; Lee, A. The successes and failures of a key transportation link: Accessibility effects of Taiwan’s high-speed rail. Ann. Reg. Sci. 2010, 48, 203–223. [Google Scholar] [CrossRef]
- Liu, S.; Wan, Y.; Ha, H.-K.; Yoshida, Y.; Zhang, A. Impact of high-speed rail network development on airport traffic and traffic distribution: Evidence from China and Japan. Transp. Res. Part A Policy Pract. 2019, 127, 115–135. [Google Scholar] [CrossRef]
- Jiao, J.; Wang, J.; Jin, F.; Dunford, M. Impacts on accessibility of China’s present and future HSR network. J. Transp. Geogr. 2014, 40, 123–132. [Google Scholar] [CrossRef]
- Cao, J.; Liu, X.C.; Wang, Y.; Li, Q. Accessibility impacts of China’s high-speed rail network. J. Transp. Geogr. 2013, 28, 12–21. [Google Scholar] [CrossRef]
- Ortega, E.; Elena, L.; Andrés, M. Territorial Cohesion Impacts of High-Speed Rail under Different Zoning Systems. J. Transp. Geogr. 2014, 34, 16–24. [Google Scholar] [CrossRef]
- Kwan, M.-P.; Weber, J. Scale and accessibility: Implications for the analysis of land use–travel interaction. Appl. Geogr. 2008, 28, 110–123. [Google Scholar] [CrossRef]
- Monzón, A.; Ortega, E.; López, E. Efficiency and spatial equity impacts of high-speed rail extensions in urban areas. Cities 2013, 30, 18–30. [Google Scholar] [CrossRef]
- Chen, Z.; Haynes, K.E. Impact of high speed rail on housing values: An observation from the Beijing–Shanghai line. J. Transp. Geogr. 2015, 43, 91–100. [Google Scholar] [CrossRef]
- Murakami, J.; Robert, C. High-Speed Rail and Economic Development: Business Agglomerations and Policy Implications; University of California Transportation Center: Berkeley, CA, USA, 2012. [Google Scholar]
- Kim, K.S. High-Speed Rail Developments and Spatial Restructuring. Cities 2000, 17, 251–262. [Google Scholar] [CrossRef]
- Wang, J.E.; Jiao, J.; Jin, F. Spatial Effects of High-Speed Rails on Interurban Economic Linkages in China. Acta Geogr. Sin. 2014, 69, 1833–1846. [Google Scholar]
- Zheng, S.; Kahn, M.E. China’s bullet trains facilitate market integration and mitigate the cost of megacity growth. Proc. Natl. Acad. Sci. USA 2013, 110, E1248–E1253. [Google Scholar] [CrossRef] [PubMed]
- Guo, Y.; Li, B.; Han, Y. Dynamic network coupling between high-speed rail development and urban growth in emerging economies: Evidence from China. Cities 2020, 105, 1–11. [Google Scholar] [CrossRef]
- Hong, W.; Su, M. Influence of Rapid Transit on Accessibility Pattern and Economic Linkage at Urban Agglomeration Scale in China. Open Geosci. 2019, 11, 804–814. [Google Scholar] [CrossRef]
- Zheng, H.; Cao, X. Impact of high-speed railway construction on spatial relationships in the Guanzhong Plain urban agglomeration. Reg. Sustain. 2021, 2, 47–59. [Google Scholar] [CrossRef]
- Liu, S.; Yulai, W.; Anming, Z. Does China’s High-Speed Rail Development Lead to Regional Disparities? A Network Perspective. Transp. Res. Part A Policy Pract. 2020, 138, 299–321. [Google Scholar] [CrossRef]
- Hui, L.; FAN, J.; Li, Y. “America 2050” Strategic Spatial Planning and Its Inspiration to China. 地理研究 2013, 32, 90–98. [Google Scholar]
- Lawrence, M.; Bullock, R.; Liu, Z. China’s High-Speed Rail Development; World Bank Publications: Washington, DC, USA, 2019. [Google Scholar]
- Gutierrez, J. Location, Economic Potential and Daily Accessibility an Analysis of the Accessibility Impact of the High-Speed Line Madrid-Barcelona-French Border. J. Transp. Geogr. 2001, 9, 229–242. [Google Scholar] [CrossRef]
- Kim, H.; Sultana, S. The impacts of high-speed rail extensions on accessibility and spatial equity changes in South Korea from 2004 to 2018. J. Transp. Geogr. 2015, 45, 48–61. [Google Scholar] [CrossRef]
- Williams, R.F.; Doessel, D.P. Measuring inequality: Tools and an illustration. Int. J. Equity Health 2006, 5, 1–8. [Google Scholar] [CrossRef] [PubMed]
- Xu, J.; Zhang, M.; Zhang, X.; Wang, D.; Zhang, Y. How does City-cluster high-speed rail facilitate regional integration? Evidence from the Shanghai-Nanjing corridor. Cities 2019, 85, 83–97. [Google Scholar] [CrossRef]
- Liu, S.; Kesteloot, C. High-Speed Rail and Rural Livelihood: The Wuhan-Guangzhou Line and Qiya Village. Tijdschr. Voor Econ. Soc. Geogr. 2015, 107, 468–483. [Google Scholar] [CrossRef]
- Li, C.; Zhou, Q.; Ma, K.; Fang, J.; Yang, W. Research on Traffic Accessibility and Transportation Integration Level of Chang-Zhu-Tan City Group in China. J. Geogr. Inf. Syst. 2019, 11, 715–726. [Google Scholar] [CrossRef][Green Version]
- Li, H.; Strauss, J.; Shunxiang, H.; Lui, L. Do high-speed railways lead to urban economic growth in China? A panel data study of China’s cities. Q. Rev. Econ. Financ. 2018, 69, 70–89. [Google Scholar] [CrossRef]
- Coronado, J.M.; Ureña, J.M.; Miralles, J.L. Short-and Long-Term Population and Project Implications of High-Speed Rail for Served Cities: Analysis of All Served Spanish Cities and Re-Evaluation of Ciudad Real and Puertollano. Eur. Plan. Stud. 2019, 27, 434–460. [Google Scholar] [CrossRef]


Publisher’s Note: MDPI stays neutral with regard to jurisdictional claims in published maps and institutional affiliations. |
© 2021 by the authors. Licensee MDPI, Basel, Switzerland. This article is an open access article distributed under the terms and conditions of the Creative Commons Attribution (CC BY) license (https://creativecommons.org/licenses/by/4.0/).