1. Introduction
The World Food Summit 1996 declared that “food security exists when all people, at all times, have physical and economic access to sufficient, safe and nutritious food that meets their dietary needs and food preferences for an active and healthy life” [
1]. An important dimension in the quest for improved food security is international trade, as it provides the link between trade openness and the availability of food to end-consumers. Successive rounds of the World Trade Organization’s (WTO) multilateral, regional and unilateral trade liberalization agreements have achieved some successes in opening food trade in many developed and developing countries. For example, Baldwin (2016) [
2] showed that current tariff rates are below five percent on most food products and zero for a very large share of imports. However, Baldwin also noted that the WTO is widely regarded as having stagnated. The Doha Round, the latest WTO negotiation, showed vacillation between approaches, along with continuing intermittent failures and successes since its launching in 2001. The resistance to removing restrictions, largely due to powerful domestic interest groups within many countries, has implications for food security, especially for developing countries and economies in transition, as high import tariffs affect food availability and lead to prices that affect food accessibility as food becomes less affordable [
3].
The WTO defines tariffs to be duties that give a price advantage to locally produced goods over similar food commodities imported from other countries, which typically protects local producers from international competition. Moreover, these tariffs raise revenues for governments at the expense of accessibility for consumers in importing countries. Nonetheless, developing countries often argue that such revenues are needed to subsidize food and stabilize prices [
2].
To understand links between food availability and trade openness, this research looks at the effects of complete tariff elimination on all food commodities in five selected countries, specifically India, Pakistan, Egypt, Saudi Arabia, and the United Arab Emirates (the UAE). These countries either have large and often poor populations (India, Pakistan, and Egypt,) and/or are heavily involved in bilateral food trade (Saudi Arabia and the UAE) in the Middle East. All five countries currently engage in food trade with each other, and food security is a high priority in their policy agendas.
This paper studies the current import values and weighted average tariffs for major food commodities in these countries and simulates, using the World Integration Trade Simulations (WITS) model, the impact of the elimination of food tariffs. The weighted average applied tariff is the average of applied rates, weighted by product import shares for each partner country or the world. The simulation model assumes tariff cuts from current rates to reach a zero-tariff for all food commodities. The trade values and welfare impact of the simulation model include trade creation, tariff losses, trade diversion, and changes in consumer surplus.
It is expected that food tariff elimination would have larger consequences than monetary impacts due to trade creation and trade diversion. This paper also interprets the potential implications of the simulation results in the context of current macroeconomic and food security indicators and argues that food availability and security will be especially enhanced for low-income households in Egypt, India, and Pakistan, and low-income guest workers in Saudi Arabia and the UAE. The paper contributes to the literature by establishing significant links between the five countries, providing evidence in favor of food trade openness, and extending the discussion of the implications of welfare changes on food availability for low-income households.
2. Economic Indicators and Food Trade Data
Countries were selected for this study based on several factors including strong food trade and political ties between them. India, Pakistan, and Egypt are major suppliers of food trade in the region to Saudi Arabia and the UAE. There are also sizable labor flows from the three large countries to Saudi Arabia and the UAE, which contribute to the economic development of the Gulf Cooperative Council (GCC) countries and provide critical remittance income to the labor-supplying countries. For example, India exported nearly 34 billion USD to other food trade partners (Saudi Arabia, the UAE, Pakistan, and Egypt) in 2017, while Pakistan and Egypt exported over 4 billion USD worth of food during the same year. India exports over 1.2 billion USD annually in rice to Saudi Arabia and the UAE as the two countries heavily rely upon food imports, and so food security there is derived in part from the three large partners (India, Pakistan, and Egypt)—see
Supplemental Material. This makes the analysis of trade creation and trade diversion and the related welfare impacts between the five countries a useful comparison.
This section describes the economic factors that affect food trade and food trade policy and analyzes selected dimensions of food security for the five selected countries. The first part focuses on the overall economic and development conditions that affect current food imports and food security, while the second part presents the current tariff levels on food in each of the countries. A third section examines some data on food security indicators taken from the Food and Agriculture Organization’s (FAO) Food Security Indicators Database [
4].
2.1. Economic Indicators Affecting Food Security and Policies
The five countries selected in this study differ by population, per capita income, food imports, the proportions of food produced locally, and the amount of food trade with each other.
Table 1 provides perspectives that will aid in interpreting differences in tariff levels, the ease with which tariffs can be reduced in each country, and varying effects on food security. Of course, India is the most populous country with about 1.4 billion persons in 2017. Pakistan’s population is more than double the population of Egypt, which exceeds that of Saudi Arabia by three times, and which in turn is three times above the UAE. Per capita GDP, adjusted for purchasing power parity (PPP), in the five countries is almost in the opposite order, with the highest of 66,000 international dollars in the UAE and lowest of 5000 international dollars in Pakistan, just below the 7000 international dollars in India in 2017. The challenges to food security are of course higher in countries with lower per capita income; however, this is just one driver of policy choices that affect food security.
Other macrolevel economic indicators affect the success of the countries’ agricultural sector reforms, food security, and food trade openness. All countries excluding the UAE run budget deficits over 6% of GDP; and, the larger the deficit, the greater the need for revenue, some of which can come from import tariffs. Additionally, such relatively high deficits may limit the ability of these countries to make food security reforms such as offering progressive social and food support to low-income households.
These budget deficits need to be seen in the context of each country’s trade balance. Trade surpluses mean that capital flows out of the country to support deficits elsewhere, while trade deficits mean the world economy is supporting a government’s budget deficit. Thus, the budget deficits in Saudi Arabia and the UAE go along with financial surpluses from their positive trade balances, so budget deficits are of less of a concern.
Additionally, the presence of trade deficits is likely to lead to higher tariffs to block imports to reduce deficits. Both Egypt and Pakistan have trade deficits while surpluses exist in India, Saudi Arabia, and the UAE. As oil-exporting countries, Saudi Arabia and the UAE run significant trade surpluses and have less need to manipulate trade for current account purposes. Pakistan and Egypt see persistent and large food trade deficits, much of which is for food imports in Egypt. Through deliberate policies of high food and other trade restrictions, India has turned a likely deficit into a significant trade surplus.
The overall average current weighted tariffs on food products vary among the countries, with the highest in India at 39%, and Pakistan follows with 9% to as low as 6% in Saudi Arabia, 4% in the UAE, and 6% in Egypt. These relatively low tariffs on food mean little added benefit will come from further reductions in tariffs, particularly in Saudi Arabia and the UAE with high per capita incomes. In the UAE, on average, the population only spends 9% of its consumption on food. Therefore, the impact on the costs of household food consumption from a tariff reduction will only be 0.36% (or a 4% reduction in costs/gain in income for the 9% total expenditures). In contrast, the percentage spent on food in India and Pakistan is about 45%, while in Egypt it is 38%, so reductions in tariffs in those countries can, on average, result in more significant gains to the population. Indeed, Egypt, India, and Pakistan implement policies and strategies to enhance food security, including direct subsidies to consumers and direct protection to farmers from global competition in food trade. However, these policies do not always promote food security and often contradict the countries’ food security policy agenda.
2.2. Current Tariff Rates for Major Food Categories
Table 2 below shows the current tariffs applied by the five countries, which shows that. India, Egypt, and Pakistan have higher applied rates for most food categories than do Saudi Arabia and the UAE. Trade openness, achieved through a reduction of tariffs, has been implemented by GCC countries as they rely on food imports to enhance food security and have few options to increase production. Tariffs are high due to support for local production in Pakistan and Egypt, as
Table 2 shows. Moon et al. (2011) found that the WTO is still struggling to resolve issues related to protectionism that arise from local or regional facets of agriculture, as many developing countries cannot deal with existing agricultural and food trade barriers by developed countries in North America and Europe [
6]. Historically, Saudi Arabia applied a tariff rate of 25% on wheat and several other commodities to protect local production of grain. While the country later reduced the subsidies on local wheat production, due to water shortages, the tariff rate on that commodity has remained high, at 20%. Furthermore, India, Egypt, and Pakistan apply high tariffs on imported meat, fish, dairy products, fruits and nuts, and sugar products to generate government revenues and to protect the domestic food industry. Overall, India applies the highest tariff rates compared to the other four selected countries for all commodities, which is the main reason that it has an overall trade surplus. Saudi Arabia and the UAE have reduced food tariffs to low levels because they are high-income countries with little potential to enhance local food production. However, relatively higher food tariff rates in connection to tourism industries were kept in place.
3. Domestic Food Policies in the Selected Countries
Policy options for ensuring sustainable food supply systems to meet growing food demand without sacrificing the resources of future generations include efforts to improve the efficiency of production and delivery and to maximize the benefits of international trade. Further than ensuring food supply, other policy considerations include addressing poverty, vulnerability to food insecurity, and the ability of a countries population to purchase sufficient and nutritious food. For instance, policies can target reducing the price impact on real incomes of poor households and providing effective social safety nets.
Smith and Glauber [
8] indicated that food insecurity is extensive throughout the world, and hunger and malnutrition are expected to remain serious political concerns particularly in low-income developing countries where many rural and urban households are both income and asset poor. The authors showed that free trade policies allow countries to exploit their comparative advantages in economic activity, thereby increasing average per capita incomes, longer-term growth rates, and a country’s capacity to fund social safety nets for the poor. Countries sometimes abandon those policies in favor of domestic protections in their efforts to mitigate the effects of short-run food crises. The policy challenge is to resolve the tension between optimal long-run policies and short-run initiatives to address food security concerns.
Several studies [
9,
10,
11,
12] have made the connection between food security policies relevant to dietary diversity and quality and trade openness. They show that trade openness leads to food security for low-income households, particularly for households who are net food buyers. These studies argued that an outward-looking food policy (i.e., combined domestic food production support and openness of food trade) leads to reduced dietary insecurity for low-income households as trade openness offers higher accessibility to diverse sources of food that are not insufficient supply in domestic markets.
Baylis et al. (2016) discussed the political economy of export restrictions in India, pointing out that the government directly purchases unmilled rice and wheat from farmers or traders through the Food Corporation of India (FCI) and then sells these grains at a subsidized price to poor households through the Public Distribution System. Export restrictions of food commodities in India are pursued with goals to lower domestic grain prices and increase food security. Furthermore, these restrictions aim to generate government revenue and exporter rents [
13]. India uses high levels of tariffs and nontariff restrictions to maintain such goals.
In Pakistan, in the face of high levels of food insecurity and malnutrition, the government realized that progress on employment and income, especially for the agricultural sector, was needed to significantly reduce poverty. Moreover, public expenditures on agriculture in Pakistan through poverty reduction strategy programs have generally been declining over time with significant year-to-year fluctuations [
14]. Pakistan overall applies relatively low levels of export restrictions compared to India with exception of wheat and cotton, which witnessed increases in recent years.
Lofgren and Richards (2003) [
15] showed that Middle Eastern and North African (MENA) region countries including Egypt, Saudi Arabia, and the UAE suffer from a scarcity of water resources, imposing severe limits on future growth in domestic agricultural production. In response, these countries have turned to trade by reducing restrictions and retaining a substantial share of food consumption through imports. Egypt also depends on world food programs and donor country subsidies to pay for food imports [
16]. In the drought-prone countries of Saudi Arabia and the UAE, an expansion of food imports is likely to enhance food security. However, food security in this region is also challenged by unsustainable farming practices such as over pumping, salinization, and rising pollution of aquifers.
Clapp (2017) argued that developing countries having untapped natural resources (e.g., India and Pakistan) may seek broader self-sufficiency policies to overcome food insecurity challenges, such as seeking direct foreign investment from GCC countries for agricultural development and developing initiatives targeting food security enhancement. Furthermore, the author proposed that there is no conflict between support for domestic production and openness of food trade, calling for moving the debate in a more productive direction, thereby allowing the pursuit of policies to increase domestic food production that makes sense both politically and economically [
17].
India, Egypt, and Pakistan apply protectionist policies to support local producers against international competition and seek to generate government revenue to subsidize low-income consumers. The success of these approaches will depend on the mix of small farmers versus nonfarm poor. Saudi Arabia and the UAE apply relatively high tariffs on selected food commodities normally in demand by the tourism sectors [
18].
As lower-middle-income countries, Egypt, India, and Pakistan still seek international support and funds to support agricultural development and reform of food security strategies. Both Saudi Arabia and the UAE have reduced food tariffs overall, as oil-producing countries do not collect tariffs for government revenue purposes. India differs from the other two countries (Pakistan, and Egypt) by imposing high tariffs on almost all food commodities to protect local food production and industries and to generate tariff revenues. Saudi Arabia and the UAE also have unique contexts as their populations are growing quickly due to the many guest workers coming into their countries. Saudi Arabia’s population is 33 million but foreign nationals represent 58% of the labor force. The UAE’s population is 9 million while foreigners represent 52% of their labor force. The majority of these workers are low-wage laborers and likely spend a high percentage of their income on food. The openness of trade and availability of greater food supply may have a positive impact on their food security.
Table 3 below shows various levels of self-sufficiency ratios for selected food commodities. The self-sufficiency ratio (SSR) is defined as:
Commodities were selected to represent the major sources of protein, cereals, and vegetables. For Egypt, India, and Pakistan, the table indicates a high level of self-sufficiency and the potential to export major food commodities to countries like Saudi Arabia and the United Arab Emirates. The highest level of self-sufficiency was found in bovine meat in India. Meanwhile, Saudi Arabia and the UAE rely on cereal (rice and wheat) imports from the rest of the world but mainly from their major food trade partner, India. It is clear however from the earlier discussion that these self-sufficiency percentages are the consequence of high levels of tariffs in many cases. This paper considers the impact of food tariff policies on low-income populations. Any increases in consumer surplus as a result of tariff reduction or elimination is likely to have a greater impact on low-income groups as they spend a larger portion of their income on food. Therefore, understanding the income distribution of the selected countries is necessary for understanding the magnitude of any impacts from tariff reduction [
20].
Table 4 shows that the low-income population earning less than the national poverty level is 23%, 28%, and 24% affecting 288, 26, and 48 million people in India, Egypt, and Pakistan, respectively.
The mean statutory monthly average earnings for services and sales sector workers, adjusted for PPP in 2017, ranged from a low of
$171 (international dollars) in India to
$343 in Egypt and a high of
$489 in Pakistan. Unskilled guest and household services workers in the GCC countries (including Saudi Arabia) earned about
$250 to
$400 a month [
23].
Table 4 below shows that the percentage of the population who live below the poverty ratio at
$3.20 a day (2011 PPP) are 26%, 20%, 35% for Egypt, India, and Pakistan for 26, 288, and 48 million people, respectively. In this study, we argue that these low-income people who live below the Sustainable Development Goals (SDGs) threshold and the guest workers in Saudi Arabia and the United Arab Emirates are the most likely people who would be most likely to would benefit from food trade openness.
As noted earlier, India and Pakistan’s households spend about 45% of their income on food. On average, in Pakistan meat and dairy accounted for 37% of food expenditures in 2013–2014; wheat, rice, and other cereals were 30% and another 7–8% was spent on fruit and vegetables. As the tariffs on these commodities in Pakistan were often between 15% and 20%, dropping them to zero would yield a real income gain to the average household of about 7.5%. Lower-income families consume more cereals and spend a higher proportion of income on food, so those gains would be greater. With lower elasticities on grains, removing these tariffs would also facilitate a shift to a more diversified and higher quality diet
4. Food Availability Dimension in the Selected Countries
Food security has four dimensions: food availability, food access, food utilization, and food stability [
1]. Food trade openness is directly related to food availability and indirectly to the other three. To measure food availability, the FAO uses specific indicators, [
4], which, among others, include the dietary energy supply adequacy, the value of food production, the share of dietary energy supply derived from cereals, roots, and tubers, the protein supply overall, and the supply from animal origin. Together, these food security measures address food availability and food stability (often thought to be long-run availability) and thereby directly target the achievement of the United Nations’ first and second Sustainable Development Goals (SDGs) on reducing poverty and achieving zero hunger.
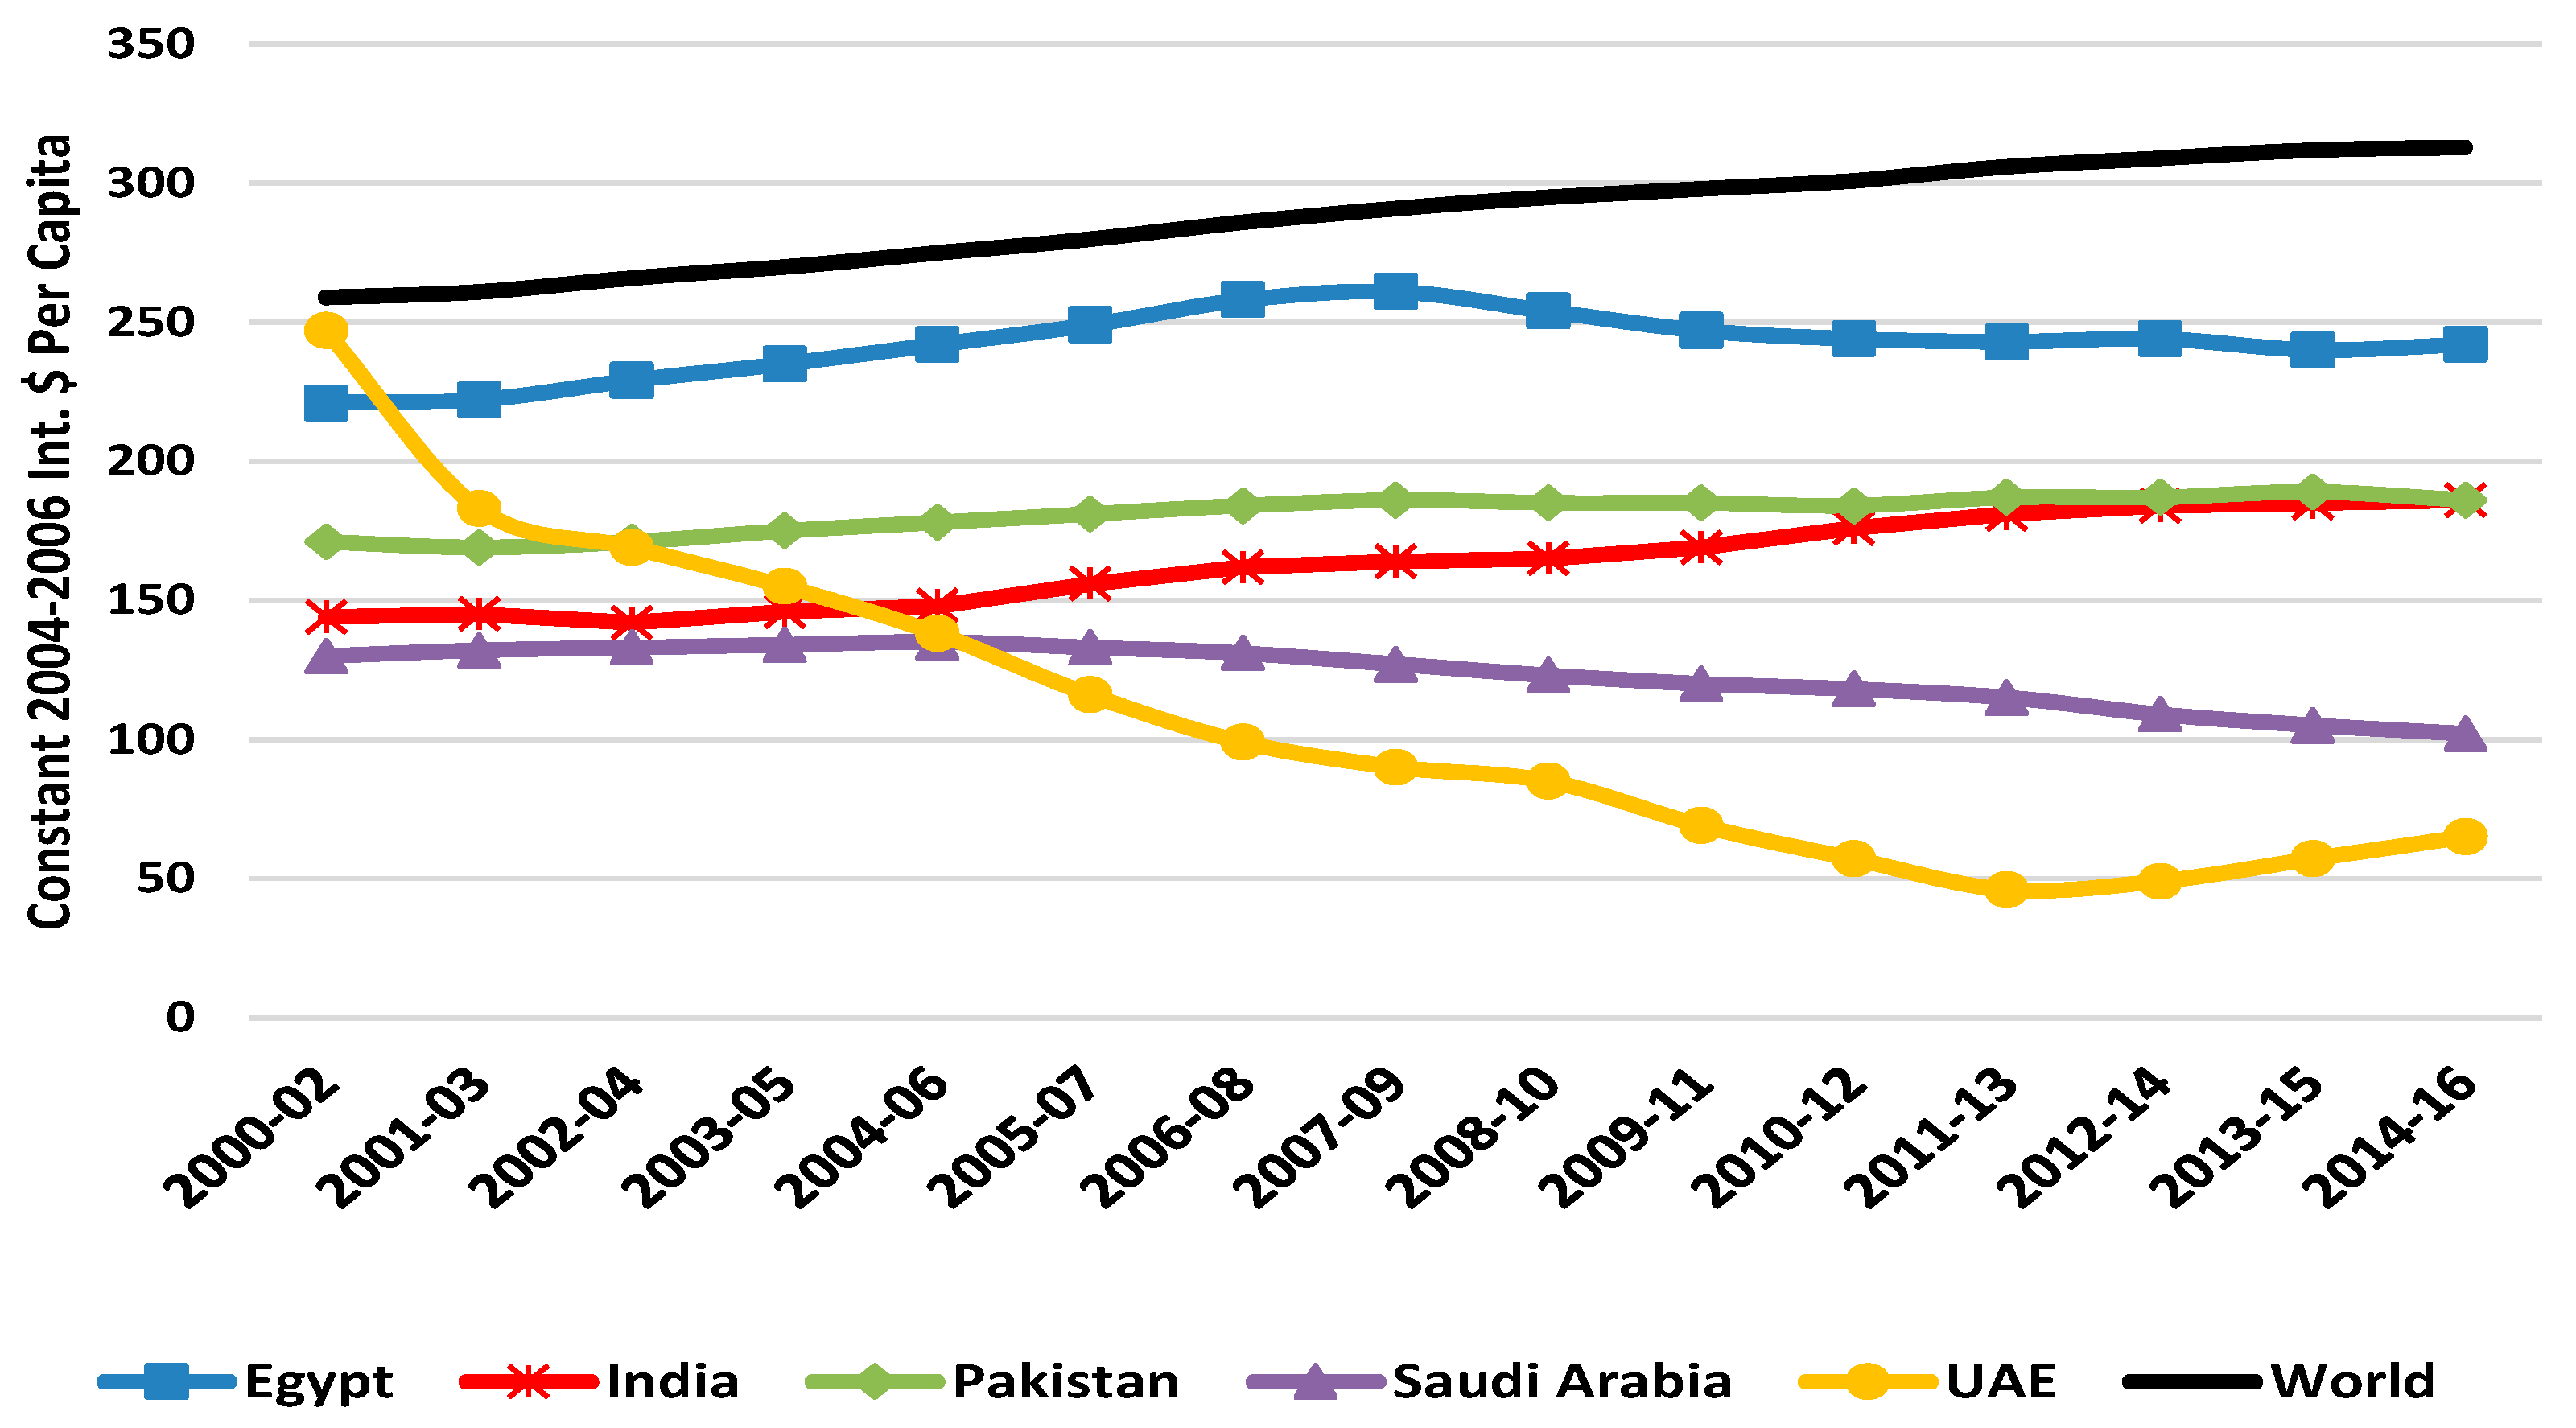
The per capita value of the food supply produced locally in Egypt, India, Pakistan, Saudi Arabia, and the UAE from 2000 to 2016 is provided in
Figure 1. The indicator expresses the local food production value in constant 2004–2006 international dollars. (The international dollar (Int.
$) is a hypothetical unit of currency that has the same purchasing power parity that the US dollar had in the United States at a given point in time). This term is often used in conjunction with Purchasing Power Parity (PPP) data in per capita terms as published by FAOSTAT.
All five countries showed availability from local production sources below the world average. Some gains were found in Pakistan, despite high population growth, and in Egypt and Saudi Arabia in the early years of the series. The large and continuous decline in per capita availability in the UAE from local sources was by design, as a large reduction in local production came in response to an alarming depletion of groundwater. In very recent years (2014–2017), overall food prices declined along with oil prices, and therefore agricultural production values dropped across the world. This is coupled with increasing GCC countries’ reliance on food imports. For example, Pirani and Arafat (2016) [
24] showed that in these countries, including the UAE, food imports continued to increase because local agriculture is only viable for selected water-efficient crops that are suitable for a desert climate, and therefore self-sufficiency is only partially obtainable. With rising populations and income in the UAE, imports of grains, feed for animals and other processed food have been on the rise in recent years. If taken as an objective by policymakers, this indicator leads to policies that promote local food production and productivity, which may be contrary to outcomes with open food trade. As noted earlier, most countries tended to have higher tariffs on processed foods and selected food security commodities, where they wanted to encourage local production. Most dramatically, the level of import tariffs in India sheds light on how that government was able to increase its percentage of local production in
Figure 1.
Figure 2 below shows the percentage value of food imports in total merchandise exports as reported by FAO, which provides a long-term food availability indicator. The food import value relative to total merchandise exports in Egypt and Pakistan is very high relative to the world average or the other countries. Egypt witnessed a decline in this ratio in the early 2000s and then experienced a rapid increase, which suggests pressure on its balance of trade overall, as reported in
Table 1. Pakistan’s ratio is higher than that of the world, or of India, Saudi Arabia, and the UAE, although it has fluctuated within the range of 15% to 20% from 2007 to 2016, but grew in the latest years.
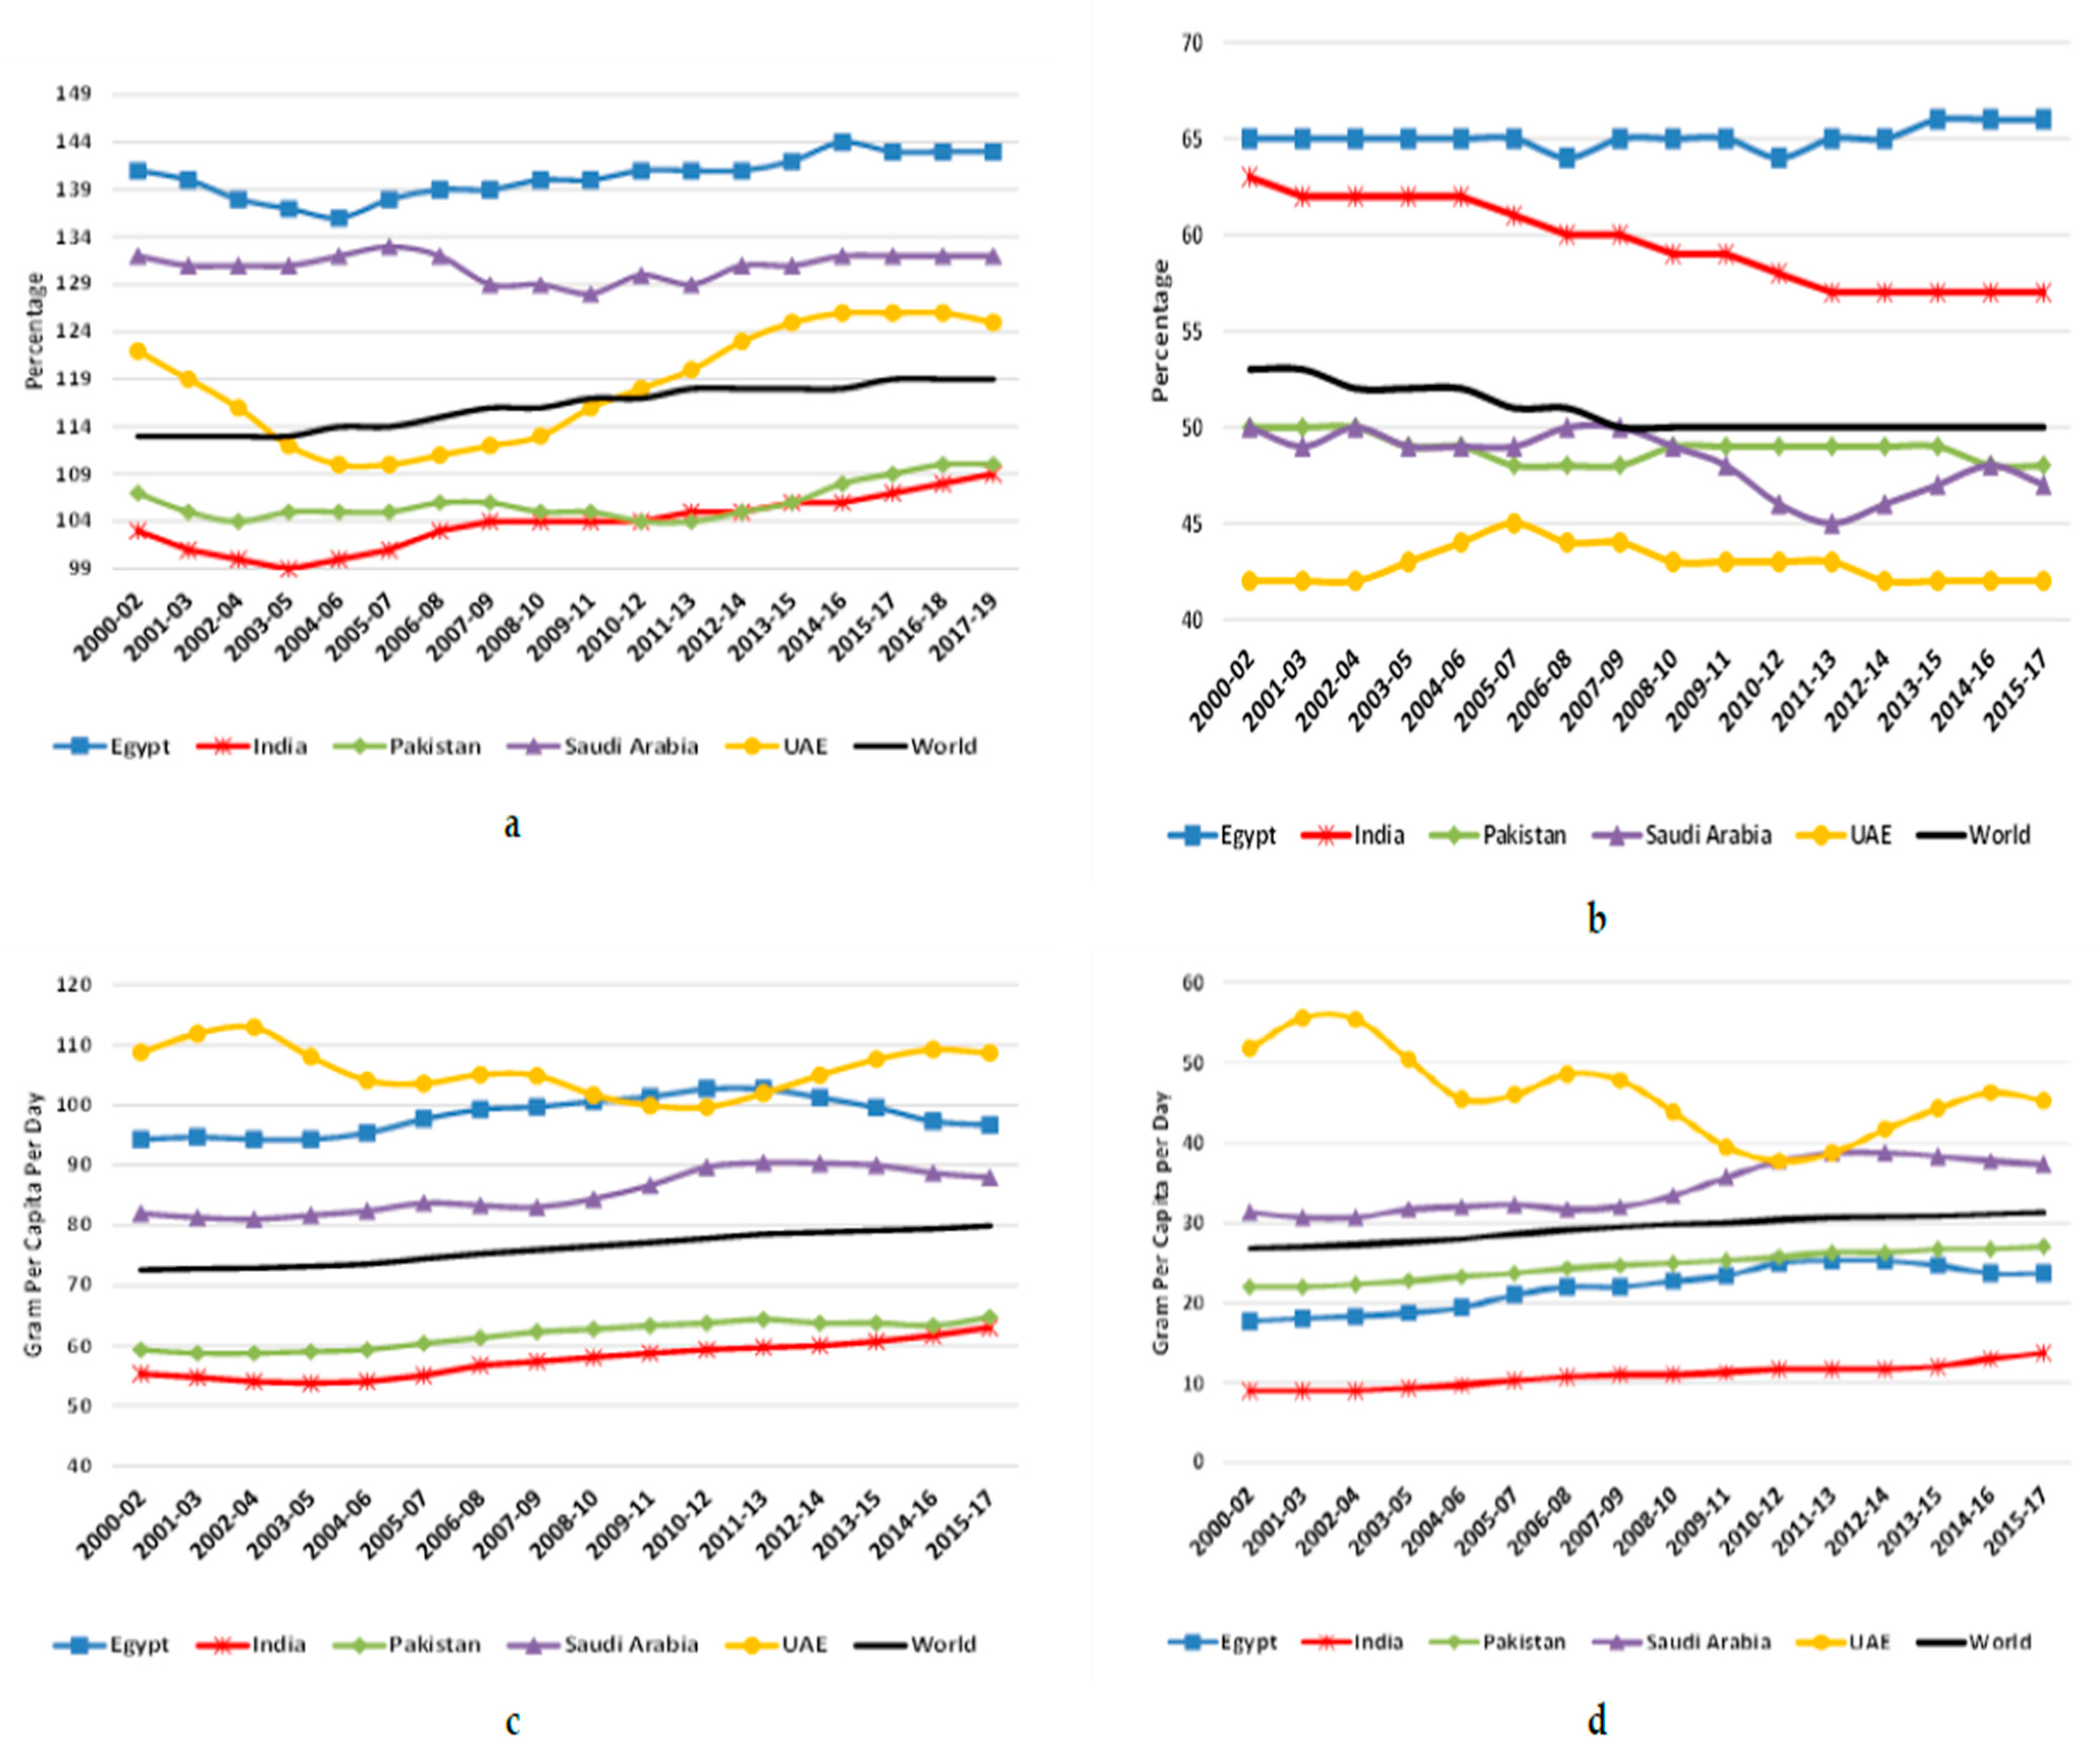
Figure 3a shows the selected countries’ average dietary energy supply (ADES) from 1999 to 2019, expressed as a percentage of the average dietary energy requirement (ADER) in each country, as calculated by FAOSTAT. The indicator showed that Saudi Arabia’s and the UAE’s average is slightly above the world per capita value. Remarkably, Egypt’s supply exceeds all other countries’ averages by nearly 20 percent, so policy choices there have had food security implications, especially given the country’s food import bill. The indicator values for Pakistan and India were about 10 percent below the world average during the last two decades, consistent with being lower-middle-income countries with significant poverty and food security challenges. Furthermore, Ibok et al. (2019) developed a vulnerability to food insecurity index (VFII) to argue for long-term support for vulnerable households. The multidimensional index is based on the probability of exposure to supply and economic shocks, the experience of food insecurity, and the coping ability of households [
25].
Figure 3b shows the share of dietary energy supply derived from cereals, roots and tubers for the countries, as a percentage of the total dietary energy supply (DES) (in kcal/capita/day). Comparing
Figure 3a,b, it can be inferred that Egypt’s high dietary supply comes largely from cereals rather than animal sources. India, Pakistan, and Saudi Arabia derive their energy supply from cereals at about the same proportion as the world, while the UAE is just the opposite, deriving less from cereals and by implication more from animal sources.
Figure 3c,d below show the average protein supply expressed in grams per capita per day and thus provide information on diet quality.
Figure 3c includes local and imported protein from both plant and animal sources, while
Figure 3d includes protein exclusively from animal sources. The animal sources include products from eggs, fish, and seafood, and meat, offal, animal fats, milk, and aquatic products. The worldwide average protein consumption grew slightly from 75 g per day over the period examined (2000 to 2017). The UAE and to a lesser extent Saudi Arabia exceeded that average over that period. Egypt exceeds the average by about 20 to 25 g per day, which is correlated with the large overall food energy supply available in the country. India and Pakistan are perhaps 25 g per day less than the world average. With the exception of Egypt, these relative values follow per capita incomes.
In
Figure 3d, the protein derived from animal sources is illustrated. As previously mentioned, Saudi Arabia has an energy supply of about 40 g per day, running slightly above the world average, similar to its overall energy supply. For the remaining countries, protein from animal sources is approximately one-fifth of the total protein consumed. Thus, for instance in Egypt, of the 100 g of total protein consumed, only about 20% comes from animal sources. Both of these protein indicators of food security show deficiencies in Pakistan relative to world averages. In India, the per capita protein consumption in total and from animal origins is below the world average, much of which can be attributed to the dominant vegetarian diet. Saudi Arabia is above the world average partly due to an expansion of dairy and poultry production in the last two decades (USDA, Global Agricultural Information Network—GAIN, 2018) [
26].
Food security measures for food availability showed that all five selected countries are below the world average in availability from local production. Meanwhile, the percentage value of food imports to total merchandise exports shows the pressure that food consumption puts on the food trade balance when it rises. Both Egypt and Pakistan witnessed increasingly high ratios that reached about 40% and 20%, respectively, in 2015–2017. In contrast, India, Saudi Arabia, and the UAE’s percentage stayed at the world average of 5% over the period.
5. Previous Studies
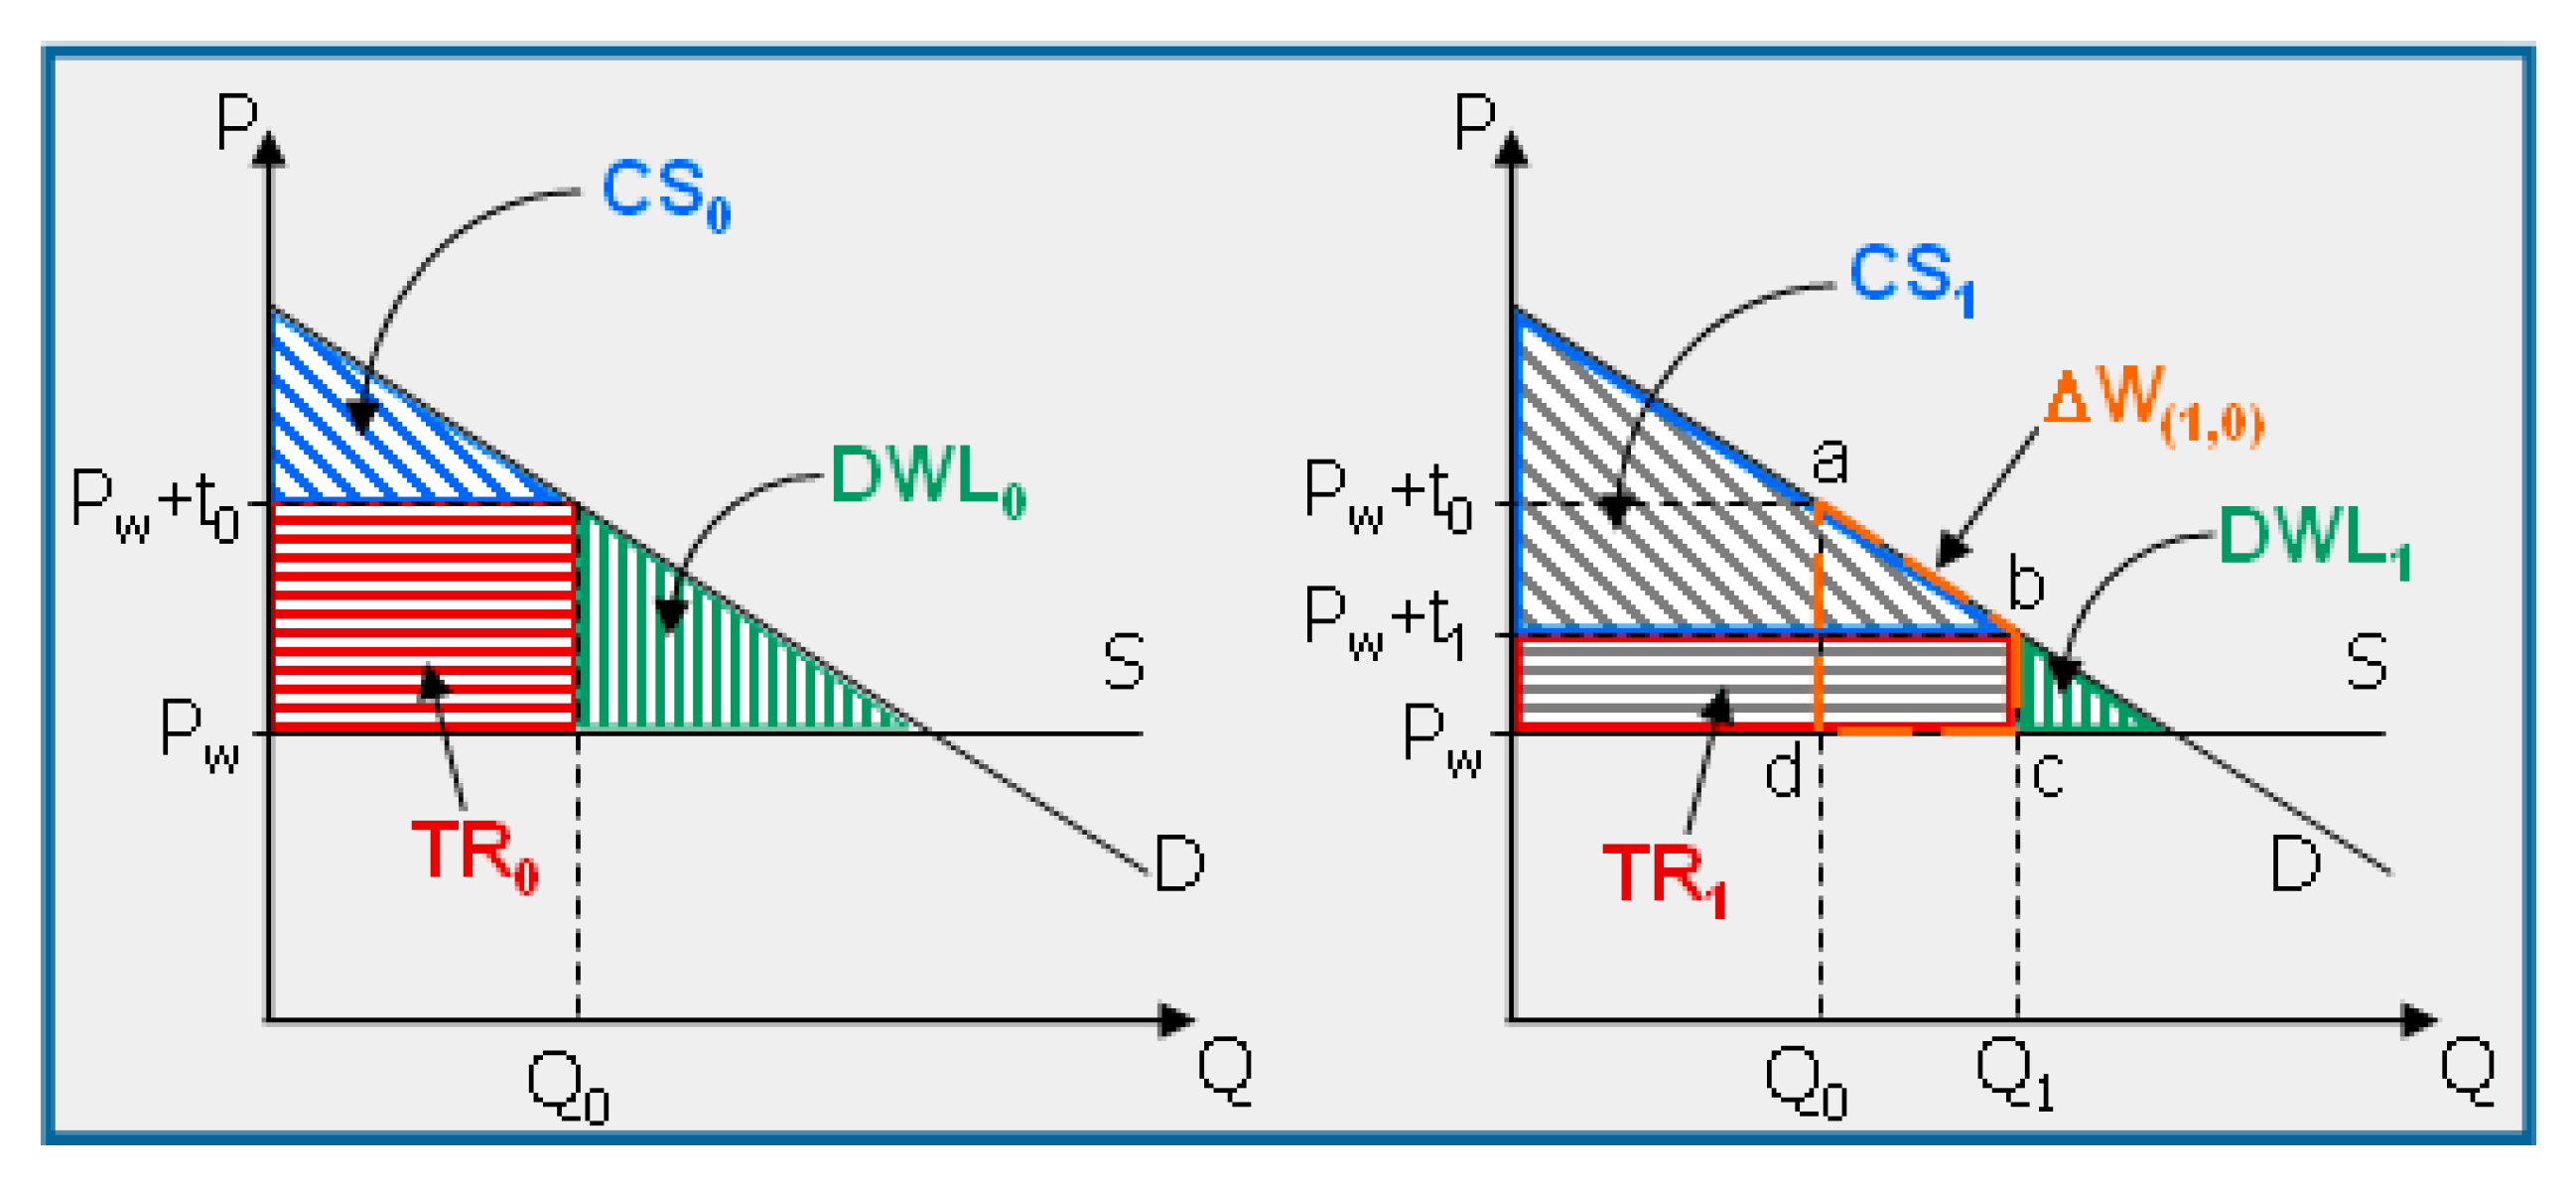
The following are previous studies that used a partial or general equilibrium model to simulate welfare impact due to changes in trade reduced barriers as illustrated in
Figure 4 below. The model is further described in the methodology section
Studies analyzing the effects of trade liberalization utilize either computable general equilibrium frameworks or partial equilibrium models to estimate welfare changes. Tanaka and Hosoe (2011) [
28] concluded that if rice productivity shocks were anticipated abroad by other countries included in a trade liberation analysis, such as China, India, Indonesia, and Vietnam, there was no statistically significant chance that the Japanese economy would be worse off under freer rice trade. In the case of domestic productivity shocks, rice trade liberalization not only increases welfare averages but also decreases its volatility. Therefore, the protection of Japan’s domestic rice market would harm its national food security rather than enhance it.
Poczta-Wajda and Sapa (2017) [
29] aimed to determine the potential trade effects of the Transatlantic Trade and Investment Partnership (TTIP) for the EU agri-food sector by carrying out an ex ante evaluation using World Integrated Trade Solution (WITS), a partial equilibrium model. The results of the study indicated that although bilateral agri-food trade relations of the EU–US have relatively little importance, it was significant at the individual industry level. The TTIP agreement, which includes the reduction of tariff barriers to agri-food trade between the EU and the US, would contribute to boosting bilateral agri-food trade largely for the US. The creation of such a free trade area produces mostly trade creation effects, but these will be asymmetric and concentrated in a few product groups.
Opponents of liberalization in Japan argue that because food crop production is subject to high variability, over-reliance on imports would be risky. To assess the risks to Japan with and without trade liberalization, Petrolia and Kennedy (2003) [
30] utilized a partial equilibrium model to simulate different policy actions on the US sugar market. Increases in the US tariff-rate quota for sugar were simulated to determine the impact of allowing Cuba market access and increasing the Mexican allotment. The potential economic gains from trade liberalization for sugar were evident in the resulting higher consumer welfare. World sugar prices remained unchanged under trade liberalization, contrary to expectations. From a different perspective, Jiggins (2016) [
31] discussed the effects of free trade agreements for food and the complex issues related to trade, ethics, and the environment. The authors argued that the reduction in food tariffs, subsidies, and other nontariff barriers comes at a high cost because food trade openness weakens governments’ ability to make policy choices about environmental and social issues. The authors pointed out that, with food trade, the domestic governance of the food chain is forced to elevate concerns about free trade above environmental, safety, and social concerns to keep up with the World Trade Organization (WTO) agreements, guidelines, and recommendations.
McCalla and Sh (2006) [
32] stated that for developing countries, tariffs are important, as they are the only instrument available to respond to the effects of industrial countries’ subsidy policies. Furthermore, the authors argued that tariff protection could shelter farmers in developing countries from import surges when world food prices drop significantly. For all these reasons, many developing countries, including Egypt and Pakistan, oppose further agricultural trade liberalization as long as developed countries continue to provide large-scale subsidies and or do not reduce other nontariff barriers or continue to practice dumping (Margulis (2018) [
33], Ejaz and Ahmad (2017) [
34], Giovannetti et al. [
35], Spieman et al. [
36], Artuc et al., 2019 [
37], Oliva M., 2000 [
38], Ghandi and Zhou, 2014 [
39]).
Anderson (2016) [
40] argued that food trade is especially beneficial to food security for two categories of countries: those that are restricting food imports and where the majority of the poor and undernourished are net buyers of food; and those countries where the majority of the poor and undernourished are net sellers of food and their governments are restricting food exports. In both cases, reducing trade restrictions will tend to raise the real income and food security of poor households. As for the other categories of countries, opening such economies of food trade will raise the average national income, which, in turn, may increase the scope for assisting the poor with more efficient domestic food security measures. Dithmer and Abdulai (2017) claim that despite significant progress in the fight against hunger during the last decades, food insecurity remains a major problem in many countries, especially developing ones. In this study, the authors use a large cross-country data set to investigate the impact of trade openness and other factors on food security, measured by dietary energy consumption [
41].
All the studies above recommend a substantial reduction in developed countries’ agricultural tariffs. However, the findings of these papers were broadly mixed in terms of the type and extent of impacts from the reduction in tariffs on food security. However, there is an agreement that tariff reduction or elimination through domestic agriculture trade policy reform is important for developing countries when they pursue welfare improvement, especially for low-income households. We argue in this study that food trade openness contributes to increasing consumer surplus and enhanced food security for low-income households in developing countries as food availability and accessibility expand to food produced by trading partners.
6. Method
This study applies a single market partial equilibrium simulation tool within the World Integrated Trade Solution (WITS) program to simulate food tariff liberalization in India, Egypt, Pakistan, Saudi Arabia, and the UAE. The partial equilibrium model is based on a system of equations that quantify changes in economic outcomes resulting from a change in trade policy. These outcomes include effects on trade volume from an importing country’s perspective, trade creation due to tariff elimination, a reduction in tariffs and duty collection by the government, and changes in consumer surplus. Consumer surplus represents the difference between the price a consumer pays and the price that they are willing to pay.
Figure 4 shows the effect on tariff revenue (TR), consumer surplus (CS), and the overall change in welfare (W) due to a reduction in deadweight loss (DWL) on a specific commodity coming from a tariff reduction–
Figure 4.
Trade creation is defined as the increase in demand (in-country
j) for the good
i originating from
k because of a decrease or reduction of a tariff barrier. The equation described by Poczta-Wajda and Sapa (2017) [
29] is used in the single market partial equilibrium model and described in Equation (1):
where
= trade creation effect (trade creation + trade diversion)in response to good imports from country to country ;
= value of imports of good to country from country ;
= price elasticity of import demand when a tariff on good imports from country to country is changed;
= tariff on good imported from country by country ;
= price elasticity of export supply.
The advantage of using the partial equilibrium approach to perform the food trade liberalization simulations is that the data requirements are minimal; only requiring the value of trade flows, tariff rate cuts, and behavioral parameters including price elasticities of import demand and export supply. Furthermore, a partial equilibrium approach allows detailed disaggregation at the commodity level at each stage of the simulation processes. However, due to the simplicity of partial equilibrium models, they miss important interactions and feedback between various markets, which may be vertically linked to food commodity markets. In other words, the partial equilibrium approach does not consider highly important intersectoral interactions between inputs, such as chemical and machinery markets, and outputs, such as transportation and market linkages. Such linkages are accounted for in general equilibrium models. General equilibrium models that are comparable across countries are much harder to come by, especially for this group of countries.
The data used in the partial equilibrium model are based on the United Nations COMTRADE database, which contains annual trade flow information covering imports, exports, and re-exports since 1962. The database also includes trade values and quantities by product category in the Standard International Trade Classification (SITC) since 1962 and the Harmonized System (HS) since 1988. The study assumes a price elasticity of supply of 99 (essentially infinitely elastic), which indicates no binding supply constraints to imports when food tariffs are eliminated. The study also assumes import substitution at 1.5. The price elasticity of imports summarizes the competition between domestic and foreign producers in the face of an adjustment in demand [
32]: as the quantity demanded increases by 1%, prices increase by 1.5%. The Harmonized System (HS) nomenclature was selected over the SITC as it offers the food groups needed for this study. The base year for this study is 2017.
7. Results and Discussion
The results of this study are described in the following sections. The first section presents the results of the tariff elimination simulation. The second section presents country-specific results of tariff elimination for selected food commodities and discusses possible food security implications of the results.
7.1. Zero-Tariff for Food Commodities Simulation Results
Table 5 below shows the values of food imports for the selected countries in 2017. India imported the highest value at 23.7 billion international dollars, followed by the UAE at 16.5 billion international dollars. These two largest importers had nearly 50 percent more imports than Saudi Arabia and Egypt, and nearly double that of Pakistan. The bilateral trade from Egypt, India, and Pakistan to all five countries ranged between 10% and 15% of their gross food exports to all countries. (See
Supplemental Material for detailed bilateral trade between the study’s countries by commodity).
Table 5 also shows the net trade creation and welfare impacts of the zero-food tariff simulations. The results show that trade creation is the highest for India at 9.7 billion dollars, followed by the UAE at 647 million dollars. In Egypt, Saudi Arabia, and Pakistan, trade creation was found to be 535, 420, 380 million international dollars, respectively. Government losses due to food tariff elimination ranged from 5.9 billion dollars in India to 261 million dollars in Saudi Arabia.
The most important aspect of this analysis is the net welfare impacts from the zero-tariff food trade. The largest annual impact in international dollars is India (2.6 billion dollars), followed by Egypt (340 million dollars), and Pakistan (25 million dollars). Saudi Arabia and the UAE saw net welfare impacts of about 14 and 17 million dollars, respectively.
One major finding of this analysis is the measurement of per capita impact in terms of trade creation due to tariff elimination. On a per capita basis, the UAE has trade creation at the highest level of 72 international dollars. The UAE is followed by Saudi Arabia (13 international dollars) in per capita trade creation. Meanwhile, per capita trade creation would be six international dollars in Egypt and two in Pakistan. While small overall, it is expected that such a consumer surplus will have a magnified impact on the low-income population in India, Egypt, and Pakistan and guest workers in Saudi Arabia and the UAE. For example, the impact of trade creation would equal approximately 2% of minimum wage workers’ income in Egypt and Pakistan. We reported earlier that dropping tariffs on the main commodities in Pakistan would increase income by 7.5% and it would be more for low-income families.
7.2. Country-Specific Results for the Zero-Tariff Simulations
Table 6 below illustrates Egypt’s 2017 value of imports, current weighted tariffs by commodity, and zero-tariff simulation results (trade creation, tariff loss for the government, and change in consumer surplus) for all 25 groups of food commodities included in the UNCOMTRADE database. The largest value of imported food in Egypt in 2017 was from cereals (wheat and rice), estimated to be 7 billion dollars, followed by meat at 1.6 billion dollars. The largest current weighted tariff rate was 1726% for beverages to zero-rate gums and extracts. The zero-tariff simulation results indicated that net trade creation for Egypt would be largest for fruits and nuts (148 million dollars) and meat (104 million dollars). In addition, the simulation showed relatively large increases of consumer surpluses for beverages of 155 million dollars, fruits and nuts of 15 million dollars, and then meat of 13 million dollars, after the tariff elimination.
Fully half of Egypt’s food import bill is for rice and wheat, where there is no tariff and, for many years, those imports have been supported by foreign aid payments. Next, about 28% of food imports are meat and related products. The gains from tariff reduction come predominantly from other foods and beverages, which are undoubtedly taxed highly because they are directed to the large tourist industry in the country. The table also reveals that Egypt has been a longstanding member of the food importers group in WTO negotiations, with its heavy dependence on imported cereals.
Table 7 shows the impact of food tariff elimination for India. The total value of imports before the simulation exercise was the largest among the countries in this study (about 23.8 billion dollars). Food trade tariff elimination would lead to a food trade effect of 9.7 billion dollars. Tariff revenue losses to the government in India would be about 5.9 billion dollars but consumers would gain about 2.6 billion dollars. India imposes very high tariffs to protect local food production, so tariff elimination is likely to generate a large consumer surplus gain for the low-income population. Furthermore, the openness of trade to the other selected countries in this study would create a large diversion to food trade from the rest of the world and expand trade creation for the GCC countries such as Saudi Arabia and the UAE—see
Supplemental Material.
Table 8 illustrates the value of imports, the current weighted tariffs, and the zero-tariff simulations for food commodities in Pakistan in 2017. The largest food import group was oil seeds, straw, and fodder, which was estimated to be 1.1 billion dollars. The weighted tariff rate is 9% for all commodities. Due to such high rates, a zero-tariff leads to most trade creation for prepared cereals (32 million dollars).
Table 9 illustrates the value of imports, the current weighted tariff average, and the zero-tariff simulation results for food commodities in Saudi Arabia in 2017. As expected, the largest imported food value is cereal (wheat and rice), which is estimated to be 1.5 billion dollars, followed by prepared cereal at 967 million dollars. The average weighted tariff rate is about 6% for all commodities. Saudi Arabia applies a very low tariff rate on most cereals of 0.5%. However, several food commodities are still charged relatively high tariff rates such as wheat (20%) and meat (10%). The zero-tariff simulation results for Saudi Arabia find that the trade total effects are the largest for fruits and nuts (130 million dollars) followed by dairy, poultry, meat, and eggs (40 million dollars). The change in consumer surpluses are spread across several commodities, such as meat and prepared cereal, which is expected to positively affect low-income guest workers.
Table 10 illustrates the value of imports, the current weighted tariff average, and the zero-tariff simulation results for food commodities in the UAE in 2017. The largest value in imported food in the UAE was found to be fruits and nuts, which was estimated to be about 2 billion dollars, followed by dairy, poultry meat, and eggs, which are estimated to be 1.8 billion dollars. The average weighted tariff rate was relatively low, at 4% for all food commodities. For this reason, the zero-tariff simulation has shown just a moderate net trade effect.
Table 11 shows that the countries in this study do not show major gains to consumers from reduced tariffs on cereals as trade in cereals, even wheat, is already open. However, results show that Indian consumers benefit the most from cereal tariff elimination (764 million dollars), followed by sugar tariffs elimination (203 million dollars), and fruits (105 million dollars) annually. The value on cereals is probably low because the prohibitive tariff of 78% on rice appears to block all imports, thus making the elimination of tariffs appear smaller.
On a per capita basis, the consumer surplus would not reach observable values. However, we argue that, collectively, the impact of food tariff reduction would lead to more food availability and stability to low-income consumers in all countries (in Saudi Arabia and the UAE, the beneficiaries would mostly be guest workers), which implies progress towards Sustainable Development Goals such as the UN’s poverty reduction goal.
However, across all of the other four countries and specific commodities, the openness of food trade would create just moderate to low positive consumer surplus and expanded trade creation. This is most obvious in India, Egypt, and Pakistan. Moderate impacts are shown in Saudi Arabia and the UAE as these two countries have already reduced tariff barriers in the last few decades. Overall, the openness of food trade would have a positive impact on food accessibility and food price stability for low-income groups in India, Egypt, and Pakistan, as well as guest workers in Saudi Arabia and the UAE due to increased consumer surplus and trade creation.
8. Conclusions
This research analyzed the effects of complete tariff removal on food trade openness, added consumer welfare from changes in food consumption, and the resulting trade creation, food availability and thus food security in India, Pakistan, Egypt, Saudi Arabia, and the UAE. These countries either have large populations (India, Pakistan, and Egypt,) and/or are heavily involved in bilateral food trade (Saudi Arabia and the UAE) in the Middle and the Far East. The study argues that the reduction of food tariffs increases food supply through trade creation and enhances food security, especially and significantly for over 350 million low-income persons and guest workers.
Each country’s food security is viewed in terms of energy and protein availabilities from 2000 to 2019 relative to world averages. These comparisons were separated by their reliance on grains/vegetables versus animal sources as well. In the high-income countries, Saudi Arabia and the UAE, both energy and protein adequacy exceed the world averages, with food energy supply exceeding world averages by 5–10 percent. For protein, the UAE exceeded the world average by nearly 60 percent. Their sources of energy and protein were below the world average for cereals, roots, and tubers and thus were higher from animal sources. By 2017, Saudi Arabia’s population obtained nearly 43% of its protein from animals, while the UAE had 41% from those sources (and the UAE reached 52% in earlier years).
At the opposite end, Pakistan and India had less energy availability than the world average, but it was still above daily requirements. For protein, these countries had 10% less than the 70 g of protein available daily worldwide. Pakistan was close to the world average in its percent of protein from animal sources, and of course, India was much lower. A real outlier was Egypt, which had the highest energy availability of the five countries and was second only to the UAE in protein availability. Most of this adequacy came from cereals, reflecting their large import dependence on wheat and rice. They were much below the world average in terms of animal sources for protein and energy.
The overall trade creation due to tariff elimination as simulated in the WITS model was found to be relatively small, but the effects on low-income populations in India, Egypt, and Pakistan and low-income guest workers in Saudi Arabia and UAE are higher. Tariffs were less than 10% in all countries except India, which was 39%, and these effects, albeit small, would benefit about 360 million low-income people in India, Egypt, and Pakistan and guest workers (about 11 million in Saudi Arabia and 4 million in the UAE).
Some specific food tariff rates were higher than the overall averages found in this study, and whose reduction could have large effects on diet quality and food availability. Tariffs on wheat in India, Saudi Arabia, and Pakistan (25%, 20%, and 11%, respectively), rice in India (78%), and Pakistan (10%) surely reduce energy supply in these countries. High tariffs exist on meat and meat products in India, Egypt, and Pakistan (32%, 19%, and 15%, respectively), and edible fruits and nuts in India, Egypt, and Pakistan (32%, 23%, and 17%, respectively). These are just the commodities whose increased availability has the potential to add to a diversified and more nutritional diet. As the tariffs on these commodities were between 15% and 20%, dropping them to zero would yield a real income gain to the average household in Pakistan of about 7.5%, and probably more for lower-income families and guest workers. With lower elasticities on grains, removing these tariffs would also facilitate a shift to a more diversified and higher-quality diet.
This research also delved into the economic and domestic policy factors that affect food trade and policy. All countries excluding the UAE run budget deficits over 6% of GDP and need revenues, some of which comes from import tariffs. These deficits may limit a country’s ability to provide income and food support to low-income households. These budget deficits are more challenging in Pakistan and Egypt as their negative trade balances mean that external agents are supporting the government’s budget deficit, giving them less flexibility in spending. Additionally, the presence of trade deficits is likely to lead to higher tariffs to block imports to reduce deficits, counter to improving food security via trade.
This research focused on making a connection between food trade openness, trade creation, and consumers’ welfare, especially for low-income populations and guest workers through food tariff elimination on major food categories for the five selected countries. This research finds that Egypt and Pakistan may consider the tradeoff between gains from government revenues from tariffs and the country’s progress towards fulfillment of the food security agenda. Food trade openness should not exclude certain commodities (e.g., wheat, rice, prepared cereals, meat, dairy, and fruits) from tariff reduction. The exclusion of such commodities is in direct contradiction to progress towards food availability enhancement as a food security objective. Food security policies that consider population welfare (e.g., low-income population and guest workers) need to be addressed in food security policy formulations.
The pattern of food tariffs makes it clear that in Pakistan and India priorities are given to the domestic production of major food commodities, rather than lower prices for consumers. Through deliberate policies of high food and other trade restrictions, India has turned a likely trade deficit into a significant trade surplus. Overall, agricultural and food policy reforms need to consider the tradeoff between government revenue losses from high food tariffs and the welfare implications on low-income households.
Looking forward, because the spillovers in domestic policy have effects on vulnerable populations in the related countries studied here, a trade model that focuses on the external impacts of domestic policies could examine options for better outcomes in the region. Studies using general equilibrium models could assess capital and infrastructure shocks as well as economic growth over time and can provide evidence on the link between food trade openness and countries’ strategic goals in food security policies.


