
A Tool for the Evaluation of Energy-Environmental Retrofit Interventions on Opaque Walls Using ETICS


Abstract
1. Introduction
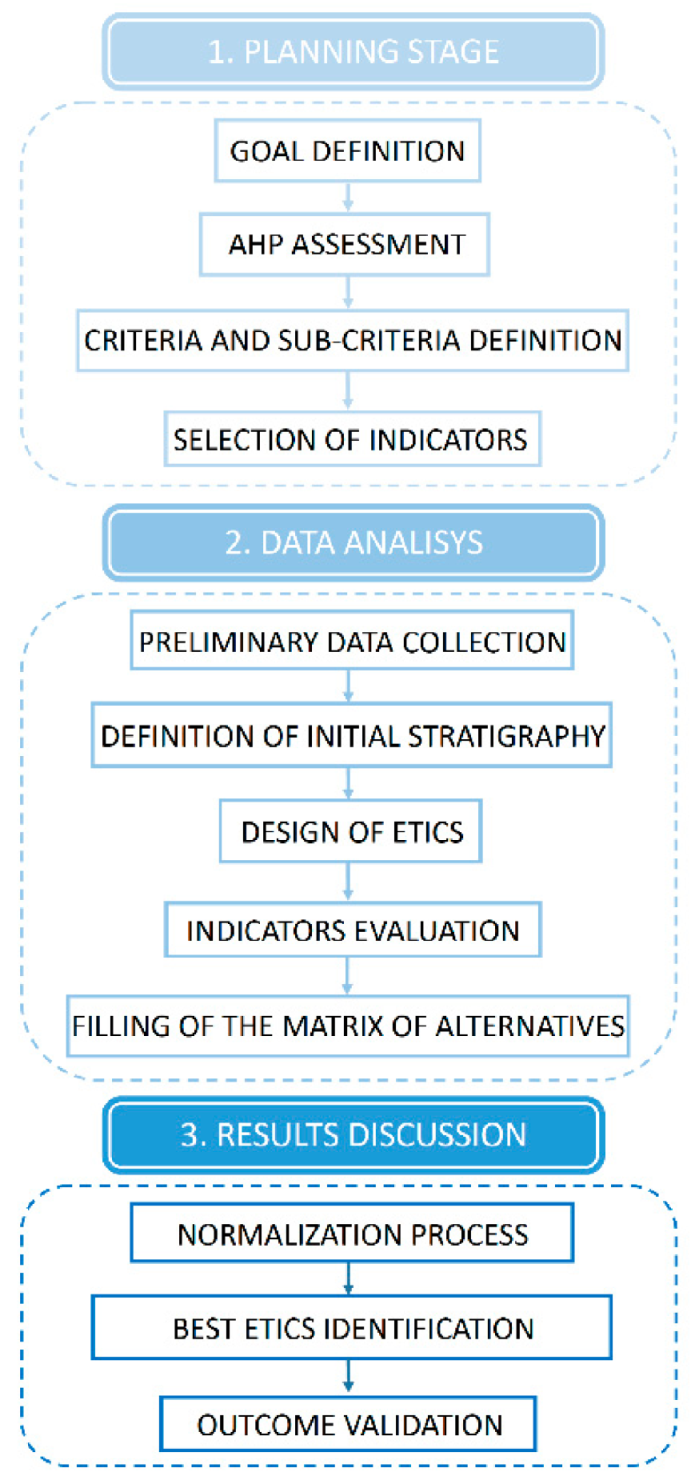
2. Methodology
- definition of the purpose (goal) of the comparison;
- identification of alternatives Ai;
- selection of the criteria Cj and any subcriteria for evaluation;
- attribution of the weights relative to the criteria and subcriteria;
- construction of the Matrix of Alternatives;
- normalisation of the matrix values;
- computation of total scores and ranking of alternatives.
- CR < 5% for n = 3;
- CR < 8% for n = 4;
- CR < 10% for n > 4.
2.1. Evaluation Criteria, Subcriteria and Indicators
- a product certification granted by a conformity assessment body attesting the recycled content;
- a Type II environmental self-declaration in accordance with ISO 14021 [51], verified by a conformity assessment board.
- is the temperature of the indoor environment expressed in °C, assumed to be 20 °C;
- is the temperature of the external environment expressed in °C;
- is the internal surface resistance of the wall expressed in m2K/W and which in the case of vertical surface and horizontal heat flow takes on a value of 0.13;
- is the thermal flow expressed in W.
- is the cost of extraordinary maintenance incurred at the end of year t;
- d is the discount rate;
- t is the time interval in years from the start of the analysis to the maintenance date.
- is the initial investment of the intervention;
- M is the total cost of routine maintenance;
- Repl is the total cost of extraordinary maintenance.
2.2. Decision Matrix and Decision Support Index
- criteria to minimise:
- criteria to maximise:where xj,min = minj (xij) e xj,max = maxj (xij).
- criteria to minimise:
- criteria to maximise:where xj,min = minj (xij) e xj,max = maxj (xij).
3. Implementation of the Methodology to Cases Study
4. Results and Discussion
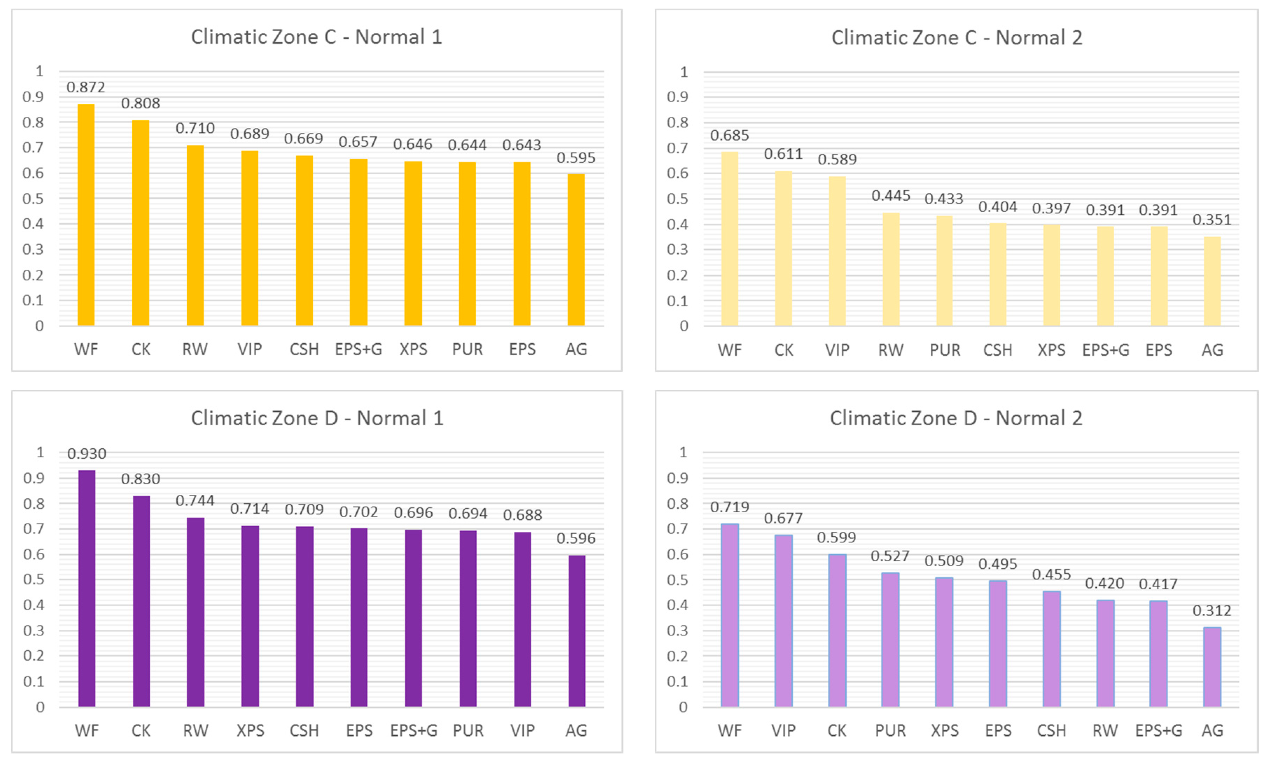
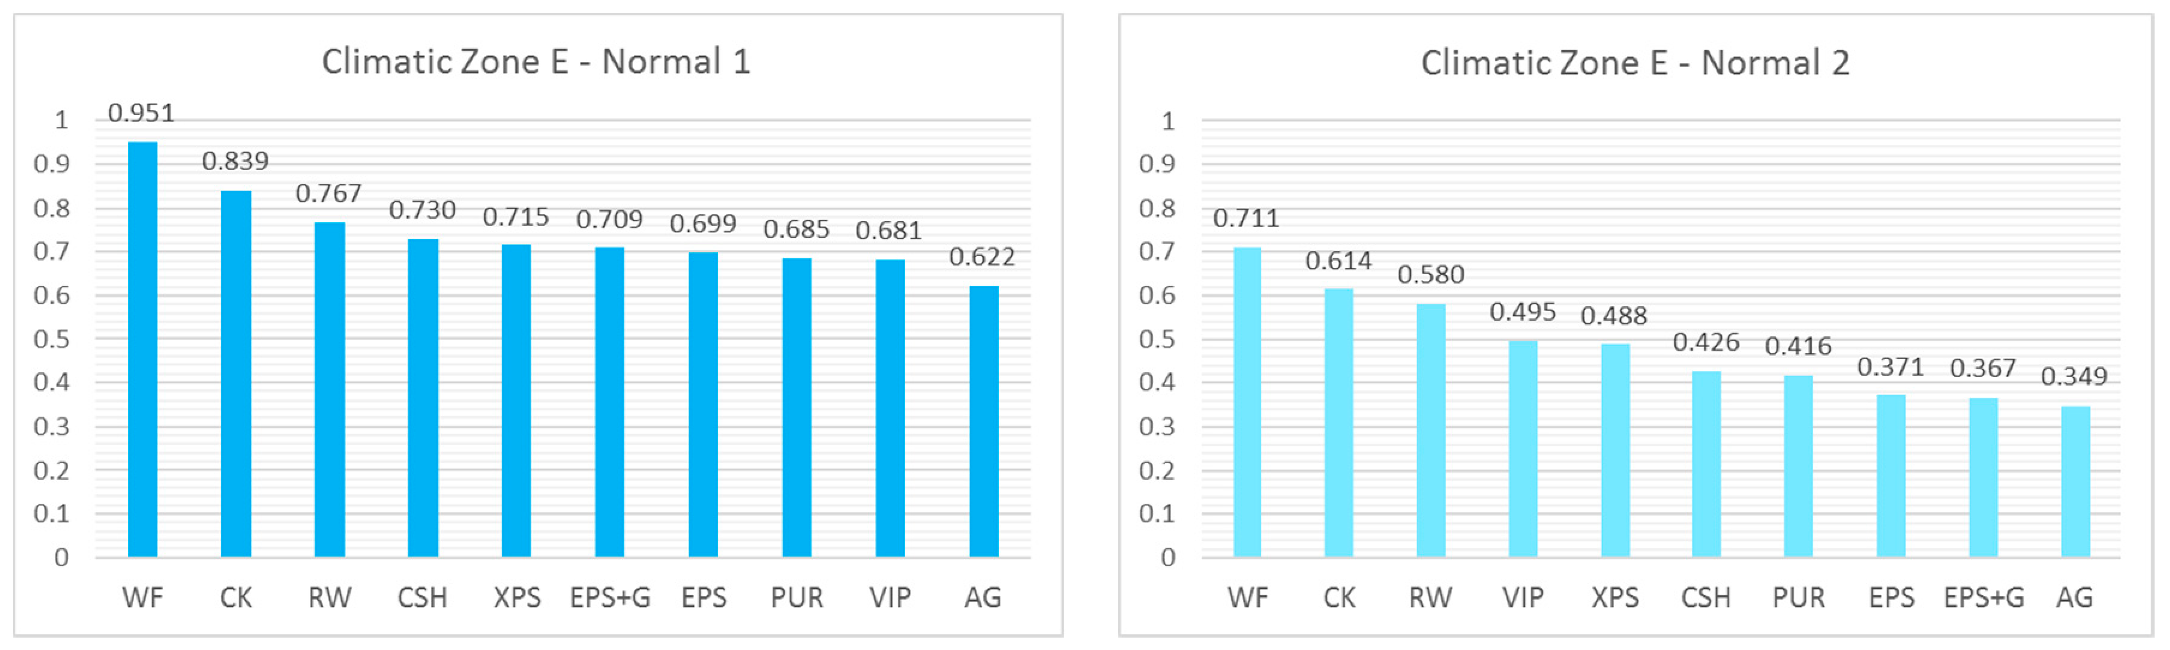
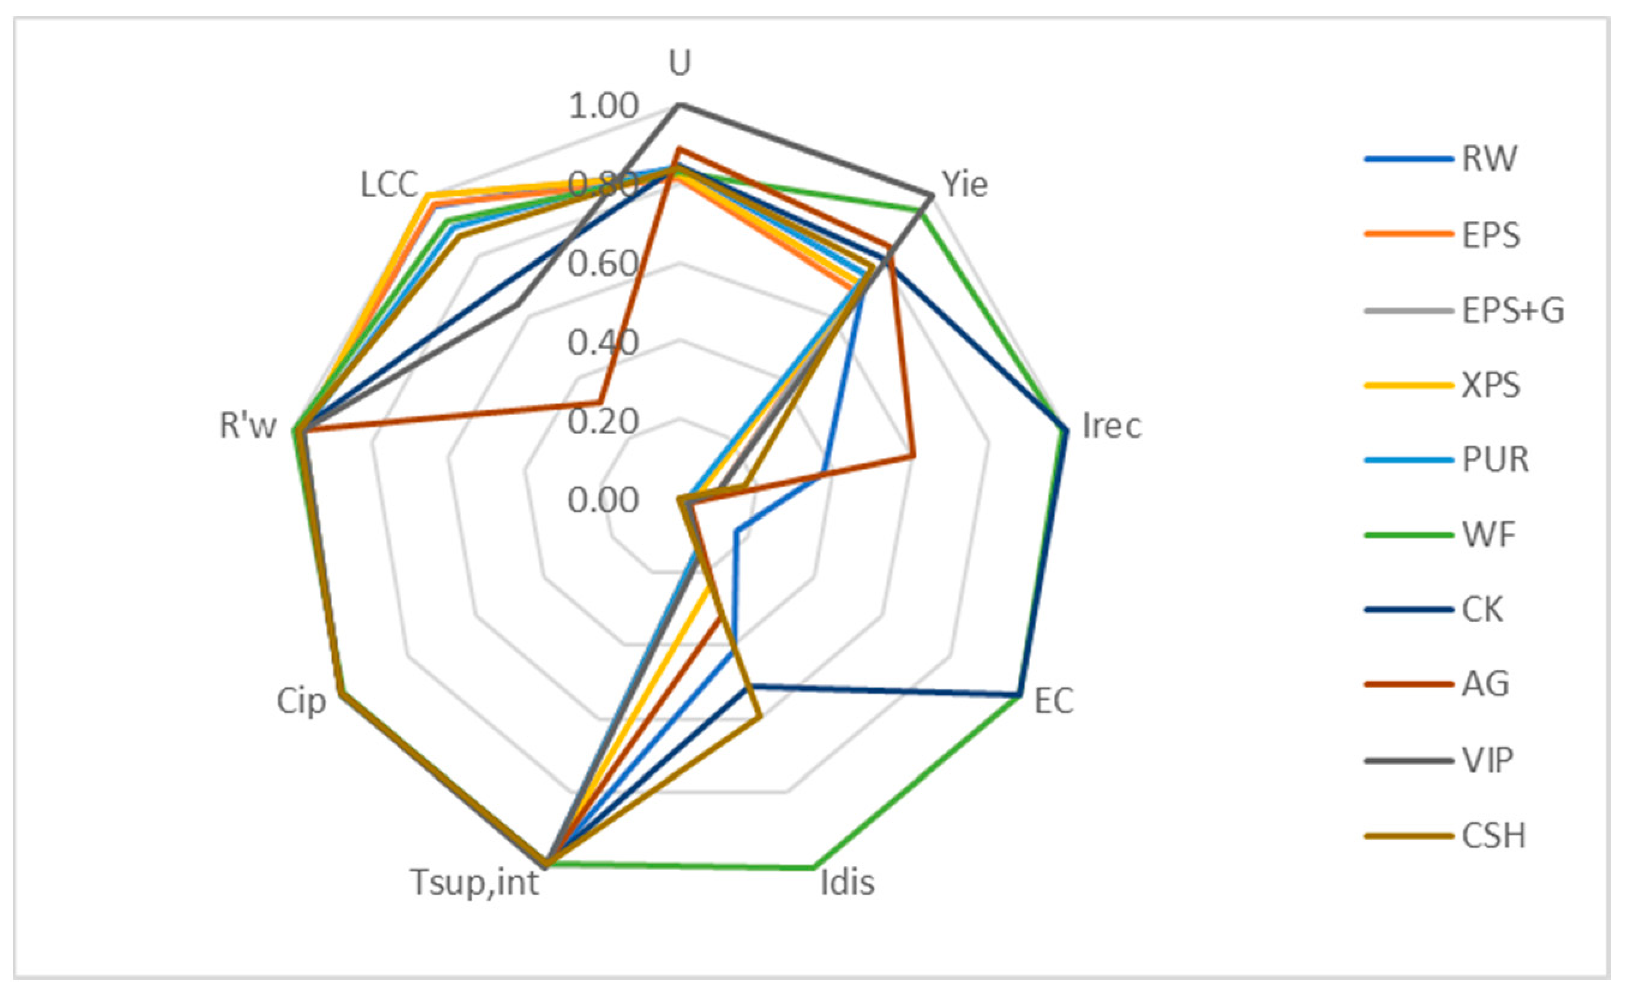
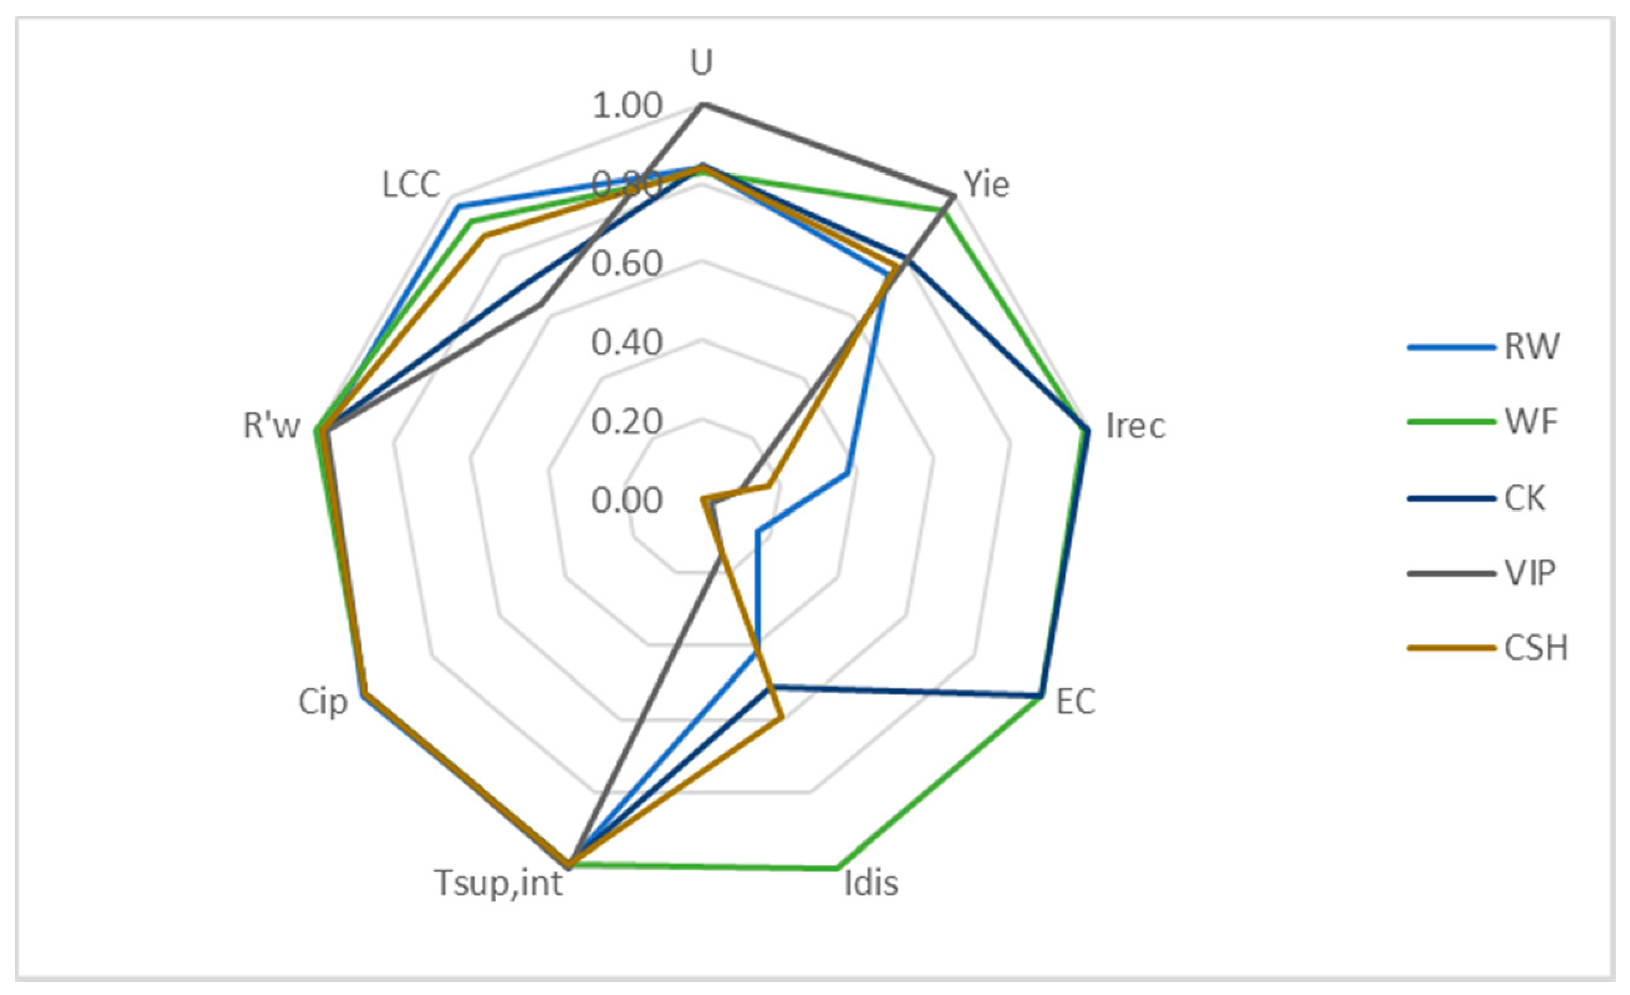
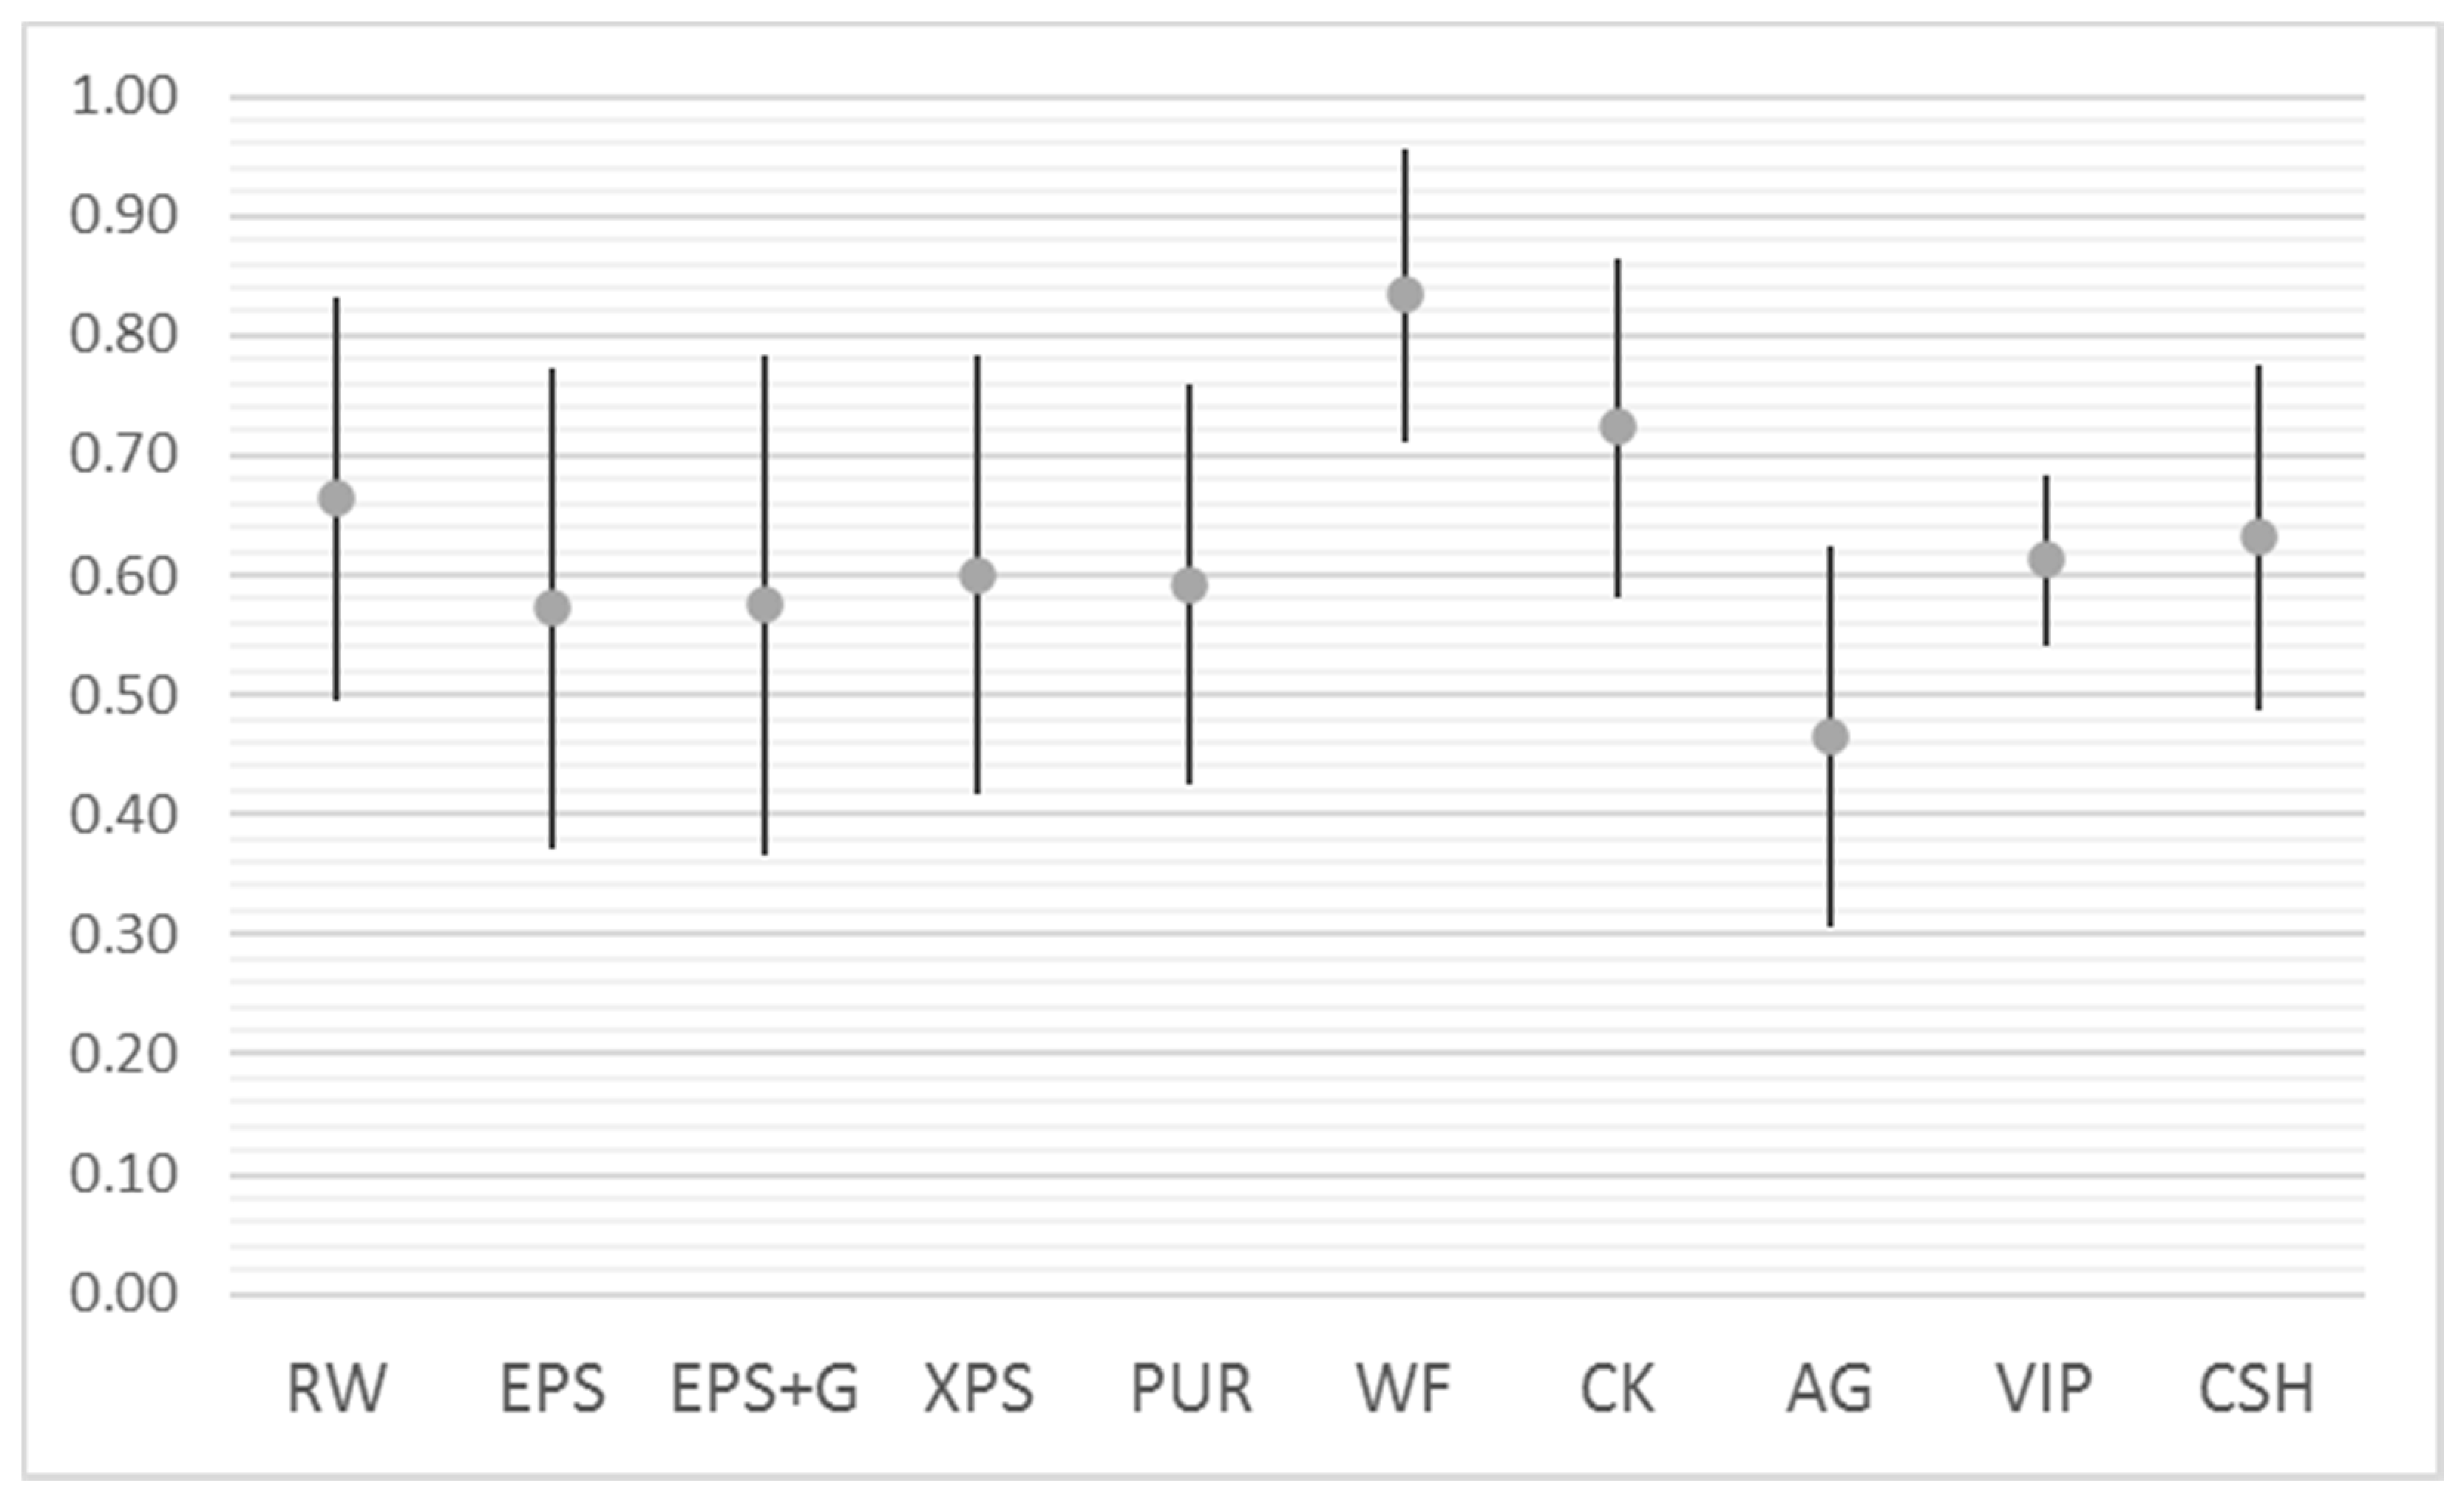
- the ETICS alternative that achieves the best compromise between the different evaluation criteria, both in the 3-criteria model and in the 4-criteria one, and with the normalisation methods 1 and 2, is the one with a wood fibre insulating panel; this alternative is confirmed as the best also in the different three climatic zones considered (Figure 5);
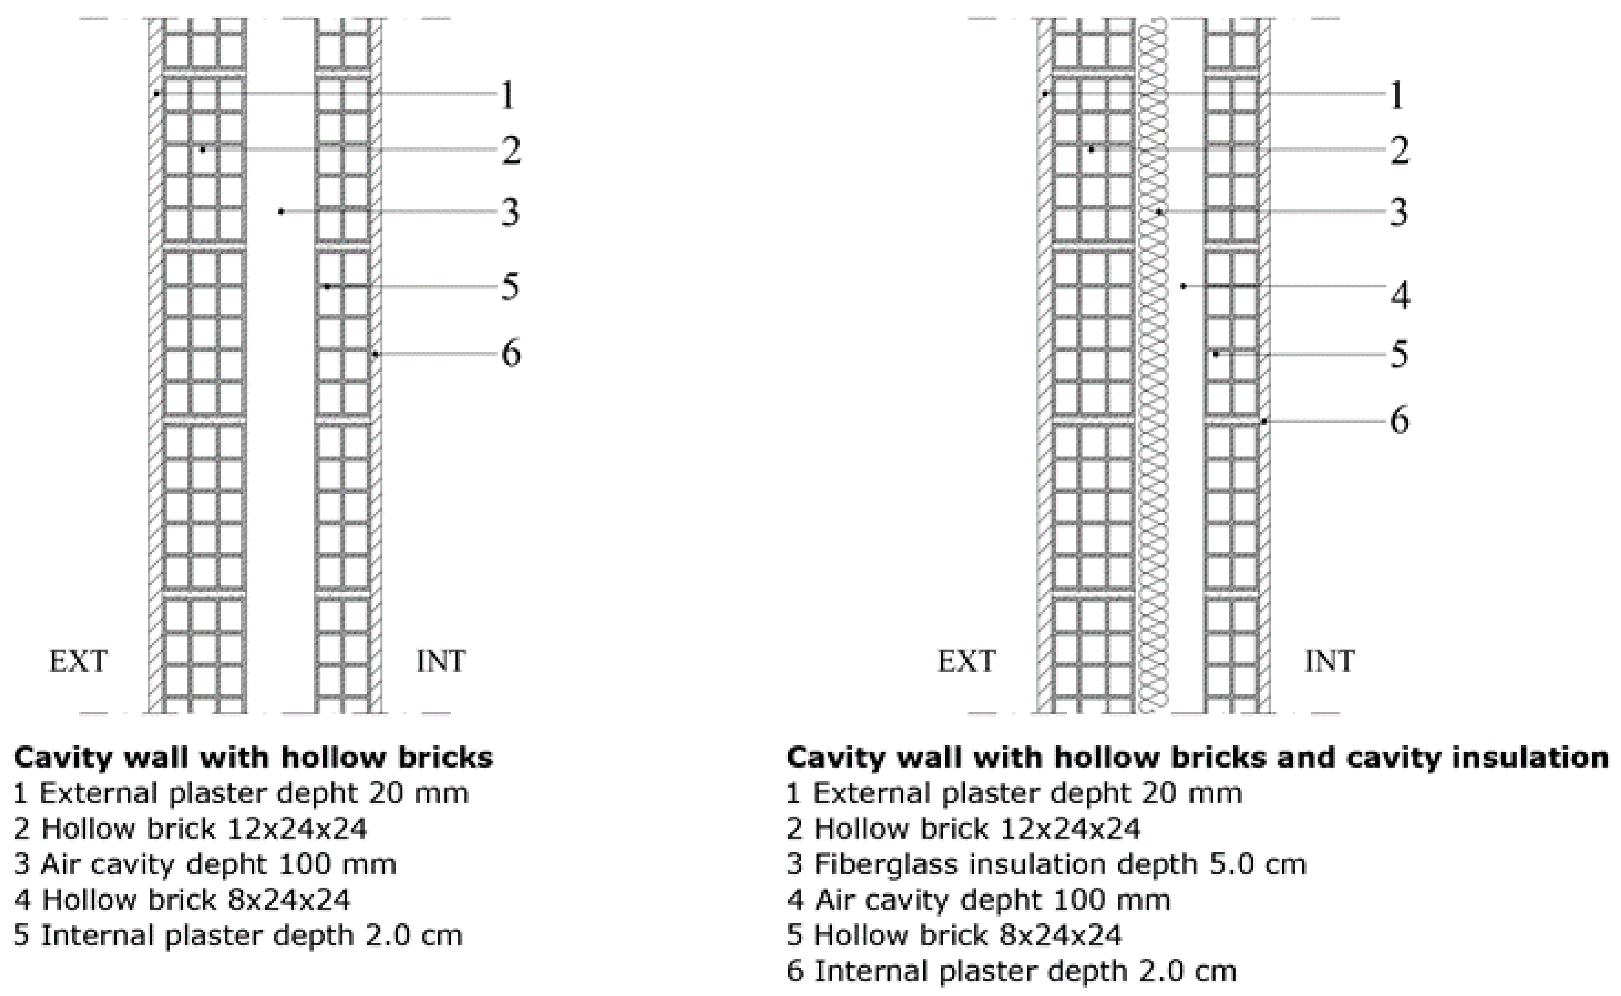
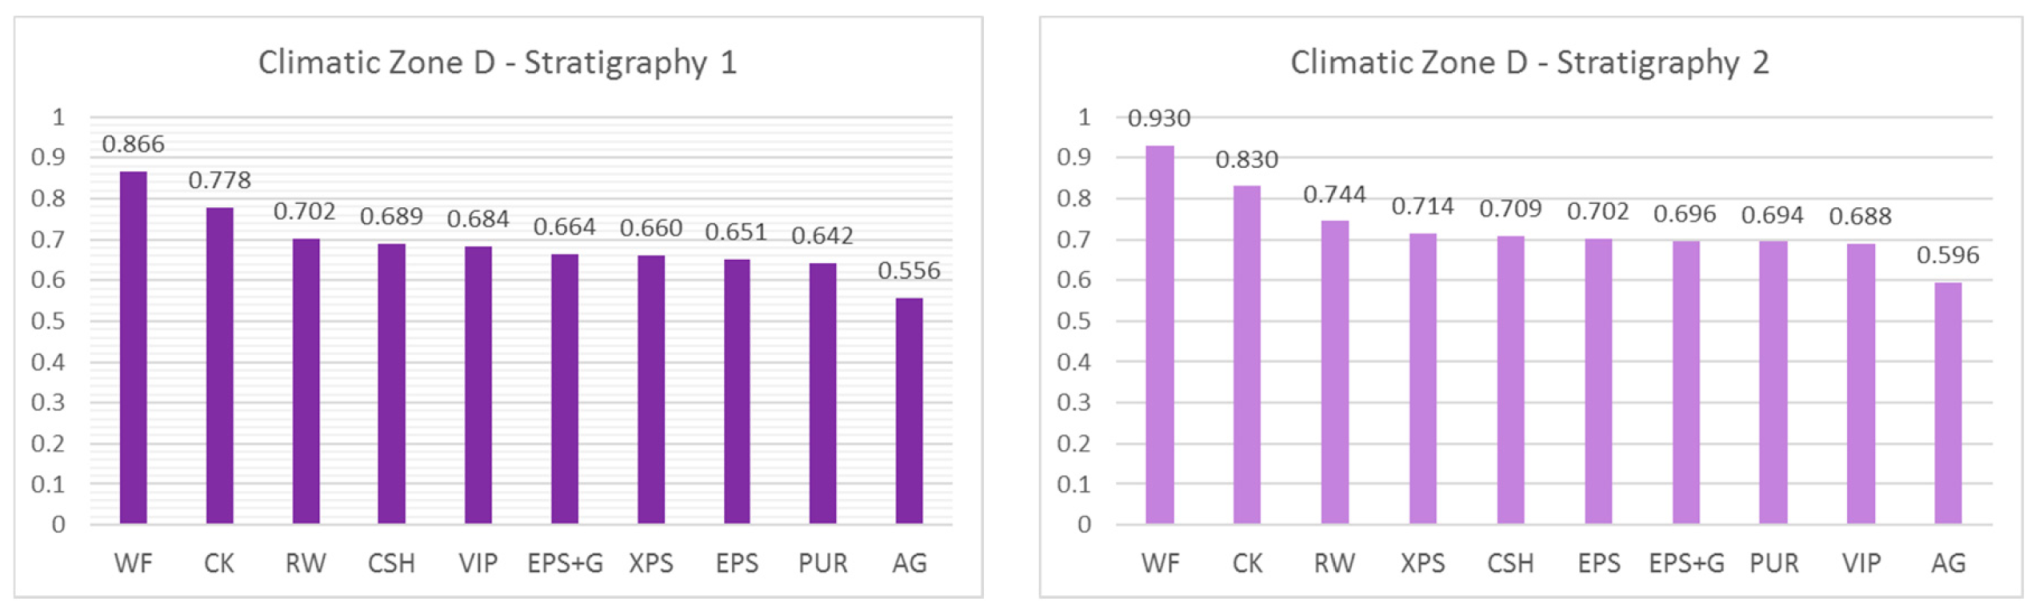
- in relation to the two reference stratigraphies, the “optimal” alternative is always the “WF” (Figure 6);
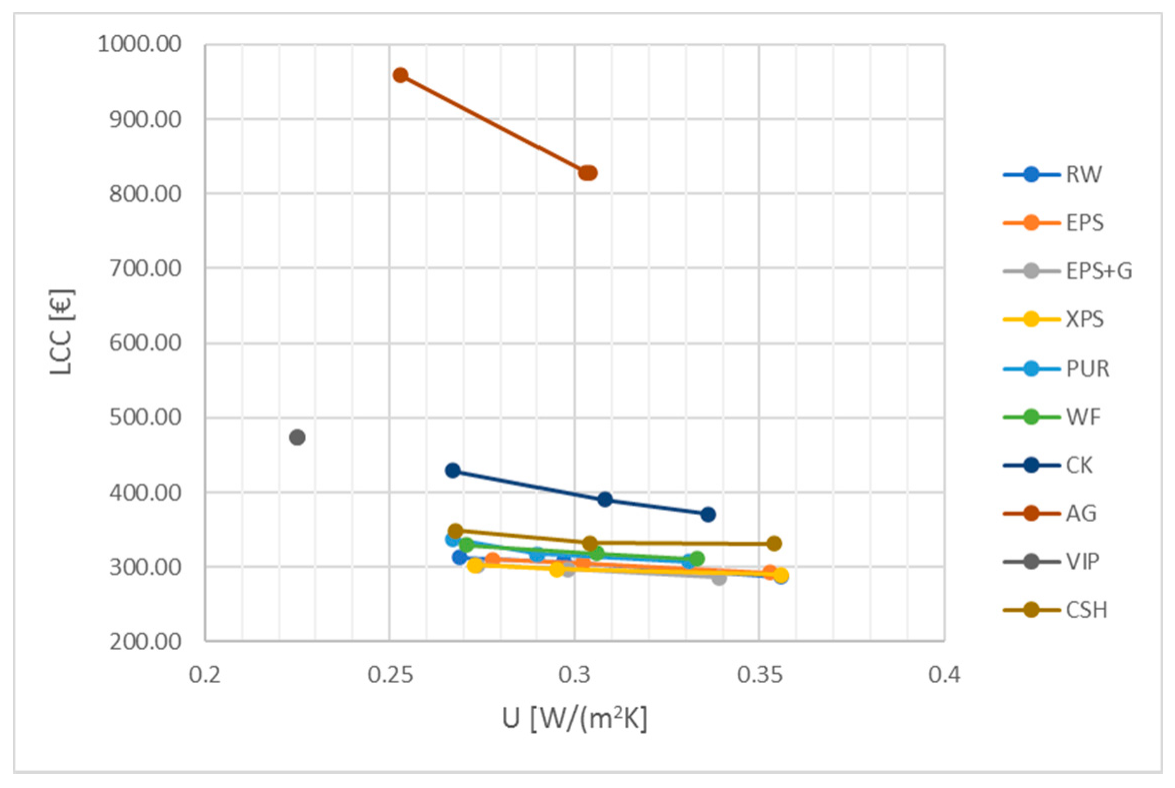
- in most simulations, the second “optimal” system is the one that provides for insulation with cork (Figure 6 and Figure 9);
5. Conclusions
Author Contributions
Funding
Institutional Review Board Statement
Informed Consent Statement
Data Availability Statement
Conflicts of Interest
References
- Hegger, M.; Fuchs, M.; Stark, T.; Zeumer, M. Energy Manual: Sustainable Architecture, Birkhäuser, 1st ed.; Walter de Gruyter: Berlin, Germany, 2008. [Google Scholar]
- United Nations Environment Programme UNEP. Building and Climate Change: Summary of Desicion-Makers; United Nations Environment Programme UNEP: Paris, France, 2009; p. 62. [Google Scholar]
- Assembly, G. Resolution Adopted by the General Assembly on 25 September 2015, Transforming Our World: The 2030 Agenda for Sustainable Development; UN General Assembly: New York, NY, USA, 2015. [Google Scholar]
- Energy Performance of Buildings Directive, European Commission, Energy Efficiency. Available online: https://ec.europa.eu/energy/topics/energy-efficiency/energy-efficient-buildings/energy-performance-buildings-directive_en (accessed on 26 November 2020).
- Eurostat, Waste Generation by Economic Activities and Households, EU-28. 2016. Available online: https://ec.europa.eu/eurostat/statistics-explained/index.php?title=File:Waste_generation_by_economic_activities_and_households,EU-28,_2016_(%25).png (accessed on 26 November 2020).
- Communication from the Commission to the European Parliament, the European Council, the Council, the European Economic and Social Committee and the Committee of the Regions, Brussels, Belgium. 2019. Available online: https://eur-lex.europa.eu/resource.html?uri=cellar:b828d165-1c22-11ea-8c1f-01aa75ed71a1.0002.02/DOC_1&format=PDF (accessed on 28 November 2020).
- The European Green Deal A European Green Deal, Striving to Be the First Climate-Neutral Continent. Available online: https://ec.europa.eu/info/strategy/priorities-2019-2024/european-green-deal_en (accessed on 28 November 2020).
- Directive 2010/31/EU of the European Parliament and of the Council of 19 May 2010 on the Energy Performance of Buildings, Brussels, Belgium. 2010. Available online: https://eur-lex.europa.eu/legal-content/EN/TXT/?uri=celex%3A32010L0031 (accessed on 2 November 2020).
- Directive 2012/27/EU of the European Parliament and of the Council of 25 October 2012 on Energy Efficiency, Amending Directives 2009/125/EC and 2010/30/EU and Repealing Directives 2004/8/EC and 2006/32/EC; EU: Brussels, Belgium, 2012.
- Directive (EU) 2018/844 of the European Parliament and of the Council of 30 May 2018 Amending Directive 2010/31/EU on the Energy Performance of Buildings and Directive 2012/27/EU on Energy Efficiency; EU: Brussels, Belgium, 2018.
- Commission Recommendation (EU) 2019/786 of 8 May 2019 on Building Renovation (Notified under Document c(2019) 3352); Commission Recommendation (EU): Brussels, Belgium, 2019.
- Commission Recommendation (EU) 2019/1019 of 7 June 2019 on Building Modernization; Commission Recommendation (EU): Brussels, Belgium, 2019.
- Boriani, A.; Cariani, W.; Romani, R. Guida Pratica Alla Ristrutturazione e Riqualificazione Energetica Degli Edifici, 1st ed.; ENEA—Agenzia Nazionale Efficienza Energetica: Rome, Italy, 2020; Available online: http://data.europa.eu/eli/dir/2018/844/oj (accessed on 28 November 2020).
- Ministero dello Sviluppo Economico, Ministero delle Infrastrutture e dei Trasporti, Piano Nazionale Integrato per l’Energia e il Clima. Available online: https://www.mise.gov.it/images/stories/documenti/PNIEC_finale_17012020.pdf (accessed on 28 November 2020).
- Regulation (EU) 2018/1999 of the European Parliament and of the Council of 11 December 2018 on the Governance of the Energy Union and Climate Action. 2018. Available online: https://eur-lex.europa.eu/legal-content/IT/TXT/PDF/?uri=CELEX:32018R1999&from=EN (accessed on 28 November 2020).
- Legge 27 dicembre 1997, n. 449. Misure Per la Stabilizzazione Della Finanza Pubblica; Pubblicata su Gazzetta Ufficiale Serie Generale n.22 del 28-01-1998—Suppl. Ordinario n. 19; Ministero dell’Economia e delle Finanze: Rome, Italy, 1997.
- Legge 27 Dicembre 2006, n. 296. Disposizioni Per la Formazione del Bilancio Annuale e Pluriennale Dello Stato (Legge Finanziaria 2007); Pubblicata su Gazzetta Ufficiale Serie Generale n. 299 del 27 dicembre 2006—Suppl. Ordinario n. 244; Ministero dell’Economia e delle Finanze: Rome, Italy, 2006.
- Decreto-Legge del 04/06/2013 n. 63. Disposizioni Urgenti per il Recepimento Della Direttiva 2010/31/UE del Parlamento Europeo e del Consiglio del 19 Maggio 2010, Sulla Prestazione Energetica Nell’edilizia per la Definizione delle Procedure D’infrazione Avviate Dalla Commissione Europea, Nonche’ altre Disposizioni in Materia di Coesione Sociale, Pubblicato su Gazzetta Ufficiale Serie Generale n. 130 del 5 giugno 2013; Presidente Della Repubblica: Rome, Italy, 2013.
- Legge 27 dicembre 2019, n. 160. Bilancio di Previsione dello Stato per L’anno Finanziario 2020 e Bilancio Pluriennale per il Triennio 2020-2022, Pubblicato su Gazzetta Ufficiale Serie Generale n.304 del 30-12-2019—Suppl. Ordinario n. 45L. 160/2019; Presidente della Repubblica: Rome, Italy, 2019.
- Decreto-legge 19 Maggio 2020, n. 34. Misure Urgenti in Materia di Salute, Sostegno al Lavoro e All’economia, Nonché’ di Politiche Sociali Connesse All’emergenza Epidemiologica da COVID-19, Pubblicato su Gazzetta Ufficiale Serie Generale n.128 del 19-05-2020—Suppl. Ordinario n. 21; Presidente della Repubblica: Rome, Italy, 2020.
- Bertini, I.; Puglisi, G.; Marani, M.; Federici, A.; Preziosi, M.; Viola, C. Rapporto Annuale Efficienza Energetica 2020, ENEA; ENEA—Agenzia Nazionale Efficienza Energetica: Rome, Italy, 2020. [Google Scholar]
- Decreto 26 Giugno 2015 Applicazione delle Metodologie di Calcolo delle Prestazioni Energetiche e Definizione delle Prescrizioni e Dei Requisiti Minimi Degli Edifici, Pubblicato su Gazzetta Ufficiale Serie Generale n.162 del 15-07-2015—Suppl. Ordinario n. 39; Ministero dello Sviluppo Economico: Rome, Italy, 2015.
- Manioğlu, G.; Yılmaz, Z. Economic evaluation of the building envelope and operation period of heating system in terms of thermal comfort. Energy Build. 2006, 38, 266–272. [Google Scholar] [CrossRef]
- Thalfeldt, M.; Pikas, E.; Kurnitski, J.; Voll, H. Facade design principles for nearly zero energy buildings in a cold climate. Energy Build. 2013, 67, 309–321. [Google Scholar] [CrossRef]
- Lechner, N. Heating, Cooling, Lighting—Design Methods for Architects, 3rd ed.; John Wiley & Sons Inc.: Hoboken, NJ, USA, 2008. [Google Scholar]
- Sassine, E. A practical method for in-situ thermal characterization of walls, Case Stud. Therm. Eng. 2016, 8, 84–93. [Google Scholar]
- Dongmei, P.; Mingyin, C.; Shiming, D.; Zhongping, L. The effects of external wall insulation thickness on annual cooling and heating energy uses under different climates. Appl. Energy 2012, 97, 313–318. [Google Scholar]
- Kinnane, O.; Sinnott, D.; Turner, W.J.N. Evaluation of passive ventilation provision in domestic housing retrofit. Build Environ 2016, 106, 205–218. [Google Scholar] [CrossRef]
- Broderick, A.; Byrne, M.; Armstrong, S.; Sheahan, J.; Coggins, A.M. A pre and post evaluation of indoor air quality, ventilation, and thermal comfort in retrofitted co-operative social housing. Build. Environ. 2017, 122, 126–133. [Google Scholar] [CrossRef]
- Thomas, L.P.; Marino, B.M.; Muñoz, N. Steady-state and time-dependent heat fluxes through building envelope walls: A quantitative analysis to determine their relative significance all year round. J. Build. Eng. 2020, 29, 101122. [Google Scholar] [CrossRef]
- Reilly, A.; Kinnane, O. The impact of thermal mass on building energy consumption. Appl. Energy 2017, 198, 108–121. [Google Scholar] [CrossRef]
- Ascione, F.; Bianco, N.; Mauro, G.M.; Napolitano, D.F. Building envelope design: Multi-objective optimization to minimize energy consumption, global cost and thermal discomfort. Application to different Italian climatic zone. Energy 2019, 174, 359–374. [Google Scholar] [CrossRef]
- Matos, M.; Soares, L.; Silva, L.; Sequeira, P. Life Cycle Assessment of an ETICS System Composed of a Natural Insulation Material : A Case Study of a System Using an Insulation Cork Board (ICB). In Portugal SB13 Contribution of Sustainable Building to Meet EU 20-20-20 Targets; Multicomp—Artes Gráficas, Lda: Guimarães, Portugal, 2013; Chapter 11; pp. 855–862. [Google Scholar]
- Luján, S.V.; Arrebola, C.V.; Sánchez, A.R.; Benito, P.A.; Cortina, M.G. Experimental comparative study of the thermal performance of the façade of a building refurbished using ETICS, and quantification of improvements. Sustain. Cities Soc. 2019, 51, 101713. [Google Scholar] [CrossRef]
- Gonçalves, M.; Simões, N.; Serra, C.; Flores-Colen, I. A review of the challenges posed by the use of vacuum panels in external insulation finishing systems. Appl. Energy 2020, 257, 114028. [Google Scholar] [CrossRef]
- Sierra-Pérez, J.; Boschmonart-Rives, J.; Gabarrell, X. Environmental assessment of façade-building systems and thermal insulation materials for different climatic conditions. J. Clean. Prod. 2016, 113, 102–113. [Google Scholar] [CrossRef]
- Donnarumma, G.; Fiore, P. A Multi-Criteria Model for the Comparison of Building Envelope Energy Retrofits. Mod. Environ. Sci. Eng. 2017, 3, 511–518. [Google Scholar] [CrossRef]
- Bragança, L.; Pinheiro, M.; Mateus, R.; Amoêda, R.; Almeida, M.G.D.; Mendonça, P.; Cunha, A.M.; Dias, A.B.; Farinha, F.; Gervásio, H.; et al. Portugal SB10 Sustainable Building Affordable to All. Low Cost Sustainable Solutions. 2010. Available online: https://repositorium.sdum.uminho.pt/handle/1822/22824 (accessed on 20 January 2021).
- Marques, C.; de Brito, J.; Silva, A. Application of the Factor Method to the Service Life Prediction of Etics. Int. J. Strateg. Prop. Manag. 2018, 22, 204–222. [Google Scholar] [CrossRef]
- Mandilaras, I.; Atsonios, I.; Zannis, G.; Founti, M. Thermal performance of a building envelope incorporating ETICS with vacuum insulation panels and EPS. Energy Build. 2014, 85, 654–665. [Google Scholar] [CrossRef]
- Saaty, T.L. Multicriteria Decision Making—The Analytic Hierarchy Process. Planning, Priority Setting, Resource Allocation; RWS Publishing: Pittsburgh, PA, USA, 1988. [Google Scholar]
- Ching-Lai, H.; Kwangsun, Y. Multiple Attribute Decision Making; Springer: New York, NY, USA, 1981. [Google Scholar]
- Saaty, T.L. Deriving the AHP 1-9 scale from first principles. In Proceedings of the ISAHP 2001, Berne, Switzerland, 2–4 August 2001. [Google Scholar]
- Saaty, T.L. Scaling Method for Priorities in Hierarchy Structures. J. Math. Psychol. 1977, 15, 234–281. [Google Scholar] [CrossRef]
- UNI EN ISO 6946:2018. Componenti ed Elementi per Edilizia—Resistenza Termica e Trasmittanza Termica—Metodi di Calcolo. Available online: http://store.uni.com/catalogo/uni-en-iso-6946-2018 (accessed on 18 January 2021).
- UNI EN ISO 13786:2008. Prestazione Termica dei Componenti per Edilizia—Caratteristiche Termiche Dinamiche—Metodi di Calcolo. Available online: http://store.uni.com/catalogo/uni-en-iso-13786-2008 (accessed on 18 January 2021).
- Ministero dell’Ambiente e Della Tutela del Territorio e del Mare (MATTM). 2017 Criteri Ambientali Minimi per L’affidamento di Servizi di Progettazione e Lavori per la Nuova Costruzione, Ristrutturazione e Manutenzione di Edifici Pubblici. Available online: https://www.anit.it/wp-content/uploads/2017/11/DM-11-ottobre-2017.pdf (accessed on 18 January 2021).
- UNI/PdR 13.1:2019. Sostenibilità Ambientale Nelle Costruzioni—Strumenti Operativi per la Valutazione Della Sostenibilità—Edifici Residenziali. Available online: http://store.uni.com/catalogo/uni-pdr-13-1-2019 (accessed on 18 January 2021).
- UNI EN 15804:2014. Sostenibilità delle Costruzioni—Dichiarazioni Ambientali di Prodotto—Regole Quadro di Sviluppo per Categoria di Prodotto. Available online: http://store.uni.com/catalogo/uni-en-15804-2014 (accessed on 18 January 2021).
- UNI EN ISO 14025:2010. Etichette e Dichiarazioni Ambientali—Dichiarazioni Ambientali di Tipo III—Principi e Procedure. Available online: http://store.uni.com/catalogo/uni-en-iso-14025-2010 (accessed on 18 January 2021).
- UNI EN ISO 14021:2016. Etichette e Dichiarazioni Ambientali—Asserzioni Ambientali auto-Dichiarate (Etichettatura Ambientale di Tipo II). Available online: http://store.uni.com/catalogo/uni-en-iso-14021-2016 (accessed on 18 January 2021).
- ICE Database, Inventory of Carbon and Energy Database. Available online: https://circularecology.com/ (accessed on 18 January 2021).
- UNI 10349-1:2016. Riscaldamento e Raffrescamento Degli Edifici—Dati Climatici—Parte 1: Medie Mensili per la Valutazione Della Prestazione Termo-Energetica Dell’edificio e Metodi per Ripartire L’irradianza Solare Nella Frazione Diretta e Diffusa e per Calcolare L’irradianza Solare su di una Superficie Inclinata. Available online: http://store.uni.com/catalogo/uni-10349-1-2016 (accessed on 18 January 2021).
- Di Perna, C.; Stazi, F.; Casalena, A.U.; Stazi, A. Massa e comfort: Necessità di una adeguata capacità termica areica interna periodica. Costr. Laterizio 2008, 126, 52–59. [Google Scholar]
- UNI EN ISO 717-1:2013. Acustica—Valutazione Dell’isolamento Acustico in Edifici e di Elementi di Edificio—Parte 1: Isolamento Acustico per via Aerea. Available online: http://store.uni.com/catalogo/uni-en-iso-717-1-2013 (accessed on 18 January 2021).
- Gazzetta Ufficiale Della Repubblica Italiana. D.P.C.M. 5 dicembre 1997—Determinazione dei Requisiti Acustici Passivi Degli Edifici.1997. Available online: https://www.gazzettaufficiale.it/eli/gu/1997/12/22/297/sg/pdf (accessed on 28 November 2020).
- Corrado, V.; Ballarini, I.; Corgnati, S.P. (a cura di). Building Typology Brochure. 2014. Available online: https://episcope.eu/fileadmin/tabula/public/docs/brochure/IT_TABULA_TypologyBrochure_POLITO.pdf (accessed on 18 January 2021).
- EPISCOPE. Monitor Progress towards Climate Targets in European Housing Stocks. Available online: https://episcope.eu/welcome/ (accessed on 28 November 2020).
- LEGGE 30 marzo 1976, n. 373 Norme per il Contenimento del Consumo Energetico per usi Termici Negli Edifici. (GU Serie Generale n.148 del 07-06-1976). Available online: https://www.gazzettaufficiale.it/eli/id/1976/06/07/076U0373/sg (accessed on 20 January 2021).
- LEGGE 9 gennaio 1991, n. 10 Norme per L’attuazione del Piano Energetico Nazionale in Materia di uso Razionale Dell’energia, di Risparmio Energetico e di Sviluppo delle Fonti Rinnovabili di Energia. (GU Serie Generale n.13 del 16-01-1991—Suppl. Ordinario n. 6). Available online: https://www.gazzettaufficiale.it/eli/id/1991/01/16/091G0015/sg (accessed on 20 January 2021).
- DECRETO DEL PRESIDENTE DELLA REPUBBLICA 26 agosto 1993, n. 412 Regolamento Recante Norme per la Progettazione, L’installazione, L’esercizio e la Manutenzione Degli Impianti Termici Degli Edifici ai fini del Contenimento dei Consumi di Energia, in Attuazione dell’art. 4, comma 4, Della Legge 9 Gennaio 1991, n. 10. (GU Serie Generale n.242 del 14-10-1993—Suppl. Ordinario n. 96). Available online: https://www.gazzettaufficiale.it/eli/id/1993/10/14/093G0451/sg (accessed on 20 January 2021).


| n | 1 | 2 | 3 | 4 | 5 | 6 | 7 | 8 | 9 |
|---|---|---|---|---|---|---|---|---|---|
| RCI | 0 | 0 | 0.58 | 0.90 | 1.12 | 1.24 | 1.32 | 1.41 | 1.45 |
| Maintenance Type | Intervention | Time |
|---|---|---|
| Ordinary maintenance (M) | Surface cleaning | 3 years |
| Application of finishes in the case of microcracks | 4 years | |
| Repair of minor defects | 7 years | |
| Partial repainting Resurfacing (finishing layers) Restoration of worn parts | ||
| Restoration or total renovation of paintwork | 10 years | |
| Extraordinary maintenance (Repl) | Partial replacement (70%) ETICS | 25 years |
| n | Criterion | Relative Weight | Subcriterion | Relative Weight | Indicator | |
|---|---|---|---|---|---|---|
| C1 | Energy Performance | 0.25 | C1.1 | Heat transfer in steady state | 0.5 | U (W/(m2K)) |
| C1.2 | Heat transmission in dynamic state | 0.5 | Yie (W/(m2K)) | |||
| C2 | Environmental Sustainability | 0.25 | C2.1 | Recycled/recovered materials | 0.33 | Irec (%) |
| C2.2 | Embodied carbon | 0.33 | EC (kg CO2eq) | |||
| C2.3 | Disassembled materials | 0.33 | Idis (%) | |||
| C3 | Indoor Comfort | 0.25 | C3.1 | Internal Surface Temperature | 0.33 | Tsup,int (°C) |
| C3.2 | Periodic Areic Heat Capacity | 0.33 | Cip (kJ/(m2K)) | |||
| C3.3 | Apparent soundproofing power | 0.33 | R’w (dB) | |||
| C4 | Economic Sustainability | 0.25 | C4.1 (An) | Simplified life cycle cost | 1 | LCC = I0 + M+ Repl (€) |
| Interventions/Criteria | C1 | C2 | C3 | C4 | … | Cm |
|---|---|---|---|---|---|---|
| A1 | C1 (A1) | C2 (A1) | C3 (A1) | C4 (A1) | … | Cm (A1) |
| A2 | C1 (A2) | C2 (A2) | C3 (A2) | C4 (A2) | … | Cm (A2) |
| A3 | C1 (A3) | C2 (A3) | C3 (A3) | C4 (A3) | … | Cm (A3) |
| … | … | … | … | … | … | … |
| An | C1 (An) | C2 (An) | C3 (An) | C4 (An) | … | Cm (An) |
| ETICS | Criteria | ||||||||
|---|---|---|---|---|---|---|---|---|---|
| Energy Performance | Environmental Sustainability | Indoor Comfort | Economic Sustainability | ||||||
| U | YIE | Irec | EC | Idis | Tsup,int | Cip | R’w | LCC | |
| RW | 0.269 | 0.027 | 37.00 | 0.06 | 13.209 | 19.126 | 48.98 | 47.10 | 312.47 |
| EPS | 0.278 | 0.029 | 10.00 | 2.77 | 4.366 | 19.097 | 49.02 | 46.89 | 310.24 |
| EPS + G | 0.274 | 0.028 | 10.00 | 14.11 | 4.366 | 19.110 | 49.01 | 46.89 | 302.78 |
| XPS | 0.273 | 0.028 | 5.00 | 0.48 | 7.507 | 19.113 | 49.00 | 46.93 | 302.78 |
| PUR | 0.267 | 0.027 | 2.57 | 0.43 | 4.250 | 19.132 | 49.00 | 46.89 | 337.77 |
| WF | 0.271 | 0.021 | 98.00 | −13.85 | 31.820 | 19.119 | 48.75 | 48.00 | 329.52 |
| CK | 0.267 | 0.025 | 99.00 | −13.86 | 16.340 | 19.132 | 48.90 | 47.29 | 429.24 |
| AG | 0.253 | 0.024 | 60.00 | 0.37 | 10.245 | 19.178 | 48.94 | 47.07 | 958.41 |
| VIPs | 0.225 | 0.020 | 10.00 | 0.42 | 4.828 | 19.269 | 48.90 | 46.90 | 473.28 |
| CSH | 0.268 | 0.026 | 17.00 | 7.87 | 18.920 | 19.129 | 48.95 | 47.39 | 348.99 |
| ETICS | Criterion | ||||||||
|---|---|---|---|---|---|---|---|---|---|
| Energy | Environment | Comfort | Economic Sustainability | ||||||
| U | YIE | Irec | EC | Idis | Tsup,int | Cip | R’w | LCC | |
| RW | 0.836 | 0.741 | 0.374 | 0.167 | 0.415 | 0.993 | 0.999 | 0.981 | 0.969 |
| EPS | 0.809 | 0.690 | 0.101 | 0.004 | 0.137 | 0.991 | 1.000 | 0.977 | 0.976 |
| EPS + G | 0.821 | 0.714 | 0.101 | 0.001 | 0.137 | 0.992 | 1.000 | 0.977 | 1.000 |
| XPS | 0.824 | 0.714 | 0.051 | 0.021 | 0.236 | 0.992 | 1.000 | 0.978 | 1.000 |
| PUR | 0.843 | 0.741 | 0.026 | 0.023 | 0.134 | 0.993 | 1.000 | 0.977 | 0.896 |
| WF | 0.830 | 0.952 | 0.990 | 1.000 | 1.000 | 0.992 | 0.994 | 1.000 | 0.919 |
| CK | 0.843 | 0.800 | 1.000 | 1.000 | 0.513 | 0.993 | 0.998 | 0.985 | 0.705 |
| AG | 0.889 | 0.833 | 0.606 | 0.027 | 0.322 | 0.995 | 0.998 | 0.981 | 0.316 |
| VIPs | 1.000 | 1.000 | 0.101 | 0.024 | 0.152 | 1.000 | 0.998 | 0.977 | 0.640 |
| CSH | 0.840 | 0.769 | 0.172 | 0.001 | 0.595 | 0.993 | 0.999 | 0.987 | 0.868 |
Publisher’s Note: MDPI stays neutral with regard to jurisdictional claims in published maps and institutional affiliations. |
© 2021 by the authors. Licensee MDPI, Basel, Switzerland. This article is an open access article distributed under the terms and conditions of the Creative Commons Attribution (CC BY) license (https://creativecommons.org/licenses/by/4.0/).
Share and Cite
Fiore, P.; Donnarumma, G.; Falce, C. A Tool for the Evaluation of Energy-Environmental Retrofit Interventions on Opaque Walls Using ETICS. Sustainability 2021, 13, 4063. https://doi.org/10.3390/su13074063
Fiore P, Donnarumma G, Falce C. A Tool for the Evaluation of Energy-Environmental Retrofit Interventions on Opaque Walls Using ETICS. Sustainability. 2021; 13(7):4063. https://doi.org/10.3390/su13074063
Chicago/Turabian StyleFiore, Pierfrancesco, Giuseppe Donnarumma, and Carmelo Falce. 2021. "A Tool for the Evaluation of Energy-Environmental Retrofit Interventions on Opaque Walls Using ETICS" Sustainability 13, no. 7: 4063. https://doi.org/10.3390/su13074063
APA StyleFiore, P., Donnarumma, G., & Falce, C. (2021). A Tool for the Evaluation of Energy-Environmental Retrofit Interventions on Opaque Walls Using ETICS. Sustainability, 13(7), 4063. https://doi.org/10.3390/su13074063