Next Article in Journal
Economic Assessment of L-Shaped Minilouvers for Reducing Cooling Energy and Improving Daylight Condition in Offices: A Simulation Study in Jakarta
Next Article in Special Issue
Local Response to the COVID-19 Pandemic: The Case of Indonesia
Previous Article in Journal
Exploring Characteristics of Sustainability Stimulus Patterns of Project Managers
Previous Article in Special Issue
Impact of the COVID-19 Pandemic on Farm Households’ Vulnerability to Multidimensional Poverty in Rural China
 
 
sustainability-logo
Article Menu

Article Menu

Article

Predictors of Anxiety in the COVID-19 Pandemic from a Global Perspective: Data from 23 Countries

by
Valentina N. Burkova
1,2,*,
Marina L. Butovskaya
1,2,
Ashley K. Randall
3,
Julija N. Fedenok
1,
Khodabakhsh Ahmadi
4,
Ahmad M. Alghraibeh
5,
Fathil Bakir Mutsher Allami
6,
Fadime Suata Alpaslan
7,
Mohammad Ahmad Abdelaziz Al-Zu’bi
8,
Derya Fatma Biçer
9,
Hakan Cetinkaya
10,
Oana Alexandra David
11,
Silvia Donato
12,
Seda Dural
13,
Paige Erickson
14,
Alexey M. Ermakov
15,
Berna Ertuğrul
7,
Emmanuel Abiodun Fayankinnu
16,
Maryanne L. Fisher
17,
Lauren Hocker
3,
Ivana Hromatko
18,
Elena Kasparova
19,
Alexander Kavina
20,
Yahya M. Khatatbeh
21,
Hareesol Khun-Inkeeree
22,
Kai M. Kline
3,
Fırat Koç
23,
Vladimir Kolodkin
24,
Melanie MacEacheron
25,
Irma Rachmawati Maruf
26,
Norbert Meskó
27,
Ruzan Mkrtchyan
28,
Poppy Setiawati Nurisnaeny
29,
Oluyinka Ojedokun
30,
Damilola Adebayo
30,
Mohd S. B. Omar-Fauzee
31,
Barış Özener
7,
Edna Lúcia Tinoco Ponciano
32,33,
Muhammad Rizwan
34,
Agnieszka Sabiniewicz
35,
Victoriya I. Spodina
36,
Stanislava Stoyanova
37,
Nachiketa Tripathi
38,
Satwik Upadhyay
38,
Carol Weisfeld
14,
Mohd Faiz Mohd Yaakob
39,
Mat Rahimi Yusof
39 and
Raushaniia I. Zinurova
40
add Show full author list remove Hide full author list
1
Center of Cross-Cultural Psychology and Human Ethology, Institute of Ethnology and Anthropology, Russian Academy of Sciences, 119991 Moscow, Russia
2
International Center of Anthropology, National Research University Higher School of Economics, 101000 Moscow, Russia
3
Counseling and Counseling Psychology, Arizona State University, Tempe, AZ 85281, USA
4
Behavioral Sciences Research Center, Baqiyatallah University of Medical Sciences, Tehran 19395-5478, Iran
5
Department of Psychology, King Saud University, Riyadh 2458, Saudi Arabia
6
Physical Education and Sport Sciences, University of Misan, Amarah, Maysan 62001, Iraq
7
Department of Anthropology, İstanbul University, İstanbul 34452, Turkey
8
Department of Early Childhood, Faculty of Educational Sciences, Zarqa University, Zarqa City 5468, Jordan
9
Department of Business Administration, Sivas Cumhuriyet University, Sivas 58140, Turkey
10
Department of Psychology, Ankara University, Ankara 06100, Turkey
11
Department of Clinical Psychology and Psychotherapy, Babes-Bolyai University Cluj-Napoca, Cluj-Napoca 400015, Romania
12
Department of Psychology, Università Cattolica del Sacro Cuore, Milan 20123, Italy
13
Department of Psychology, Izmir University of Economics, İzmir 35330, Turkey
14
Department of Psychology, University of Detroit Mercy, Detroit, MI 48221-3038, USA
15
Faculty of Bioengineering and Veterinary Medicine, Don State Technical University, 344000 Rostov-on-Don, Russia
16
Department of Sociology, Adekunle Ajasin University, Akungba Akoko 001, Nigeria
17
Department of Psychology, Saint Mary’s University, Halifax, NS B3H 3C3, Canada
18
Department of Psychology, Faculty of Humanities and Social Sciences, 10000 Zagreb, Croatia
19
Department of Pedagogy and Problems of Education Development, Belarusian State University, 220030 Minsk, Belarus
20
Department of History, St John’s University of Tanzania, Dodoma 47, Tanzania
21
Department of Psychology, Imam Muhammad Bin Saud Islamic University, Riyadh 5701, Saudi Arabia
22
School of Languages and General Education, Walailak University, Thasala District, Nakhon si Thammarat 80160, Thailand
23
Department of Anthropology, Hitit University, Çorum 19030, Turkey
24
Faculty of Media Communications and Multimediatechnology, Don State Technical University, 344000 Rostov-on-Don, Russia
25
School of Social & Behavioral Sciences, Arizona State University, Tempe, AZ 85281, USA
26
Post Graduate Notary Law Program, Pasundan University, Bandung West Java 40113, Indonesia
27
Department for General and Evolutionary Psychology, Institute of Psychology, University of Pécs, 7624 Pécs, Hungary
28
Faculty of History, Department of Cultural Studies, Yerevan State University, 0025 Yerevan, Armenia
29
State Intelligence College, Bogor 16001, Indonesia
30
Department of Pure & Applied Psychology, Adekunle Ajasin University, Akungba-Akoko 01, Nigeria
31
School of Education, Universiti Utara Malaysia, UUM Sintok, Kedah 06010, Malaysia
32
Institute of Psychology and Center of Social Studies, University of the State of Rio de Janeiro, Rio de Janeiro 20943-000, Brazil
33
Institute of Psychology and Center of Social Studies, University of Coimbra, 3004 Coimbra, Portugal
34
Department of Psychology, University of Haripur, Khyber Pakhtunkhwa 22620, Pakistan
35
Department of Otorhinolaryngology, Smell and Taste Clinic TU Dresden, 01069 Dresden, Germany
36
Department of History and Ethnology, Ob-Ugric Institute of Applied Researches and Development, 628011 Khanty-Mansiysk, Russia
37
Department of Psychology, South-West University “Neofit Rilski”, 2700 Blagoevgrad, Bulgaria
38
Department of Humanities & Social Sciences, Indian Institute of Technology Guwahati, Guwahati, Assam 781 039, India
39
School of Education and Modern Languages, University Utara Malaysia, Sintok, Kedah 06010, Malaysia
40
Institute of Innovation Management, Kazan National Research Technological University, 420015 Kazan, Russia
*
Author to whom correspondence should be addressed.
Sustainability 2021, 13(7), 4017; https://doi.org/10.3390/su13074017
Submission received: 15 February 2021 / Revised: 28 March 2021 / Accepted: 30 March 2021 / Published: 4 April 2021
(This article belongs to the Special Issue Evolutionary Perspectives on Human Behavior in Pandemics)

Abstract

:
Prior and ongoing COVID-19 pandemic restrictions have resulted in substantial changes to everyday life. The pandemic and measures of its control affect mental health negatively. Self-reported data from 15,375 participants from 23 countries were collected from May to August 2020 during the early phases of the COVID-19 pandemic. Two questionnaires measuring anxiety level were used in this study—the Generalized Anxiety Disorder Scale (GAD-7), and the State Anxiety Inventory (SAI). The associations between a set of social indicators on anxiety during COVID-19 (e.g., sex, age, country, live alone) were tested as well. Self-reported anxiety during the first wave of the COVID-19 pandemic varied across countries, with the maximum levels reported for Brazil, Canada, Italy, Iraq and the USA. Sex differences of anxiety levels during COVID-19 were also examined, and results showed women reported higher levels of anxiety compared to men. Overall, our results demonstrated that the self-reported symptoms of anxiety were higher compared to those reported in general before pandemic. We conclude that such cultural dimensions as individualism/collectivism, power distance and looseness/tightness may function as protective adaptive mechanisms against the development of anxiety disorders in a pandemic situation.

1. Introduction

COVID-19 (SARS-CoV-2) was officially declared a global pandemic on 11 March 2020 by the World Health Organization [1]. Following this declaration, countries around the world started to implement public policy to reduce the spread of the virus, such as implementing social distance guidelines and restricting large gatherings. During the first wave of the COVID-19 outbreak, countries introduced various restrictions. Some countries instituted lockdowns and banned all nonessential travel (for example, regions of Canada, Iran, Italy, some states of the USA); others announced partial quarantine and restrictions of varying degrees (Russia, Brazil, Turkey), and some countries limited themselves to advisory measures (Belarus).
COVID-19’s impacts can be observed at both the individual and community level. Prior and ongoing COVID-19 restrictions are taking a toll on people’s modern lifestyle. Recently published data from 2020 based on sample of adult from different countries revealed that social isolation, and resulting loneliness, are associated with both poorer mental and physical health [2,3]. There is evidence that the pandemic, and measures to control it, have negative associations with mental health and important psychosocial and economic consequences [2,4,5,6,7] that are affecting children and adults [8,9,10,11]. Regarding the contribution of age to stress levels, the data generally indicate that older people are less stressed and less affected by the psychological effects of isolation, whereas being younger predicted higher distress scores [2,3,4]. Additionally, a review of studies across 10 countries that experienced SARS, Ebola, the H1N1 influenza pandemic, MERS and equine influenza, reported negative psychological effects of quarantine and demonstrated that the psychological impact of quarantine is wide-ranging, substantial, and can be long-lasting [2]. Indeed, prior research on the impact of epidemics, such as SARS, MERS and Ebola, have demonstrated a significant association with symptoms of anxiety due to health threats and people’s desire to protect themselves and their loved ones against contagion [2,12,13,14,15,16,17].
Furthermore, the likelihood of contracting COVID-19 can increase anxiety [18]. Considering that the COVID-19 pandemic has been ongoing, it is obvious that we are facing consequences such as long-term stress, threats to the immune system and increasing susceptibility to viral infections [19]. The increase in anxiety has resulted in an increase of both physical and psychological symptoms, such as feeling nervous, fearful, tense palpitations, hyperventilation and rapid breathing [20,21]. Outside of a global pandemic, women tend to report greater anxiety and stress compared to men [2,22,23,24,25], and recent studies on stress levels during a pandemic indicate the same trend [3,7,26,27].
Beyond the individual level, there are community-level factors to consider when examining the associations between COVID-19 and associated outcomes, such as presence (or absence) of other people during the pandemic, intimate relationships and number of children. Participants who rated high in loneliness showed high rates of hostility, depression, insomnia and anxiety before COVID-19 [3,28,29,30]. For example, a meta-analysis on the harmful effect of loneliness before the pandemic concluded that loneliness is a risk factor for all-cause mortality [31]. However, high-density environments, such as crowding in residential and laboratory settings and household crowding, can also be stressful [32,33], results similar to those in a recent examination on spatial activity in the COVID-19 pandemic [16]. Recent research by Kowal and colleagues (2020) suggested that the association between stress and whom people are living with during isolation is somewhat U-shaped, meaning those who live alone, and those who are overcrowded, experience the highest levels of stress [3].
Culture (e.g., social norms and moral institutions, social distancing rules and social network structure) may be an important factor affecting stress levels during the pandemic. Members of the same culture are socialized to use their culturally specific values to guide their daily survival processes, and there are significant cross-cultural differences in how people assess stressors, choose coping strategies and indicators of adaptive outcomes. Recent research has been published on the effects of COVID-19 on well-being, broadly defined, using cross-cultural samples. For instance, Limcaoco and colleagues (2020) gathered data across 41 countries from 17 March to 1 April 2020, wherein it was demonstrated that the level of anxiety increased [26]. However, a notable limitation of this study was the lack of examination between and within country differences. In another paper, Kowal and colleagues (2020) collected data from 26 countries to examine associations between COVID-19 and stress. Results from this study showed higher levels of stress were associated with younger age, being a single woman, lower level of education, staying with more children, and living in a country that has been severely impacted by COVID-19 [3]. In particular, those from Croatia, Japan, Poland and Turkey reported the highest levels of perceived stress. However, further details on cultural differences were not reported. Lastly, Mækelæ and colleagues (2020) assessed how effective a range of restrictions were perceived, how severely they affected daily life, general distress and paranoia during the early phase of the outbreak in Brazil, Colombia, Germany, Israel, Norway and the USA [4]. These authors found a large effect of the country of residency on perceived efficacy of specific restrictions, and that participants from Brazil, Colombia and the USA reported the highest level of distress, whereas people from Israel, Norway and Germany had comparatively lower levels of distress [4]. Again, this study did not explicitly focus on cultural differences, which leaves a dearth of understanding in how culture influences perceptions of the pandemic. Culture is a useful aspect to understand the variations of coping strategies and their effects [34,35].
Many of these studies have raised questions about the impact of cultural dimensions on the course of a pandemic. One of the main focuses of research in this area is the individualism–collectivism dimension [36,37]. Collectivistic vs. individualistic societies put more emphasis on group interest over personal interests and enjoyment [38]. People from collective cultures focus on caring for others, alleviating the negative psychological effects of restrictions and lockdown. Stress levels are expected to be higher for individualistic versus collectivist cultures [3].
The dimension of cultural tightness-looseness refers to the strength of cultural norms [39]. A tight culture (e.g., Pakistan, Singapore, South Korea and China) allows little room for individual liberty and poses high censuring pressure, whereas a loose culture provides members more room for discretion [39]. In tight societies, state authorities tend to make strict behavioral guidance for the public (e.g., social distancing, wearing masks, tracking individual health conditions) and closely monitor and punish deviance [40].
These two constructions (collectivism–individualism and tightness–looseness) are related but clearly differentiated constructs, although collectivism and tightness covary moderately [38,39,41]. In the study of Kowal and colleagues (2020) there was no differences in perceived stress levels between countries with varying levels of individualism, but it stated “that people from collectivistic cultures may feel more stressed over their financial burdens than people from individualistic cultures, whereas people from individualistic cultures may treat the current situation as a threat to their need for self-expression and freedom” [3]. Cao and colleagues (2020) showed that neither the Individualism Scale nor the Tightness Index is sufficient to account for differences between countries in COVID-19 containment results [42].
In the process of evolution, humankind has been exposed to various environmental stressors and high pathogen pressure, and pandemics were among them. The ongoing COVID-19 pandemic poses a real threat to humans and demonstrates the current relevance of cultural factors. The fear of any natural threats, according to evolutionary behavioral sciences, is an adaptive defense mechanism, which is necessary for survival [43,44,45]. Experience from previous epidemics shows that the severity of stress depends on the duration and degree of quarantine, feelings of loneliness, fear of infection, (in)adequate information and stigma [2,45,46]. Hence, it is highly probable that anxiety responses to the threat of COVID-19 may change what has been considered normal for everyday functioning, but individuals will likely vary in their reported responses. It is highly probable to observe some visible changes in human behavior as a consequence of the current pandemic [47].
The goal of the present study was to examine possible factors that may be associated with self-reported levels of anxiety during the first wave of the COVID-19 pandemic (from May to August 2020). We hypothesized that spread of the pandemic, isolation measures, and restrictions would result in increased depression symptoms and would worsen the psychological well-being of people world-wide during COVID-19 first wave lockdown. We also hypothesized that cultural dimensions, such as individualism/collectivism, power distance, tightness/looseness, and previous familiarity with infections would affect the level of anxiety in society.

2. Methodology of the Study

2.1. Ethics Statement

The study was conducted according to the principles expressed in the Declaration of Helsinki. The Scientific Council of the Institute of Ethnology and Anthropology of the Russian Academy of Sciences (protocol No 01, dated 9 April 2020) approved the protocols used to recruit participants and to collect data before conducting this study. All participants provided informed consent via a Google form before completing the survey.

2.2. Participants

Self-reported data from 15,375 participants were collected from May to August 2020 (see Table 1 for details of sample). The sample comprised of people from 23 countries (seven from Europe: Belarus, Bulgaria, Croatia, Hungary, Italy, Romania, Russia; 11 from West, South and Southeast Asian: Armenia, India, Indonesia, Iran, Iraq, Jordan, Malaysia, Pakistan, Saudi Arabia, Thailand, Turkey; two African: Nigeria and Tanzania; and three from North, South, and Central America: Brazil, Canada, USA).
The mean age of total sample was 29 years old and mean scores of ages in each country are described in Table 1. The minimal age of respondents was 18-years-old, and the maximum, 89 years old.

2.3. Procedure

All coauthors collected data in their home countries for this study. The questionnaire was generated on the Google Forms service hosted by the principal investigator. The original questionnaire was developed in Russian and English. In all nonEnglish speaking countries (except Russia), colleagues translated the measures into their native languages using a back-translation procedure [48,49].
Participants in each country were recruited from various university listservs and social networking sites. We had one exclusion criteria—participants who responded yes to having a chronic disease and/or predisposition for depression and received treatment were excluded. All participants provided informed consent. If eligible, participants were directed to complete the self-report survey on Google forms to provide informed consent, and were asked to take a survey, described below, which took approximately 20 min to complete. Participants were not compensated for their participation.
The survey was conducted during the first wave of COVID-19 from May to August 2020 (Median 5 June 2020) (see Table 2). We measured the degree of restrictions by asking participants the following yes/no question: Is a self-isolation (quarantine) regime introduced in your country? (yes, no).

2.4. Instruments

Participants completed a standard demographic survey along with the measures listed below. We also asked the following question “Do you live alone or with somebody?” with answers 0 = no, with somebody, 1 = yes, alone.

2.4.1. Measure of Anxiety

Two questionnaires for measurement of anxiety level were used in this study, the Generalized Anxiety Disorder Scale (GAD-7) [50] and the first part of The State-Trait Anxiety Inventory (STAI)—State Anxiety Inventory (SAI) [51]. We chose two scales of anxiety, as each targets different aspects of this phenomenon. GAD-7 screens for the presence of anxiety and related disorders, while SAI evaluates anxiety as a reaction to stress (in our case reaction to COVID-19). Validated measures of the GAD-7 and SAI were used when available [50,51,52,53,54,55,56,57,58,59,60,61].

Generalized Anxiety Disorder Scale (GAD-7)

Level of anxiety was measured using the seven-item Generalized Anxiety Disorder Scale (GAD-7) [50], a widely used instrument to screen for the presence of anxiety and related disorders [62]. The GAD-7 consists of seven items and asks participants to rate their symptoms of anxiety using a four-point Likert scale (0 (not at all) to 3 (almost every day) over the past two weeks). Total scores across the seven items were calculated, and anxiety symptoms classified as norm (0–4), mild (5–9), moderate (10–14) and severe (15–21) [50]. The alpha reliability coefficient in the present study for GAD-7 was 0.90.

State Trait Anxiety Inventory (STAI)

Anxiety as an emotional state was measured using the first part of questionnaire The State-Trait Anxiety Inventory (STAI)—State Anxiety Inventory (SAI) [51]. It was developed to provide reliable, relatively brief self-report scales for assessing state and trait anxiety in research and clinical practice [51]. SAI consists of a 20-item scale for measuring the intensity of anxiety as an emotional state. Participants reported the intensity of their feelings of anxiety in that moment by rating themselves on the following four-point Likert scale from 1 (not at all) to 4 (very much so). Total scores of anxiety symptoms were classified as norm/low (0–30), moderate (31–45) and high (46 and above) [51]. The alpha reliability coefficient in the present study for SAI was 0.77.

2.5. Global Indices

Individualism versus Collectivism. Global indices were examined in this study, as represented by the Hofstede model (the Individualism versus Collectivism scale, related to the integration of individuals into primary groups and the Power Distance scale, related to the different solutions to the basic problem of human inequality) [36]. Each country was positioned relative to other countries through a score on each dimension. Individualism stands for a society in which the ties between individuals are loose and everyone is expected to look after her/his immediate family only. Collectivism stands for a society in which people from birth onwards are integrated into strong, cohesive in-groups, which throughout people’s lifetime continue to protect them in exchange for unquestioning loyalty [36] (p. 225). Power Distance has been defined as the extent to which the less powerful members of organizations and institutions (like the family) accept and expect that power is distributed unequally. This represents inequality (more versus less), but defined from below, not from above. It suggests that a society’s level of inequality is endorsed by the followers as much as by the leaders [37] (p. 9). Information about this indicator in each country was obtained from https://www.hofstede-insights.com (accessed date 5 June 2020).
Tightness-looseness index. The Tightness-Looseness Index (Tightness score) was assessed if available for our study samples, with data acquired from the paper of Gelfand and coauthors [39]. This score demonstrates the differences between cultures that are tight (i.e., those that have strong norms and a low tolerance of deviant behavior) compared to those that are loose (i.e., those that have weak social norms and a high tolerance of deviant behavior) [39]. Due to the fact that not all the countries were represented in Gelfand’s work (i.e., Jordan, Indonesia, Iran, Iraq, Nigeria, Russia, Tanzania), we applied the Index of Cultural Tightness and Looseness (CTL) from the study of Uz as well [63].
Vulnerability to disease. We used the Infectious Disease Vulnerability Index (IDVI) as a country-level index of potential vulnerability to infectious disease outbreaks [64]. IDVI is a country-level index of vulnerability. This index was selected because it represents a robust measure of infectious disease vulnerability in four ways: a more comprehensive evidence base, a more robust set of factors potentially contributing to outbreak vulnerability and associated proxy measures, the use of adjustable weights for these parameters, and an examination of all countries world-wide. Information about this indicator in each country was obtained from https://www.rand.org/pubs/research_reports/RR1605.html.

2.6. Data Analysis

SPSS (Version 27.0) was employed for data evaluation. Data were evaluated for missingness, but we chose to retain all. An analysis of descriptive statistics was conducted to illustrate the demographic and selected characteristics of the respondents. T tests were conducted to examine potential sex differences in ratings on the GAD-7 and SAI scales. Linear regression was used to test the associations between the GAD-7, SAI scales and global indexes, denoted above. Lastly, a GLM ANOVA was used for analysis of the GAD-7 and SAI to estimate the association between sex and country on levels of anxiety.

3. Results

3.1. Sex and Country Differences of Anxiety Scales

Mean and standard deviations across countries are represented in Table 3. Country-specific sex differences revealed significant sex differences of GAD-7 for individuals from Belarus, Bulgaria, Canada, Croatia, India, Indonesia, Italy, Jordan, Malaysia, Nigeria, Pakistan, Romania, Russia, Tanzania, and Turkey. For the SAI, women from Belarus, Brazil, Bulgaria, Canada, Croatia, India, Indonesia, Italy, Jordan, Malaysia, Pakistan, Russia and Turkey reported higher ratings of anxiety across both scales. The Pearson’s correlation analysis, controlling for country and sex, revealed a strong positive correlation between the GAD-7 and SAI total scores (r = 0.49, p = 0.0001).
The results of GLM ANOVAs with GAD-7 as the dependent variable, sex and country as fixed factors and significant main effects of sex (F(1,15340) = 298.885, p < 0.001, η2 = 0.019) and country (F(22,15345) = 53.758, p < 0.001, η2 = 0.072), showed small and medium effect sizes accordingly. In the case of SAI as the dependent variable we found main effects of sex (F(1,15268) = 157.504, p < 0.001, η2 = 0.010) and country (F(22,15273) = 67.872, p< 0.001, η2 = 0.089), both with medium effect sizes.
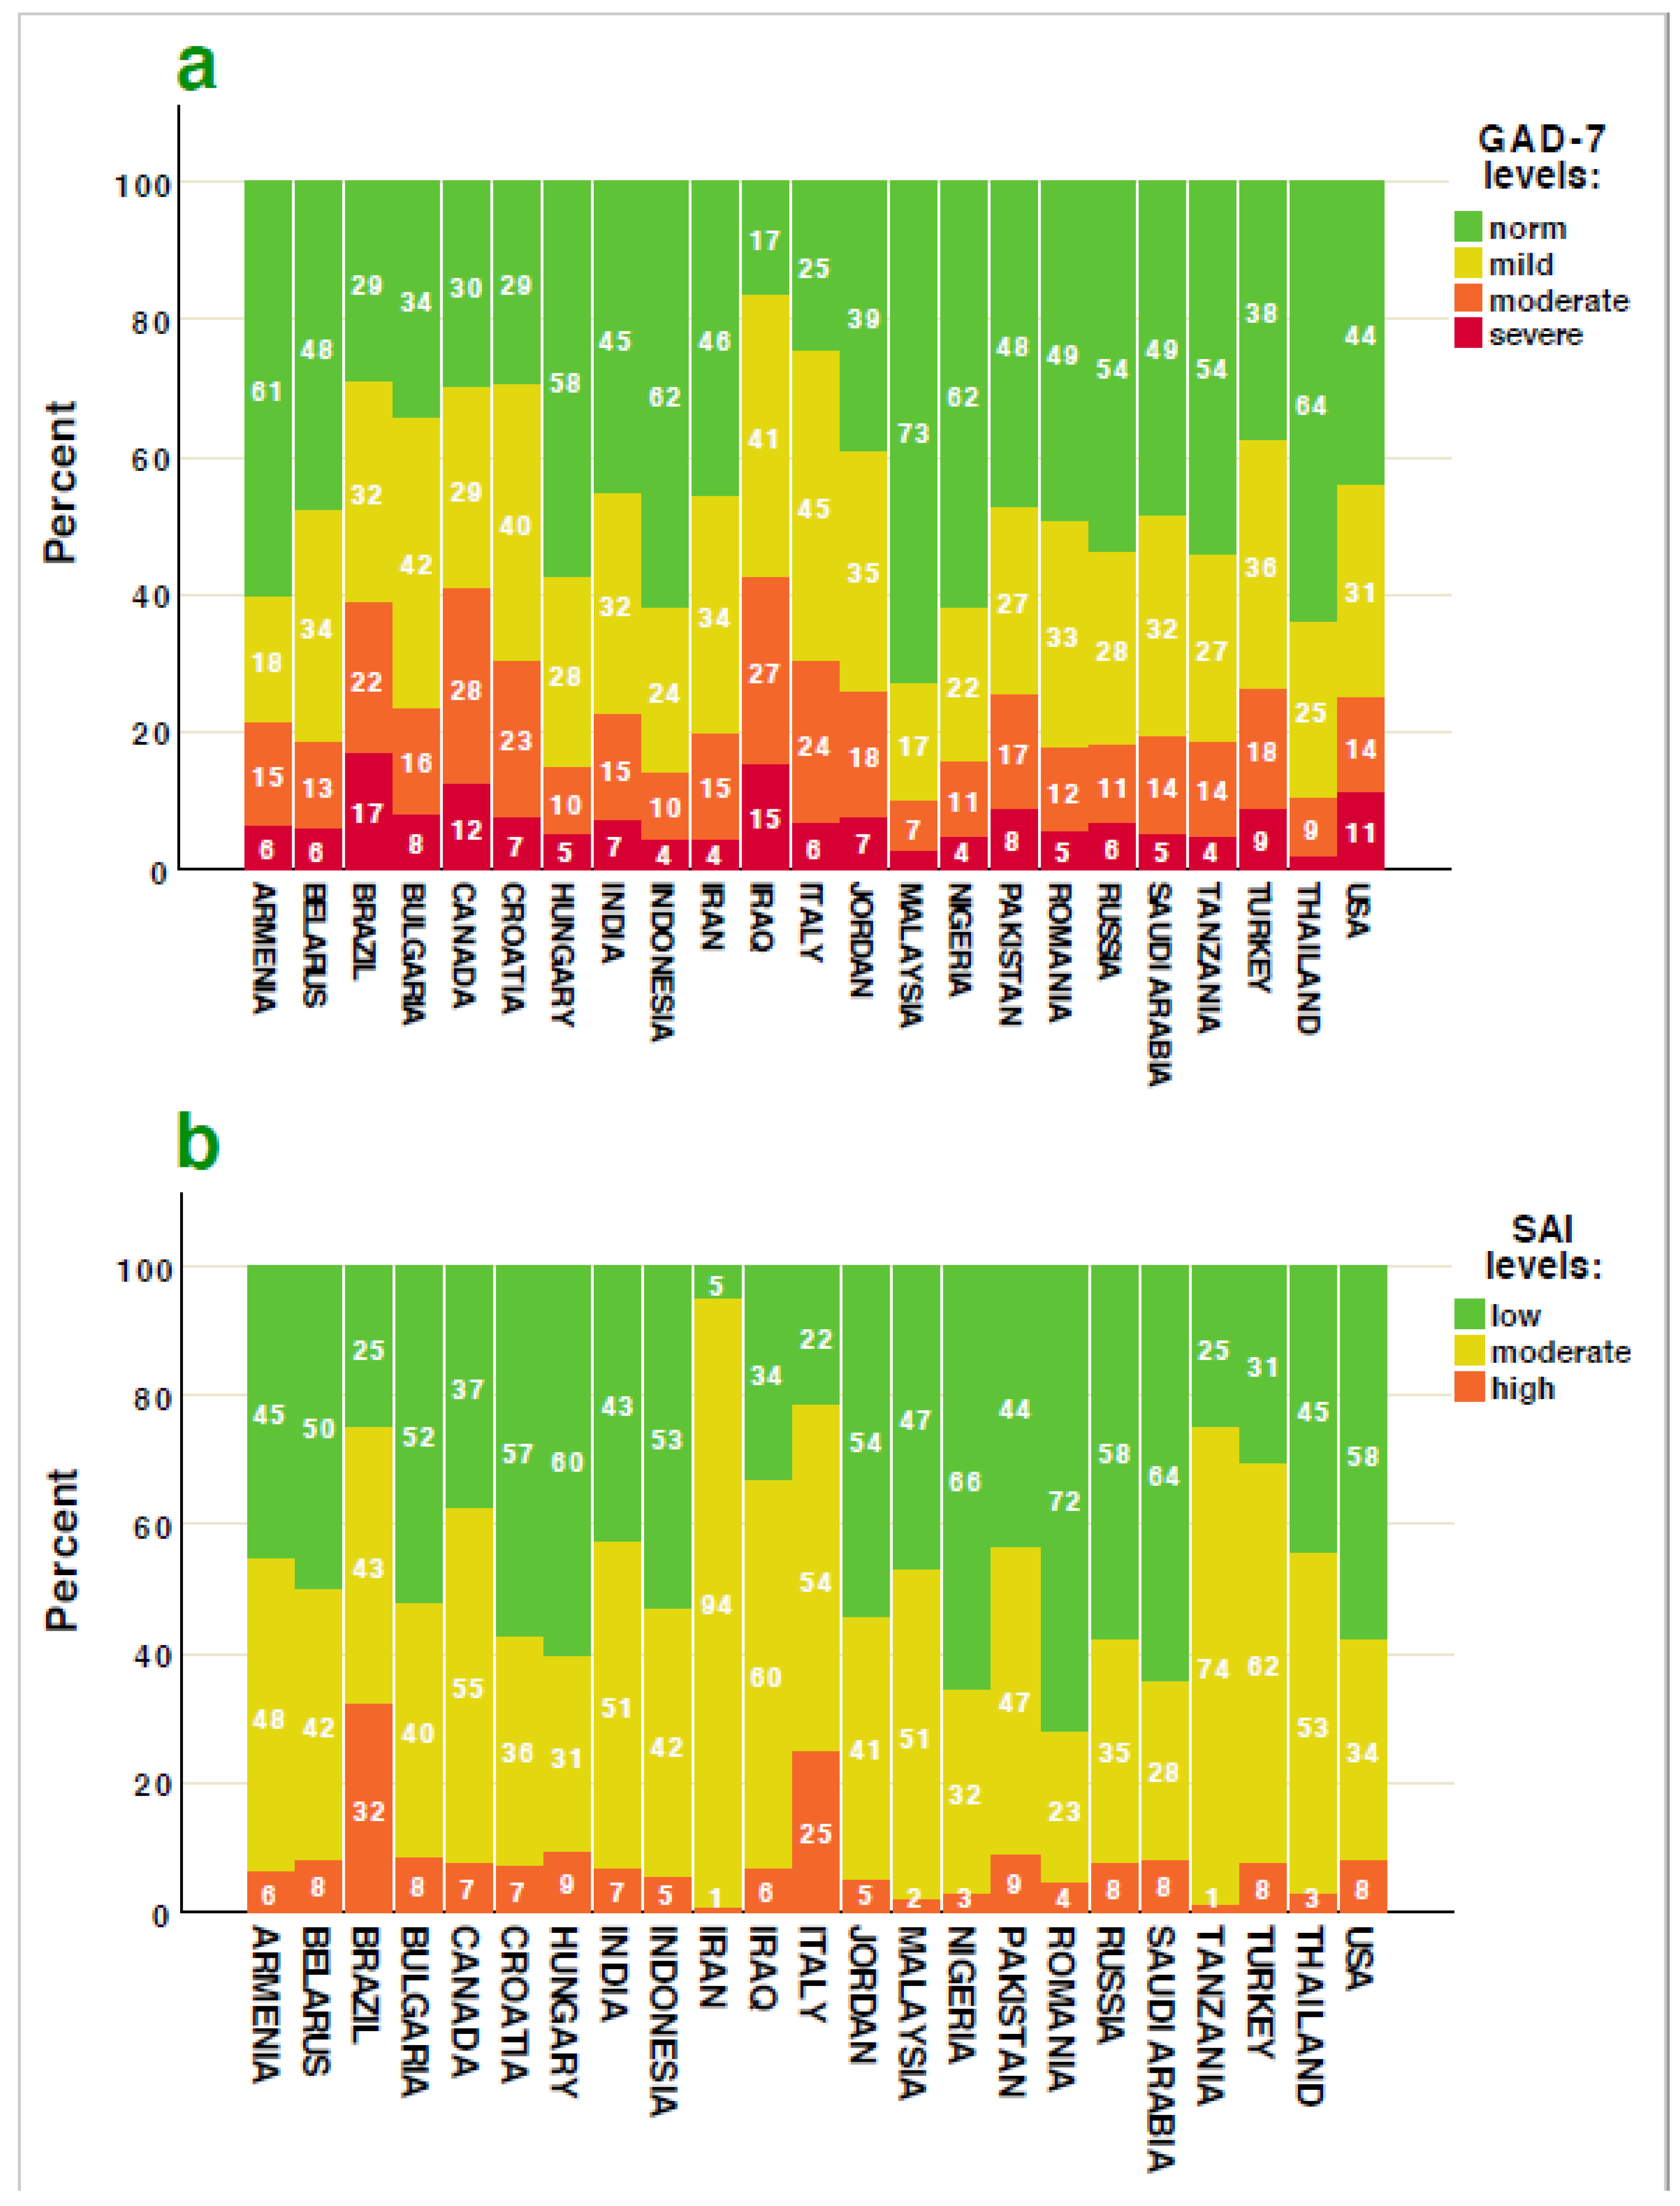
GAD-7. A total of 7045 participants (45.84%) across the entire sample reported minimal (norm) symptoms of anxiety; 4830 (31.43%) reported mild symptoms, 2366 (15.40%) reported moderate symptoms and 1127 (7.33%) reported severe symptoms (see Figure 1a).
SAI. A total of 6589 participants (43.08%) across the entire sample reported a low level of anxiety, 7560 (49.42%) respondents reported moderate values, and 1147 (7.50%) respondents reported high values (see Figure 1b).
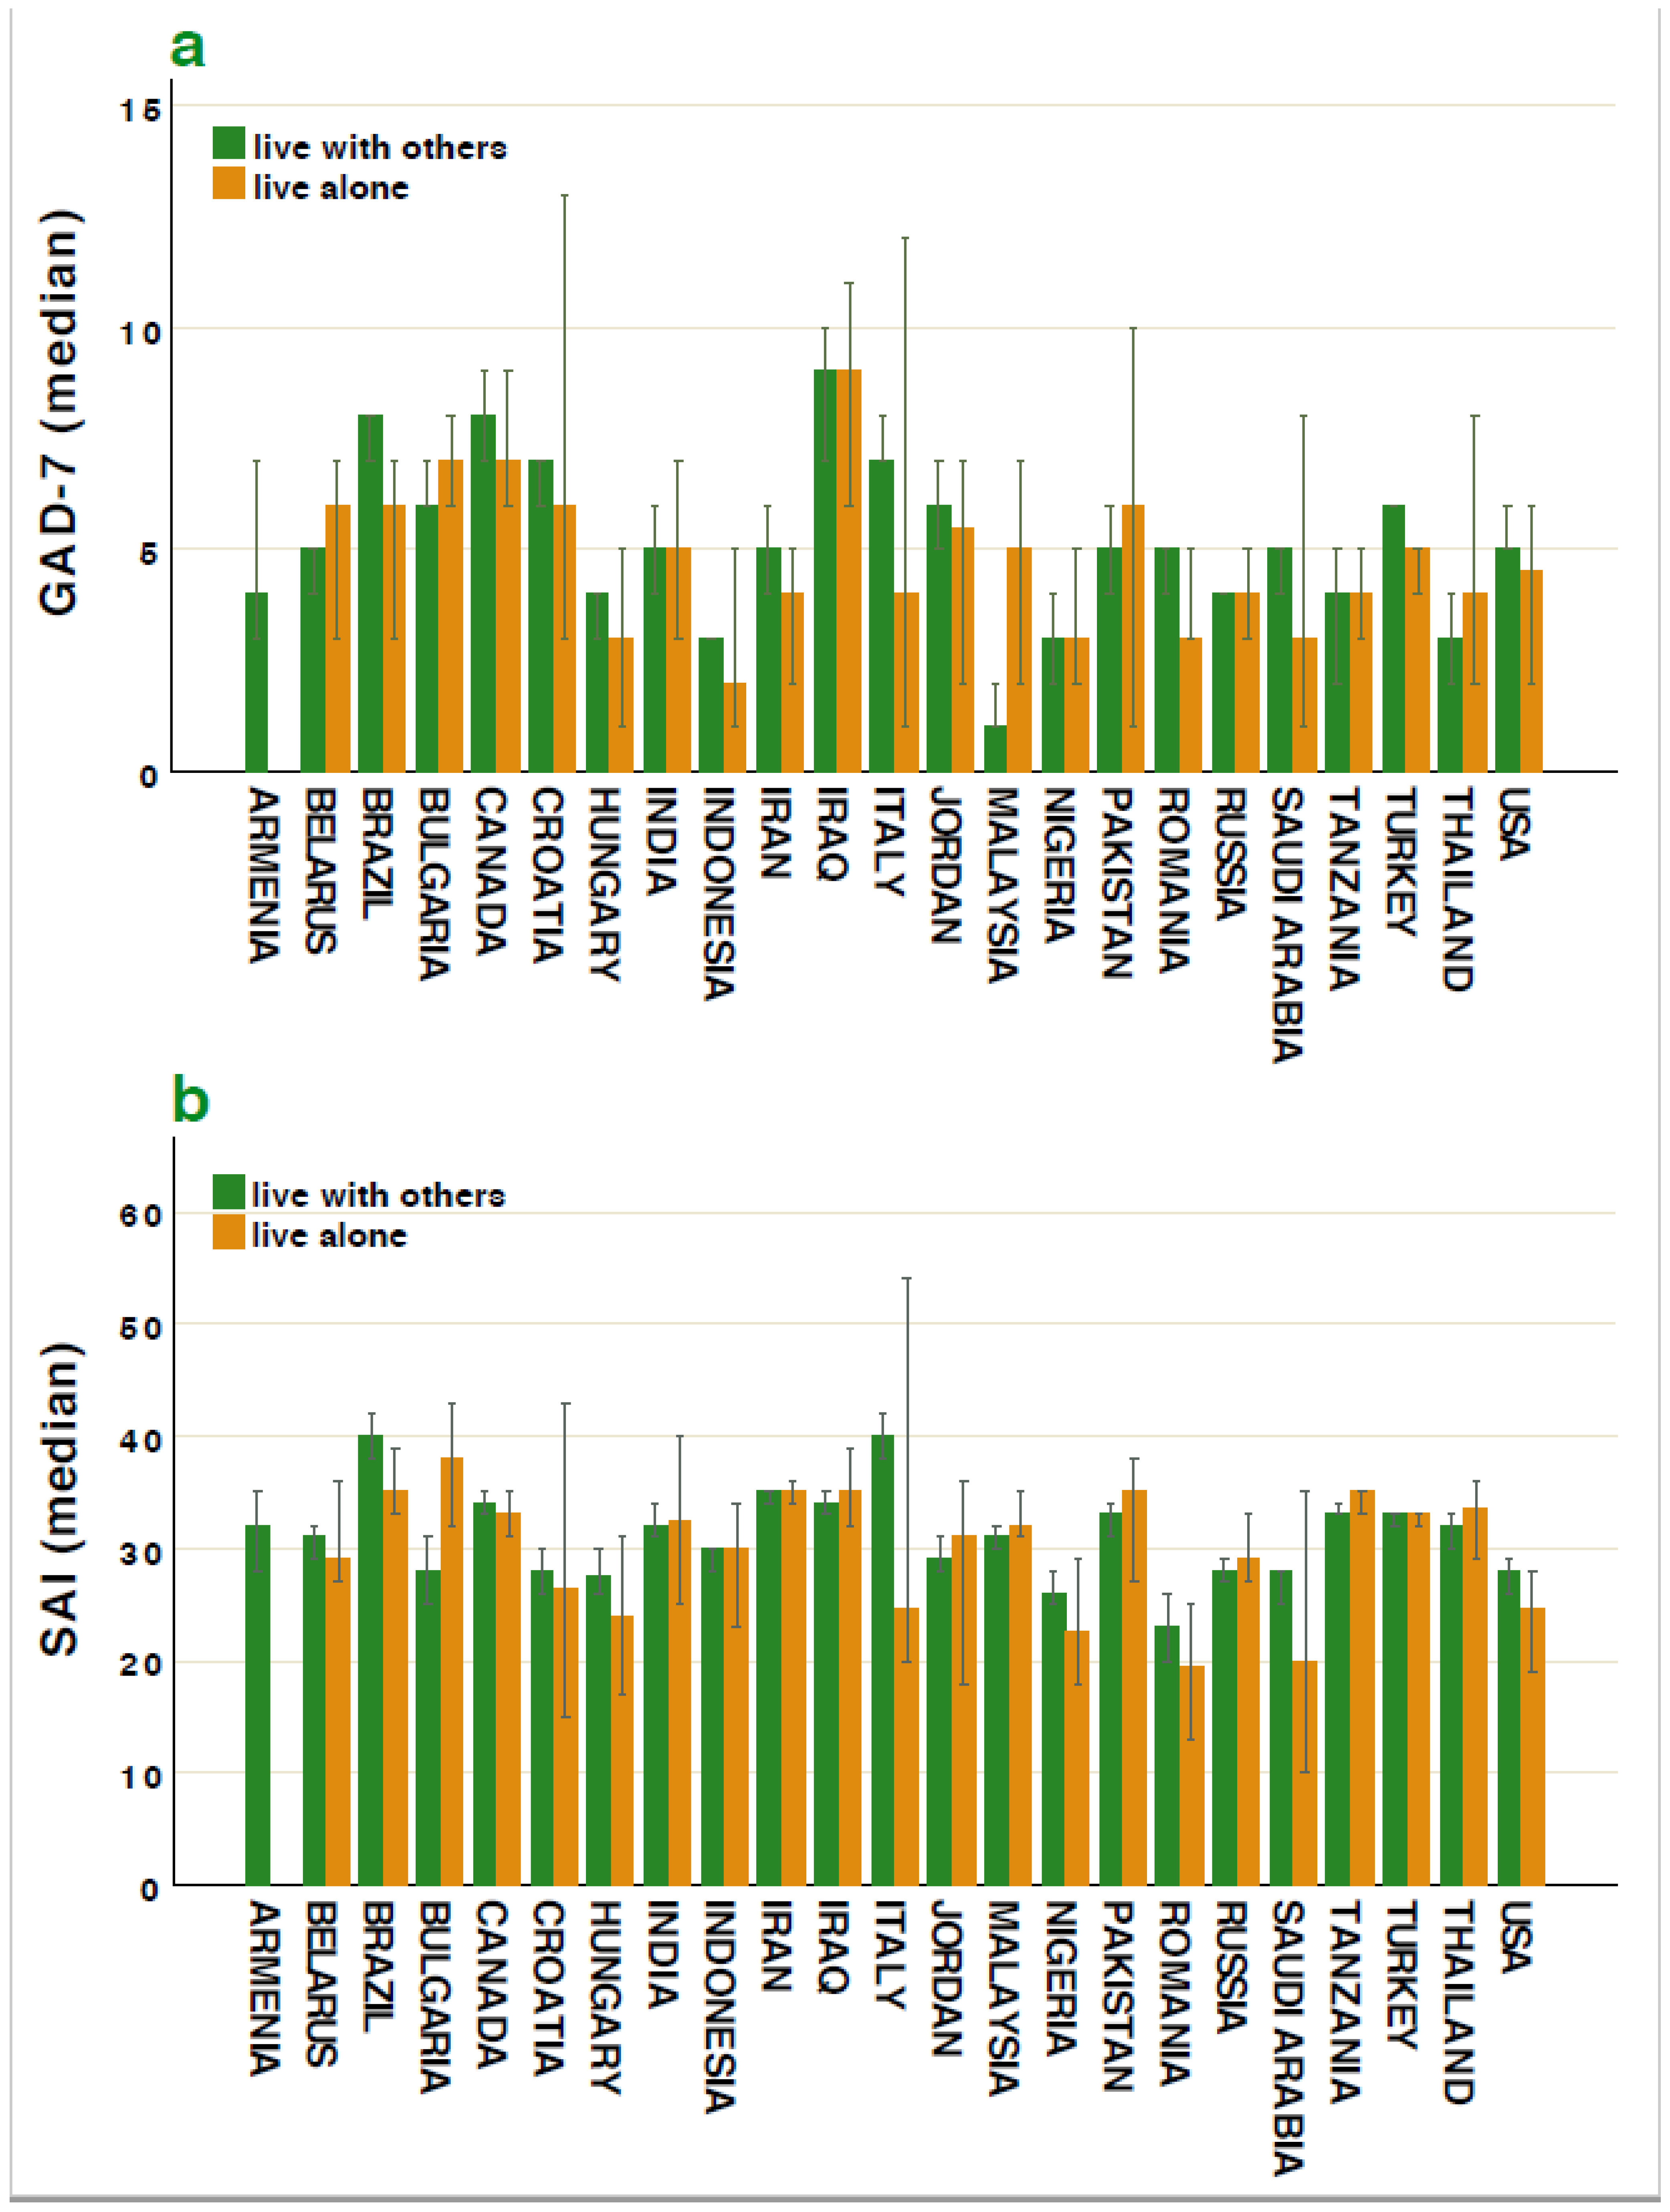
Our data revealed that the most stressed countries during restrictions and lockdown of the first wave of COVID-19 were Brazil, Iraq, Canada and the USA when looking at the GAD-7 scale (see Figure 2a). Most of the highest levels of state anxiety (SAI) were in Brazil and Italy (see Figure 2b).

3.2. Global Indices

To evaluate the association between global indices and self-reported symptoms of anxiety, we used a regression analysis.
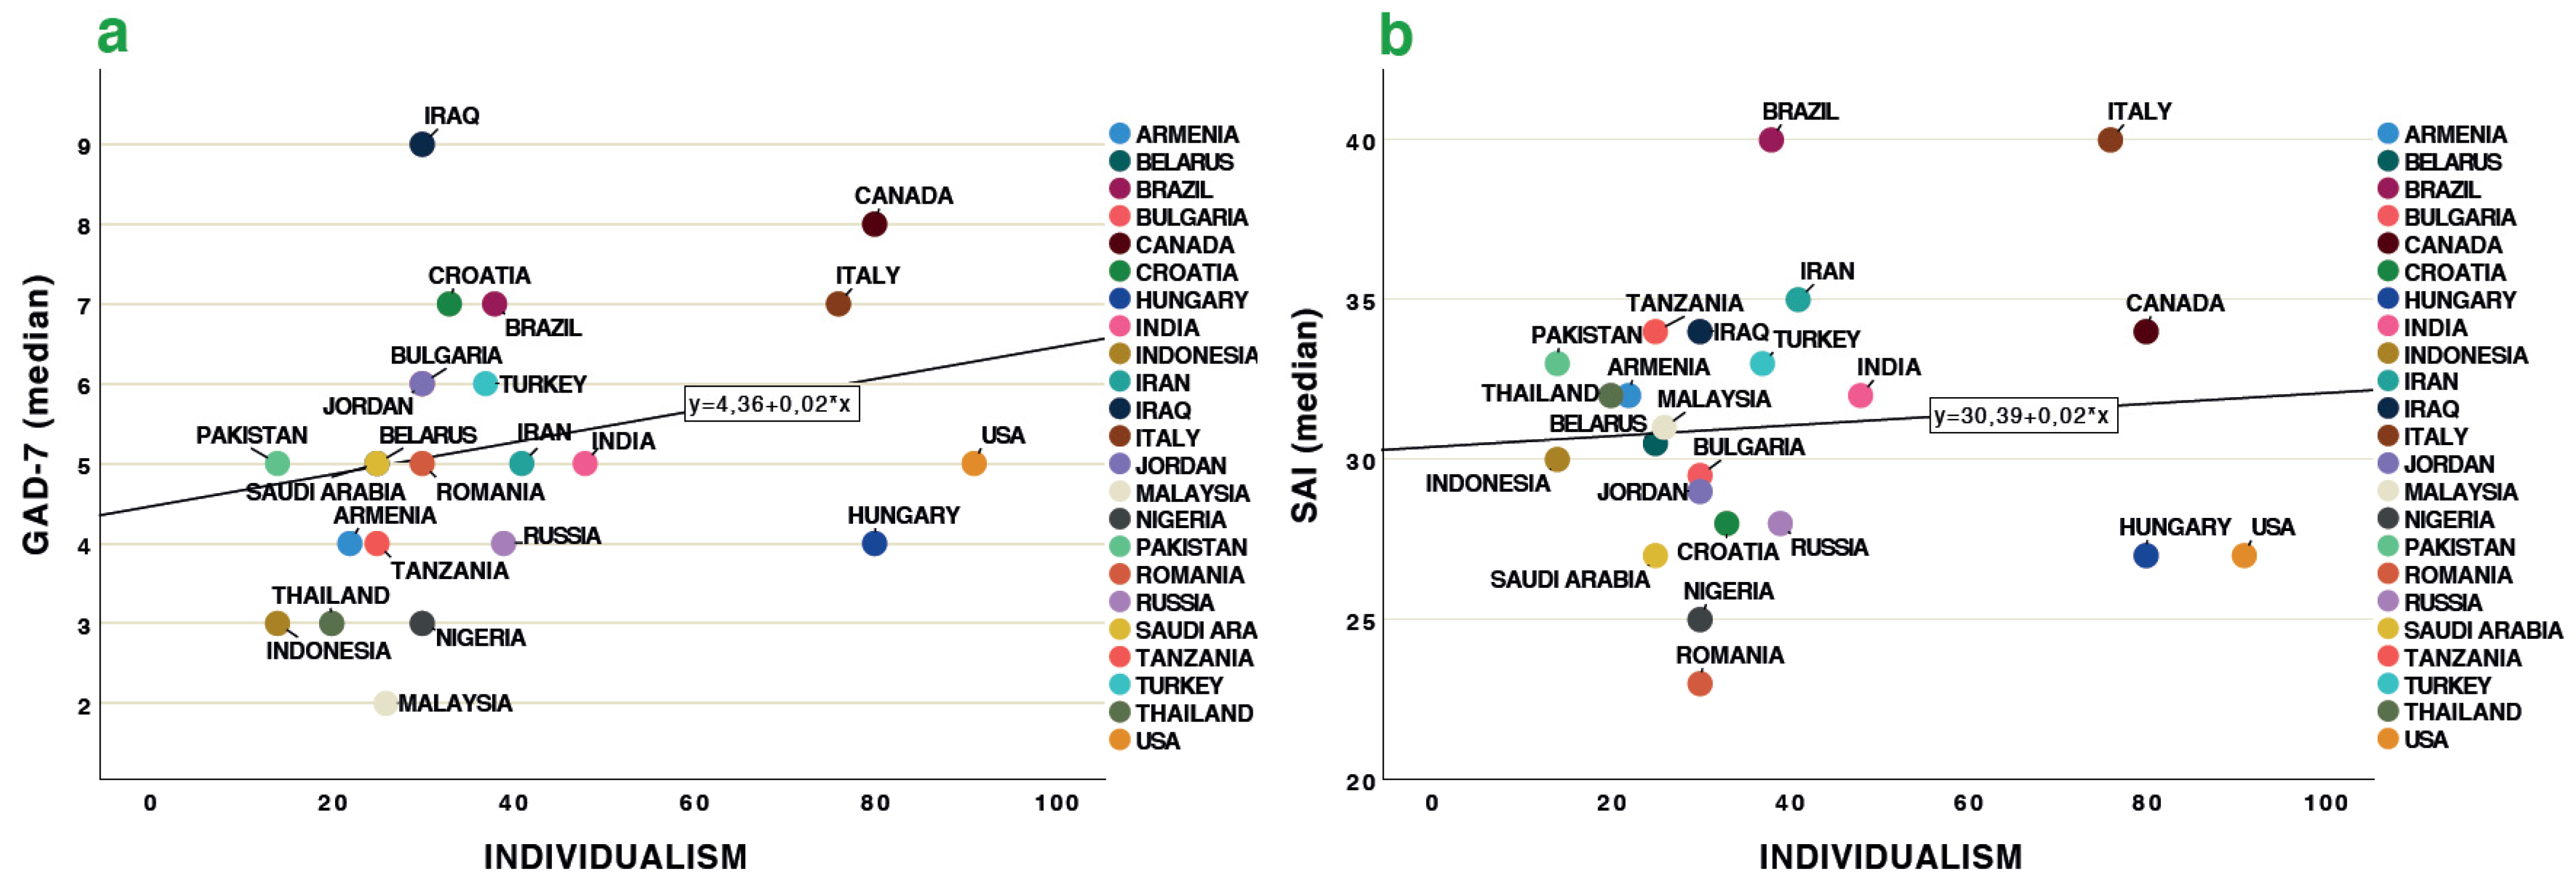
Individualism. The countries with high ratings of anxiety were also rated high on individualism (beta = 0.108, t = 13.510, p < 0.001, R2 = 0.012). Participants in countries with the lowest level of individualism (Indonesia, Malaysia, Nigeria, and Thailand) also reported the lowest levels of anxiety, except for Iraq (see Figure 3a). Similar trends were observed for the SAI (beta = 0.030, t = 3.653, p < 0.001, R2 = 0.001) (see Figure 3b).
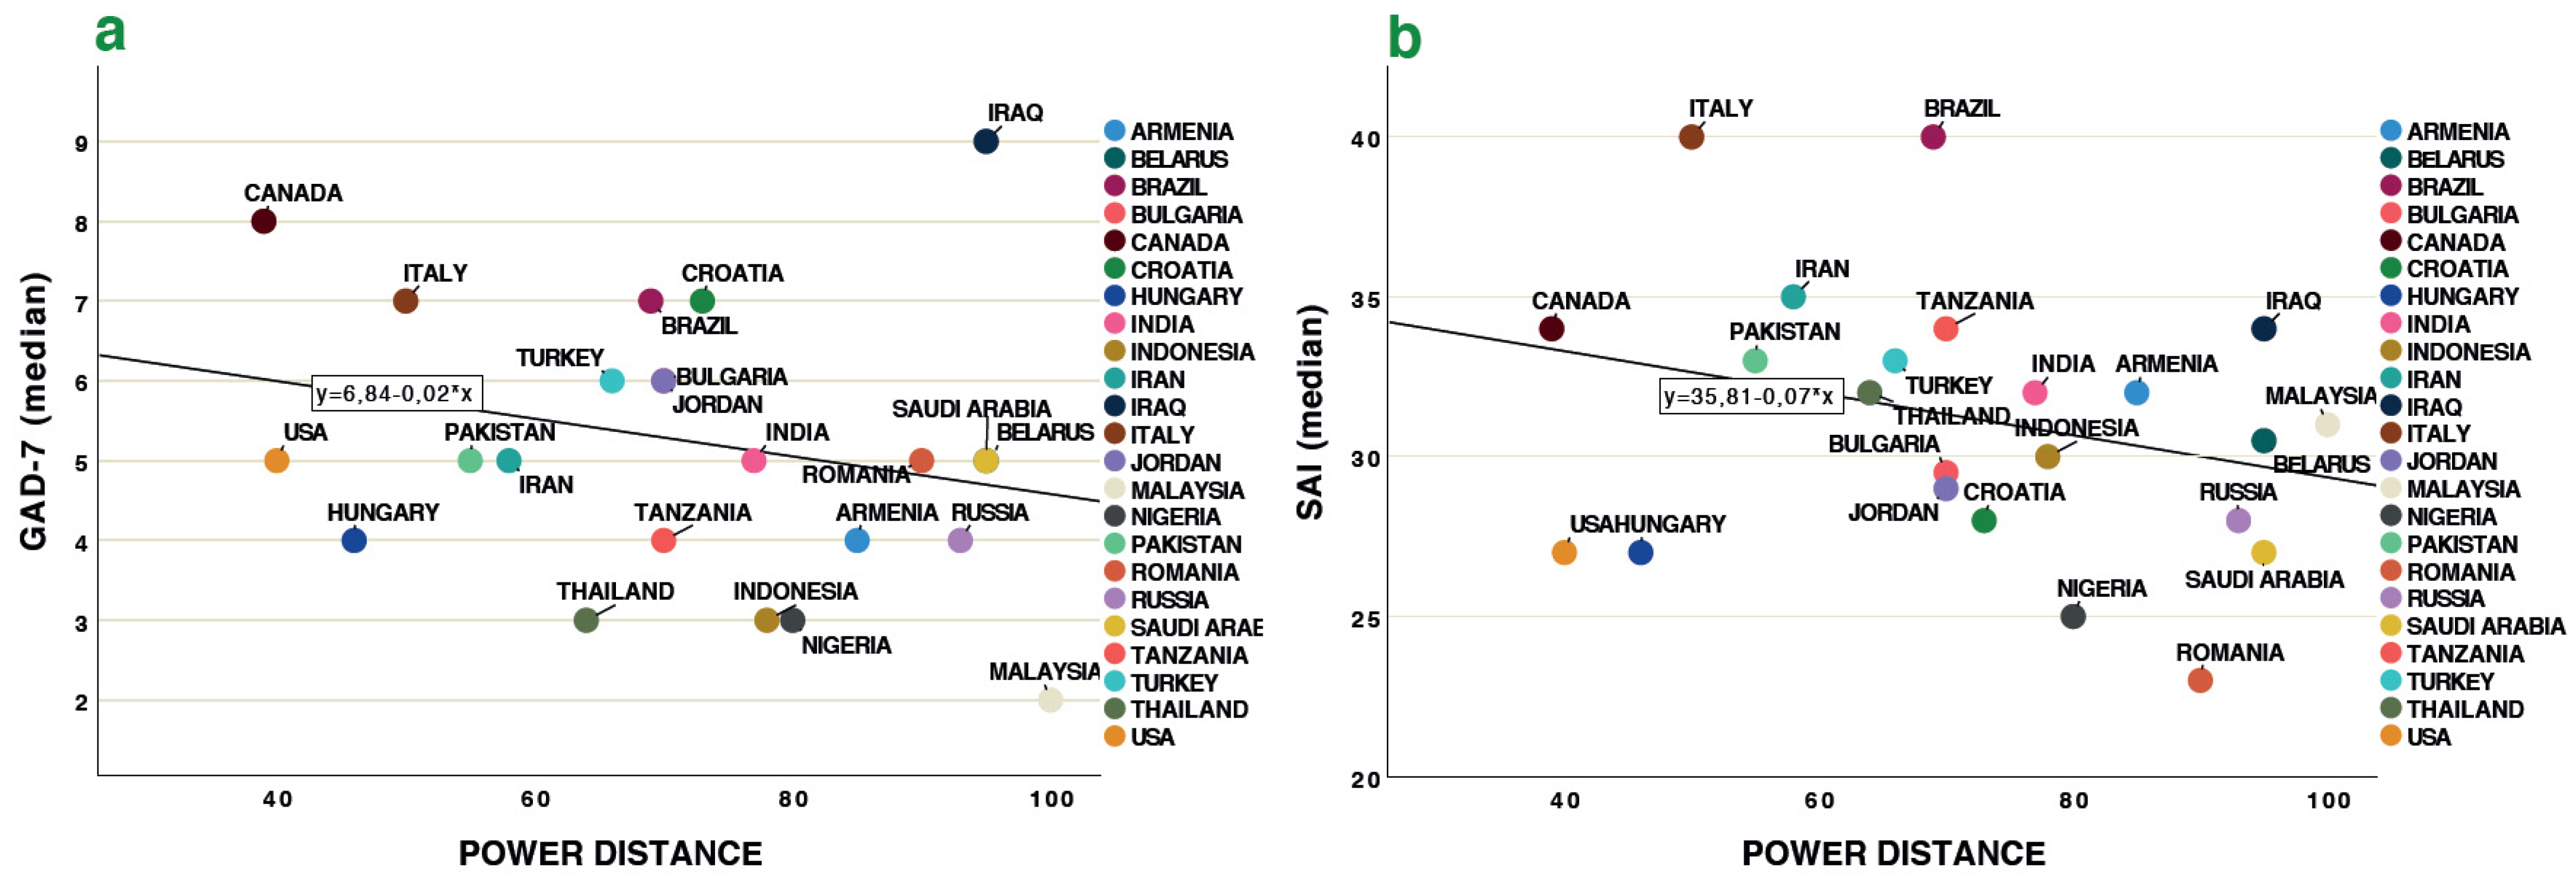
Power distance. Higher GAD-7 ratings on anxiety were found for nations with low power distance (beta = −0.046, t = −19.616, p < 0.001, R2 = 0.024), except for Iraq. See Figure 4a. Similar trends were observed for SAI (beta = −0.121, t = −15.090, p < 0.001, R2 = 0.015). See Figure 4b.
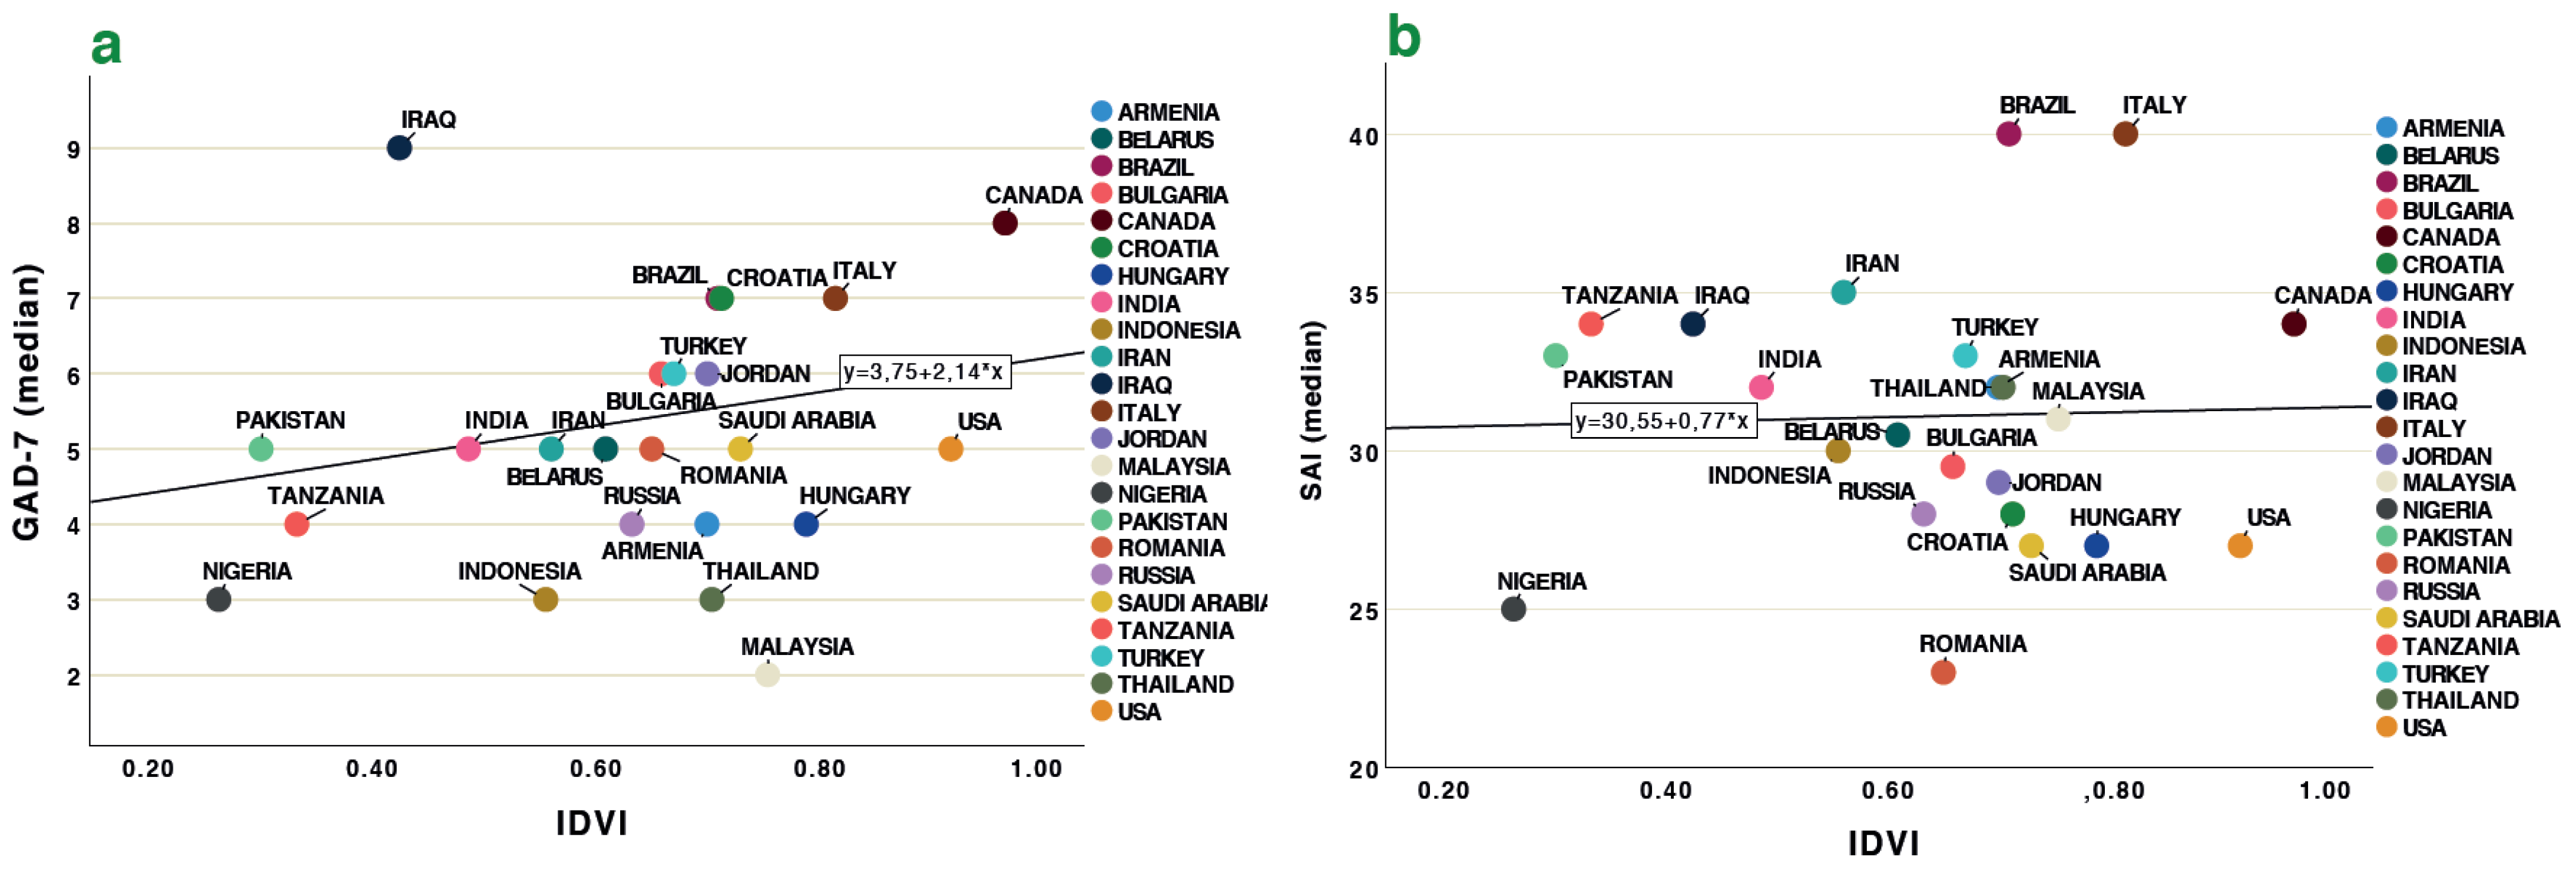
IDVI. Higher GAD-7 ratings on anxiety were found for nations with low vulnerability (beta = 0.062, t = 7.726, p < 0.001, R2 = 0.062), except for Iraq (see Figure 5a). The most vulnerable to infectious diseases, but the least anxious countries were Nigeria, Tanzania, Pakistan (see Figure 5a), with the exception of Iraq. Similar trends were observed for SAI (beta = 0.014, t = 1.748, p = 0.081, R2 = 0.000) (Figure 5b).
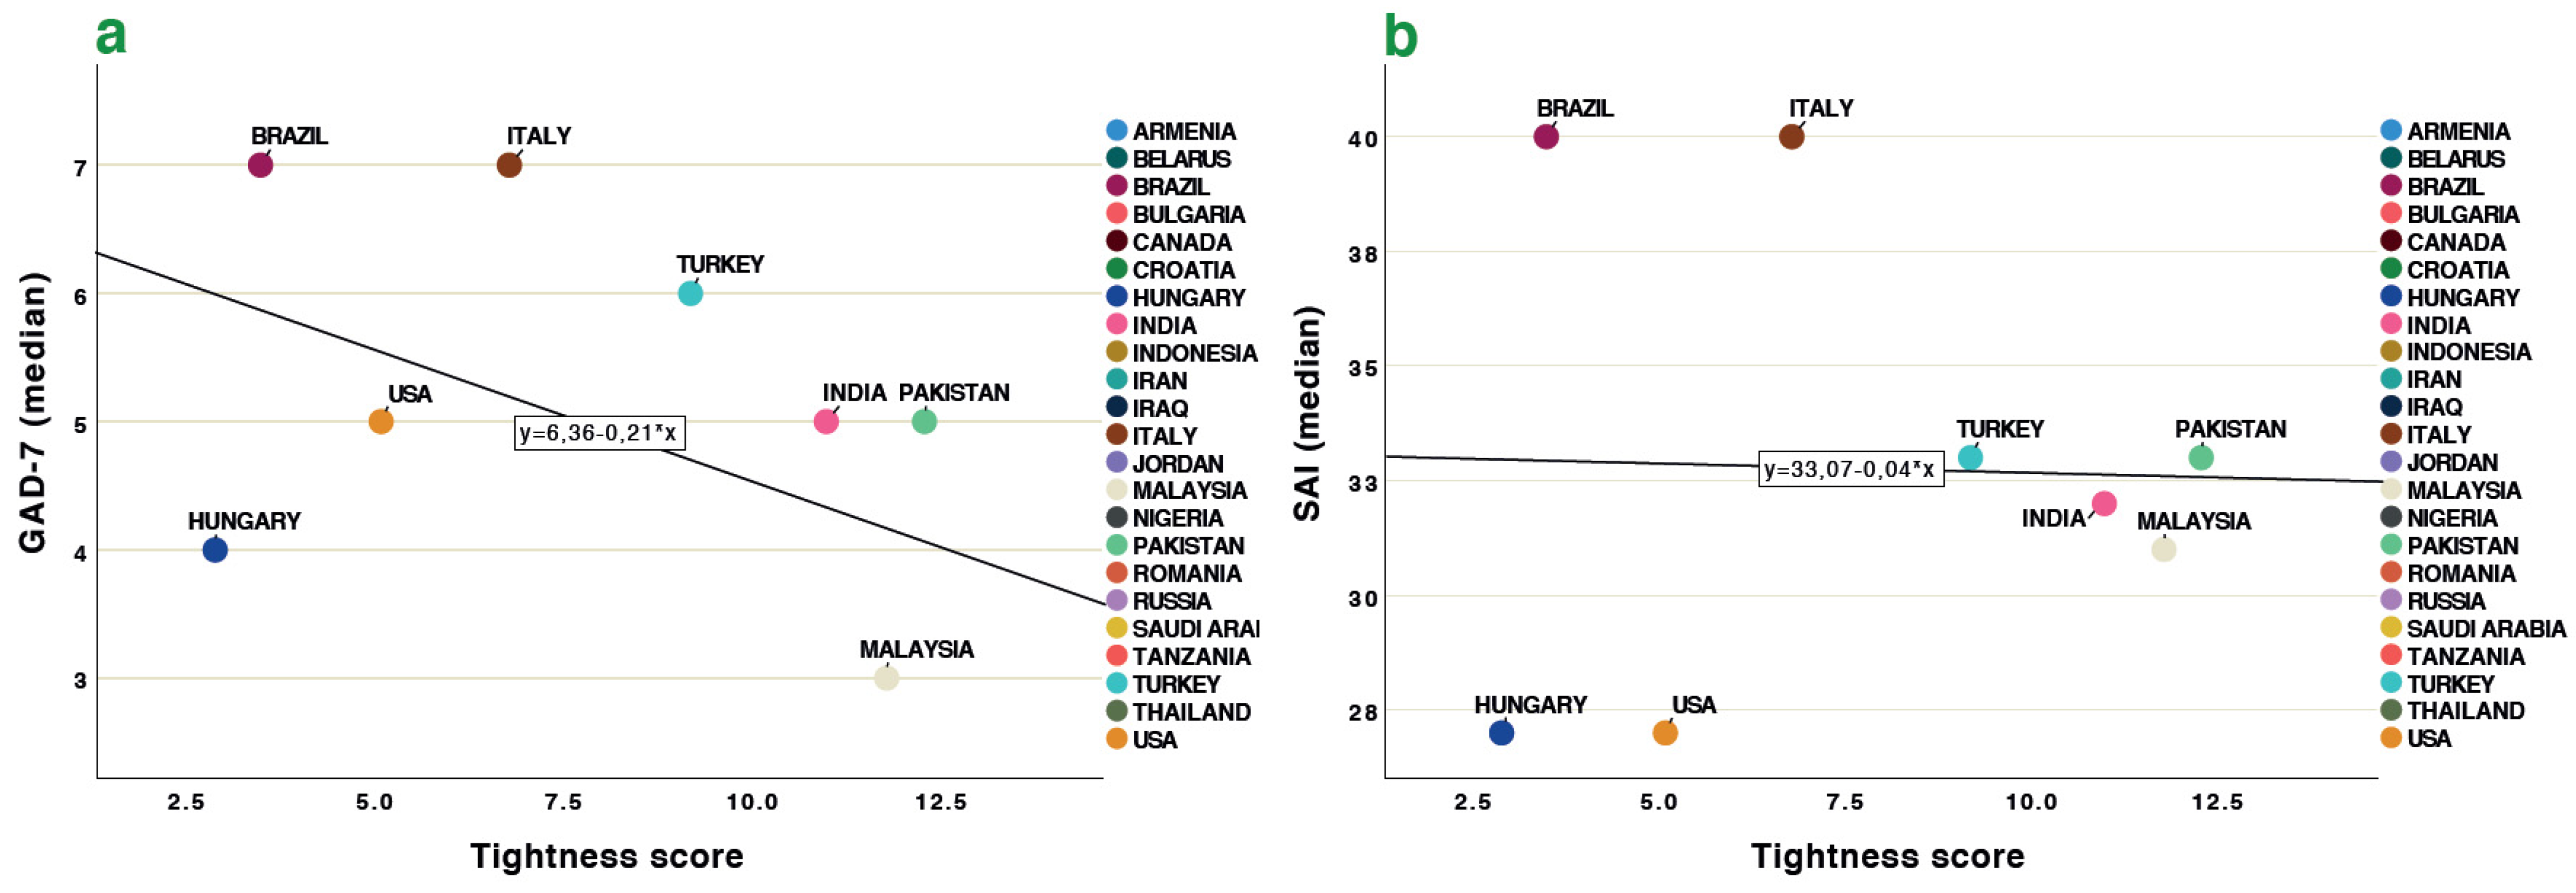
Tightness index. Countries who were high in measures of tightness reported the lowest ratings of anxiety on the GAD-7 (beta = −0.137, t = −12.628, p < 0.001, R2 = 0.019) (see Figure 6a). Similar trends were observed for SAI (beta = −0.092, t = −8.417, p < 0.001, R2 = 0.008) (see Figure 6b).
Index of Cultural tightness and looseness. Similar tendencies were demonstrated in the case of Index of Cultural Tightness and Looseness (CTL) [63]. Very loose nations (such as Canada and Italy) rated higher on both the GAD-7 (beta = −0.137, t = −12.628, p < 0.001, R2 = 0.019) and the SAI (beta = −0.066, t = −7.491, p < 0.001, R2 = 0.004) (see Figure 7a,b, respectively). On the other side of the pole was Indonesia, Nigeria and Jordan (Figure 7a,b).

3.3. Anxiety Scales, Age and Cohabitation/Loneliness

As another factor possibly influencing the level of anxiety during pandemic, we used the factor of cohabitation/loneliness (live alone or live with other). Significant differences of cohabitation/loneliness were observed in the GAD-7 scale; people who lived with someone reported the highest levels of anxiety (Table 3, Figure 8a,b). The overwhelming majority of respondents (90.8%) from our sample lived with someone, whether family members or friends (colleagues) (Table 4). In some countries we discovered a contrary tendency; that is the lonely people were more anxious. This was true for Belarus, Bulgaria, Malaysia and Pakistan, but these differences were not strong (Figure 8a).
A GLM ANCOVA two-way analysis was conducted with GAD-7 and SAI as dependent variables, sex, country and cohabitation/loneliness as independent predictors and age as a covariate for the whole sample (Table 5). It was found that age was significantly associated with anxiety in each combination, but the predictor “cohabitation/loneliness” depended on country of respondent in the case of the SAI scale exclusively (Table 5).
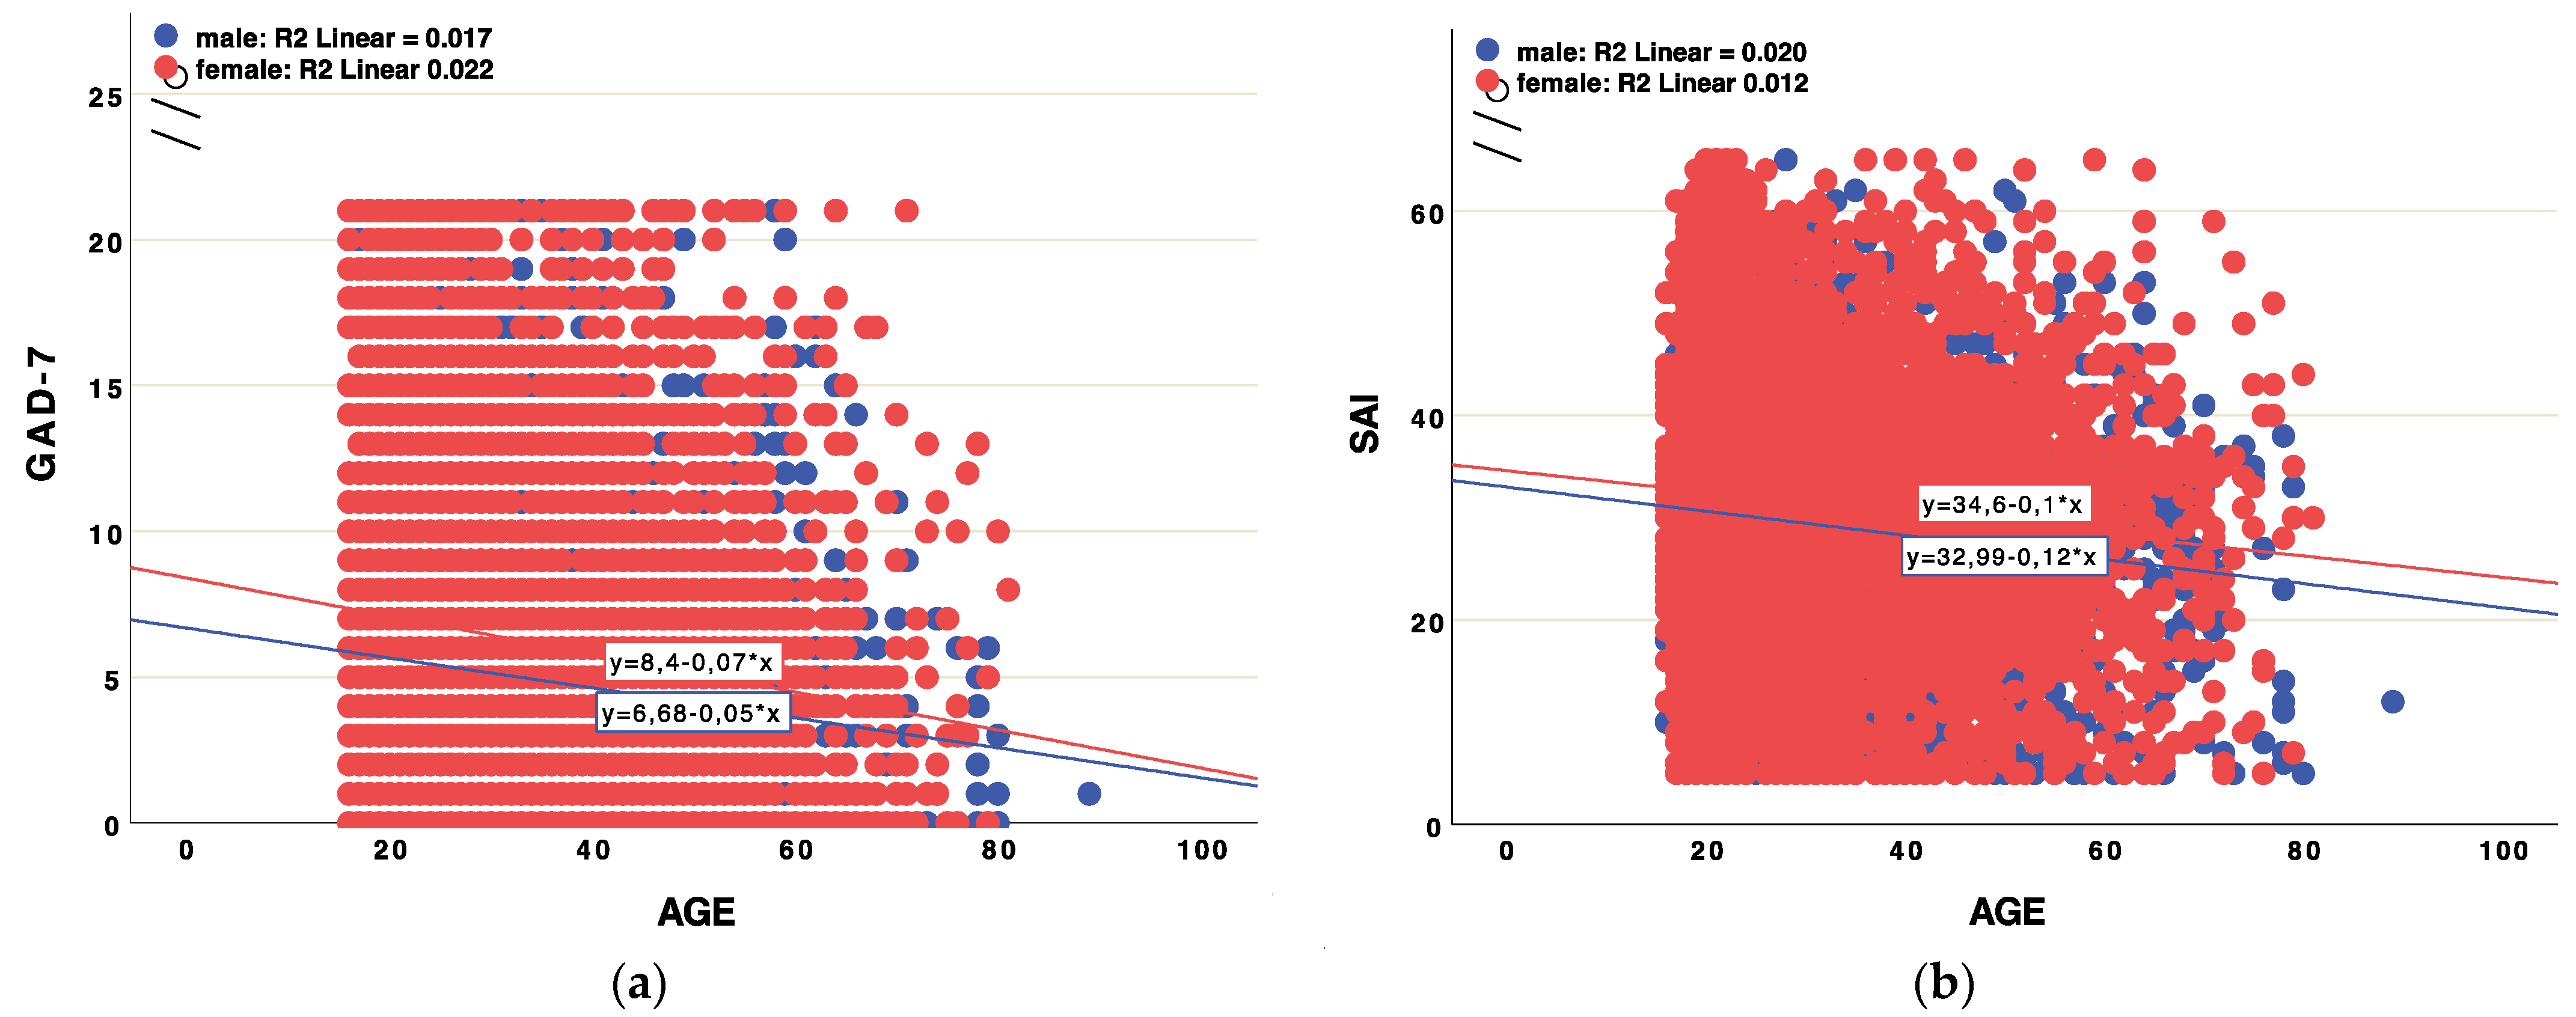
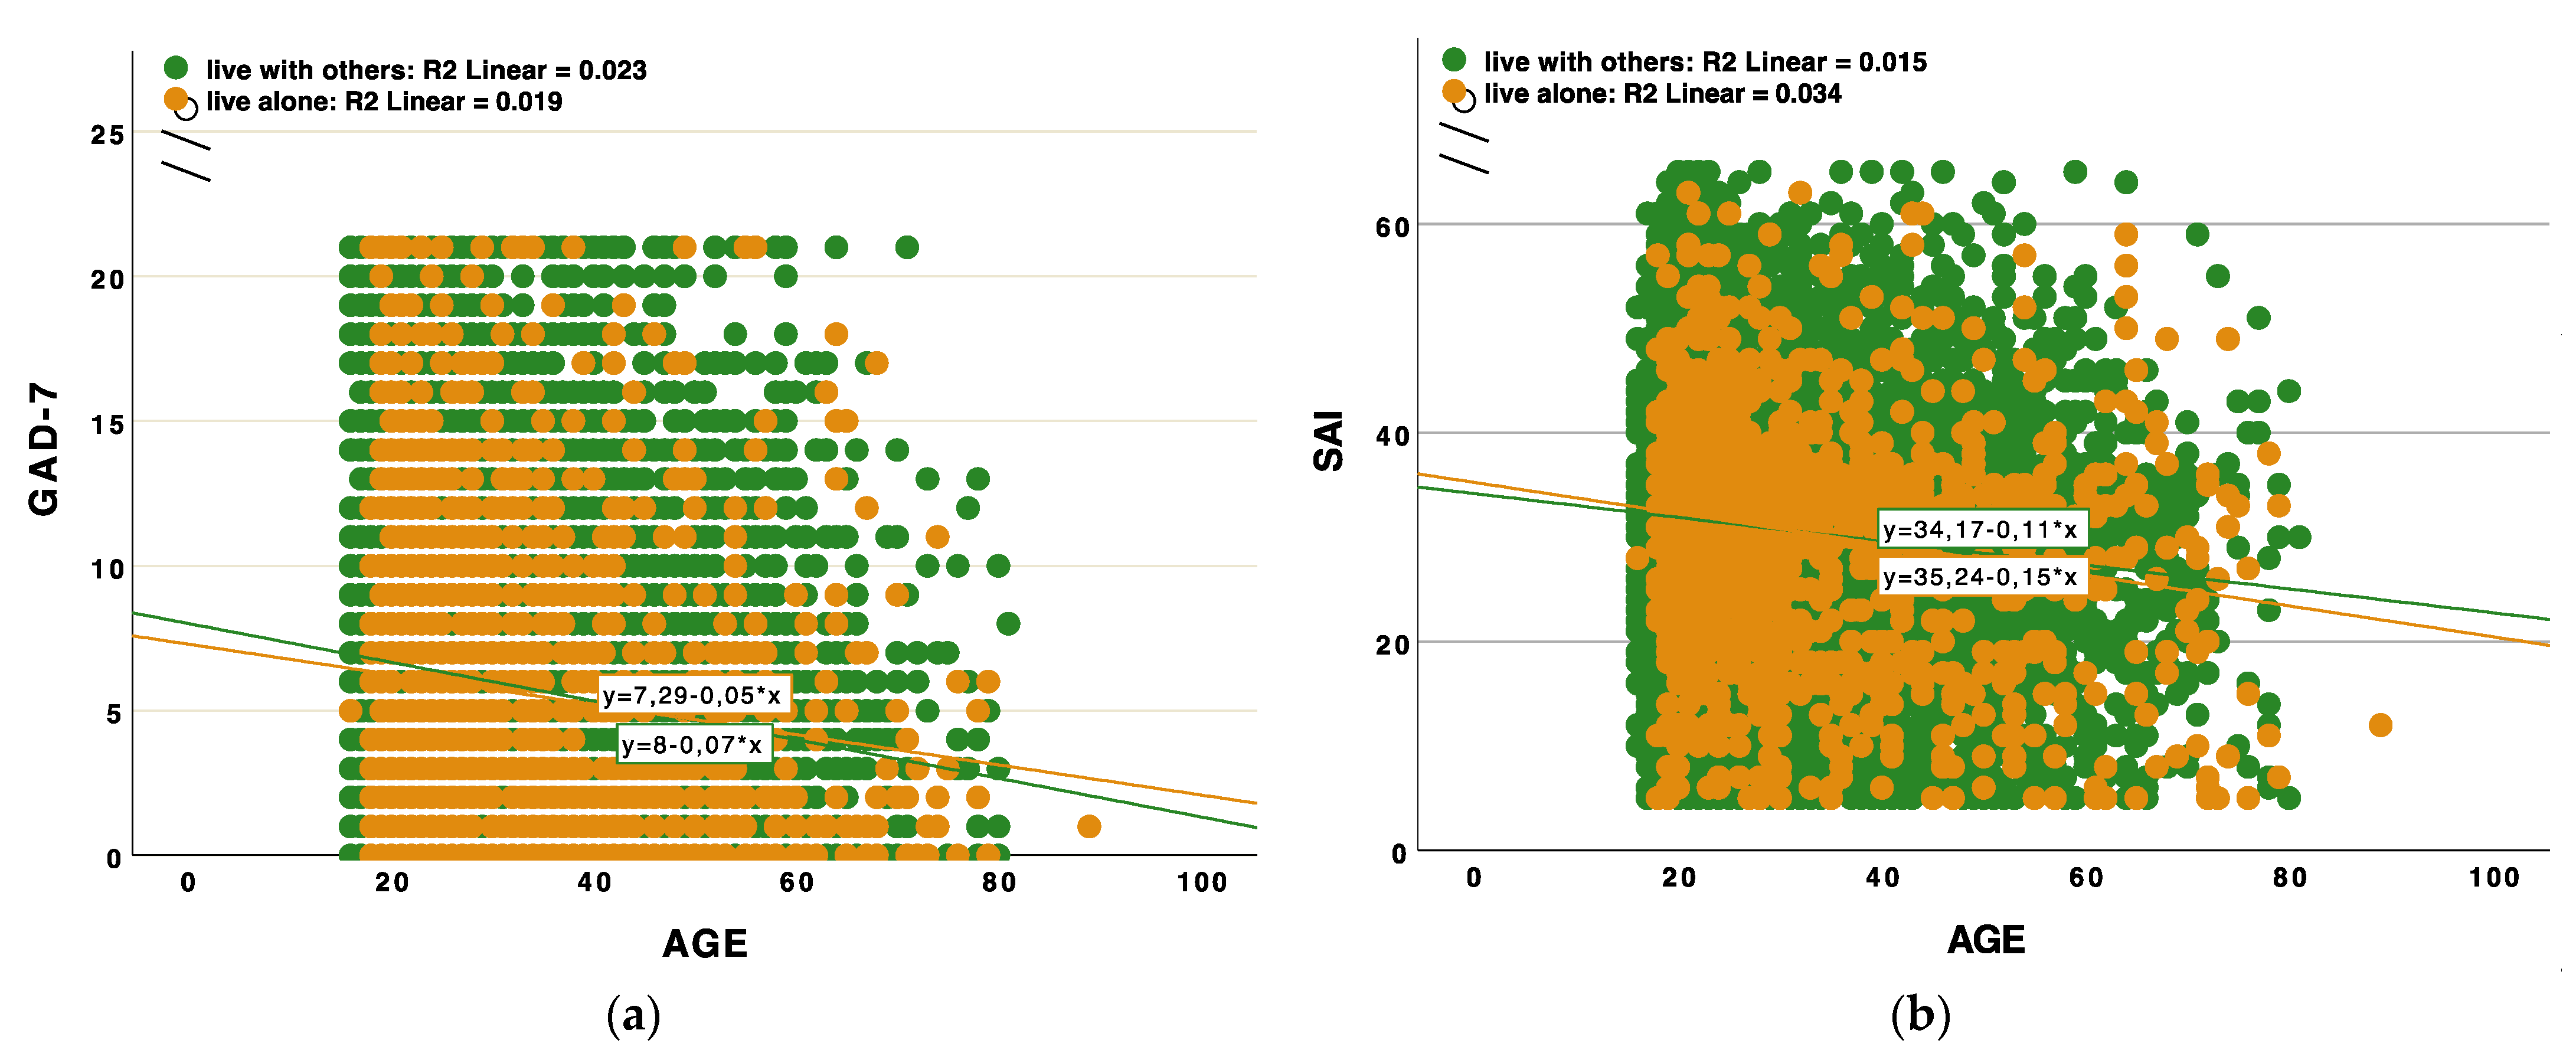
Across sexes, as the age of the respondents increased, the level of anxiety on both scales decreased (Figure 9a,b). There were no significant differences in the level of anxiety, decreasing with age in groups of people living alone or with someone (Figure 10a,b).

4. Discussion

Based on cross-sectional data from 15,375 participants from 23 countries collected during the early phase of the COVID-19 pandemic, the data reflect that women reported higher levels of anxiety compared to men. This result supports prior research collected before the COVID-19 pandemic [19,23,24,25,52,65,66,67,68,69]. Importantly, however, when examining between-country differences, we did not find significant sex differences in the level of anxiety between men and women in Armenia, Hungary, Iran, Iraq, Saudi Arabia, Thailand and the USA. The COVID-19 outbreak in China did not result in sex differences in stress levels either [26,27]. However, this result may be culturally related. Recent studies of existing data indicate that GAD-7 rates vary by ethnic/cultural group [70].
Previous studies suggest cross-cultural differences in the prevalence of anxiety disorders [71,72], but the extent of these differences remains unclear. While symptoms of anxiety have been found more common in Latin America, high income regions and regions with a history of recent conflict [66], symptoms of anxiety tend to be less common in Asian populations compared to other populations [66,71,72]. Results from the present study showed the highest GAD-7 scores in Brazil, Iraq, Canada, the USA and Italy. Overall, our samples demonstrated that GAD-7 scores were higher during COVID-19 in comparison with scores before the pandemic (for which the similar data was available) (see Table 6). In Saudi Arabia the GAD-7 scores were close to the values reported by Al-Rabiaah and colleagues during the MERS-CoV outbreak in 2014 [52].
Data from our study showed a positive association between age and reported symptoms of anxiety, which complements prior research [3,26,66,73,74]. At the same time, some data showed inverted U-shaped associations between age and well-being [23,69], or no association between age and stress [27]. In a study conducted earlier before the pandemic in Pakistan, age did not influence self-reported symptoms of the GAD-7 [65].
Approximately 91% of the participants in our study reported living with someone, whether family members or friends. Significant differences of cohabitation/loneliness were observed for the GAD-7 scale; particularly, people who lived with someone reported higher levels of anxiety. However, when we compared countries, we found that some countries showed the opposite association, i.e., people living alone were more anxious, for example in Belarus, Bulgaria, Malaysia, and Pakistan. Research has demonstrated that living alone may be linked to higher indices of depression and anxiety [28,75]. The same is true in the case of overcrowding [32,33,73]. Our total results are in line with the study of Kowal and colleagues (2020), who reported that people living alone were not stressed much [3]. On the other hand, the same studies suggested that married (or cohabiting) individuals experience lower levels of stress than single individuals [3,76]. The Chinese data reported no differences related to marital status on perceived stress during COVID-19 [27,77]. Such differences warrant further investigations.
Cultural considerations. Perhaps not surprisingly, our results showed that reported symptoms of anxiety differed across countries. Participants from countries with the highest ratings of anxiety (Canada and Italy) were also highest on individualism, whereas the least anxious countries were those with lowest levels of individualism (Thailand, Indonesia, Malaysia, Nigeria). High GAD-7 ratings on anxiety were found for nations with low power distance (Canada, Italy). Interestingly, participants in this study reported experiencing the pandemic as hypothesized by Triandis and colleagues (1990): in the individualistic cultures, people find it harder to give up their personal preferences for group needs, while collectivist countries focus on group harmony, and the emotional cost of a period of isolation is higher in individualistic cultures [38]. As expected, stress levels were higher for individualistic versus collectivist cultures in our study.
However, contrary to our results, prior research by Kowal and colleagues (2020) found the individualism–collectivism continuum not to be associated with perceived stress [3]. Mækel and colleagues (2020) proposed another way to interpret these associations by the locus of control theory (people with a high locus or a sense of control tend to behave in a way that promotes health) [4,78]. Participants in Brazil, Colombia and the USA reported higher levels of anxiety, whereas people from Israel, Germany and Norway had comparatively lower levels of anxiety [4]. More individualistic countries, such as Australia and Canada, tend to attribute more negative connotations to the external locus of control than more collectivistic ones [79]. As presented by Mækel et al. (2020), more individualistic countries such as Norway, Germany and the USA had relatively lower scores for the sense of control over the outbreak than the more collectivist Colombia and Brazil [4]. The tendency in associations between the level of anxiety and the individualism-collectivism dimension remains to be tested more precisely in the future studies. One of the possible directions is gene-environmental research. For example, Chiao and Blizinsky (2010) suggested that certain cultural values, such as collectivism, may protect genetically susceptible populations (e.g., East Asian populations) from the increasing prevalence of anxiety disorders [80]; a promising area for future research.
Similar results were found when examining associations with tightness and looseness as defined by Gelfand and colleagues [39]. Tight societies, such as Australia, Brazil, the Netherlands and New Zealand, restrict freedom, while loose societies such as Pakistan, Malaysia, Singapore and South Korea, allow for greater freedom [39]. Specifically, our participants from loose nations (e.g., Canada and Italy) reported higher symptoms of anxiety compared to those from tight nations (e.g., Indonesia, Jordan and Nigeria). According to Gelfand and colleagues (2014), both very permissive and very constrained nations exhibit lower happiness, higher suicide rates, lower life expectancy and greater mortality rates from cardiovascular disease and diabetes [39]. The authors suggest that these disadvantages (extremes of freedom or restrictions) may be a consequence of the inability to control oneself and one’s environment [39].
Our data revealed a significant positive association between the level of anxiety during the COVID-19 first wave and countries’ scores on the Infectious Disease Vulnerability Index. Countries most vulnerable in terms of infectious diseases (e.g., Nigeria, Tanzania, Pakistan) reported lower levels of anxiety compared to countries less experienced with severe infections (USA, Italy, Canada).

5. Limitations

The results of this study should be interpreted within the context of certain limitations. Limitations of the current study include the disproportionate representation of women to men. Relatedly, it is important to acknowledge that participants were asked their sex and not their gender identity, which limits the generalizability of the study’s findings to individuals who may identify with a specific gender. Additionally, it is important to acknowledge that while the overall sample included over 15,000 participants, the representation in some countries (i.e., Armenia, Iraq) was quite low, which limits our ability to examine within-country differences. Another consideration is that participation in this study was limited to those with a stable internet connection (to complete the questionnaire), which precluded participation from those without this access.
We did not measure countries’ policies relating to COVID-19 and mortality rates, which may also be an important predictor of anxiety increase. Future studies in this direction should be highly productive and may further extend our knowledge about the nature of human anxiety and it’s influence of individual and public wellbeing.

6. Conclusions

Our study revealed cross-cultural differences in the level of anxiety during the first wave of the COVID-19 pandemic (from May to August 2020). Globally, levels of anxiety were higher in women compared to men. We suggest that cultural dimensions such as individualism/collectivism, power distance, and looseness/tightness may function as protective adaptive mechanisms against the development of anxiety symptoms in the continued COVID-19 pandemic. One possible explanation is that respondents from countries with higher power distance, tightness and collectivism, were less anxious and stressed because they trusted officials, and felt more that they were being protected by governmental services. Another possible explanation is that under such conditions, people do not feel able to influence the situation on their own.
This article presents the first results from our cross-cultural COVID-19 project. In the future we are planning to add more predictors into the analysis, including such factors as the degree of trust for the authorities, personal epidemiological experience, personal fear of COVID-19 and mortality rates for each country.

Author Contributions

Conceptualization, M.L.B., V.N.B.; Methodology, M.L.B., V.N.B., A.K.R.; Data analysis, M.L.B., V.N.B.; Data collections, all authors; Resources, all authors; Data curation, V.N.B.; Writing-original draft preparation M.L.B., V.N.B., A.K.R., L.H.; Visualization, M.L.B., V.N.B.; Project administration, M.L.B., V.N.B. All authors have read and agreed to the published version of the manuscript.

Funding

In Russia (V.N.B., M.L.B., J.F.), this article was prepared in the framework of a research grant funded by the Ministry of Science and Higher Education of the Russian Federation (grant ID: 075-15-2020-910). The authors extend their appreciation to the Deanship of Scientific Research at King Saud University for funding this work through Support to Ahmad M. Alghraibeh (Saudi Arabia). Data collection in Hungary was supported by the Hungarian Scientific Research Fund (OTKA) awarded to the twenty-seventh author (K125437).

Institutional Review Board Statement

The study was conducted according to the guidelines of the Declaration of Helsinki, and approved by the Ethics Committee of the Institute of Ethnology and Anthropology of the Russian Academy of Sciences (protocol No 01, dated 9 April 2020).

Informed Consent Statement

Informed consent was obtained from all subjects involved in the study.

Data Availability Statement

Data produced and processed in this study are included in the published article. The datasets can be acquired from the corresponding author upon appropriate purposes.

Conflicts of Interest

The authors declare no conflict of interest.

References

  1. World Health Organization. WHO Director-General’s Opening Remarks at the Media Briefing on COVID-19—11 March 2020. Available online: https://www.who.int/director-general/speeches/detail/who-director-general-s-opening-remarks-at-the-media-briefing-on-covid-19---11-march-2020 (accessed on 12 February 2021).
  2. Brooks, S.K.; Webster, R.K.; Smith, L.E.; Woodland, L.; Wessely, S.; Greenberg, N.; Rubin, G.J. The psychological impact of quarantine and how to reduce it: Rapid review of the evidence. Lancet 2020, 395, 912–920. [Google Scholar] [CrossRef] [Green Version]
  3. Kowal, M.; Coll-Martín, T.; Ikizer, G.; Rasmussen, J.; Eichel, K.; Studzińska, A.; Ahmed, O. Who is the most stressed during the covid-19 pandemic? Data from 26 countries and areas. Appl. Psychol. Health Well-Being 2020, 12, 946–966. [Google Scholar] [CrossRef]
  4. Mækelæ, M.J.; Reggev, N.; Dutra, N.; Tamayo, R.M.; Silva-Sobrinho, R.A.; Klevjer, K.; Pfuhl, G. Perceived efficacy of COVID-19 restrictions, reactions and their impact on mental health during the early phase of the outbreak in six countries. R. Soc. Open Sci. 2020, 7200644. [Google Scholar] [CrossRef]
  5. Ornell, F.; Schuch, J.B.; Sordi, A.O.; Kessler, F.H.P. Pandemic fear and COVID-19: Mental health burden and strategies. Braz. J. Psychiatry 2020, 42, 232–235. [Google Scholar] [CrossRef] [Green Version]
  6. van Bavel, J.J.; Baicker, K.; Boggio, P.S.; Capraro, V.; Cichocka, A.; Cikara, M.; Ellemers, N. Using social and behavioural science to support COVID-19 pandemic response. Nat. Hum. Behav. 2020, 4, 460–471. [Google Scholar] [CrossRef]
  7. Fedenok, J.N.; Burkova, V.N. Social distancing as altruism in the context of the coronavirus pandemic: A cross-cultural study. Sib. Hist. Res. 2020, 2, 6–40. [Google Scholar] [CrossRef]
  8. Cao, W.; Fang, Z.; Hou, G.; Han, M.; Xu, X.; Dong, J.; Zheng, J. The psychological impact of the COVID-19 epidemic on college students in China. Psychiatry Res. 2020, 112934. [Google Scholar] [CrossRef] [PubMed]
  9. Chen, Q.; Liang, M.; Li, Y.; Guo, J.; Fei, D.; Wang, L.; He, L.; Sheng, C.; Cai, Y.; Li, X.; et al. Mental health care for medical staff in China during the COVID-19 outbreak. Lancet Psychiatry 2020, 7, e15–e16. [Google Scholar] [CrossRef]
  10. Li, S.W.; Wang, Y.; Yang, Y.Y.; Lei, X.M.; Yang, Y.F. Analysis of influencing factors of anxiety and emotional disorders in children and adolescents during home isolation during the epidemic of novel coronavirus pneumonia. Chin. J. Child Health 2020, 28, 1–9. [Google Scholar]
  11. Yang, Y.; Li, W.; Zhang, Q.; Zhang, L.; Cheung, T.; Xiang, Y.T. Mental health services for older adults in China during the COVID-19 outbreak. Lancet Psychiatry 2020, 7, e11. [Google Scholar] [CrossRef]
  12. Bults, M.; Beaujean, D.J.M.A.; de Zwart, O.; Kok, G.; van Empelen, P.; van Steenbergen, J.E.; Richardus, J.H.; Voeten, H.A.C.M. Perceived risk, anxiety, and behavioural responses of the general public during the early phase of the Influenza A (H1N1) pandemic in the Netherlands: Results of three consecutive online surveys. BMC Public Health 2020, 11, 2. [Google Scholar] [CrossRef] [PubMed] [Green Version]
  13. Jalloh, M.F.; Li, W.; Bunnell, R.E.; Ethier, K.A.; O’Leary, A.; Hageman, K.M.; Sengeh, P.; Jalloh, M.B.; Morgan, O.; Hersey, S.; et al. Impact of Ebola experiences and risk perceptions on mental health in Sierra Leone, July 2015. BMJ Glob. Health 2018, 3, e000471. [Google Scholar] [CrossRef] [PubMed] [Green Version]
  14. Jones, J.H.; Salathe, M. Early assessment of anxiety and behavioral response to novel swine-origin influenza A (H1N1). PLoS ONE 2009, 4, e8032. [Google Scholar] [CrossRef] [PubMed]
  15. Main, A.; Zhou, Q.; Ma, Y.; Luecken, L.J.; Liu, X. Relations of SARS-related stressors and coping to Chinese college students’ psychological adjustment during the 2003 Beijing SARS epidemic. J. Couns. Psychol. 2011, 58, 410–423. [Google Scholar] [CrossRef] [Green Version]
  16. Semenova, O.; Apalkova, J.; Butovskaya, M. Sex differences in spatial activity and anxiety levels in the COVID-19 pandemic from evolutionary perspective. Sustainability 2021, 13, 1110. [Google Scholar] [CrossRef]
  17. Uehara, M.; Fujii, M.; Kobayashi, K. A model of stress change under the first COVID-19 pandemic among the general public in Japanese major cities and rural areas. Sustainability 2021, 13, 1207. [Google Scholar] [CrossRef]
  18. Karwowski, M.; Kowal, M.; Groyecka, A.; Białek, M.; Lebuda, I.; Sorokowska, A.; Sorokowski, P. When in danger, turn right: Does Covid-19 threat promote social conservatism and right-wing presidential candidates? PsyArXiv 2020. Available online: https://psyarxiv.com/pjfhs/ (accessed on 8 February 2021). [CrossRef]
  19. Cohen, S.; Janicki-Deverts, D.; Doyle, W.J.; Miller, G.E.; Frank, E.; Rabin, B.S.; Turner, R.B. Chronic stress, glucocorticoid receptor resistance, inflammation, and disease risk. Proc. Natl. Acad. Sci. USA 2012, 109, 5995–5999. [Google Scholar] [CrossRef] [Green Version]
  20. Craske, M.; Rauch, S.; Ursano, R.; Prenoveau, J.; Pine, D.; Zinbarg, R. What is an anxiety disorder? Depress. Anxiety 2009, 26, 1066–1085. [Google Scholar] [CrossRef]
  21. Toussaint, A.; Hüsing, P.; Gumz, A.; Wingenfeld, K.; Härter, M.; Schramm, E.; Löwe, B. Sensitivity to change and minimal clinically important difference of the 7-item Generalized Anxiety Disorder Questionnaire (GAD-7). J. Affect. Disord. 2020, 265, 395–401. [Google Scholar] [CrossRef]
  22. Ahmed, M.A.-K.; Alansari, B.M. Gender differences in anxiety among undergraduates from ten Arab countries. Soc. Behav. Pers. 2004, 32, 649–655. [Google Scholar] [CrossRef]
  23. Bergdahl, J.; Bergdahl, M. Perceived stress in adults: Prevalence and association of depression, anxiety and medication in a Swedish population. Stress Health 2002, 18, 235–241. [Google Scholar] [CrossRef]
  24. Feingold, A. Gender differences in personality: A meta-analysis. Psychol. Bull. 1994, 116, 429–456. [Google Scholar] [CrossRef] [PubMed]
  25. Burkova, V.N.; Butovskaya, M.L.; Dronova, D.A.; Apalkova, Y.I. Empathy, Anxiety, and Aggression among Moscow Students. Etnograficheskoe Obozr. 2019, 5, 169–188. (In Russian) [Google Scholar] [CrossRef]
  26. Limcaoco, R.S.G.; Mateos, M.E.; Fernandez, M.J.; Roncero, C. Anxiety, worry and perceived stress in the world due to the COVID-19 pandemic. medRxiv 2020. [Google Scholar] [CrossRef] [Green Version]
  27. Wang, C.; Pan, R.; Wan, X.; Tan, Y.; Xu, L.; Ho, C.S.; Ho, R.C. Immediate psychological responses and associated factors during the initial stage of the 2019 coronavirus disease (COVID-19) epidemic among the general population in China. Int. J. Environ. Res. Public Health 2020, 17, 1729. [Google Scholar] [CrossRef] [PubMed] [Green Version]
  28. Jacob, L.; Haro, J.M.; Koyanagi, A. Relationship between living alone and common mental disorders in the 1993, 2000 and 2007 National Psychiatric Morbidity Surveys. PLoS ONE 2019, 14, e0215182. [Google Scholar] [CrossRef] [Green Version]
  29. Kyprianides, A.; Easterbrook, M.J. Social factors boost well-being behind bars: The importance of individual and group ties for prisoner well-being. Appl. Psychol. Health Well-Being 2020, 12, 7–29. [Google Scholar] [CrossRef]
  30. Vermeulen, L.P. Small-group behaviour in long-term isolation. S. Afr. J. Sociol. 1977, 15, 35–40. [Google Scholar] [CrossRef]
  31. Rico-Uribe, L.A.; Caballero, F.F.; Martín-María, N.; Cabello, M.; Ayuso-Mateos, J.L.; Miret, M. Association of loneliness with all-cause mortality: A meta-analysis. PLoS ONE 2018, 13, e0190033. [Google Scholar] [CrossRef]
  32. Epstein, Y.M. Crowding stress and human behavior. J. Soc. Issues 1981, 37, 126–144. [Google Scholar] [CrossRef]
  33. Fuller, T.D.; Edwards, J.N.; Vorakitphokatorn, S.; Sermsri, S. Chronic stress and psychological well-being: Evidence from Thailand on household crowding. Soc. Sci. Med. 1996, 42, 265–280. [Google Scholar] [CrossRef]
  34. Heppner, P.P. Expanding the conceptualization and measurement of applied problem solving and coping: From stages to dimensions to the almost forgotten cultural context. Am. Psychol. 2008, 63, 805–816. [Google Scholar] [CrossRef] [PubMed]
  35. Wong, P.T.P.; Wong, L.C.J. Handbook of Multicultural Perspectives on Stress and Coping; Springer: New York, NY, USA, 2006. [Google Scholar]
  36. Hofstede, G. Culture’s Consequences: Comparing Values, Behaviors, Institutions and Organizations across Nations; Sage: Thousand Oaks, CA, USA, 2001. [Google Scholar]
  37. Hofstede, G. Dimensionalizing cultures: The Hofstede model in context. Online Read. Psychol. Cult. (ORPC) 2011, 2, 3–26. [Google Scholar] [CrossRef]
  38. Triandis, H.C.; McCusker, C.; Hui, C.H. Multimethod probes of individualism and collectivism. J. Personal. Soc. Psychol. 1990, 59, 1006–1020. [Google Scholar] [CrossRef]
  39. Gelfand, M.J.; Raver, J.L.; Nishii, L.; Leslie, L.M.; Lun, J.; Lim, B.C.; Yamaguchi, S. Differences between tight and loose cultures: A 33-nation study. Science 2011, 332, 1100–1104. [Google Scholar] [CrossRef] [Green Version]
  40. Brueck, H.; Business Insider. Singapore is Working “Round the Clock” to Find Coronavirus Cases. Lying about Where You’ve Been can Result in 6 Months of Jail or a Fine of up to $10,000. Available online: https://www.businessinsider.com/singapore-coronavirus-quarantine-lying-to-investigators-jail-fine-2020-3?r=US&IR=T (accessed on 5 March 2020).
  41. Carpenter, S. Effects of cultural tightness and collectivism on self-concept and causal attributions. Cross-Cult. Res. 2000, 34, 38–56. [Google Scholar] [CrossRef]
  42. Cao, C.; Li, N.; Liu, L. Do national cultures matter in the containment of COVID-19? Int. J. Sociol. Soc. Policy 2020. [Google Scholar] [CrossRef]
  43. de Kloet, E.R.; Joels, M.; Holsboer, F. Stress and the brain: From adaptation to disease. Nat. Rev. Neurosci. 2005, 6, 463–475. [Google Scholar] [CrossRef]
  44. Siervo, M.; Wells, J.C.; Cizza, G. Contribution of psychosocial stress to the obesity epidemic: An evolutionary approach. Horm. Metab. Res. 2009, 41, 261. [Google Scholar] [CrossRef] [Green Version]
  45. Vinkers, C.H.; van Amelsvoort, T.; Bisson, J.I.; Branchi, I.; Cryan, J.F.; Domschke, K.; van der Wee, N.J. Stress resilience during the coronavirus pandemic. Eur. Neuropsychopharmacol. 2020, 35, 12–16. [Google Scholar] [CrossRef] [PubMed]
  46. Reissman, D.B.; Watson, P.J.; Klomp, R.W.; Tanielian, T.L.; Prior, S.D. Pandemic influenza preparedness: Adaptive responses to an evolving challenge. J. Homel. Secur. Emerg. Manag. 2006, 3, 1–26. [Google Scholar] [CrossRef]
  47. O’Connor, R.; Wetherall, K.; Cleare, S.; McClelland, H.; Melson, A.; Niedzwiedz, C.; Robb, K. Mental health and well-being during the COVID-19 pandemic: Longitudinal analyses of adults in the UK COVID-19 Mental Health & Wellbeing study. Br. J. Psychiatry 2020, 1–8. [Google Scholar] [CrossRef]
  48. Brislin, R.W. Back-translation for cross-cultural research. J. Cross-Cult. Psychol. 1970, 1, 185–216. [Google Scholar] [CrossRef]
  49. Sousa, V.D.; Rojjanasrirat, W. Translation, adaptation and validation of instruments or scales for use in cross-cultural health care research: A clear and user-friendly guideline. J. Eval. Clin. Pract. 2011, 17, 268–274. [Google Scholar] [CrossRef]
  50. Spitzer, R.L.; Kroenke, K.; Williams, J.B.W.; Lowe, B. A brief measure for assessing generalized anxiety disorder. Arch. Int. Med. 2006, 166, 1092–1097. [Google Scholar] [CrossRef] [PubMed] [Green Version]
  51. Spielberger, C.D. Manual for the State-Trait Anxiety Inventory: STAI (Form Y); Consulting Psychologists Press: Palo Alto, CA, USA, 1983. [Google Scholar]
  52. Al-Rabiaah, A.; Temsah, M.H.; Al-Eyadhy, A.A.; Hasan, G.M.; Al-Zamil, F.; Al-Subaie, S.; Somily, A.M. Middle East Respiratory Syndrome-Corona Virus (MERS-CoV) associated stress among medical students at a university teaching hospital in Saudi Arabia. J. Infect. Public Health 2020, 13, 687–691. [Google Scholar] [CrossRef]
  53. Dzhambov, A.M.; Tilov, B.G.; Makakova, D.R.; Dimitrova, D.D. Psychometric properties and contribution to mental health of the Bulgarian version of the 4-factor Ruminative Thought Style Questionnaire. Folia Med. (Plovdiv) 2019, 61, 529–539. [Google Scholar] [CrossRef] [Green Version]
  54. Silva, M.T.; Roa, M.C.; Martins, S.S.; da Silva, A.T.C.; Galvao, T.F. Generalized anxiety disorder and associated factors in adults in the Amazon, Brazil: A population-based study. J. Affect. Disord. 2018, 236, 180–186. [Google Scholar] [CrossRef] [PubMed]
  55. Sidik, S.M.; Arroll, B.; Goodyear-Smith, F. Validation of the GAD-7 (Malay version) among women attending a primary care clinic in Malaysia. J. Prim. Health Care 2012, 4, 5–11. [Google Scholar] [CrossRef]
  56. Esipenko, E.A.; Beloplotova, K.E.; Sharafieva, K.R.; Ismatullina, V.I. Anxiety (personal and spatial among students of different sex as factor of success in decision of spatial dillems. Subj. Pers. Psychol. Self-Regul. 2018, 77–82. (In Russian) [Google Scholar] [CrossRef]
  57. Musumari, P.M.; Tangmunkongvorakul, A.; Srithanaviboonchai, K.; Techasrivichien, T.; Suguimoto, S.P.; Ono-Kihara, M.; Kihara, M. Grit is associated with lower level of depression and anxiety among university students in Chiang Mai, Thailand: A cross-sectional study. PLoS ONE 2018, 13, e0209121. [Google Scholar] [CrossRef] [Green Version]
  58. Bozukluğu, Y.A.; Uyarlaması, T.T.; ve Güvenirliği, G. Validity and reliability study for the Turkish adaptation of the Generalized Anxiety Disorder-7 (GAD-7) scale. Arch. Neuropsychiatry 2013, 50, 53–58. [Google Scholar] [CrossRef]
  59. Bahammam Maha, A. Validity and reliability of an Arabic version of the state-trait anxiety inventory in a Saudi dental setting. Saudi Med. J. 2016, 37, 668–674. [Google Scholar] [CrossRef]
  60. Hanin, Y.L.; Spielberger, C.D. The development and validation of the Russian form of the state-trait anxiety inventory. In Series in Clinical & Community Psychology: Stress & Anxiety; HarperCollins: New York, NY, USA, 1980; pp. 15–26. [Google Scholar]
  61. Sipos, K.; Sipos, M. The development and validation of the Hungarian form of the state-trait anxiety inventory. In Series in Clinical & Community Psychology: Stress & Anxiety; HarperCollins: New York, NY, USA, 1980; pp. 27–39. [Google Scholar]
  62. Moreno, E.; Muñoz-Navarro, R.; Medrano, L.A.; González-Blanch, C.; Ruiz-Rodríguez, P.; Limonero, J.T.; Moretti, L.S.; Cano-Vindel, A.; Moriana, J.A. Factorial invariance of a computerized version of the GAD-7 across various demographic groups and over time in primary care patients. J. Affect. Disord. 2019, 252, 114–121. [Google Scholar] [CrossRef]
  63. Uz, I. The index of cultural tightness and looseness among 68 countries. J. Cross-Cult. Psychol. 2015, 46, 319–335. [Google Scholar] [CrossRef]
  64. Moore, M.; Gelfeld, B.; Okunogbe, A.; Paul, C. Identifying Future Disease Hot Spots. Infectious Disease Vulnerability Index; RAND Corporation: Santa Monica, CA, USA, 2016; p. 81. [Google Scholar] [CrossRef]
  65. Ahmad, S.; Hussain, S.; Shah, F.S.; Akhtar, F. Urdu translation and validation of GAD-7: A screening and rating tool for anxiety symptoms in primary health care. J. Pak. Med. Assoc. 2017, 67, 1536–1540. [Google Scholar]
  66. Baxter, A.J.; Vos, T.; Scott, K.M.; Norman, R.E.; Flaxman, A.D.; Blore, J.; Whiteford, H.A. The regional distribution of anxiety disorders: Implications for the Global Burden of Disease Study, 2010. Int. J. Methods Psychiatr. Res. 2014, 23, 422–438. [Google Scholar] [CrossRef]
  67. Byrd-Bredbenner, C.; Eck, K.; Quick, V. Psychometric properties of the generalized anxiety disorder-7 and generalized anxiety disorder-mini in United States university students. Front. Psychol. 2020, 11, 2512. [Google Scholar] [CrossRef] [PubMed]
  68. Jaehn, P.; Bobrova, N.; Saburova, L.; Kudryavtsev, A.V.; Malyutina, S.; Cook, S. The relation of gender role attitudes with depression and generalised anxiety disorder in two Russian cities. J. Affect. Disord. 2020, 264, 348–357. [Google Scholar] [CrossRef] [PubMed]
  69. Stone, A.A.; Schwartz, J.E.; Broderick, J.E.; Deaton, A. A snapshot of the age distribution of psychological well-being in the United States. Proc. Natl. Acad. Sci. USA 2010, 107, 9985–9990. [Google Scholar] [CrossRef] [PubMed] [Green Version]
  70. Parkerson, H.A.; Thibodeau, M.A.; Brandt, C.P.; Zvolensky, M.J.; Asmundson, G.J. Cultural-based biases of the GAD-7. J. Anxiety Disord. 2015, 31, 38–42. [Google Scholar] [CrossRef] [PubMed]
  71. Kessler, R.C.; Ruscio, A.M.; Shear, K.; Wittchen, H.-U. Epidemiology of anxiety disorders. In Behavioral Neurobiology of Anxiety and its Treatment, Current Topics in Behavioral Neurosciences; Stein, M.B., Steckler, V.T., Eds.; Springer: Berlin/Heidelberg, Germany, 2010; pp. 21–35. [Google Scholar]
  72. Baxter, A.J.; Scott, K.M.; Vos, T.; Whiteford, H.A. Global prevalence of anxiety disorders: A systematic review and metaregression. Psychol. Med. 2013, 43, 897–910. [Google Scholar] [CrossRef] [PubMed]
  73. Archer, J.A.; Lim, Z.M.T.; Teh, H.C.; Chang, W.C.; Chen, S.H.A. The effect of age on the relationship between stress, well-being and health in a Singaporean sample. Ageing Int. 2015, 40, 413–425. [Google Scholar] [CrossRef]
  74. Feizi, A.; Aliyari, R.; Roohafza, H. Association of perceived stress with stressful life events, lifestyle and sociodemographic factors: A large-scale community-based study using logistic quantile regression. Comput. Math. Methods Med. 2012, 151865. [Google Scholar] [CrossRef]
  75. Cohen, S.; Wills, T.A. Stress, social support, and the buffering hypothesis. Psychol. Bull. 1985, 98, 310–357. [Google Scholar] [CrossRef]
  76. Odriozola-Gonzalez, P.; Planchuelo-Gomez, A.; Irurtia-Muniz, M.J.; de Luis-Garcıa, R. Psychological symptoms of the outbreak of the COVID-19 crisis and confinement in the population of Spain. PsyArXiv 2020. [Google Scholar] [CrossRef]
  77. Tian, F.; Li, H.; Tian, S.; Yang, J.; Shao, J.; Tian, C. Psychological symptoms of ordinary Chinese citizens based on SCL-90 during the level I emergency response to COVID-19. Psychiatry Res. 2020, 288, 112992. [Google Scholar] [CrossRef]
  78. Steptoe, A.; Wardle, J. Locus of control and health behaviour revisited: A multivariate analysis of young adults from 18 countries. Br. J. Psychol. 2001, 92, 659–672. [Google Scholar] [CrossRef]
  79. Cheng, C.; Cheung, S.F.; Chio, J.H.; Chan, M.P. Cultural meaning of perceived control: A meta-analysis of locus of control and psychological symptoms across 18 cultural regions. Psychol. Bull. 2013, 139, 152–188. [Google Scholar] [CrossRef] [Green Version]
  80. Chiao, J.Y.; Blizinsky, K.D. Culture–gene coevolution of individualism–collectivism and the serotonin transporter gene. Proc. R. Soc. B 2010, 277, 529–537. [Google Scholar] [CrossRef] [PubMed] [Green Version]
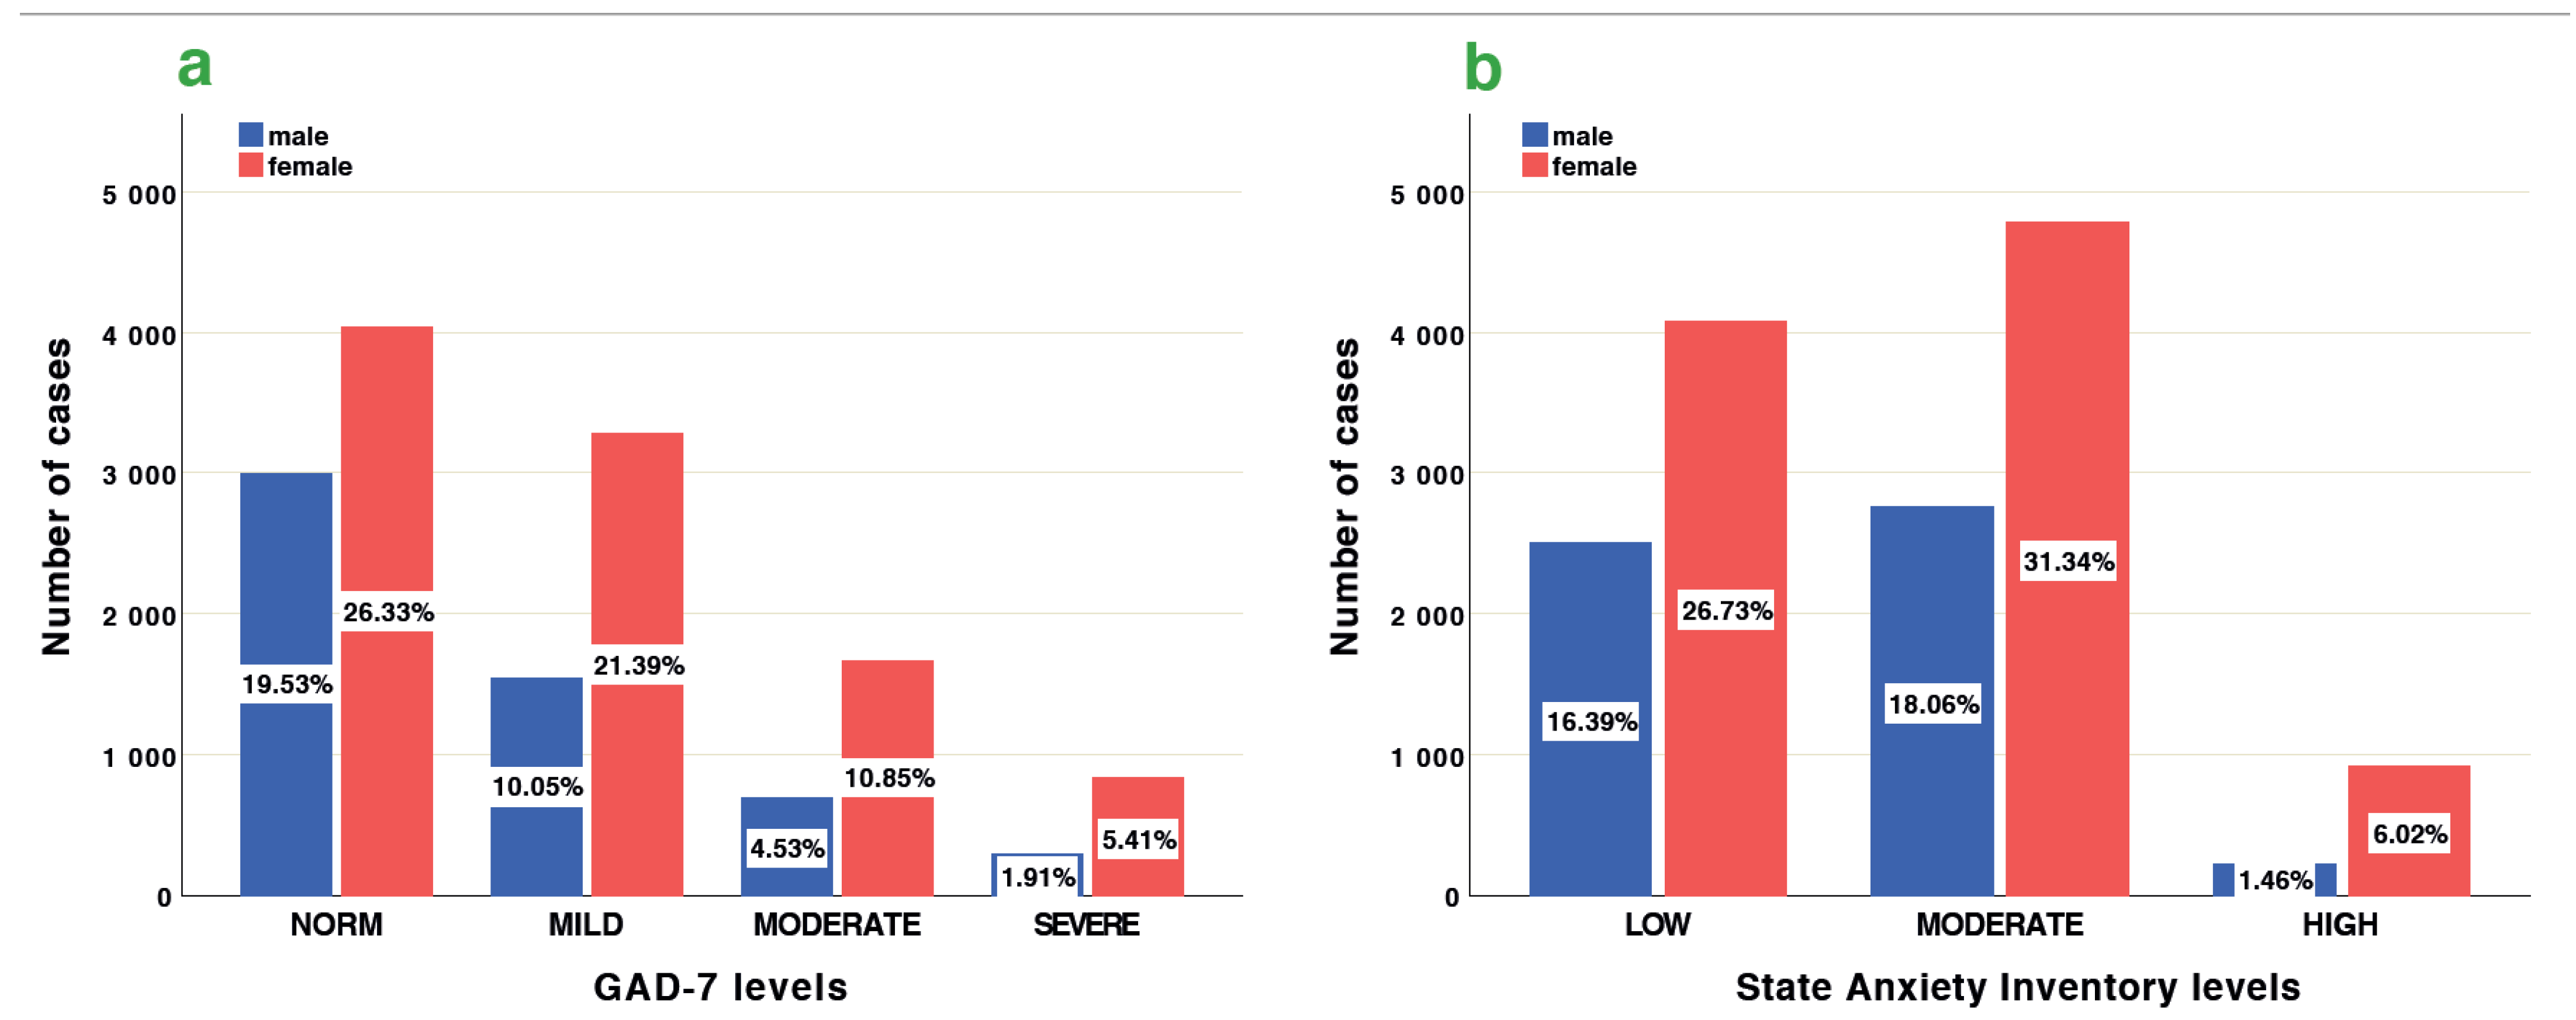
Figure 1. Sex differences of levels on GAD-7 (a) and SAI (b).
Sustainability 13 04017 g001
Figure 2. Levels of GAD-7 (a) and SAI (b) across 23 countries during first wave of COVID-19.
Sustainability 13 04017 g002
Figure 3. Association between individualism and GAD-7 (a), and SAI (b) across 23 countries.
Sustainability 13 04017 g003
Figure 4. Association between power distance and GAD-7 (a), and SAI (b) across 23 countries.
Sustainability 13 04017 g004
Figure 5. Association between Infectious Disease Vulnerability Index GAD-7 (a), and SAI (b) across 23 countries.
Sustainability 13 04017 g005
Figure 6. Association between Tightness score and GAD-7 (a), SAI, (b) across 23 countries (Figure 6 shows only those countries for which the Tightness index was available [39]).
Sustainability 13 04017 g006
Figure 7. Association between CTL and GAD-7 (a), SAI (b) across 23 countries (Note that in the case of the Gelfand’s index, the tightness increases along the x axis, in Uz’s study, the direction goes to the opposite—from tight to loose countries).
Sustainability 13 04017 g007
Figure 8. Differences in cohabitation/loneliness depending on GAD-7 (a) and SAI (b) across 23 countries.
Sustainability 13 04017 g008
Figure 9. Association between age and GAD-7 (a), SAI (b) across total sample.
Sustainability 13 04017 g009
Figure 10. Association between GAD-7 (a), SAI (b) and age depending on cohabitation/loneliness across total sample.
Sustainability 13 04017 g010
Table 1. Distribution of sample by country, sex 1 and age.
COUNTRYSurvey LanguageTotal NSEXMean Age
MenWomen(±SD)
ARMENIAArmenian3327620.45 (±2.37)
BELARUSRussian33814319519.20 (±2.85)
BRAZILPortuguese5158243038.80 (±13.78)
BULGARIABulgarian32212919328.34 (±8.75)
CANADAEnglish69244624630.33 (±8.74)
CROATIAEnglish2757120424.10 (±8.40)
HUNGARYHungarian2353519831.95 (±11.84)
INDIAEnglish38321317029.95 (±9.85)
INDONESIAIndonesian93050442432.05 (±12.09)
IRANPersian3068821733.68 (±7.34)
IRAQArabic173888535.03 (±10.63)
ITALYItalian2534420823.50 (±4.15)
JORDANArabic44912132833.68 (±10.52)
MALAYSIAMalay108747860933.19 (±11.12)
NIGERIAEnglish31621410234.09 (±11.24)
PAKISTANEnglish48421227227.06 (±11.11)
ROMANIARomanian2694222636.22 (±10.94)
RUSSIARussian1903486141720.99 (±4.72)
SAUDI ARABIAArabic4149831626.76 (±9.72)
TANZANIAEnglish34118515623.95 (±4.25)
TURKEYTurkish47171609309327.57 (±10.84)
THAILANDThai3004925032.82 (±13.00)
USAEnglish66618947745.16 (±17.15)
TOTAL 15,3755553982229.15 (±11.80)
1 Data on biological sex (not their gender identity) of respondents are presented.
Table 2. Dates of Data Collection.
COUNTRYStart DateEnd Date Median
ARMENIA8 June 202021 June 202011 June 2020
BELARUS29 April 202021 June 20207 May 2020
BRAZIL15 May 202027 July 202010 June 2020
BULGARIA18 May 202030 June 202023 June 2020
CANADA13 May 202024 May 202016 May 2020
CROATIA18 May 202027 August 202017 July 2020
HUNGARY30 June 202008 August 202022 May 2020
INDIA16 May 202031 August 202016 May 2020
INDONESIA3 June 202014 August 202023 June 2020
IRAN21 May 202017 July 202028 May 2020
IRAQ7 June 202014 July 20208 June 2020
ITALY4 June 202029 November 202012 June 2020
JORDAN1 June 202013 June 20201 June 2020
MALAYSIA12 May 202022 July 202010 June 2020
NIGERIA4 May 20209 August 202031 May 2020
PAKISTAN13 May 20203 August 202021 May 2020
ROMANIA18 May 202031 August 20205 June 2020
RUSSIA2 May 20208 August 20205 May 2020
SAUDI ARABIA22 May 202020 June 202030 May 2020
TANZANIA1 May 20201 July 202026 June 2020
TURKEY23 May 202016.07.20206 June 2020
THAILAND12 May 202030 May 202014 May2020
USA19 May 202030 August 202010 June 2020
TOTAL 5 June 2020
Table 3. Sex differences in Generalized Anxiety Disorder Scale (GAD-7) and the State Anxiety Inventory (SAI) across countries.
COUNTRYScalesSexNmeanMtdfP95% CIEffect Size
(Hedges’ Correction) *
LowerUpper
ARMENIAGAD-7men
women
27
6
5.81
4.00
0.808310.425−2.7676.3970.356
SAImen
women
27
6
30.93
26.17
0.847310.403−6.70116.2190.373
BELARUSGAD-7men
women
143
195
5.10
6.46
−2.7023360.007−2.344−0.369−0.297
SAImen
women
143
195
29.01
32.43
−3.0553360.002−5.617−1.217−0.336
BRAZILGAD-7men
women
82
430
7.99
8.49
−0.8001260.425−1.7380.737−0.087
SAImen
women
82
430
36.27
39.94
−2.5135100.012−6.541−0.801−0.302
BULGARIAGAD-7men
women
129
193
5.87
7.32
−2.8213080.005−2.467−0.440−0.307
SAImen
women
129
193
26.18
30.48
−3.3253140.001−6.842−1.755−0.358
CANADAGAD-7men
women
420
239
7.75
8.71
−2.2096570.028−1.812−0.107−0.179
SAImen
women
382
227
31.03
33.18
−2.4036070.017−3.902−0.393−0.201
CROATIAGAD-7men
women
71
204
6.44
7.77
−2.0562730.041−2.610−0.056−0.282
SAImen
women
71
204
24.61
29.61
−3.0492730.003−8.249−1.774−0.419
HUNGARYGAD-7men
women
35
198
3.69
5.16
−1.7842310.076−3.0960.154−0.326
SAImen
women
35
198
24.83
28.73
−1.7502310.081−8.2990.491−0.320
INDIAGAD-7men
women
213
170
5.37
6.79
−2.8223810.005−2.413−0.431−0.290
SAImen
women
213
170
30.23
33.54
−3.5533810.0004−5.151−1.481−0.365
INDONESIAGAD-7men
women
504
424
3.27
5.59
−7.797828<0.001−2.912−1.741−0.521
SAImen
women
504
424
26.48
30.47
−5.617926<0.001−5.380−2.594−0.370
IRANGAD-7men
women
88
217
5.57
5.77
−0.3733030.710−1.2940.882−0.047
SAImen
women
88
217
34.75
35.00
−0.6563030.513−1.0190.510−0.083
IRAQGAD-7men
women
88
85
8.81
9.52
−0.9441710.347−2.1970.776−0.143
SAImen
women
88
85
31.16
33.74
−1.7261710.086−5.5350.371−0.261
ITALYGAD-7men
women
44
208
6.09
7.96
−2.7122500.007−3.229−0.512−0.449
SAImen
women
44
208
35.20
39.05
−2.1522500.032−7.371−0.326−0.356
JORDANGAD-7men
women
121
328
4.94
7.13
−4.326447<0.001−3.174−1.191−0.459
SAImen
women
121
328
26.43
29.06
−2.3054470.022−4.875−0.388−0.245
MALAYSIAGAD-7men
women
478
609
2.68
3.54
−3.48410720.001−1.337−0.374−0.329
SAImen
women
477
609
28.98
27.57
2.26710640.0240.1892.6270.137
NIGERIAGAD-7men
women
214
102
3.98
5.26
−2.0031580.047−2.549−0.018−0.265
SAImen
women
214
102
24.77
25.51
−0.5723140.567−3.2781.801−0.069
PAKISTANGAD-7men
women
212
272
5.20
6.90
−3.624482<0.001−2.631−0.781−0.331
SAImen
women
212
272
28.20
32.72
−4.282482<0.001−6.592−2.445−0.392
ROMANIAGAD-7men
women
42
226
4.12
5.79
−2.1382660.033−3.205−0.132−0.358
SAImen
women
42
226
21.45
24.19
−1.3952660.164−6.6121.127−0.234
RUSSIAGAD-7men
women
486
1417
3.80
5.71
−7.951938<0.001−2.381−1.438−0.394
SAImen
women
486
1417
25.34
29.47
−6.7611901<0.001−5.335−2.936−0.355
SAUDI ARABIAGAD-7men
women
98
316
5.40
5.55
−0.2904120.772−1.2110.899−0.034
SAImen
women
98
316
26.15
27.34
−0.8434120.400−3.9491.578−0.097
TANZANIAGAD-7men
women
185
156
4.39
5.65
−2.3043390.022−2.332−0.184−0.250
SAImen
women
185
156
32.43
33.25
−1.2613390.208−2.1070.461−0.137
THAILANDGAD-7men
women
49
250
3.33
4.20
−1.679880.097−1.8980.159−0.212
SAImen
women
49
250
28.59
31.01
−1.8642970.063−4.9670.134−0.291
TURKEYGAD-7men
women
1609
3093
5.76
7.42
−11.4123473<0.001−1.942−1.372−0.354
SAImen
women
1609
3093
32.14
33.74
−6.8363718<0.001−2.057−1.140−0.200
USAGAD-7men
women
189
477
5.85
6.52
−1.4476640.148−1.5870.241−0.124
SAImen
women
184
461
25.80
27.72
−1.6206430.106−4.2480.4070.141
TOTAL
SAMPLE
GAD-7men
women
5527
9815
5.10
6.55
−17.62012,056<0.001−1.614−1.288−0.292
SAImen
women
5483
9787
29.34
31.65
−13.13311,997<0.001−2.655−1.965−0.216
N—number of cases, t—test statistics, df—degrees of freedom, p—statistical significance, NS—not significant, CI—Confidence Interval of the Difference. * Hedges’ g, which provides a measure of effect size weighted according to the relative size of each sample, is an alternative where there are different sample sizes.
Table 4. Differences in anxiety scales depending on cohabitation/loneliness across total sample.
ScalesCohabitation/
Loneliness
NMeantdfP95% CIEffect Size
LowerUpper
GAD-7live with others
live alone
13,889
1408
6.08
5.61
3.32815295<0.0010.1930.7450.093
SAIlive with others
live alone
13,830
1397
30.88
30.46
1.37615,225NS−0.1751.0010.039
N—number of cases, t—test statistics, df—degrees of freedom, p—statistical significance, NS—not significant, CI—Confidence Interval of the Difference.
Table 5. GLM ANCOVA analyses with GAD-7 and SAI as dependent variables, and sex, country and cohabitation/loneliness as independent predictors, with age as a covariate for the whole sample.
PredictorsDependent VariabledfFpη2
SexGAD-7134.961<0.0010.002
SAI114.199<0.0010.001
cohabitation/lonelinessGAD-712.8080.0940.000
SAI10.1990.6560.000
sex × cohabitation/lonelinessGAD-710.1090.7420.000
SAI10.9460.3310.000
CountryGAD-7227.770<0.0010.011
SAI229.566<0.0010.014
AgeGAD-7126.639<0.0010.002
SAI121.149<0.0010.001
country × ageGAD-7224.921<0.0010.007
SAI226.245<0.0010.009
cohabitation/loneliness × countryGAD-7211.1920.2460.002
SAI211.8350.0110.003
sex × countryGAD-7221.3570.1220.002
SAI223.875<0.0010.006
cohabitation/loneliness × ageGAD-713.5620.0590.000
SAI10.0220.8830.000
sex × ageGAD-7114.066<0.0010.001
SAI10.9970.3180.000
R2 (GAD-7) = 0.127; R2 (SAI) = 0.131. R2—R Squared. df—degrees of freedom. F—F test statistics. p—statistical significance. η2—Partial Eta Squared effect size.
Table 6. The data of studies of GAD-7 before pandemic COVID-19.
CountriesSample: N (age)GAD-7 *GAD-7 MenGAD-7 WomenPresent StudySource
Bulgaria529 (21.00)3.0 (median) 6.0 (median)[53]
Brazil4001 (18–60)2.2% severe level--17% severe level[54]
Canada610 (21.35)5.82 (mean) 8.23[70]
Malaysia895 (30.9 ± 10.4)7.8% moderate and severe levels--10% moderate and severe levels[55]
Pakistan285 (16–80)5.18 (mean)--6.05[65]
Russia132 (18–46)3.35 (mean)3.513.194.76 (3.80; 5.71)[56]
Thailand800 (18–24)3.78 (mean)
7.8% moderate and severe levels
3.653.913.77 (3.33; 4:20)
11% moderate and severe levels
[57]
Turkey134 (34.67 ± 12.55)6.11 (mean)--6.59[58]
Saudi Arabia200 (21.6)
medical students during MERS-CoV 2014
192 (20.50 ± 1.96)
5.09 (mean)
0% severe level
-
4.56
5.26
5.61
-
5.48 (5.40;5.55)[52]
USA
2009–2010
2015
2018–2019
2740 (47.4 ± 15.5)
447 (23.43)
1897 (19.60 ± 1.62)
426 (20.19 ± 1.82)
1805 (20.44 ± 1.47)
4.68% severe level
5.06 (mean)
5.71 (mean)
6.28 (mean)
7.45 (mean)
-
-
4.84
5.99
6.09
-
-
6.57
8.34
8.81
11% severe level
6.19 (mean)
[50]
[70]
[67]
* we provide data (means, medians, percentages) that can be used to compare with our data.
Publisher’s Note: MDPI stays neutral with regard to jurisdictional claims in published maps and institutional affiliations.