Article

Research on Industry Development Path Planning of Resource-Rich Regions in China from the Perspective of “Resources, Assets, Capital”

1
School of Earth Sciences and Resources, China University of Geosciences (Beijing), Beijing 100083, China
2
Institute of Science and Development, Chinese Academy of Sciences, Beijing 100190, China
3
Guangxi Bureau of Geology & Mineral Prospecting and Exploitation, Nanning 530023, China
*
Author to whom correspondence should be addressed.
Sustainability 2021, 13(7), 3988; https://doi.org/10.3390/su13073988
Submission received: 24 February 2021 / Revised: 29 March 2021 / Accepted: 31 March 2021 / Published: 2 April 2021
(This article belongs to the Section Sustainable Urban and Rural Development)

Abstract

:
The development of industries in China’s resource-rich regions is mainly affected by resource reserves, environmental protection, and industrial structural adjustment. The development of resource-oriented industries that can’t support a high-quality regional economy is large but not well developed. This article considers China’s resource product imports and exports, carbon emissions, and industrial structure ratio factors in recent years. It is believed that China’s resource-rich regions have macro-level development bottlenecks, and the general development of a resource-based industries path is proposed based on the perspective of “resources, assets, and capital”. Taking Guangxi Zhuang Autonomous Region as an empirical case, this article analyzes the pattern of regional industrial development by using the input-output method, calculates the degree of inter-industrial correlation, and constructs a regional industrial development system. The results show the following: 1. China’s overall industrial development pattern has undergone major changes; 2. emerging industries and service-oriented industries have risen in development status, and although resource-based industries have a weaker development momentum, they still have an important position; 3. the hierarchical industry development management model is helpful for forming a regional circular economy innovation development pattern. The results also indicate that the integrated management of “resources, assets, and capital” has a positive effect on the development of resource-based industries in resource-rich regions, which affects the overall industrial development pattern of the region and promotes economic development.

1. Introduction

The resource-oriented industry is an important pillar of urban economic and social construction, and its industrial development occupies a more core position for resource-rich regions. Experts in the fields of resources, the environment, and economic management have studied the development of resource industries and resource-based cities, hoping to realize the sustainable development of resource industries and resource-based cities by solving the multiple bottlenecks of resource reserves, environmental protection, and urban industrial structure adjustment.
The resource industry, which is greatly affected by regional policies and market environments, is an important growth pole for regional economic development, and it is also a potential factor causing cross-regional economic disputes [1,2]. The regions with better development of resource industries often show a state of economic backwardness and low population density [3,4]. The “resource curse” is a key issue that restricts the sustainable development of the resource industry. Although natural resource wealth can promote the development of the primary industry sector and its downstream to a certain extent, from the perspective of development economics, excessive reliance on resource advantages will restrict the development of industrial modernization [5,6]. The current research on the resource industry is oriented towards green innovation, and in order to optimize the resource industry chain and implement green transformation, many works have been done through the improvement of engineering, technology, and knowledge services, while rational tax rates have been put forward from the perspective of policy to construct a resource industry circular economy system [7,8,9,10]. The whole-life-cycle control of resource production activities is realized on the basis of resource exploration and development evaluation, and information collection for the development, production, and recycling process are proposed to avoid the generation of waste in the processing of resource-based products [11,12,13,14]. Some experts believe that the competitiveness of various links in the industry chain should be considered based on the perspective of the global trade pattern, and the resource industry should be integrated into global competition to leverage the competitive advantages of resource-based products in multiple channels and fields [15,16].
As the main body of the resource industry, resource-based cities have some prominent problems, such as the resource curse, ecological fragility, and so on. Through a literature review and quantitative analysis, it is found that resource-based cities have poor social stability, and ecological fragility research is an important basis for their sustainable development, ecological civilization construction, and regional coordinated development [17,18,19,20]. Research on green development levels, livability evaluations, and land use are the hot spots of resource-based city development planning. The realization of resource-based city urbanization can effectively solve these kinds of problems, and a comprehensive evaluation index system must be constructed from the three aspects of society, economy, and environment [21,22,23,24,25]. At present, the development of urban industry is facing structural adjustment, and the traditional resource-oriented industries lack momentum, while emerging industries and the tertiary industry are poised to take off. In the new era, resource-based cities must be guided by reform. The government should give full play to the comparative advantages of resource endowment; reduce the impact of pollution emissions on sustainable urban development, while ensuring the basic supply of people’s livelihoods; and facilitate the development of green industries [26,27,28,29,30]. Studies have found that the bottleneck restricting the development of resource-based cities is mainly due to weak economic foundations, the fixed development model, and policy orientation. To realize the sustainable development of resource-based industries, the economic level, industrial structure, resource endowments, energy prices, and government intervention should be considered in all aspects [31,32,33,34,35]. At the same time, the correlation measurement between industrial sectors helps to measure the degree of economic integration, so as to further discover the interrelationships between different economic and social factors [36,37]. Investing limited resources in specific industries can accelerate the development of an industry in a short time, but it will also lead to an imbalance in the industrial structure. A rent-seeking-led economic strategy will lead to the Dutch disease of the resource industry and the chain stress response [38,39]. Heuristic algorithm, process control, location quotient analysis, CGE (Computable General Equilibrium), and input-output methods are often used in the optimization of production activities and economic analysis cases in resource-based cities [40,41,42,43,44]. In the middle and late stage of industrial reform of resource-based cities, it is necessary to continuously analyze the information of urban green development and evaluate and improve the degree of urban sustainable development in real time; a TPM (Total Productive Management) system should be built for high-quality economic and social development [45,46,47,48].
To realize the sustainable development of resource industries in resource-rich regions, we must reasonably deal with resource curses and environmental regulations. Predecessors’ research results mainly achieve the improvement of some problems from the micro level, but rarely integrate factors such as policies, business strategies, production activities, and the environment. This article uses macroeconomic analysis methods to find out the bottleneck that restricts the development of regional industries in resource-rich regions; builds an integrated management model of resources, assets, and capital; and uses a combination of qualitative and quantitative methods to plan regional sustainable development paths. The purpose of our design of this research is to solve the problem of China’s resource-rich regional development caused by policy and the objective environment. The circular economy system between regional industries can also provide ideas for developing countries to avoid the imbalance of industrial development that is generally faced by them.

2. The Development Status of China’s Resource Industry

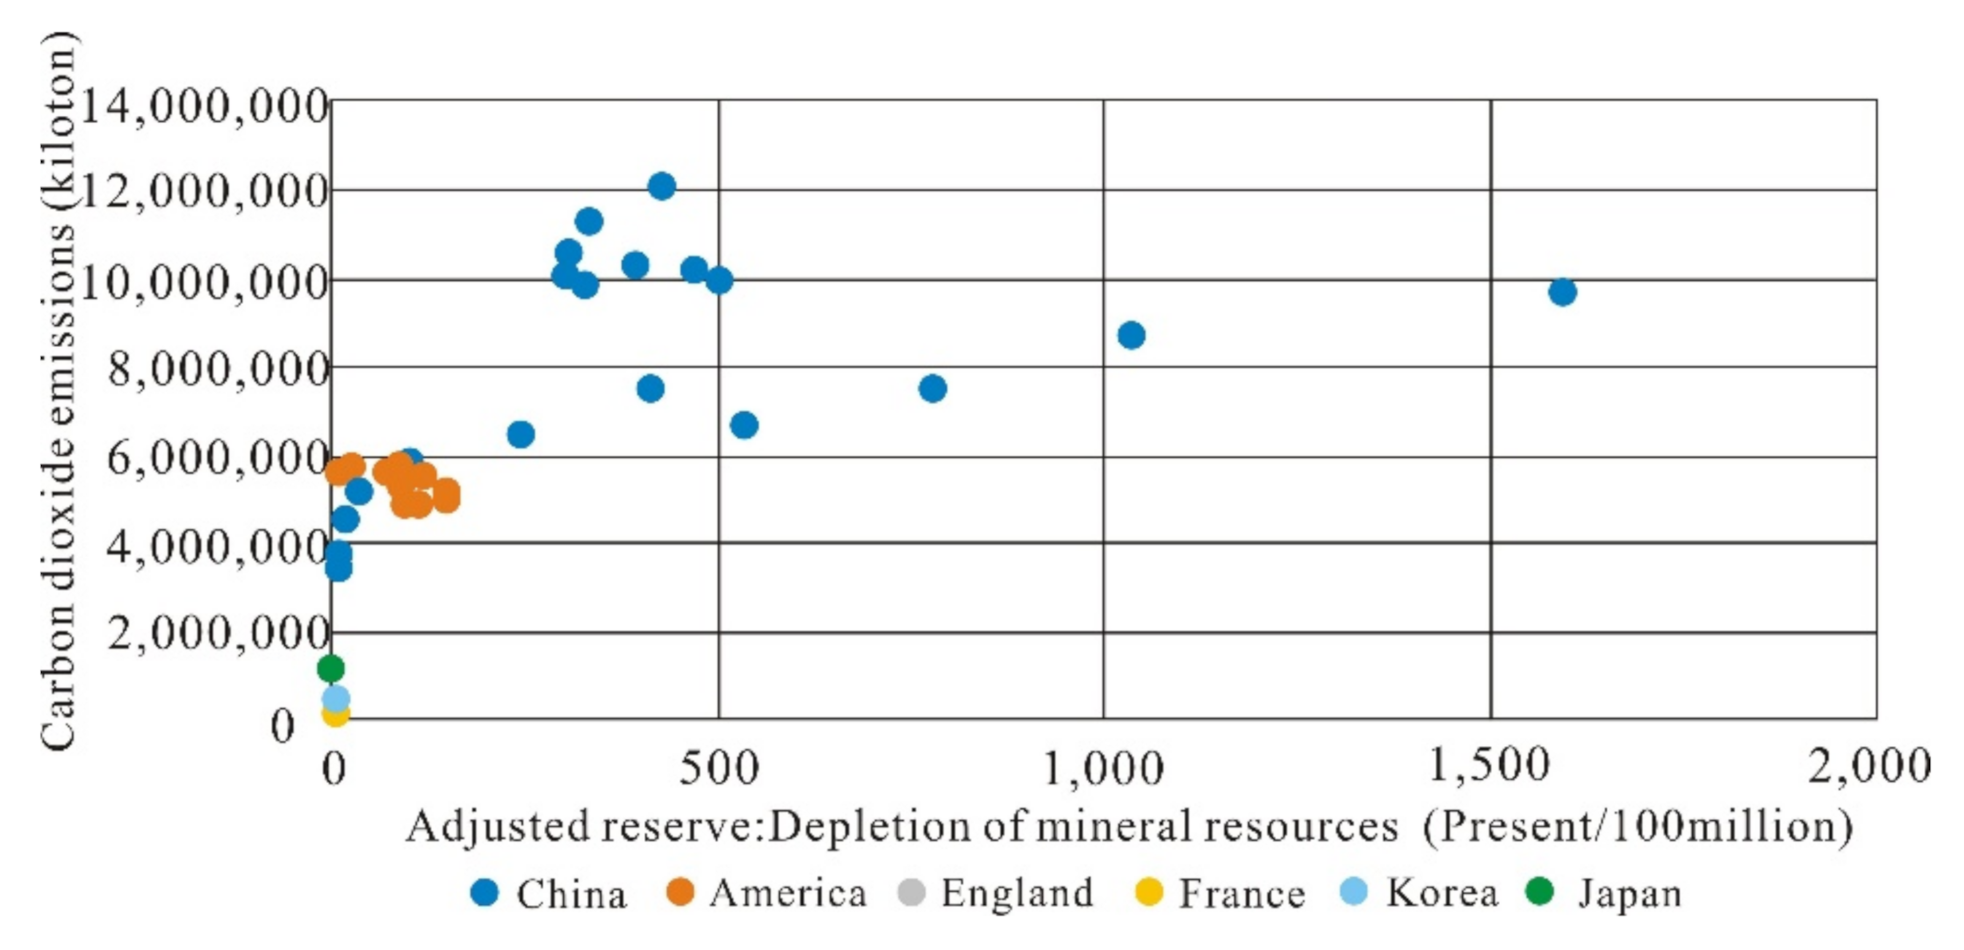
2.1. Resource Reserves and Environmental Constraints

In 2019, China’s reserves of natural gas, shale gas, lead ore, zinc ore, bauxite, molybdenum ore, silver ore, magnesite, graphite, and other mineral resources increased significantly. New progress was made in the dynamic assessment of petroleum, natural gas, and other mineral resources, but it is still at a relatively low level in the world. From a global perspective, the proportion of world imports of ore and metals is greater than the proportion of exports. China’s trade surplus in goods imports and exports has gradually expanded from 2010 to 2019, but the proportion of ore and metal imports in goods imports far exceeds their exports. In comparison, the export value of this product is lower than the world average, and its import value accounts for a larger proportion. China’s ore and metal products are highly dependent on foreign sources, and there is a large gap in demand for mineral resources.
In order to reflect the relationship between China’s mineral resource consumption and environmental damage, and to compare it with developed countries in the world, the depletion of mineral resources and total carbon emissions are selected for comparative research. From the scatter plot in Figure 1, it can be found that China’s mineral resource depletion was higher than that of economically developed countries such as the United States, the United Kingdom, and France from 2000 to 2019, and the total carbon emissions were also higher than these countries. The limited impact of emissions indicates that in the process of economic construction in China, the loss of mineral resources and total carbon emissions are positively correlated. With reference to the development experience of economically developed countries, the loss of mineral resources and total carbon emissions will continue declining as the industrial structure continues to transform, and the environmental pressure of China’s resource industry is still relatively high.

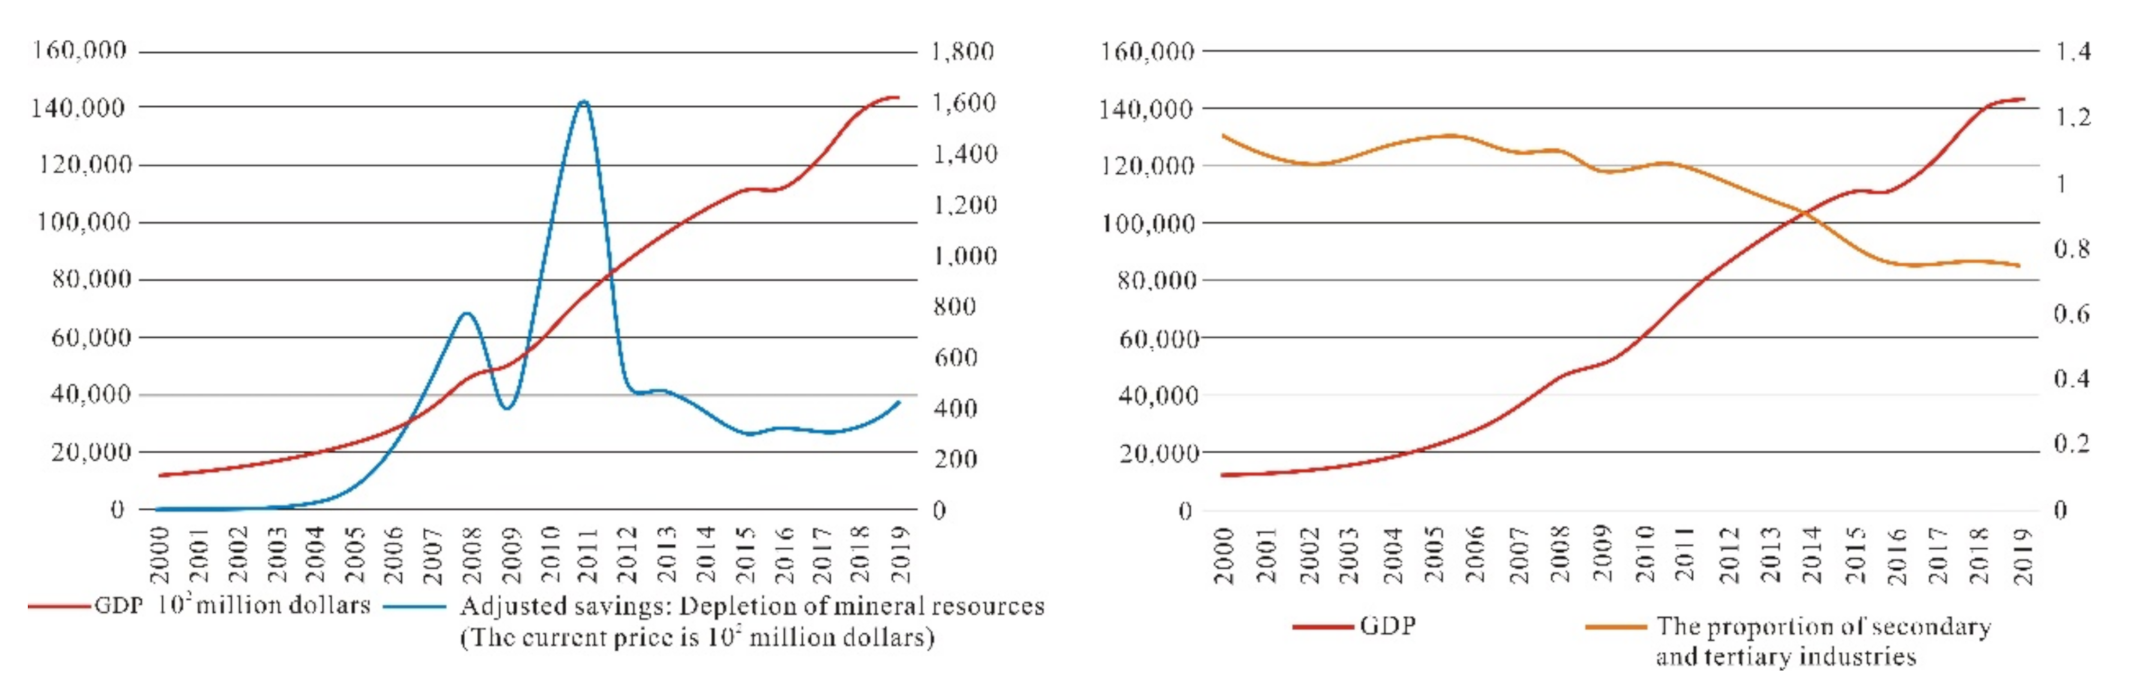
2.2. The Impact of the Resource Industry on China’s Industrial Structure

China’s resource industry is heavily restricted by reserves and environmental protection, but it is still operating at a high level. The development of the resource industry accounts for a large proportion of China’s industrial structure, and the GDP of resource-rich regions accounts for a large proportion of the total value of the country. The resource industry is an important guarantee for the national economy and an important support for China’s economy in the early days of the founding of the People’s Republic of China. It has accelerated China’s economic development and infrastructure construction to a certain extent, but as the dual constraints of resource reserves and environmental protection have tightened, and technology has also continued progress, the resource industry has begun to develop towards innovation, while the proportion of the resource industry in China’s industrial development structure has gradually decreased, and the ratio between the secondary and tertiary industries is also constantly changing (Figure 2).
It can be seen from Figure 2 that China’s GDP has been increasing at a relatively high rate since 2000, and the amount of mineral resource depletion has fluctuated. Compared with GDP, it accounts for a small proportion and has no detailed impact on the GDP growth rate. The ratio between the secondary and the tertiary industries indicates that in the process of industrial structure adjustment, the proportion of the secondary industry in China has decreased year by year, and the transition to the tertiary industry has begun while it is still at a relatively high level. GDP and the proportions of the secondary and the tertiary industries are obviously negatively correlated. The resource industry is an important part of China’s secondary industry, and its consumption of mineral resources can be seen to be simultaneously reduced. The secondary industry represented by the resource industry has begun to transform, while the tertiary industry has flourished, and the GDP has maintained a high rate of growth.

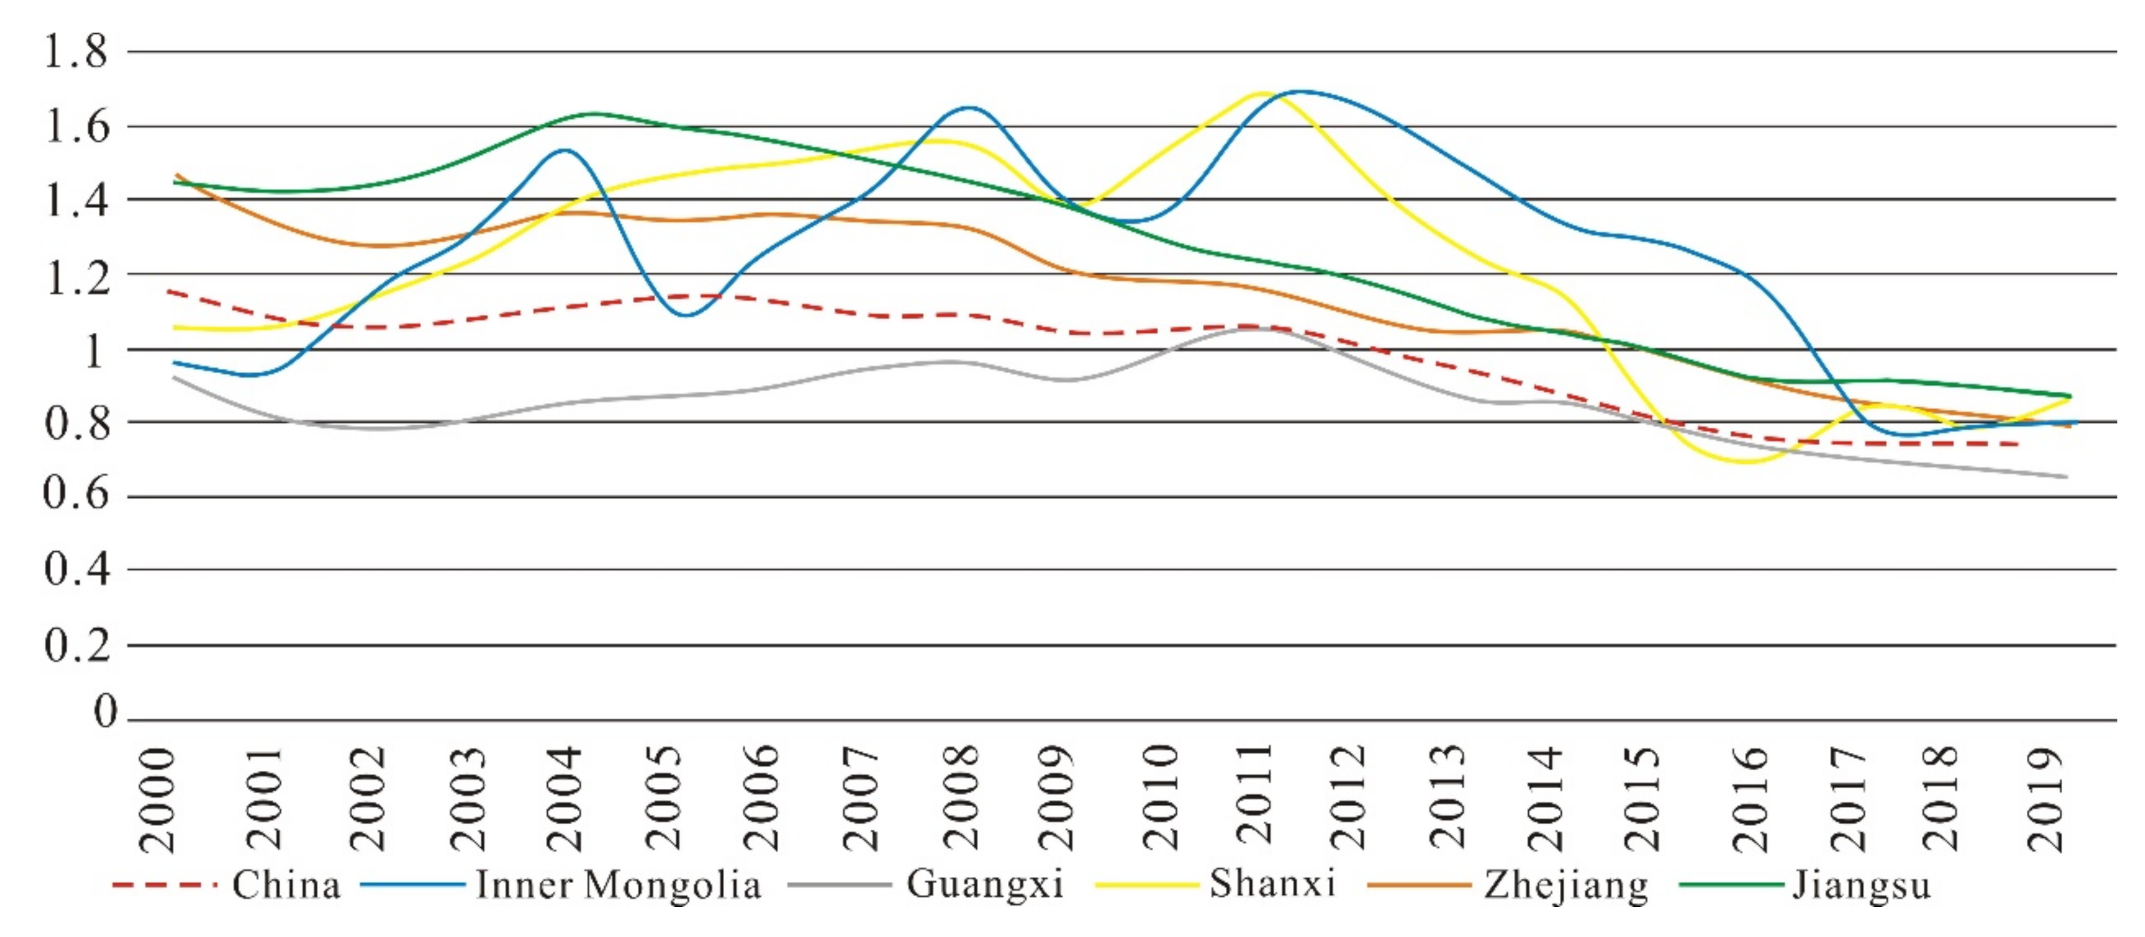
2.3. The Development Status of China’s Resource-Rich Areas

Affected by plate movement, China’s regional mineralization conditions are quite different. The resources in North China are mainly coal and rare earths, the western region is rich in oil and gas resources, the southwestern region is at the forefront of non-ferrous metal resource reserves, and the southeast region is resource reserves. Therefore, based on the difference in spatial distribution, there is a big difference in the emphasis of resource-rich regions on the development of resource industries. The common point is that they are supported by the resource industry to promote the diversified development of regional economies. From the perspective of industrial development trends, it is mainly the adjustment of the secondary and tertiary industrial structure. This article selects resource-rich regions such as the Inner Mongolia Autonomous Region, Guangxi Zhuang Autonomous Region, and Shanxi Province, and combines the industrial adjustments in Jiangsu and Zhejiang to compare the secondary and tertiary industrial structure of China from 2000 to 2019. The proportion change trend (Figure 3) shows that the ratio of the secondary and tertiary industry in China and its resource-rich regions reveals a downward trend in general, indicating that the secondary industry is shrinking and the tertiary industry is gradually emerging. After 2000, the proportion of secondary and tertiary industries in resource-rich regions has rebounded. Thanks to the national policy’s care, the development of the resource industry is facing a “golden decade”, and the proportion of the secondary and tertiary industries nationwide has not rebounded significantly. However, constrained by resource reserves and environmental protection requirements after 2012, the country has shown a sharp decline. The transformation speed of secondary and tertiary industries in resource-rich regions is higher than the national index. The industrial adjustment in resource-rich regions has entered a period of acceleration, and volatile changes have weakened.

3. Industrial Development Path Planning in Resource-Rich Regions

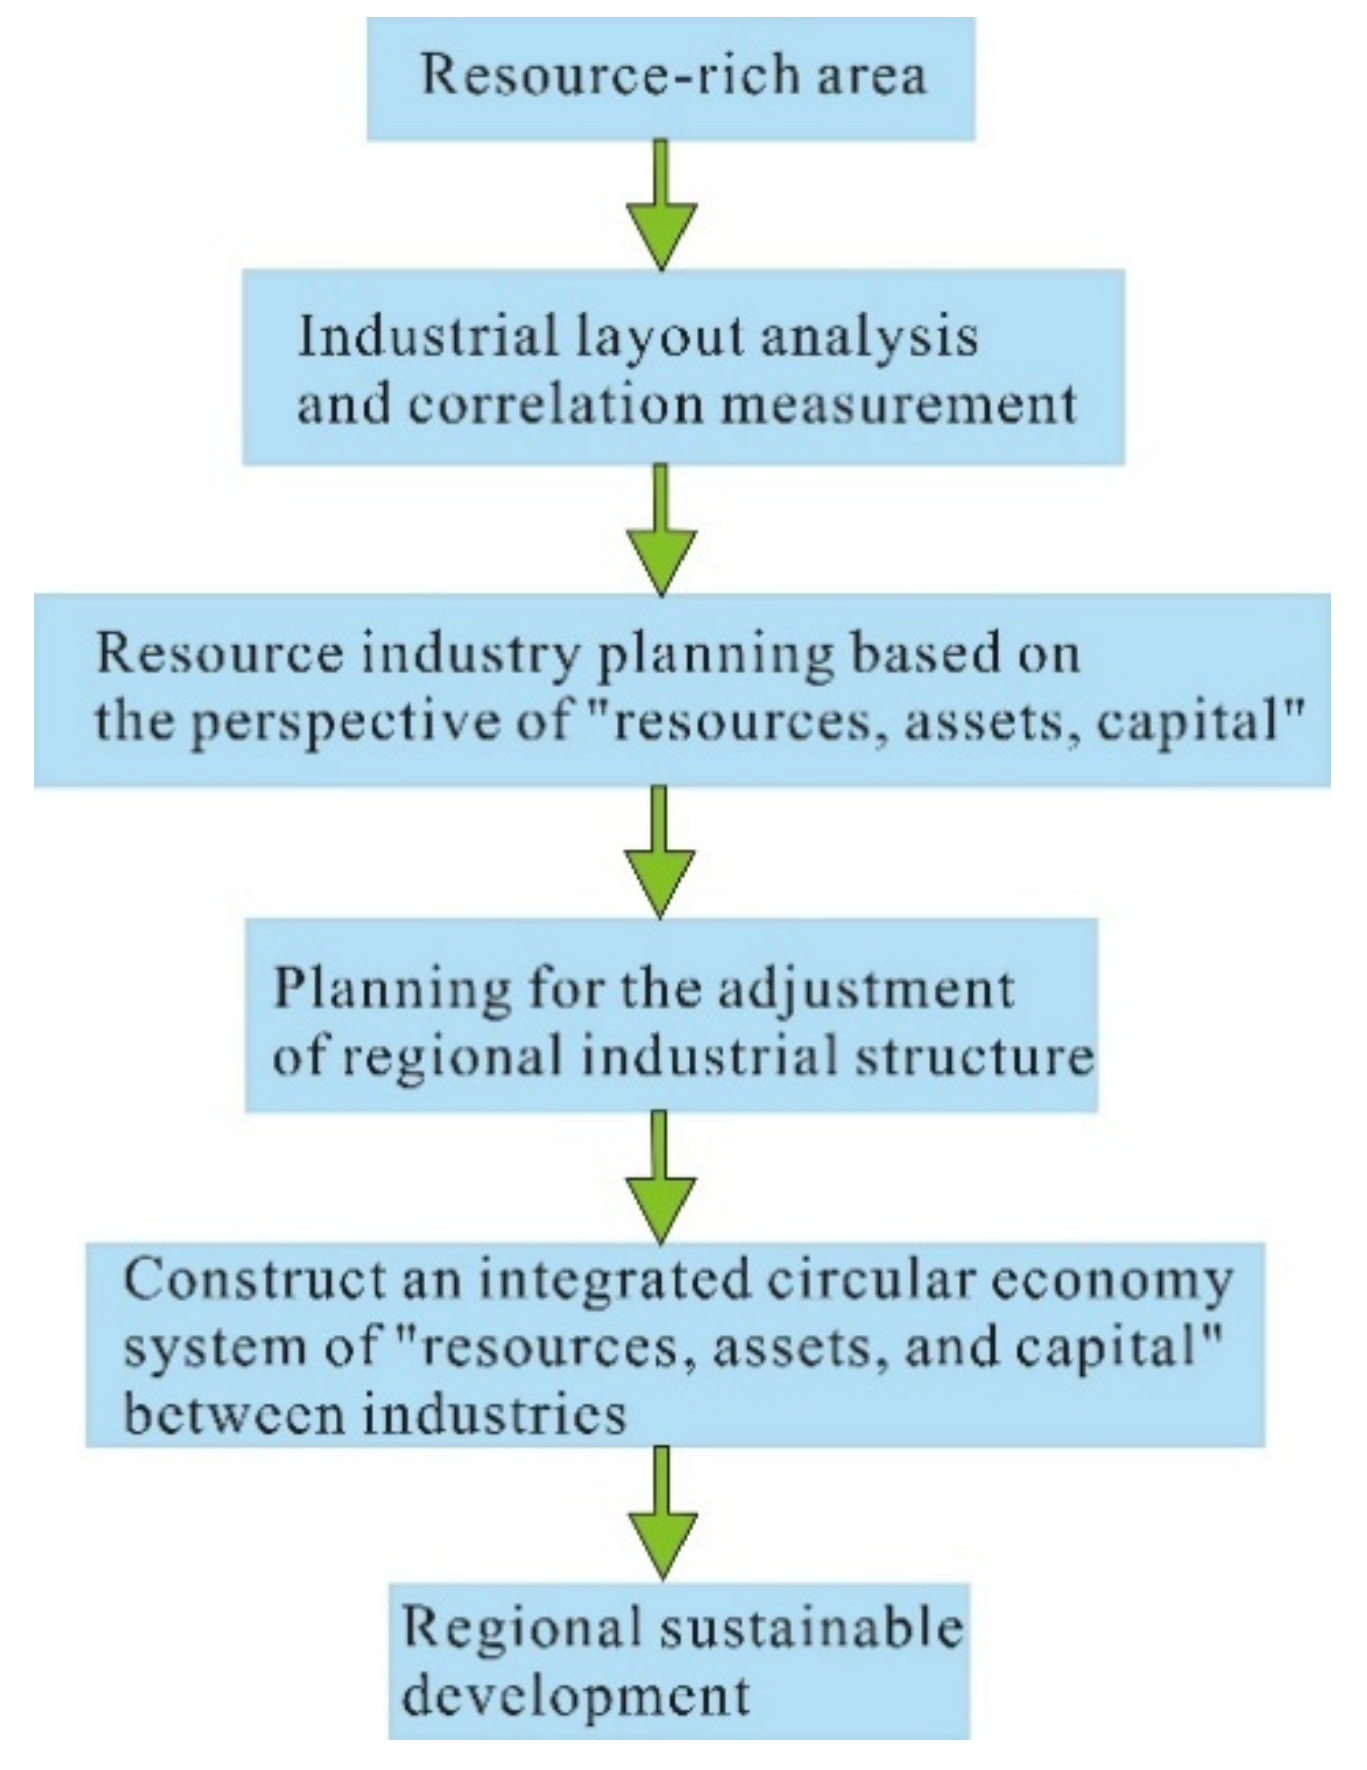
3.1. Planning Path Design

The analysis found that China’s industry is in a stage of structural adjustment. The optimization of the industrial structure in resource-rich regions is a necessary guarantee for the regional economy. The current resource industry is facing the dual constraints of reserves and environmental protection. The government must adhere to a demand-oriented approach and use innovative technologies to drive the resource industry. While ensuring the basic needs of resources, we should clarify the industrial structure of resource-rich regions, adjust the perspective of resource industry development, and gradually optimize the industrial hierarchy, thereby driving regional high-quality development [49,50,51,52].
The “resource, asset, capital” integrated management theory is mainly applied to the middle dimension of the resource industry. It uses optimized operation and production processes to achieve collaborative management of resource exploration, development, processing, and circulation; overcomes the problem of resource reserves, environmental protect and market constraints; and then innovates the resource industry operation model to build a circular economy system. The planning of resource-rich regional industries must be designed from the two dimensions of cities and industries. The resource industry itself should take the management of “resources, assets, and capital” as an innovative perspective, and break through resource reserves and environmental constraints to support regional economic development. While accelerating the adjustment of industrial structure and breaking the “resource curse”, we will coordinate the balanced development of other industries, clarify the interrelationships between industries, determine the priority of industrial development, and build the inter-industry with “resource, asset, capital” as the carrier from a macro perspective of the cyclical development system. Therefore, when industrial planning is done for resource-rich regions, it must use input-output models to measure regional industrial linkages, clarify the strengths and weaknesses of the promotion and pulling effects between industries, and analyze the development status of resource-based industries. The government should establish a development path of “resources, assets, capital”, and use the concept of “resources, assets, capital” to macro-manage different industries on the basis of the structure of regional industries, then build a circular development system between industries to achieve the purpose of regional sustainable development (Figure 4).

3.2. Method and Model

This paper studies the development of industries in resource-rich regions. It is necessary to apply the input-output method to measure the degree of regional industry relevance, use the influence coefficient and the induction coefficient to determine the pulling or promoting effect of different departments, and then rank the industries. We use the integrated management model of “resources, assets, capital” to optimize resource industry operations and production processes, and determine the priority of industry development based on industry rankings to formulate resource-rich regional industry development strategies.

3.2.1. Industrial Relevance Measurement Based on Input-Output Analysis

The input-output analysis is a commonly used method in national economic accounting. It quantitatively measures the correlation between the input and output of various sectors of the industry and the inter-industry in a fixed year [53,54]. The main indicators and accounting steps are as follows.
(1) The direct consumption coefficient, also known as the input coefficient, is denoted as a i j ( i , j = 1 , 2 , , n ) ; it refers to the quantity of sector (or product) i directly consumed by sector (or product) j in the process of production and operation. a i j = x i j / X j ( i , j = i , j = 1 , 2 , , n ) , with the total input of sector j showing X i , removes the quantity x i j of the products or services of sector i directly consumed in the production and operation of the sector.
(2) Matrix ( I A ) 1 is called the Leontief inverse matrix, where A is the direct consumption coefficient matrix, and its element b ¯ i j ( i , j = i , j = 1 , 2 , , n ) is called the Leontief inverse coefficient. It shows the total demand for sector i when sector j adds one unit for final use. The Leontief inverse matrix is an important basis for calculating the coefficient of inductance and coefficient of influence.
(3) The induction coefficient refers to the demand induction degree that a certain sector receives for each unit of each sector of national economy when it is finally used, which means the output quantity that the sector is required to provide for the production of other sectors. The greater the coefficient, the stronger the promotion effect of the sector on economic development.
E i = j = 1 n b ¯ i j 1 n i = q n j = 1 n b ¯ i j ( i , j = 1 , 2 , , n ) is the inductance coefficient, j = 1 n b ¯ i j is the sum of row i of Leontief’s inverse matrix, and 1 n i = q n j = 1 n b ¯ i j is the average of the sum of the rows of Leontief’s inverse matrix.
The influence coefficient refers to the extent to which the production demand of each department will be affected by the increase of one unit’s final product in a certain product department of the national economy. The greater the influence coefficient is, the stronger the pulling effect of this department on other departments will be.
F j = i = 1 n b ¯ i j 1 n i = q n j = 1 n b ¯ i j ( i , j = 1 , 2 , , n ) is coefficient of influence, i = 1 n b ¯ i j is the sum of column j of the Leontief inverse matrix, and 1 n i = q n j = 1 n b ¯ i j is the average of the column sums of the Leontief inverse matrix.

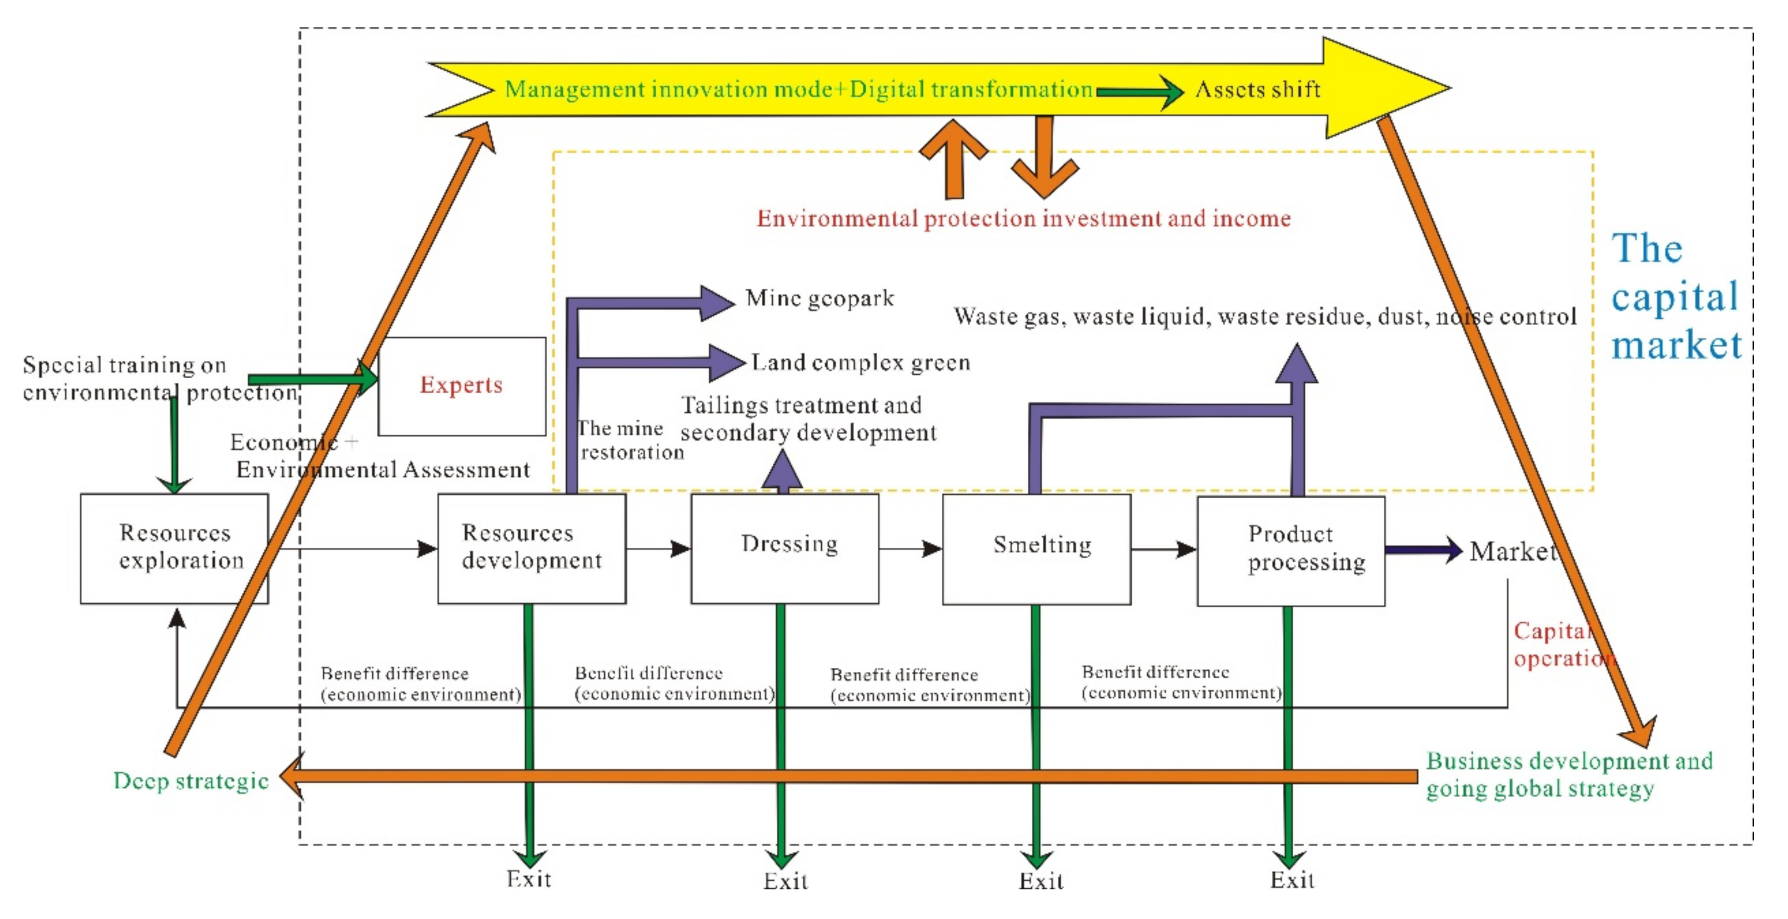
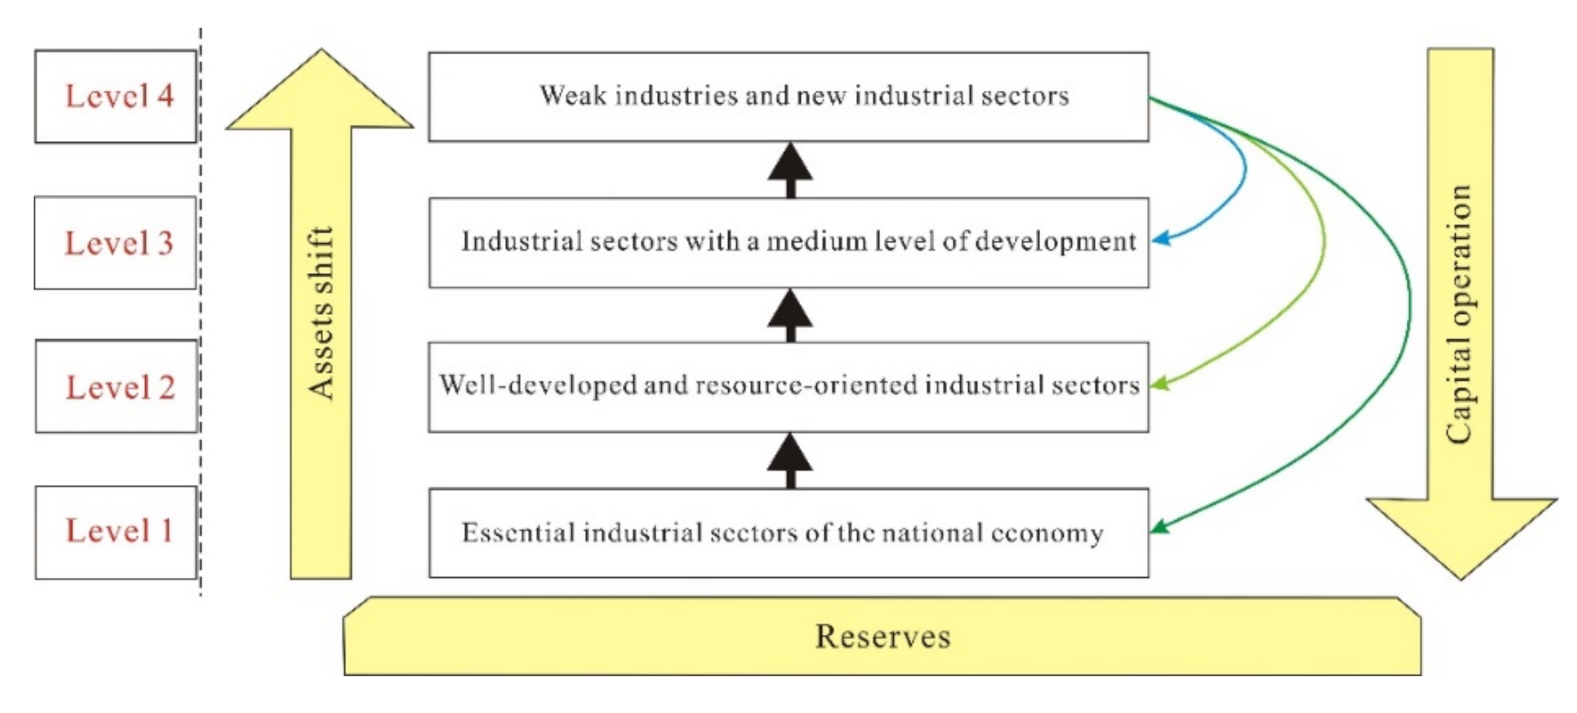
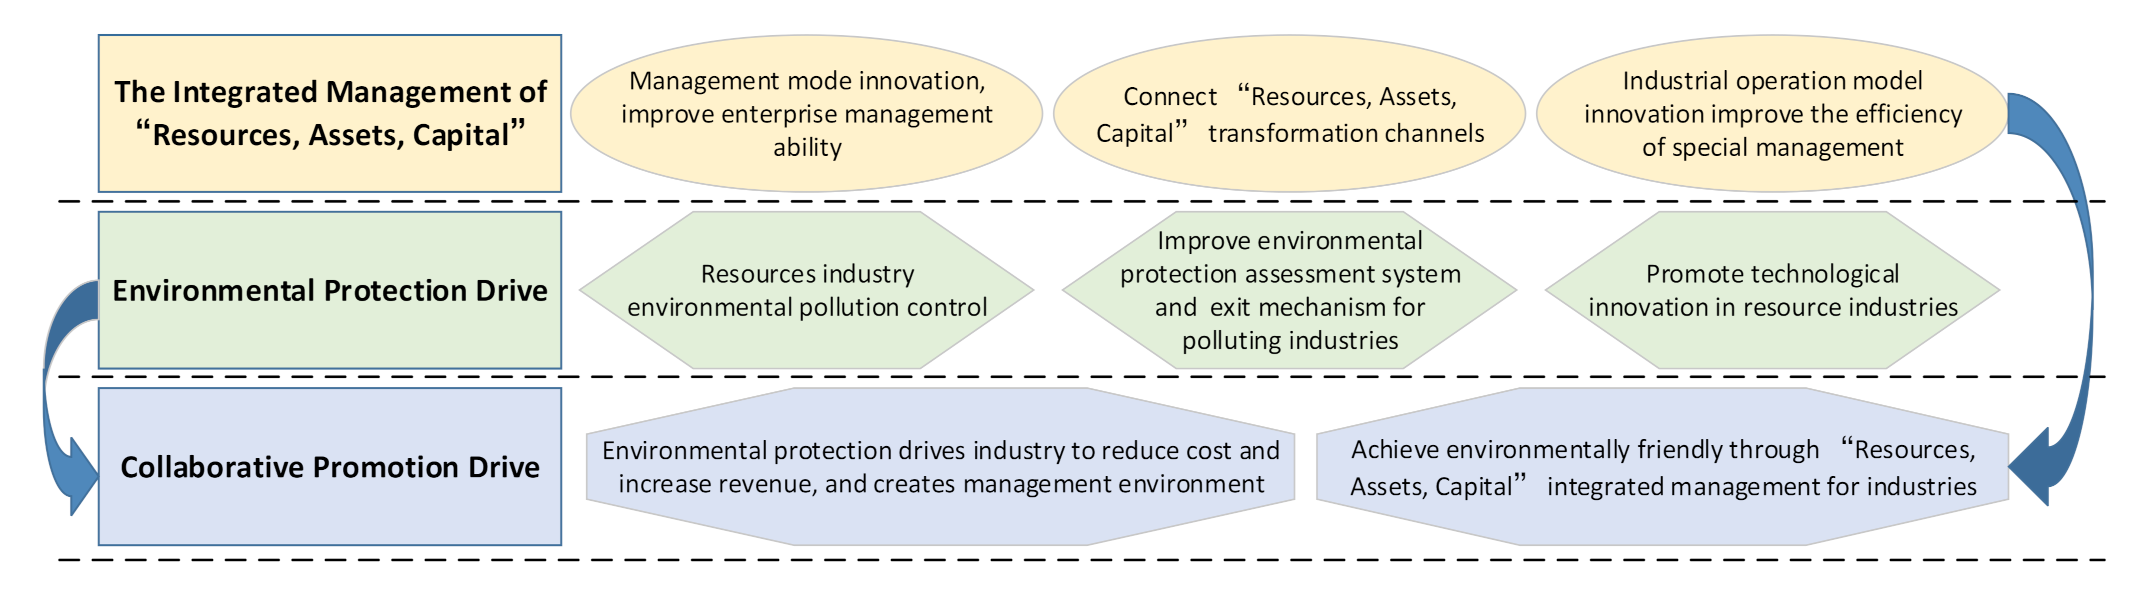
3.2.2. Regional Industry Integrated Circular Economy System Based on “Resources, Assets, Capital”

A vital method to realize the sustainable development of the resource industry is to solve the problems of management of “resources, assets and capital”, and realize the coupling of the development of resource industry management and of environmental protection. The ecological environmental resources industry involves a wide range of goals, including the exploration and development of an environmental pollution treatment, washing, smelting, and processing flow for the process of repairing environmental damage caused by industry. The resource industry chain’s environmental problems are important obstacles restricting enterprise development, and are contrary to the green concept of sustainable development, and they create a lot of costs in the process of governance. When the resource industry realizes the transformation of resources, assets, and capital within or among enterprises, it should consider the environmental governance factors, innovate the development path of the resource industry, and construct the development mode of three-capital integrated management and environmental protection (Figure 5) [55]. At the same time, we should break through the dual limits of resource reserves and environmental constraints to realize the dual drive of integrated management and environmental protection, and accelerate the sustainable development of the resource industry.
As shown in Figure 5, the coupling management mode of “resources, assets, capital” integrated management and environmental protection is an effective way for the resource industry to solve the resource bottleneck. It will improve the core competence of enterprises, and realize the win-win situation of economic benefits and environmental protection. From the perspective of resource exploration, resource development, ore dressing, smelting, product processing, and the whole industrial chain of market circulation, it promotes the coupling development of the “resources, assets, capital” integrated management and environmental protection, constructs a circular economy system for the resource industry, realizes the benign operation mode from resources, transfers assets to capital, and then feeds the resource exploration business through the implementation of the resource development strategy, including deep exploration, economic and environmental assessment, an exit mechanism for the asset transformation process, and the improvement of the operation capacity of the resource industry capital market.

3.2.3. Circular Economy System of Regional Industry

The resource industry is an important growth pole in the early stage of economic development in resource-rich regions. However, due to policies and objective environmental impacts, after a period of development, resource reserves and environmental problems will quickly restrict regional development. These problems will cause the Dutch disease and inhibit the manufacturing activities of other industries. Constructing an industrial-level resource-, capital-, and asset-coordinated management system can achieve a strong driving effect of the circular economy and avoid structural problems caused by the slow or excessive development of some industries. (Figure 6).
The purpose of industrial development in resource-rich regions is to ensure the development advantages of the resource industry, avoid the restraint of resource reserves and environmental constraints on the development of the resource industry, and innovate the development mode of the resource industry. As shown in Figure 6, the industrial structure of resource-rich regions can be divided into four levels. Supported by the industrial sectors with advantages and resource sectors, the industrial sectors must be strengthened to ensure the development of the national economy, the industrial sectors with medium development level should be promoted, and the sectors with weak and emerging industries should be actively supported. Based on the integration of the “resources, assets, capital” management perspective, the disadvantaged industry sector can serve as a resource reserve starting from the dimension of macroscopic analysis, and the process that constantly promotes the development of high-level sectors can be thought of as the process of regional industry transition between assets. Further promoting high-level industry sectors developing low-level industry departments is the formation of regional industry development benign circulation to improve the sustainable development of regional economic resource enrichment.
The circular economy system also has certain indirect benefits. Since most of the resource industry sectors are capital-intensive production models, improving their competitiveness can effectively drive employment, and the transfer of labor can also be realized in the process of asset conversion, thereby improving the employment structure. When the various industrial sectors reach their best operating conditions, the capital market will also tend to stabilize, and employment risks will also be reduced. In addition, the integrated management model of “resources, capital, and assets” also has other derivative socio-economic effects.

4. Empirical Analysis

The Guangxi Zhuang Autonomous Region is located in southwestern China. It has rich reserves of non-ferrous metal mineral resources, and the resources support regional economic development to a certain extent. In the context of the rapid development of emerging industries, the economic, social, and industrial development in Guangxi is facing major changes, and the trend of industrial adjustment is obvious. In order to avoid weak economic development of Guangxi and grasp the development opportunities of “One Belt One Road”, the government should further consolidate the development foundation of the resource industry and help the rapid development of emerging industries, thus forming a high-quality circular Guangxi sustainable development industrial layout to drive the high-quality development of the regional economy.

4.1. Industry-Related Calculation

Since China’s input-output tables are compiled every two and seven years, the basic data mainly come from the 2012 and 2017 regional input-output tables. It should be noted that the Guangxi input-output table contains 139 industrial sectors. In order to maintain the same statistical caliber, we have merged them into a 42-sector table.
According to the calculation method of sensitivity coefficient and influence coefficient, we plan to further explore the inter-industrial relationship. MATLAB is used for programming calculation, the Leontief inverse matrix is derived from the direct consumption coefficient, and then the sensitivity coefficient and influence coefficient of 42 sectors in 2012 and 2017 are calculated (Appendix A). Analyzing the calculation results, we can get the following information
(1) In 2012, the sectors of chemical products, metal smelting and rolling products, and electric power and heat production and supply had a strong positive driving effect on other sectors in China, while the sectors of communication, computer and other electronic equipment, electrical machinery and equipment, and transportation equipment had a strong pulling effect. The driving effect of industrial sectors in Guangxi is basically the same as that of the whole country, but the power and heat production and supply sectors have a strong pulling effect on other sectors at the same time. Compared with the whole country, Guangxi’s resource-oriented primary product sector has a weaker role in promoting and pulling other sectors, such as coal mining products, oil and natural gas mining products, metal mining and processing products, non-metallic mining and processing products, petroleum coking products and nuclear fuel processing products, non-metallic mineral products, metal smelting and rolling processing products, and metal products.
(2) In 2017, the promotion of China’s industrial sectors was basically the same as in 2012. Except for the promotion of textiles, clothing, shoes, hats, and leather and their products, which greatly enhanced the promotion of other sectors, the promotion of other sectors remained basically stable. The sectors of wholesale and retail, information transmission, and software and information technology service have significantly enhanced the promotion of other departments, and the inter-departmental pulling effect is basically the same as that of the national force. The resource-oriented primary product sector is basically stable compared to the whole country. Except for coal mining products and oil and natural gas mining products, other sectors have a slightly stronger pulling effect.
(3) Comparing the changes in the coefficients of 42 sectors in China and Guangxi from 2012 to 2017, most of China’s industrial sectors have basically remained stable in promoting and pulling roles, emerging industries and service industry sectors have significantly increased their role in promoting other sectors, and the light industry sector has a certain increase in the pulling effect of other sectors. The driving role of Guangxi’s agriculture, forestry, animal husbandry and fishery products and services, and the real estate sector declined sharply. The driving role of emerging industries and service industries rose against the trend. The pulling effect of traditionally advantageous light industry and extensive industry sectors has weakened, and the pulling effect of equipment manufacturing sectors has increased significantly. The pulling and promoting role of the resource-oriented primary product sector across the country has remained basically stable. Metal minerals and their processing, and oil and gas processing industries in Guangxi have a certain increase in the pulling effect of other sectors.
Affected by policy dividends, China’s resource-based industries experienced a “golden decade” before 2012, and industrial development was in the early stage of structural adjustment. The downstream industries of the nationwide resource-based industry chain were at a relatively high level, and the resource-oriented primary product sector was at a medium level. Affected by resource reserves and environmental protection constraints, as well as the in-depth development of industrial structural adjustments, traditional extensive industrial sectors have weakened to a certain extent in promoting and pulling other sectors, and new manufacturing industries and tertiary industries have developed significantly. At the same time, the core position of traditional advantageous industries in Guangxi has gradually weakened. Affected by the industrial structure and regional resource endowments, in addition to emerging industries and service industries, the development status of the downstream sectors of metal minerals and their processing and resource-based industries has improved. This shows that the effect of national industrial structural adjustment is significant, and Guangxi’s regional economic development is highly restricted by industrial structural adjustments, resource endowments, and environmental protection.

4.2. Model Innovation of Guangxi’s Resource Industry from the Perspective of “Resources, Assets, Capital”

Some resources in Guangxi are well-endowed, but the resource industry’s driving role in regional economic development is limited. The economic development of Guangxi is not as high as the national level. The main problems restricting the development of Guangxi’s resource industry include resource reserves, environmental protection, and the resource industry market constraint.
Analyzing the results of the industry correlation measurement again, it is found that the resource industries of China and Guangxi are basically at the middle and upper reaches of the level, the key position of the regional economic development of the resource industry is gradually weakening, the development of the support sector is relatively stable, and the development of the emerging industry sector presents a greater advantage. Considering the above factors, the circular economy system can be effectively applied to empirical cases. Combined with the actual development of the resource industry in Guangxi, the development path of the resource industry can be planned from the three dimensions of resource reserve reduction, environmental constraints tightening, and operation model innovation, and we can build a coupling development model for integrated management of the three capitals and environmental protection from a market perspective, so as to avoid the risk of benefit loss and explore the path of green sustainable development (Figure 7).
Path planning: The development of the resource industry in Guangxi is constrained by resource reserves, environmental protection, and core capabilities of industrial operations. To solve the development constraints of the resource industry, strategic decisions must be implemented from the three perspectives of resources, assets, and capital, and we should construct a development path of integrated management and environmental protection. Due to its special operating structure, resource exploration, development, and processing activities can all realize the transformation of assets within the industry. Based on the perspective of integrated management, we should first establish a resource strategy focusing on innovative resource exploration methods, then enhance industrial capabilities with industrial management models and industrial digital transformation as the core, and implement the two-dimensional capital operation direction of the “going out” strategy and business scope expansion. By constructing an integrated management system, establishing an environmental protection mechanism for industrial development, and realizing the coupled development of the two, it solves the limitation of resource reserves, reduces the environmental carrying constraints in the process of industrial asset transformation, and finally realizes the effective recycling of industrial capital while promoting the green and sustainable development of the resource industry in Guangxi.

4.3. Construct Guangxi’s Industrial Circular Economy System

The green development of the regional resource industry is an important guarantee for the development of the national economy in Guangxi, and it can support and drive the development of other industrial sectors to a certain extent. Combined with the results of the regional industry association measurement, the resource industry in the region has not maximized its resource advantages. There is a certain space for the development of the resource industry, and the regional industrial structure needs to be optimized. Take the pattern shown in Figure 7 as the guide to build a regional industrial integrated circular economy system.
(1) It is vital to clarify the status quo of regional resources, and give priority to the development of non-ferrous metals, calcium carbonate, and other resource-specific industries, as well as the necessary guarantee departments for national economic development. From the results of the industrial correlation measurement, the regional resource industry sector has a relatively low degree of induction and influence on other industrial sectors, mainly due to environmental constraints and policy-oriented influences, and the industry has not been developed to the greatest extent. The industrial sectors necessary for the development of the national economy, such as food and tobacco, textiles, electricity, heat production and supply, and water production and supply, have a relatively high degree of development and should continue to be maintained.
(2) We should promote the development of middle-level industrial sectors, such as machinery and equipment processing, and people’s livelihood service security, then link up advantageous resource industries, and drive middle-level development industries with resource industries. We should also focus on the development of weak industrial sectors such as transportation, warehousing and postal services, scientific research and technical services, education, public management, social security and social organization emerging industries, as well as emerging industry sectors, to make up for the shortcomings of regional industrial development and avoid the “barrel effect” happening.
(3) On the basis of ensuring the development of the necessary industrial sectors of the national economy, we should give priority to the development of the resource industry sector. Through the continuous improvement of the industrial capacity of the medium development level, driving the development of weak industries and emerging industries is a necessary condition for the steady adjustment of the industrial structure. From a meso-level perspective, we should use integrated management to innovate the development model of the resource industry and overcome the problems of regional resource reserves, environmental protection, and industrial operations. We should optimize the process of asset transformation based on resources from a macro perspective, then innovate capital operation methods, and drive the development of high-level industrial sectors with the development of low-level industrial sectors, which in turn promotes the improvement of low-level industrial sectors; that is, to feed back the rest of the region’s industries through the development of emerging industries and weak industries can promote the adjustment of the industrial structure of Guangxi, and realize industrial coordination and sustainable development of the regional economy.

5. Concluding Remarks

This article is a plan for the industrial development path of China’s resource-rich regions, aiming to solve the industrial imbalance and its derivative problems caused by the Dutch disease. Based on a large number of existing results, we believe that the research in this field can be further optimized. We use a combination of quantitative and qualitative methods to find out the factors that lead to the imbalance of this type of regional industrial structure, and build a resource, asset, and capital circular economy system with two dimensions of the resource industry and the overall industry.
Through qualitative analysis, we found that the resource industry may be an important factor leading to the Dutch disease in China and Guangxi, and further calculations verified our conjecture. From a spatial perspective, the development of resource industries in resource-rich regions is still at a relatively high level, but their overall economic development is in a backward position in the country, indicating that there are symptoms of Dutch disease in this type of region. From the perspective of time, the prominent contribution status of resource industries in resource-rich regions is gradually weakening, indicating that the regional industrial structure is in a transitional period of adjustment. The application of the circular economy system in resource-rich regions can effectively solve the resource curse and environmental regulations, thereby optimizing the structure of the resource industry and achieving the balanced development of regional industries. At the same time, the economic system also has a wide range of socio-economic effects.
This article is a study of resource-rich regions in China. It has a certain degree of particularity. Whether the collaborative management system of resources, assets, and capital is applicable to other regions needs to be further verified. In addition, the circular economy system constructed in the article also requires a large amount of data analysis. We will conduct further research around the microeconomic analysis of the system.

Author Contributions

Conceptualization, C.L. and S.Z.; Data curation, X.W.; Formal analysis, B.L.; Funding acquisition, Y.S.; Methodology, X.G.; Resources, S.Z.; Software, H.Z.; Writing – original draft, M.L. All authors have read and agreed to the published version of the manuscript.

Funding

This research was funded by the National Key R&D Program (2018YFF0215801).

Institutional Review Board Statement

Not applicable.

Informed Consent Statement

Not applicable.

Data Availability Statement

Data recorded in the current study are available in all Tables and Figures of the manuscript.

Conflicts of Interest

The authors declare no conflict of interest.

Appendix A

Table A1. The sensitivity and influence coefficients of 42 departments across China and Guangxi in 2012 and 2017.
No.Sectors2012 2017
CHINAGUANGXICHINAGUANGXI
Sensitivity CoefficientRankInfluence CoefficientRankSensitivity CoefficientRankInfluence CoefficientRankSensitivity CoefficientRankInfluence CoefficientRankSensitivity CoefficientRankInfluence CoefficientRank
1Agriculture, forestry, animal husbandry and fishery products and services1.72 40.72 363.24 31.07 151.71 70.75 351.74 70.73 38
2Coal mining products1.26 120.84 321.46 131.07 181.03 160.84 320.91 210.81 35
3Oil and gas extraction products1.45 90.74 351.31 140.03 421.18 110.70 381.10 110.75 37
4Metal mining products0.99 180.97 241.08 160.99 340.88 210.91 280.89 220.95 24
5Non-metallic mining products0.60 270.94 270.27 290.95 380.64 280.95 260.65 301.01 19
6Food and tobacco1.37 110.99 221.95 71.09 81.39 101.03 191.03 131.01 21
7Textile1.21 131.18 130.33 271.09 71.13 121.24 90.73 251.05 17
8Textiles, clothing, shoes, hats, leather, and their products0.55 301.19 120.30 281.10 40.64 291.28 30.56 331.18 11
9Woodworking products and furniture0.69 231.16 140.37 261.08 90.71 261.19 110.72 281.08 16
10Papermaking, printing, and cultural, educational, and sporting goods1.00 171.16 151.50 121.10 51.00 181.17 141.01 151.12 13
11Petroleum, coking products, and nuclear fuel processed products1.50 81.00 211.83 80.26 411.11 130.96 241.29 101.00 22
12Chemical product3.54 11.22 93.71 21.05 203.20 11.18 132.58 11.16 12
13Non-metallic mineral products0.85 211.12 170.41 251.01 320.82 221.09 170.76 231.12 14
14Metal smelting and rolled products2.97 21.21 102.49 51.01 332.24 21.13 162.42 21.18 10
15Metal made goods0.97 191.25 80.42 241.04 230.97 191.18 120.74 241.19 9
16General equipment1.04 161.27 40.83 181.05 211.01 171.26 60.94 181.26 5
17Professional setting0.69 241.26 70.54 211.03 250.75 251.25 80.73 271.26 4
18Transportation equipment0.95 201.29 30.70 191.08 111.09 151.27 51.07 121.30 2
19Electrical machinery and equipment1.09 151.33 21.14 151.06 191.10 141.30 20.99 171.26 3
20Communications, computers, and other electronic equipment1.67 51.37 11.79 91.14 11.84 31.45 11.86 51.34 1
21Instrumentation0.56 291.27 60.11 361.11 30.62 301.27 40.56 321.25 6
22Other manufactured products0.40 371.20 110.09 380.99 360.43 371.19 100.73 260.69 41
23Waste resources and waste-material-recycling processed products0.54 320.56 410.43 231.03 260.59 320.48 420.49 361.24 7
24Repair services for metal products, machinery, and equipment0.37 391.27 50.19 311.08 100.39 411.25 71.83 61.01 18
25Electricity and heat production and supply1.98 31.08 184.32 11.12 21.71 51.04 180.70 291.10 15
26Gas production and supply0.42 350.98 230.15 330.94 390.49 330.96 230.42 400.86 32
27Water production and supply0.38 380.87 300.08 391.09 60.41 380.90 290.50 351.20 8
28Building0.48 331.15 160.13 341.02 300.43 361.16 151.53 80.69 40
29Wholesale and Retail1.40 100.61 391.68 101.02 281.71 60.66 392.03 30.94 26
30Transportation, storage, and post1.57 70.95 262.16 60.84 401.76 40.88 301.00 160.93 27
31Accommodation and meals0.65 250.87 311.03 171.08 120.78 230.96 251.03 140.92 28
32Information transmission, software, and information technology services0.58 280.88 290.61 201.08 130.77 240.82 341.88 40.84 33
33Financial1.64 60.69 382.53 41.04 221.67 80.73 370.91 200.78 36
34Real estate0.62 260.55 420.49 221.02 290.91 200.58 411.46 90.86 31
35Rental and business services1.13 141.03 191.55 110.96 371.52 91.03 200.40 420.94 25
36Scientific research and technical services0.70 221.01 200.10 371.03 270.65 270.99 220.59 310.84 34
37Water conservancy, environment, and public facilities management0.41 360.91 280.05 401.04 240.46 350.92 270.47 370.89 29
38Resident services, repairs, and other services0.54 310.83 330.26 300.99 350.60 310.84 310.92 190.99 23
39Education0.37 410.58 400.12 351.07 160.39 400.63 400.46 380.68 42
40Health and social work0.35 420.97 250.03 421.07 170.38 421.00 210.41 411.01 20
41Culture, sports, and entertainment0.43 340.81 340.18 321.07 140.47 340.83 330.53 340.88 30
42Public administration, social security, and social organization0.37 400.72 370.04 411.02 310.40 390.74 360.43 390.71 39

References

  1. Faunce, T.; Parikh, T. Nucoal Resources Ltd V New South Wales: The Mining Industry and Potential Health Impacts of Investor-State Dispute Settlement in Australia. J. Law Med. 2016, 23, 801–812. [Google Scholar] [PubMed]
  2. Katz, J.; Pietrobelli, C. Natural resource based growth, global value chains and domestic capabilities in the mining industry. Resour. Policy 2018, 58, 11–20. [Google Scholar] [CrossRef]
  3. Ranjan, R. The role of political-industry nexus in promoting illegal extraction of mineral resources and deforestation: A case of iron ore mining in Goa. Resour. Policy 2018, 57, 122–136. [Google Scholar] [CrossRef]
  4. Luo, Y.Y.; Qin, Y.; Wang, Z.; Wang, J. A dynamical system study for the ecological development of mineral resources in minority areas. Discret. Contin. Dyn. Syst. Ser. S 2019, 12, 1073–1089. [Google Scholar] [CrossRef] [Green Version]
  5. Sadik-Zada, E.R. Distributional Bargaining and the Speed of Structural Change in the Petroleum Exporting Labor Surplus Economies. Eur. J. Dev. Res. 2020, 32, 51–98. [Google Scholar] [CrossRef]
  6. Sadik-Zada, E.R. Natural resources, technological progress, and economic modernization. Rev. Dev. Econ. 2021, 25, 381–404. [Google Scholar] [CrossRef]
  7. Gilding, M.; Merlot, E.; Leitch, S. The power of hope: The mobilisation of small and mid-tier companies in the mining industry’s campaign against the Resources Super Profits Tax. Aust. J. Political Sci. 2016, 51, 122–133. [Google Scholar] [CrossRef]
  8. Lebre, E.; Corder, G.; Golev, A. The Role of the Mining Industry in a Circular Economy A Framework for Resource Management at the Mine Site Level. J. Ind. Ecol. 2017, 21, 662–672. [Google Scholar] [CrossRef]
  9. Parker, R.; Cox, S. How the globalisation and financialisation of mining Majors affects linkage development with local engineering and technology suppliers in the Queensland resources industry. Resour. Policy 2018, 58, 125–130. [Google Scholar] [CrossRef]
  10. Aron, A.S.; Molina, O. Green innovation in natural resource industries: The case of local suppliers in the Peruvian mining industry. Extr. Ind. Soc. Int. J. 2020, 7, 353–365. [Google Scholar] [CrossRef] [Green Version]
  11. He, W.D.; Sheng, Z.L.; Hao, R. A Productivity Analysis of the Industrial Security in the Mineral Resources Mining Industry. J. Sci. Ind. Res. 2016, 75, 14–18. [Google Scholar]
  12. Chiquini, A.; Deutsch, C.V. Mineral Resources Evaluation with Mining Selectivity and Information Effect. Min. Metall. Explor. 2020, 37, 965–979. [Google Scholar] [CrossRef]
  13. Zhang, Y.L.; Li, X.Y.; Wang, S.; Guo, J.L.; Lv, G.F. A Multi-objective Zoning Framework for Mineral Resources Development and Management: A Case Study in Henan Province, China. Nat. Resour. Res. 2020, 29, 3103–3119. [Google Scholar] [CrossRef]
  14. Pradel, M.; Garcia, J.; Vaija, M.S. A framework for good practices to assess abiotic mineral resource depletion in Life Cycle Assessment. J. Clean. Prod. 2021, 279, 123296. [Google Scholar] [CrossRef]
  15. Perepelitsyn, V.A.; Yagovtsev, A.V.; Merzlyakov, V.N.; Kochetkov, V.V.; Ponomarenko, A.A.; Ponomarenko, Z.G.; Kolobov, A.Y. Prospective Technogenic Mineral Resources for Refractory Production. Refract. Ind. Ceram. 2019, 60, 243–247. [Google Scholar] [CrossRef]
  16. Li, H.J.; An, H.Z.; Qi, Y.J.; Liu, H.P. Trade and competitiveness structure of Chinas advantageous mineral resources based on the international trade network of industrial chain: A case study of Tungsten. Resour. Sci. 2020, 42, 1504–1514. [Google Scholar]
  17. Carvalho, J.M.S.; Costa, R.V.; Marnoto, S.; Vieira, J.C.; Sousa, C.A.A. Resource-based view of city quality: Scales development and validation. Growth Chang. 2019, 50, 856–879. [Google Scholar] [CrossRef]
  18. Wegenast, T.; Khanna, A.A.; Schneider, G. The Micro-Foundations of the Resource Curse: Mineral Ownership and Local Economic Well-Being in Sub-Saharan Africa. Int. Stud. Q. 2020, 64, 530–543. [Google Scholar] [CrossRef]
  19. Tang, Q.; Wang, J.M.; Jing, Z.R. Ecological Vulnerability of Mining Resource-based Cities: A Review. J. Ecol. Rural Environ. 2020, 37, 825–832. [Google Scholar]
  20. Tan, J.T.; Lo, K.; Qiu, F.D.; Zhang, X.L.; Zhao, H.B. Regional economic resilience of resource-based cities and influential factors during economic crises in China. Growth Chang. 2020, 51, 362–381. [Google Scholar] [CrossRef]
  21. Chen, W.; Chen, W.J.; Ning, S.Y.; Liu, E.N.; Zhou, X.; Wang, Y.A.; Zhao, M.J. Exploring the industrial land use efficiency of China’s resource-based cities. Cities 2019, 93, 215–223. [Google Scholar] [CrossRef]
  22. Yang, Y.Y.; Guo, H.X.; Chen, L.F.; Liu, X.; Gu, M.Y.; Ke, X.L. Regional analysis of the green development level differences in Chinese mineral resource-based cities. Resour. Policy 2019, 61, 261–272. [Google Scholar] [CrossRef]
  23. Tan, M.; Zhao, H.; Li, G.; Qu, J.F. Assessment of potentially toxic pollutants and urban livability in a typical resource-based city, China. Environ. Sci. Pollut. Res. 2020, 27, 18640–18649. [Google Scholar] [CrossRef]
  24. Wu, J.; Bai, Z.K.; Gao, Y.G.; Zhang, L. Contribution of resource-based city urbanization to China’s urbanization. J. China Agric. Univ. 2020, 25, 163–173. [Google Scholar]
  25. Zhou, S.Y.; Chang, J.; Hu, T.H.; Luo, P.J.; Zhou, H.X. Spatiotemporal Variations of Land Use and Landscape Ecological Risk in a Resource-Based City, from Rapid Development to Recession. Pol. J. Environ. Stud. 2020, 29, 475–490. [Google Scholar] [CrossRef]
  26. Pang, M. Planning, transformation and development of resource based industrial cities. Open House Int. 2017, 42, 88–92. [Google Scholar] [CrossRef]
  27. Tan, J.T.; Zhang, P.Y.; Lo, K.; Li, J.; Liu, S.W. Conceptualizing and Measuring Economic Resilience of Resource-based Cities: Case Study of Northeast China. Chin. Geogr. Sci. 2017, 27, 471–481. [Google Scholar] [CrossRef] [Green Version]
  28. Xing, M.L.; Luo, F.Z. Comparative Study on the Optimization Path of Industrial Value Chain in China’s Resource-Based Cities. Sustainability 2018, 10, 1338. [Google Scholar] [CrossRef] [Green Version]
  29. Wang, J.Y.; Cui, N.N. Research on Resource Curse Effect and Transmission Mechanism in Resource-based Cities: A Case of 36 Cities in Central China. Acta Sci. Nat. Univ. Pekin. 2018, 54, 1259–1266. [Google Scholar]
  30. Guo, X.J.; Dong, S.C.; Wang, G.K.; Lu, C.P. Emergy-Based Urban Ecosystem Health Evaluation for A Typical Resource-Based City: A Case Study of Taiyuan, China. Appl. Ecol. Environ. Res. 2019, 17, 15131–15149. [Google Scholar] [CrossRef]
  31. Ma, Y.F.; Yan, J.J.; Sha, J.H.; He, G.Y.; Song, C.; Fan, S.M.; Ke, W.L. Dynamic simulation of the atmospheric environment improved by a focus on clean energy utilization of resource-based cities in China. J. Clean. Prod. 2018, 192, 396–410. [Google Scholar] [CrossRef]
  32. Huang, Y.; Fang, Y.G.; Gu, G.F.; Liu, J.S. The Evolution and Differentiation of Economic Convergence of Resource-based Cities in Northeast China. Chin. Geogr. Sci. 2018, 28, 495–504. [Google Scholar] [CrossRef] [Green Version]
  33. Yao, J.; Wang, J.; Zhang, H.D. Using industrial cultural heritage to transform and develop resource-based cities. Open House Int. 2019, 44, 52–55. [Google Scholar] [CrossRef]
  34. Yan, D.; Kong, Y.; Ren, X.H.; Shi, Y.K.; Chiang, S.W. The determinants of urban sustainability in Chinese resource-based cities: A panel quantile regression approach. Sci. Total Environ. 2019, 686, 1210–1219. [Google Scholar] [CrossRef]
  35. Rickman, D.S.; Wang, H.B. Whither the American west economy? Natural amenities, mineral resources and nonmetropolitan county growth. Ann. Reg. Sci. 2020, 65, 673–701. [Google Scholar] [CrossRef]
  36. Sadik-Zada, E.R. Addressing the growth and employment effects of the extractive industries: White and black box illustrations from Kazakhstan. Post Communist Econ. 2020. [Google Scholar] [CrossRef]
  37. Sadik-Zada, E.R.; Loewenstein, W.; Hasanli, Y. Production linkages and dynamic fiscal employment effects of the extractive industries: Input-output and nonlinear ARDL analyses of Azerbaijani economy. Min. Econ. 2021, 34, 3–18. [Google Scholar] [CrossRef]
  38. Hirschman, A. The Strategy of Economic Development; Yale University Press: New Haven, CT, USA, 1958. [Google Scholar]
  39. Sadik-Zada, E.R.; Loewenstein, W.; Hasanli, Y. Commodity Revenues, Agricultural Sector and the Magnitude of Deindustrialization: A Novel Multisector Perspective. Economies 2019, 7, 113. [Google Scholar] [CrossRef] [Green Version]
  40. Yan, J.W. Regional differences of agricultural industrial restructuring based on location quotient analysis. J. South. Agric. 2016, 47, 1795–1800. [Google Scholar]
  41. Quttineh, N.H.; Lidestam, H. Applying heuristics in supply chain planning in the process industry. Int. J. Ind. Eng. Comput. 2020, 11, 585–606. [Google Scholar] [CrossRef]
  42. Trstenjak, M.; Opetuk, T.; Cajner, H.; Tosanovic, N. Process Planning in Industry 4.0-Current State, Potential and Management of Transformation. Sustainability 2020, 12, 5878. [Google Scholar] [CrossRef]
  43. Wang, Y.; Dong, Y.; Xu, J.; Liu, F. Using the Improved CGE Model to Assess the Impact of Energy Structure Changes on Macroeconomics and the Carbon Market: An Application to China. Emerg. Mark. Financ. Trade 2020, 56, 2093–2112. [Google Scholar] [CrossRef]
  44. Jiang, M.; Liu, L.; Behrens, P.; Wang, T.; Tang, Z.P.; Chen, D.J.; Yu, Y.D.; Ren, Z.J.; Zhu, S.J.; Tukker, A.; et al. Improving Subnational Input-Output Analyses Using Regional Trade Data: A Case-Study and Comparison. Environ. Sci. Technol. 2020, 54, 12732–12741. [Google Scholar] [CrossRef]
  45. Huang, C.B.; Huang, P. Assessment and optimization of green space for urban transformation in resources-based city—A case study of Lengshuijiang city, China. Urban For. Urban Green. 2018, 30, 295–306. [Google Scholar] [CrossRef]
  46. Chen, W.; Shen, Y.; Wang, Y.N. Evaluation of economic transformation and upgrading of resource-based cities in Shaanxi province based on an improved TOPSIS method. Sustain. Cities Soc. 2018, 37, 234–240. [Google Scholar] [CrossRef]
  47. Jiang, S.; Lu, C.W.; Zhang, S.; Lu, X.; Tsai, S.B.; Wang, C.K.; Gao, Y.; Shi, Y.F.; Lee, C.H. Prediction of Ecological Pressure on Resource-Based Cities Based on an RBF Neural Network Optimized by an Improved ABC Algorithm. IEEE Access 2019, 7, 47423–47436. [Google Scholar] [CrossRef]
  48. Zheng, Z.Y.; Qiu, F.D.; Zhang, X.L. Heterogeneity of correlation between the locational condition and industrial transformation of regenerative resource-based cities in China. Growth Chang. 2020, 51, 771–791. [Google Scholar] [CrossRef]
  49. Borlu, Y.; Matthews, S.A. Industrial Maize as a Commodity System: Spatial Scale and Relations of Production in Turkey’s Agriculture after Economic Restructuring. Tijdschr. Voor Econ. Soc. Geogr. 2018, 109, 629–643. [Google Scholar] [CrossRef]
  50. Zhang, J.; Jiang, H.Q.; Liu, G.Y.; Zeng, W.H. A study on the contribution of industrial restructuring to reduction of carbon emissions in China during the Five Year Plan periods. J. Clean. Prod. 2018, 176, 629–635. [Google Scholar] [CrossRef]
  51. Wang, J.Y.; Wang, K.; Wei, Y.M. How to balance China’s sustainable development goals through industrial restructuring: A multi-regional input-output optimization of the employment-energy-water-emissions nexus. Environ. Res. Lett. 2020, 15, 034018. [Google Scholar] [CrossRef]
  52. Zhou, A.H.; Li, J. The nonlinear impact of industrial restructuring on economic growth and carbon dioxide emissions: A panel threshold regression approach. Environ. Sci. Pollut. Res. 2020, 27, 14108–14123. [Google Scholar] [CrossRef] [PubMed]
  53. Fournier, G.; Julio, G. On the accuracy of gravity-RAS approaches used for inter-regional trade estimation: Evidence using the 2005 inter-regional input-output table of Japan. Econ. Syst. Res. 2020, 32, 521–539. [Google Scholar] [CrossRef]
  54. Pereira-Lopez, X.; Carrascal-Incera, A.; Fernandez-Fernandez, M. A bidimensional reformulation of location quotients for generating input-output tables. Spat. Econ. Anal. 2020, 15, 476–493. [Google Scholar] [CrossRef]
  55. Liu, M.K.; Zhang, S.T.; Liu, C.X.; Zhang, H.Y. Study on the path of green and sustainable development of mining enterprises from the perspective of “resource-asset-capital”. China Min. Mag. 2020, 29, 35–43. [Google Scholar]
Figure 1. The relationship between carbon emissions and mineral resource depletion for China and other countries from 2000 to 2019. Source: World Bank.
Sustainability 13 03988 g001
Figure 2. The relationships between China’s GDP, mineral resource depletion, and the structure of secondary and tertiary industries from 2000 to 2019. Source: World Bank, China Statistical Yearbook.
Sustainability 13 03988 g002
Figure 3. The changes in the proportions of the secondary and tertiary industries in China and some provinces from 2000 to 2019. Source: China Statistical Yearbook.
Sustainability 13 03988 g003
Figure 4. General path of industrial development planning in resource-rich regions.
Sustainability 13 03988 g004
Figure 5. Integrated management and environmental protection coupling development model diagram.
Sustainability 13 03988 g005
Figure 6. Resource-rich regional integrated circular economy system.
Sustainability 13 03988 g006
Figure 7. Integrated management and environmental protection coupling development system framework.
Sustainability 13 03988 g007
Publisher’s Note: MDPI stays neutral with regard to jurisdictional claims in published maps and institutional affiliations.

