Article

Soil Bacteria and Fungi Respond Differently to Organisms Covering on Leshan Giant Buddha Body

1
College of Landscape Architecture, Sichuan Agricultural University, Chengdu 611130, China
2
Northwest Research Institute Co., Ltd. of China Railway Engineering Corporation, Lanzhou 730000, China
3
Grottoes Research Center, Management Committee of Leshan Grand Buddha Scenic Spot, Leshan 614003, China
*
Author to whom correspondence should be addressed.
Sustainability 2021, 13(7), 3897; https://doi.org/10.3390/su13073897
Submission received: 1 March 2021 / Revised: 23 March 2021 / Accepted: 23 March 2021 / Published: 1 April 2021

Abstract

:
Soil microbial communities play a key role in the functioning of terrestrial ecosystems, in particular through their interaction with above-ground plants and weathering of rocks. In this study, the chemical properties and microbial diversity of soils covered by different organisms on Leshan Giant Buddha body were analyzed. The results showed that the concentration of soil total organic carbon (TOC), total nitrogen (TN) and total phosphorus (TP) increased significantly with the change of above-ground organisms from lichens to bryophytes and vascular plants. TOC, TN, TP, C:N, and C:P were significantly correlated with the composition of microbial community. Bacterial and fungal diversity responded differently to the change of organisms, and the diversity of bacterial communities changed significantly among different sites. The settlement of Embryogenic plants increased the α-diversity indices including Sobs, Shannon, Ace and Chao indices, which were highest in sites covered with Ferns. The relative abundances of Chloroflexi, Acidobacteria, Nitrospirae and Planctomycetes increased with the order of Bryophyte, Fern, Grass and Shrub, and Cyanobacteria was opposite, with the highest in samples covered with lichens. These results improve understanding of plant–fungi–bacteria interactions during the early stages of soil development, and provide a scientific basis for protection of Leshan Giant Buddha.

1. Introduction

Soil microbial communities play a vital role in the maintenance and evolution of terrestrial ecosystems through interactions with plant communities and impact on nutrient cycling in particular [1,2,3]. Theoretically, shifts in plant communities during succession can regulate below-ground biological communities by causing the heterogeneity of underground resources and physical micro-habitats (e.g., distribution and morphology of root, soil porosity and air permeability, etc.) [4,5,6]. On the contrary, soil microorganisms can alter the above-ground plant communities by enhancing the availability of nutrients [7,8,9], and impact plant predominance via symbiotic microorganisms [10,11]. Therefore, plant succession is essentially a variation in the interaction between above-ground plants and underground microorganisms.
Recent studies have investigated the interactions between composition of soil microbial community and above-ground plants during different ecological processes such as pedogenesis [12], afforestation [13], and secondary succession [14], but the results are varied. For example, some studies indicated that the main factors affecting diversity of soil microbial community are pedoclimatic conditions [15,16], whereas others emphasized the interaction between plants and microbial communities [17,18]. Plant biomass and flora richness greatly impact the soil microbial community diversity [19]. Bakker et al. and Daniel et al. reported that biomass and richness of plant affect soil microbial community by adjusting soil moisture content and solar radiation [20,21]. Other research revealed that soil microbial communities are also sensitive to soil acidity and nitrogen conversion [22,23]. In the category of microorganisms, the response of fungi and bacterial communities to above-ground vegetation may be different due to the symbiotic relationship between fungi and plants [24,25,26]. These inconsistencies emphasize that, during pedogenesis and community succession, the response to above-ground vegetation and soil conditions of microbial communities is unclear.
In terrestrial ecosystem, the potential factors behind the microbial community composition include properties of soil forming rock, micro-climates, dispersal limitation, species interaction and competition exclusion. Of these factors, the relative contribution to a community’s diversity depends largely on spatial scale [27]. A small spatial scale study therefore tends to negate the impact of broad environmental gradients on community structure so as to better reveal the signal of local assembly processes like biotic interactions or ecological drift [28,29,30].
Leshan Giant Buddha, attached with unique Buddhist statues, is the largest ancient stone Buddha statue in the world, which could date back to the Tang Dynasty. It is an important part of Mount Emei-Leshan Giant Buddha which was included in the World Heritage List by UNESCO in 1996. Thanks to the protection of cultural relics and religious reasons, the body of the Leshan Giant Buddha is rarely subjected to human activities. Nevertheless, after thousands of years of natural weathering, various types of vegetation, including lichens, bryophytes, ferns and seed plants, have formed on the Buddha surface, providing conditions for small-scale research on the correlation between above-ground vegetation and soil microorganisms.
Based on the renovation project from 2018 to 2019 of Leshan Buddha, the changes of bacterial and fungal community structure on rocks and in soils covered by different organisms on the Leshan Giant Buddha body are analyzed via high-throughput sequencing in this study. Moreover, to reveal the evolutionary and functional adaptation characteristics of microbial community structure in the process of pedogenesis, its ecological functions are investigated. The research results provide basic data for enriching the microbial resource and maintaining the stability of soil ecosystems in a small scale.

2. Materials and Methods
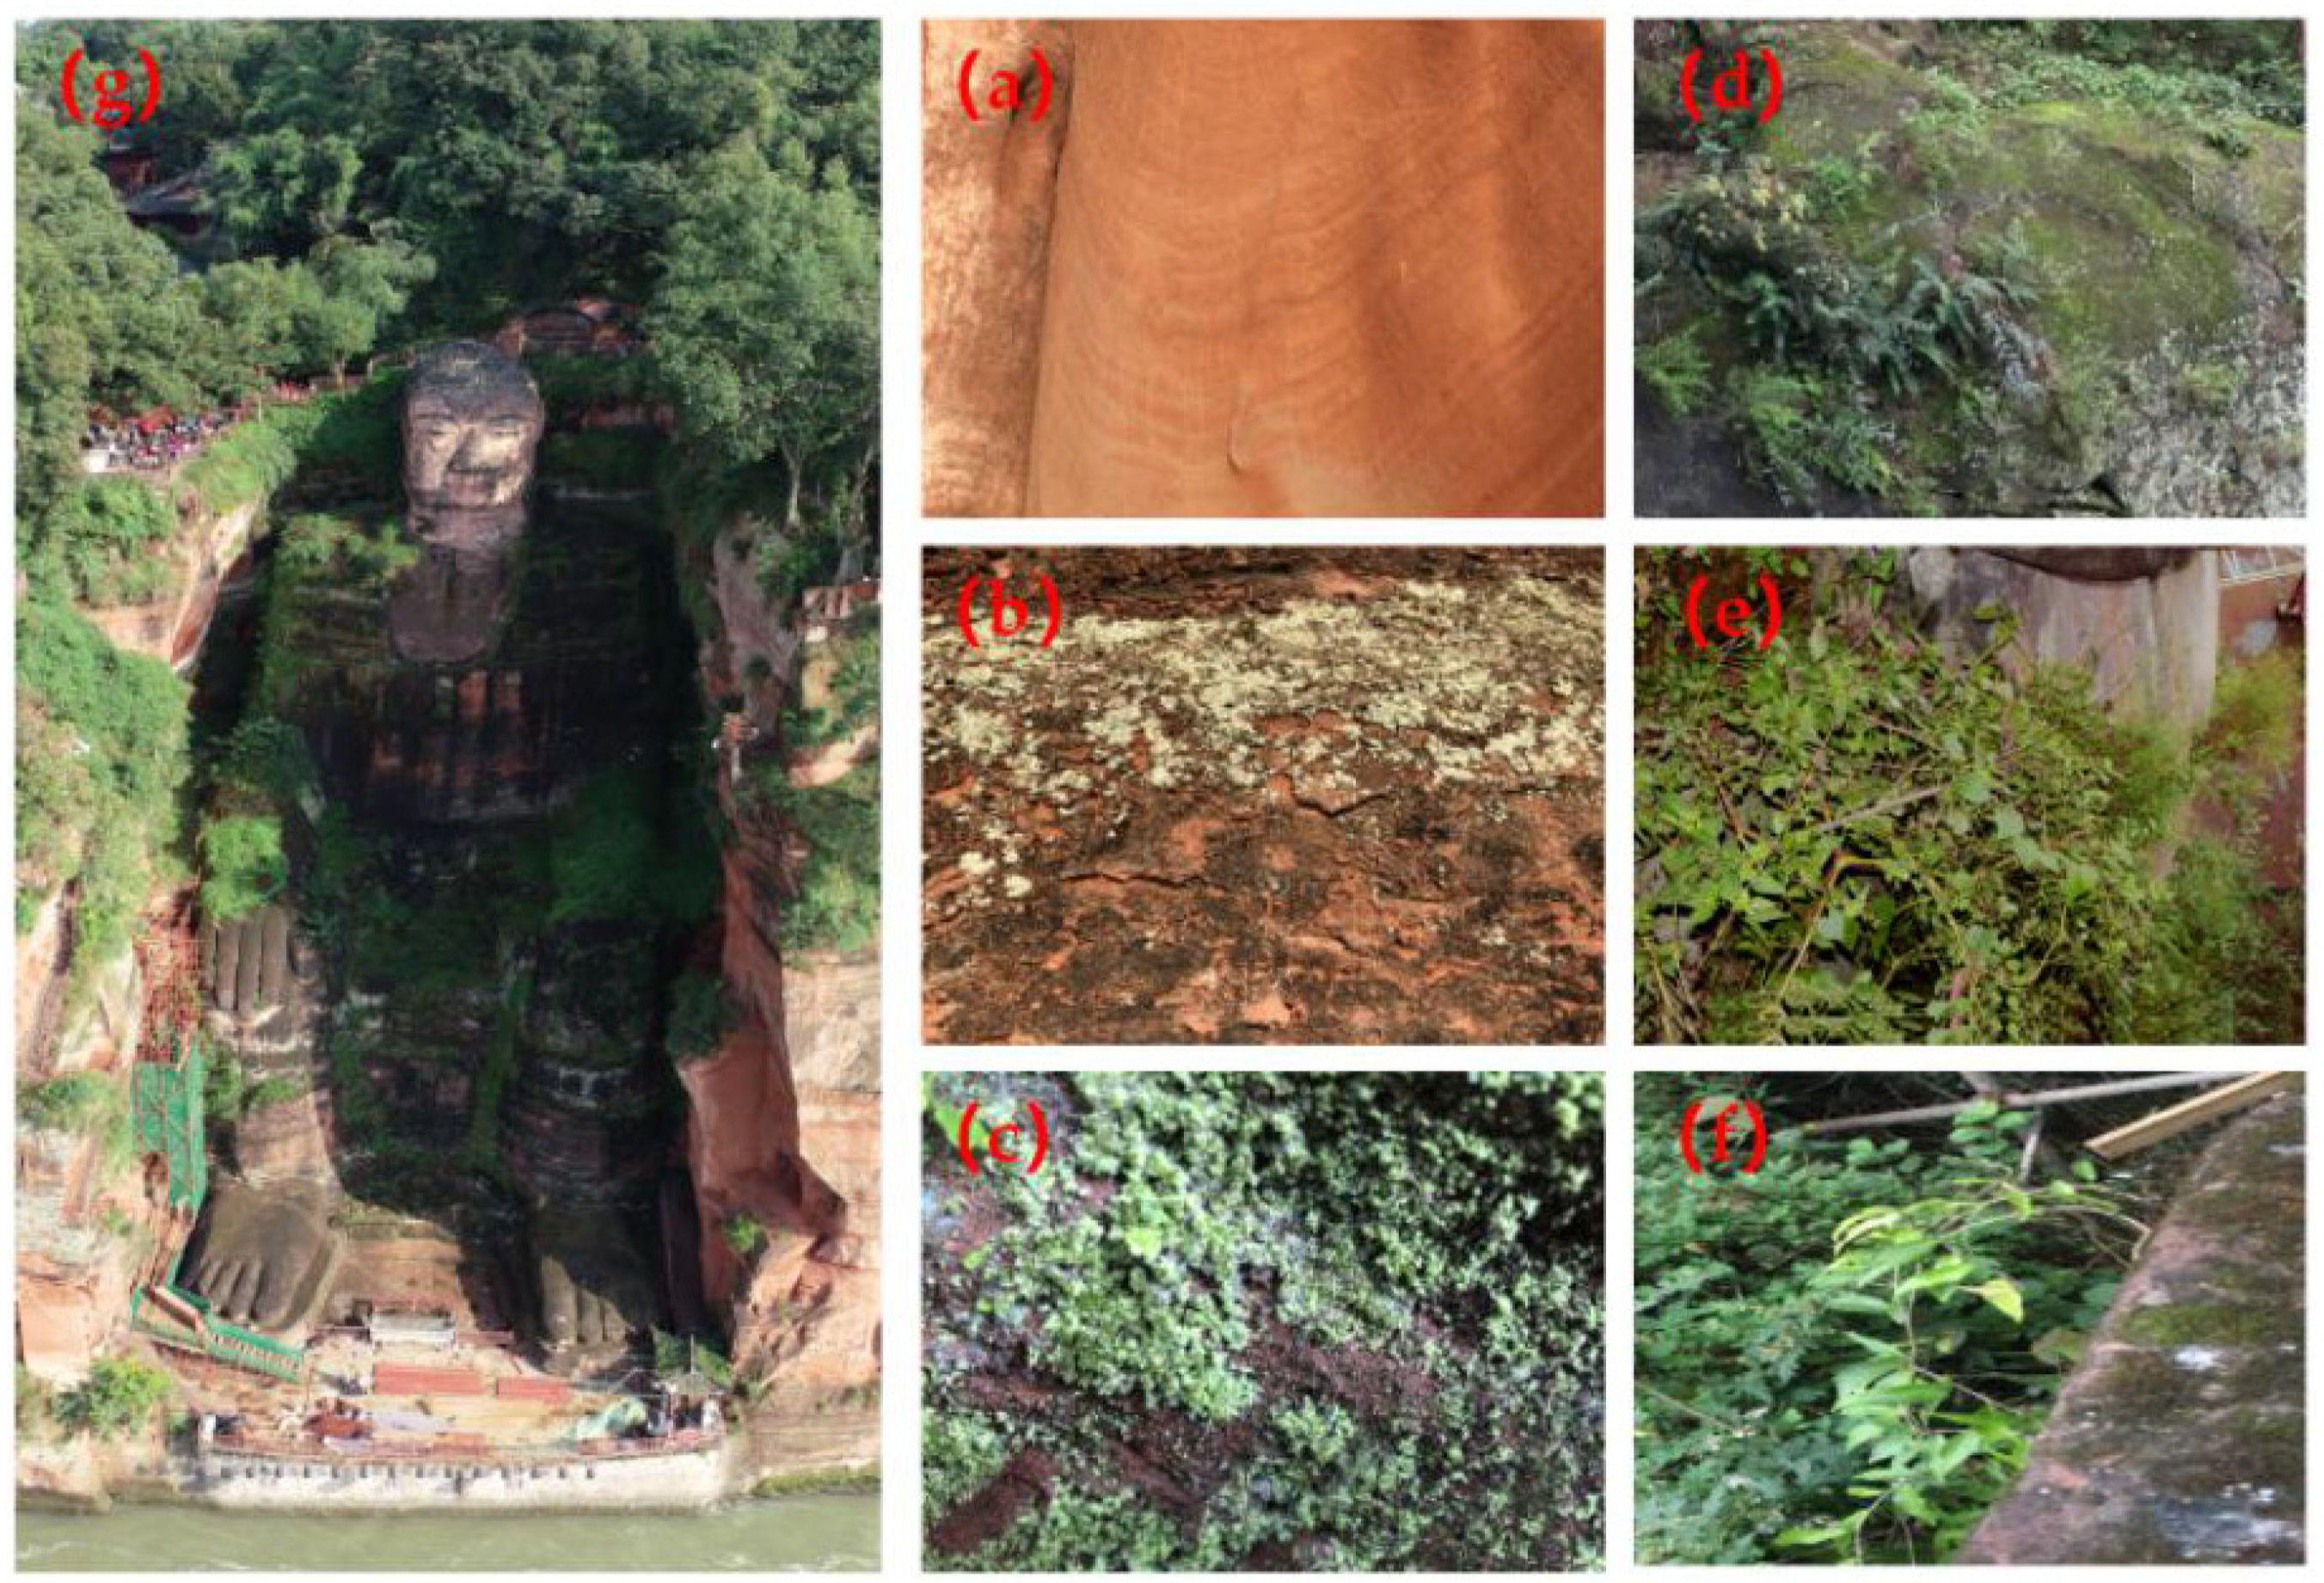
2.1. Study Site

Constructed in the Tang Dynasty (618–907), the Leshan Giant Buddha is situated in the Sichuan Basin in southwest China (29°32′47″ N, 103°45′48″ E). It was excavated on thick purple-red sandstone of the Triassic Jiaguan Formation at the confluence of the Minjiang, Qingyi and Dadu rivers in the southeast of Leshan City, Sichuan Province, China. Leshan has a subtropical monsoon climate with an average annual temperature of 16.4–17.5 °C, relative humidity of 81.0%, and annual average precipitation of 1300 mm. The dominant vegetation type around the Giant Buddha is subtropical evergreen broad-leaved forest dominated by Castanopsis spp., Cyclobalanopsis spp. and Schima superba.

2.2. Sample Collection

The samples were collected from the Leshan Giant Buddha body covered by different organisms. After a detailed investigation of the organisms, the Buddha body was divided into the following types: naked rock (NR), lichen covered sandstone (LR), soils on the interface of rock and bryophyte rhizoids (BS), soils with ferns (FS), soils with gramineous plant (GS) and soils in the rhizosphere of shrubs (SS) (Figure 1). All samples were collected from the body of the Leshan Giant Buddha that was exposed and covered by different organisms. Samples in each group were in triplicate and a total of 18 samples were collected.
Each sample was thoroughly mixed on ice and then subdivided into two parts. One was stored at −80 °C for DNA amplification and high-throughput sequencing of soil bacteria and fungi and the others were air-dried naturally and sieved (through a 100-mesh sieve) for the determination of chemical properties.

2.3. Determination of Chemical Properties

Ten grams of air-dried rock and soil samples were first placed into a 50 mL beaker and stirred fully after adding 25 mL distilled water (1:2.5, w/v) and then tested for pH value by a pH meter (PHS-3C, LEICI, Shanghai, China) [28,30].
Air-dried soil of 0.0100 g was put into the digestion tube (with appropriate amount of quartz sand), and then digested with potassium dichromate-concentrated sulfuric acid at 225 °C for 15 min. The cooling liquid added with o-phenanthroline indicator titrated with ferrous sulfate, and the soil TOC was calculated based on the volume consumed by the titrant. Then, 0.2000 g air-dried soil was put into the digestion tube and we added 10 mL of concentrated sulfuric acid, after leaving overnight, digest. The digestion solution with methyl red-bromocresol green indicator and boric acid solution (20 g·L−1) was titrated with hydrochloric acid standard solution (0.0100 mol·L−1) after distilling by Kjeldahl nitrogen analyzer (KND, Top Ltd., Hangzhou, Zhejiang, China), and soil TN content was then calculated based on hydrochloric acid consumption. TP was analyzed colorimetrically after the digestion with H2SO4 and HClO4 [31].

2.4. DNA Extraction and High-Throughput Sequencing

Soil DNA was extracted through the GENEOUT Soil DNA extraction kit (LabGene, Chengdu, China) by the manufacturer’s instructions. Concentration and quality of extracted DNA were evaluated by a NanodropTM 2000 Spectrophotometer (Nanodrop, Wilmington, DE, USA). The quality and integrity of the DNA extracts were checked by 1.0% agarose gel electrophoresis [32].
The V3-V4 hypervariable region of the 16S rRNA gene was amplified from bacterial genomic DNA using the universal primer combination according to Su et al. [33]. The fungal ITS2 region was amplified by fungi-specific primers [34]. The primers were tagged with unique bar codes for each sample and the amplicons were normalised, pooled, and sequenced by the standard protocols on the Illumina MiSeq PE300 platform at the Major Biological Institute in Shanghai, China. All these sequences were deposited in the NCBI Sequence Read Archive (SRA); SRP307460 was the accession number for 16S and SRP307497 was for ITS.

2.5. Data Processing and Statistical Analyses

The data were demultiplexed and mass filtered. Read data were demultiplexed, quality filtered, and processed with QIIME (quantitative insights into microbial ecology; Version 1.9.0) [35]. Usearch 8 was used to pick each operational taxonomic unit (OTU), including dereplication, clustering and detection of chimeras [36]. Sequences with a similarity over 97% were classified as an OTU. Taxonomic assignment of individual datasets for the bacteria and fungi was performed through SILVA (Release132 http://www.arb-silva.de, accessed on 29 November 2019) [37] and UNITE (Release 7.2 http://unite.ut.ee/index.php, accessed on 29 November 2019), respectively, with RDP Classifier (version 2.2 http://sourceforge.net/projects/rdp-classifier/, accessed on 29 November 2019) and a confidence threshold of 0.7.
A one-way analysis of variance (ANOVA) and multiple significant differences (p < 0.05) were used to assess the changes in soil properties (pH, TOC, TN, and TP) and soil microbial diversity and composition by SPSS (Version 20.0, IBM, New York, NY, USA).
Bacterial and fungal α-diversity were calculated within mothur (version v.1.30.1), including calculation of the following indices: Sobs, Chao, Ace, Shannon, and Coverage, and student’s t-test was used to test the differences among groups.
Principal co-component analysis (PCoA) of bacterial and fungal β-diversity were performed by QIIME with the matrix of Bray–Curtis distance, and the plots of PCoA were drawn in R software (Version 3.2.3), and differences in bacterial and fungal communities between different samples were analysed by ANOSIM test.
Canonical correspondence analysis (CCA) was conducted to investigate which environmental factors significantly affected microbial community structure and Spearman’s correlation analysis was used to investigate correlations among dominant microflora, microbial community diversity and environmental factors, which were performed using the heatmap package in R software (Version 2.15.3).

3. Results

3.1. Chemical Properties of Samples

Significant differences were detected in the pH, TOC, TN, and TP of the rock debris samples and soil samples colonised by a series of organisms on the surface of the Leshan Giant Buddha (Table 1). The results showed that all samples were neutral, and NR and LR had the lowest pH, whereas GS had the highest. TOC concentration ranged from 2.45 to 68.86 g·kg−1, and TN and TP concentrations from 0.71 to 6.49 g·kg−1 and from 0.19 to 0.82 g·kg−1, respectively. The variations in concentrations of TOC, TN and TP among groups covered by different organisms showed the similar order as SS > GS > FS > BS > LR > NR.
The ecological stoichiometry of C, N and P in samples varied considerably among different organisms on the surface of the Giant Buddha (Table 1). C:N ratio varied from 3.45 to 10.60. Specifically, C:N ratios of SS and GS samples were much higher than that of FS (p < 0.05), followed by BS, LR, and NR. The ratio of C:P varied from 12.72 to 86.99, and that of N:P from 3.7 to 9.03. Similar trends were observed in the ratios of C:P and N:P among different organisms on the surface of the Giant Buddha. Unlike C:N and C:P ratios, N:P ratio of BS was the highest (Table 1).

3.2. Analysis of Microbial Communities

3.2.1. Alpha Diversity of Bacterial and Fungal Communities

After quality filtering and trimming, the diversities (bacterial: 2,648,658 sequences with an average length of 456.75 bp; fungi: 2,622,748 sequences with an average length of 224.64 bp) of the soil microbial communities were obtained using the 16S rRNA and ITS primer sets across per sample and cluster analysis.
As shown in Figure S1, the rarefaction curves gradually flatten with the depth of sequencing using the method of random sampling of the sequence. This indicated that the amount of sequencing data is sufficient, and more data will only generate few numbers of new species (e.g., OTU), which can reflect most of the microbial diversity information of samples. Alpha diversity indices (Sobs, Shannon, Ace, Chao indices) displayed that, with the growth of embryo plants on the rock, sobs index (the observed OTUs) of bacteria gradually increased, especially the abundance of bacteria in the rhizosphere of FS samples reached the maximum which was distinctly higher than that of BS, LR and NR (p ≤ 0.05). Nonetheless, there was no significant change in the diversity indices of fungal community on the Giant Buddha covered with different organisms, despite that the values of the indices increased after the emergence of embryo plants compared with the NR and LR stages. Moreover, fungi diversity was higher than that of bacteria in a same sample.

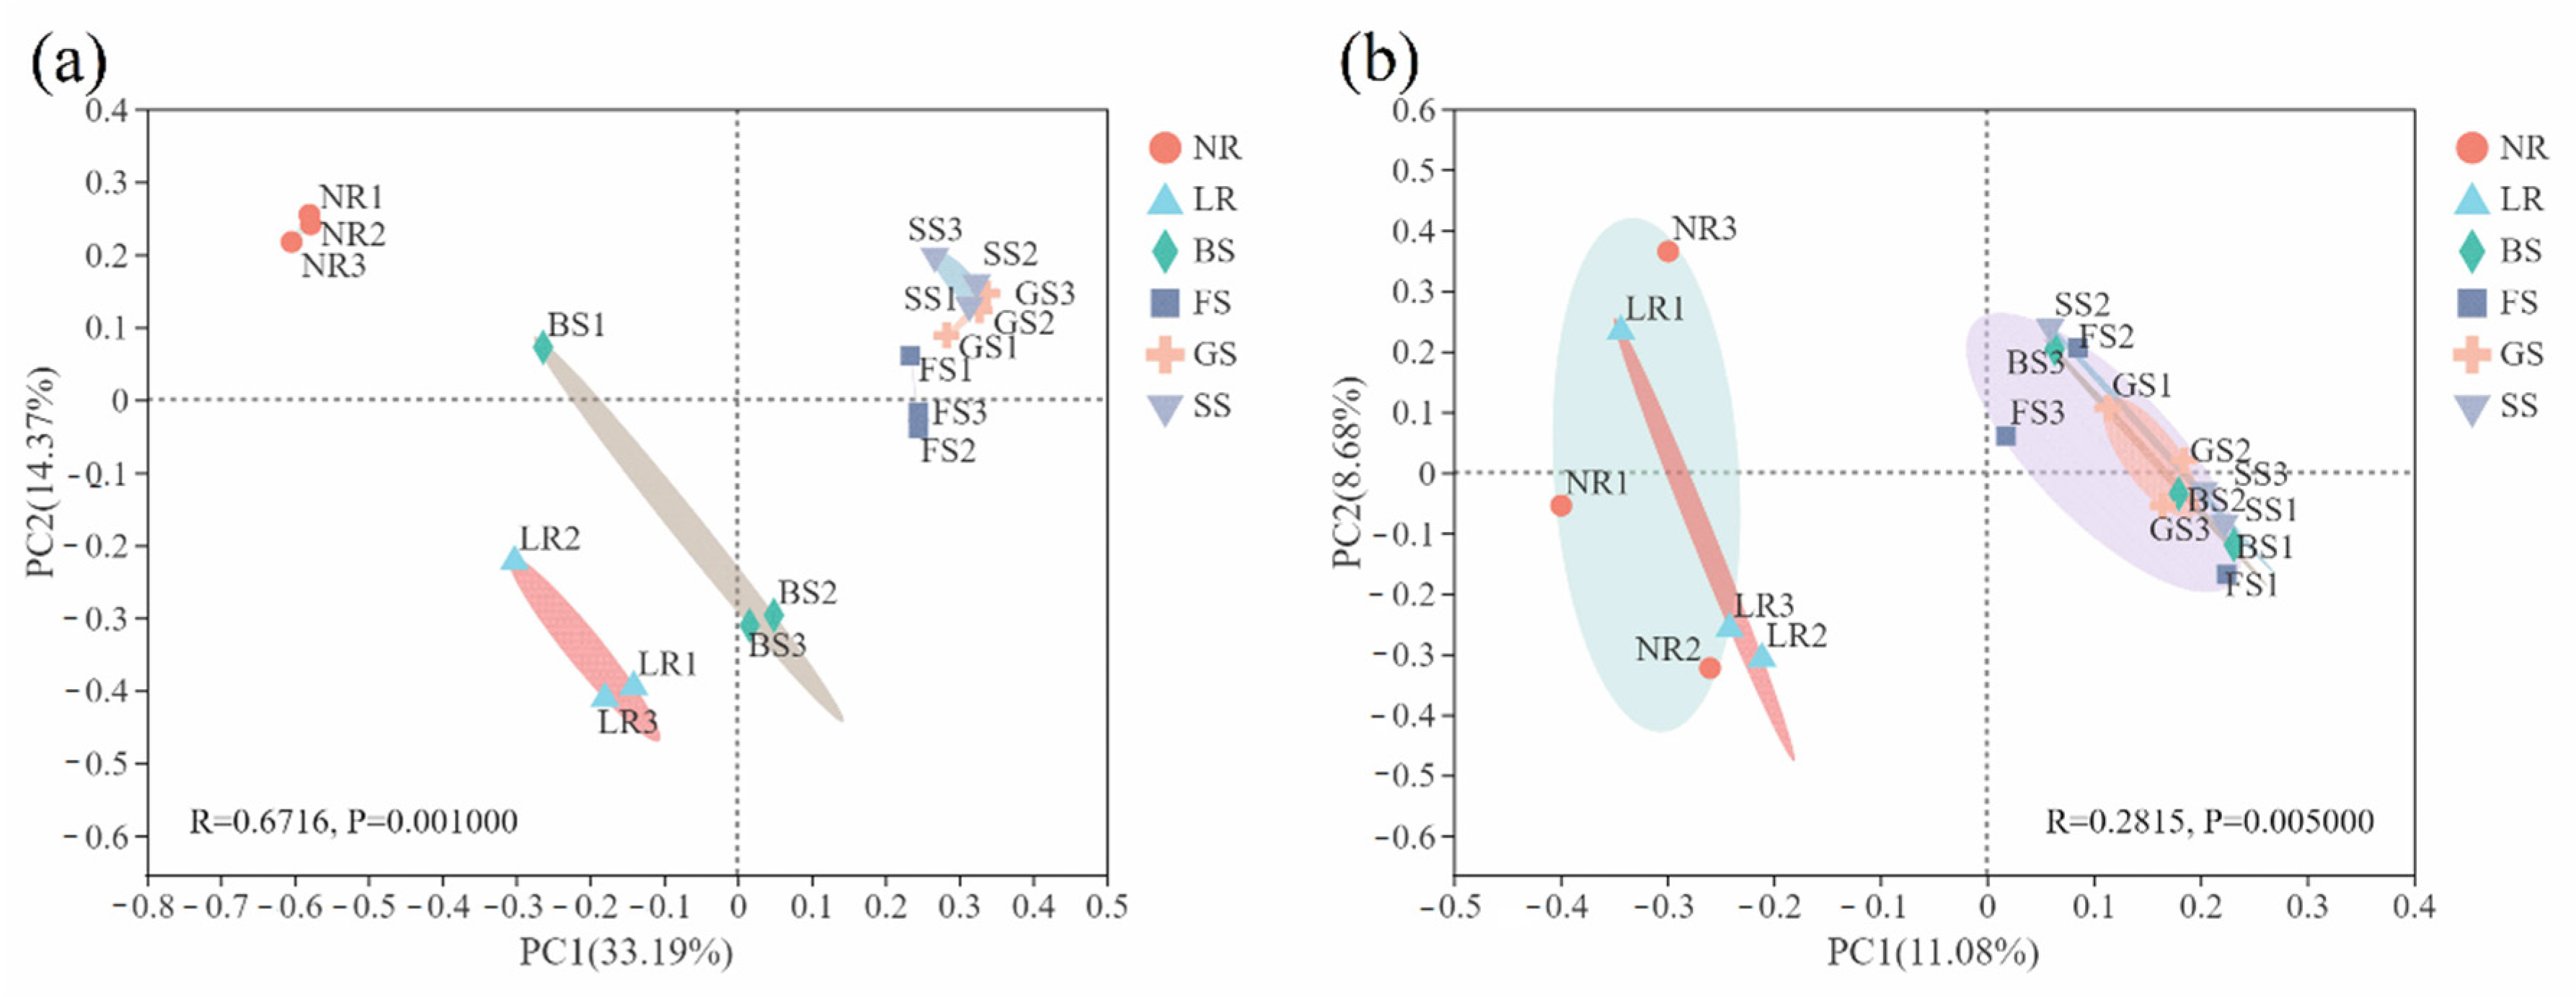
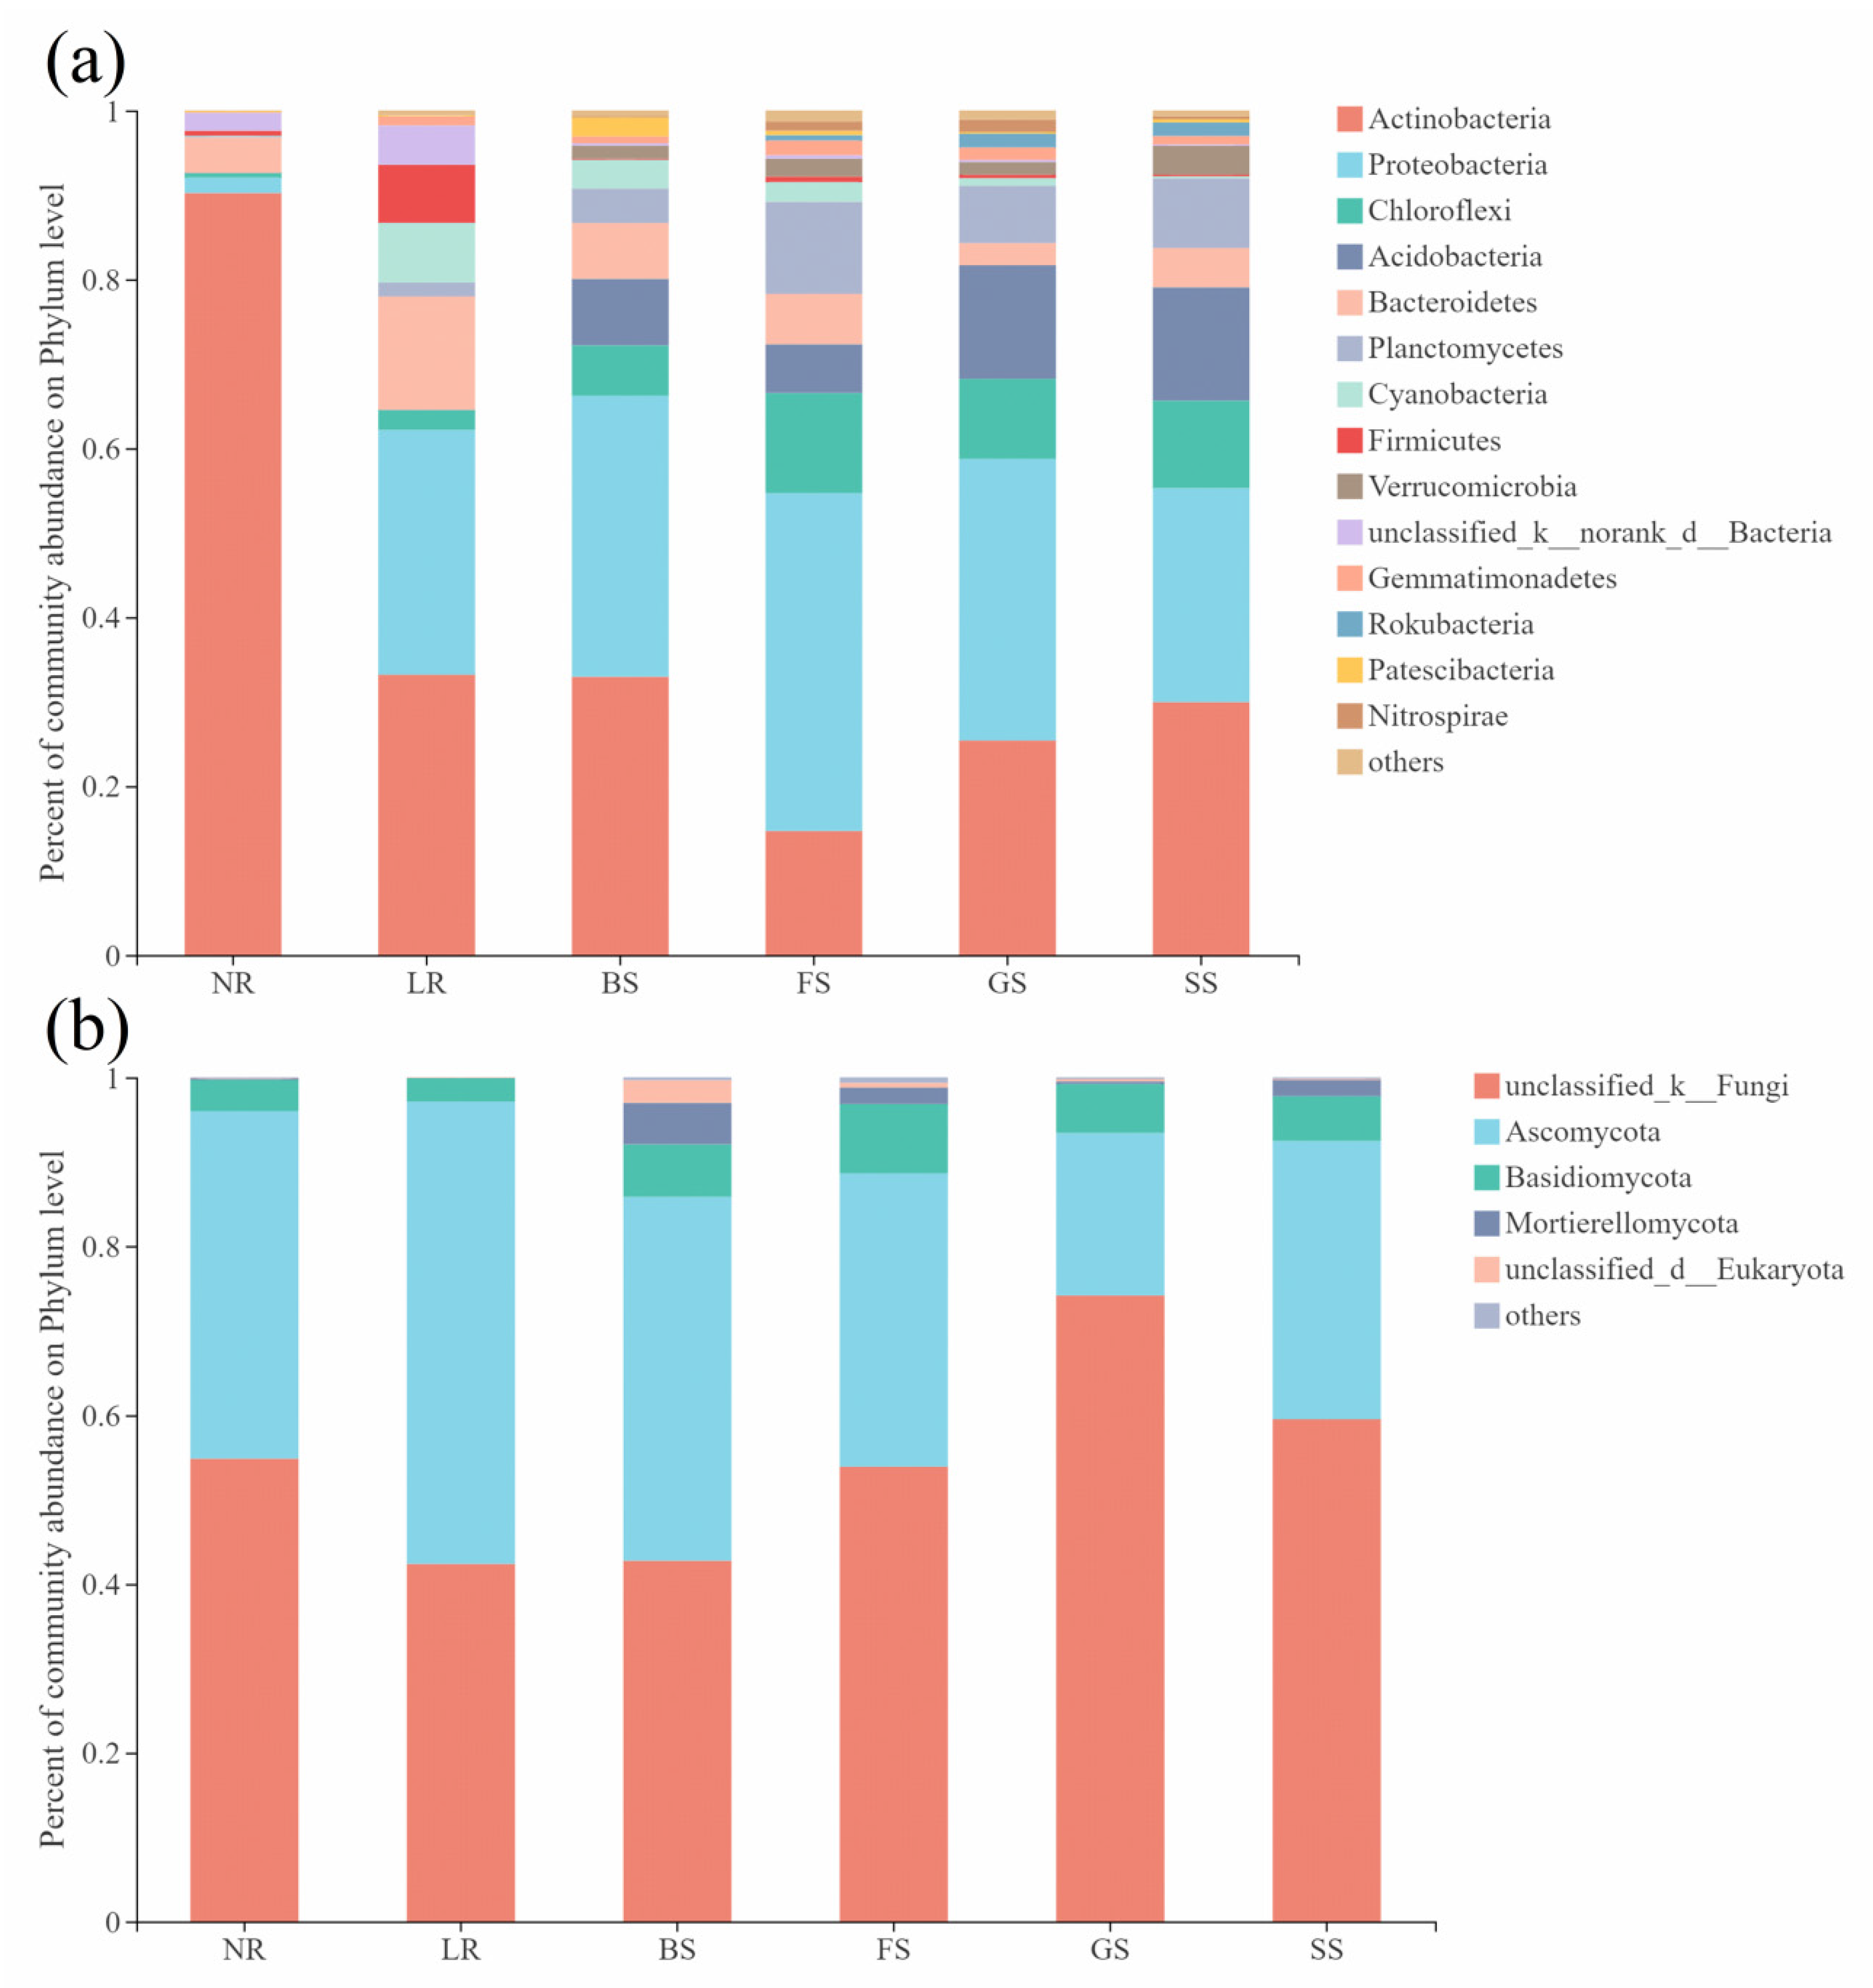
3.2.2. Structure and Composition of Bacterial and Fungal Communities

The β-diversity of microbial communities was adopted to analyze the similarity or difference relationship of the community structure among sample groups. The results of PCoA analysis were used to reflect the discrepancy and distances in soil microbial community composition among different sample groups. The results of this analysis emphasized the similarity of bacterial community composition between the GS and SS groups, but were clearly distinguished from the NR, LR, BS and FS groups, which were in turn distinct from one another (ANOSIM test, R = 0.6716, p = 0.001; Figure 2a). The PC2-axis in Figure 2b divided the fungi of all sample groups into two parts, with NR and LR in the left part, and the other four groups in the right. Fungi community composition between the two portions of significantly different (ANOSIM test, R = 0.2815, p = 0.005).
The further analysis of different groups of dominant bacteria (relative abundance above 1%) indicated that the bacterial diversity of NR was low, mainly represented by Actinobacteria (90.22 ± 8.09%) (relative abundance ± SD, the same below), Bacteroidetes (4.24 ± 6.22%) and Proteobacteria (1.77 ± 1.80%) (Figure 3a and Table S1). The bacterial species became more abundant with the emergence of organisms on rocks, while Proteobacteria still accounted for a high proportion (29.00 ± 28.25% in LR, 33.38 ± 5.94% in MS, 40.19 ± 2.61% in FS, 33.54 ± 8.05% in GS, and 25.36 ± 0.93% in SS, respectively). The relative abundances of Chloroflexi, Acidobacteria and Planctomycetes were also found to increase on rocks covered with organisms. The relative abundance of Chloroflexi rose from 0.51 ± 0.63% in NR to 2.34 ± 1.65%, 6.07 ± 2.82%, 11.88 ± 1.25%, 9.46 ± 0.84% and 10.38 ± 1.24% in LR, MS, FS GS and SS, respectively. While the relative abundance of Acidobacteria increased from 0.03 ± 0.04% in NR to 0.03 ± 0.02%, 7.81 ± 4.61%, 5.79 ± 1.28%, 13.35 ± 3.01% and 13.31 ± 1.42% in LR, MS, FS GS and SS, respectively. Planctomycetes increased from 0.10 ± 0.16% in NR to 1.60 ± 2.08%, 4.07 ± 1.75%, 10.86 ± 2.63%, 6.78 ± 2.30% and 8.24 ± 2.41% in LR, MS, FS GS and SS, respectively. Nevertheless, the proportion of Cyanobacteria dropped from 5.04 ± 7.20% in LR to 3.44 ± 3.40%, 2.35 ± 0.96%, 0.93 ± 1.06% and 0.23 ± 0.23% in MS, FS GS and SS, respectively. Notably, Nitrospirae appeared in BS and the relative abundance increased significantly in FS, GS and SS.
Ascomycota, Basidiomycota and Mortierellomycota were dominant among the fungal community at phylum taxonomic classification level except for NO_Rank without annotation information (Figure 3b and Table S1). The relative abundances of Ascomycota and Mortierellomycota differed in different sample groups. Specifically, Mortierellomycota was more abundant in BS, FS and SS groups than that in NR and LR. Nevertheless, the abundance of Ascomycota in NR and LR was higher than that in FS and SS. The proportion of unclassified_k_Fungi ranged from 42.38% to 72.52% and there were no significant differences between groups (Figure 3b and Table S1).

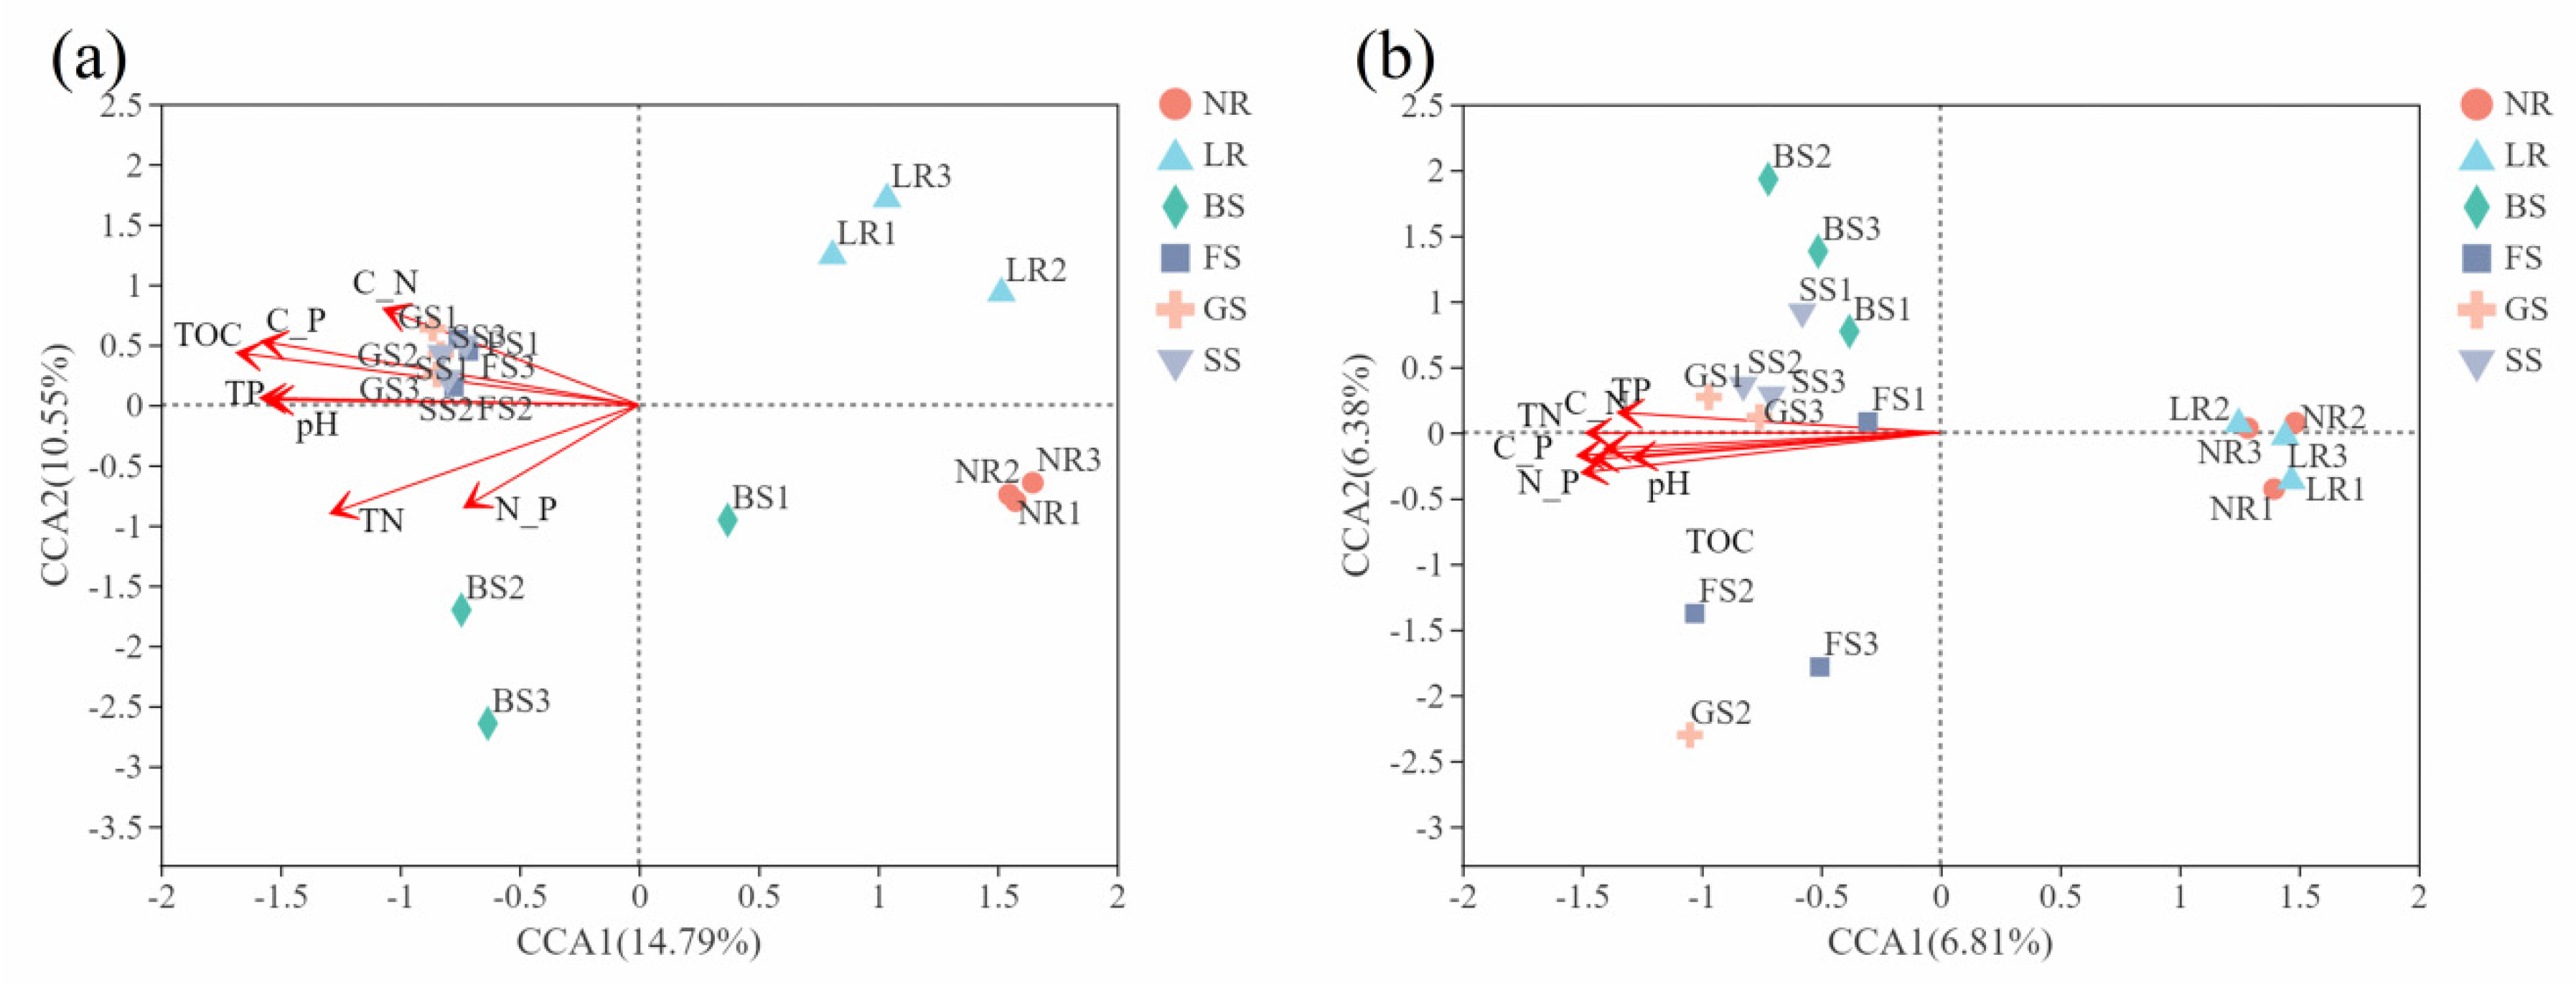
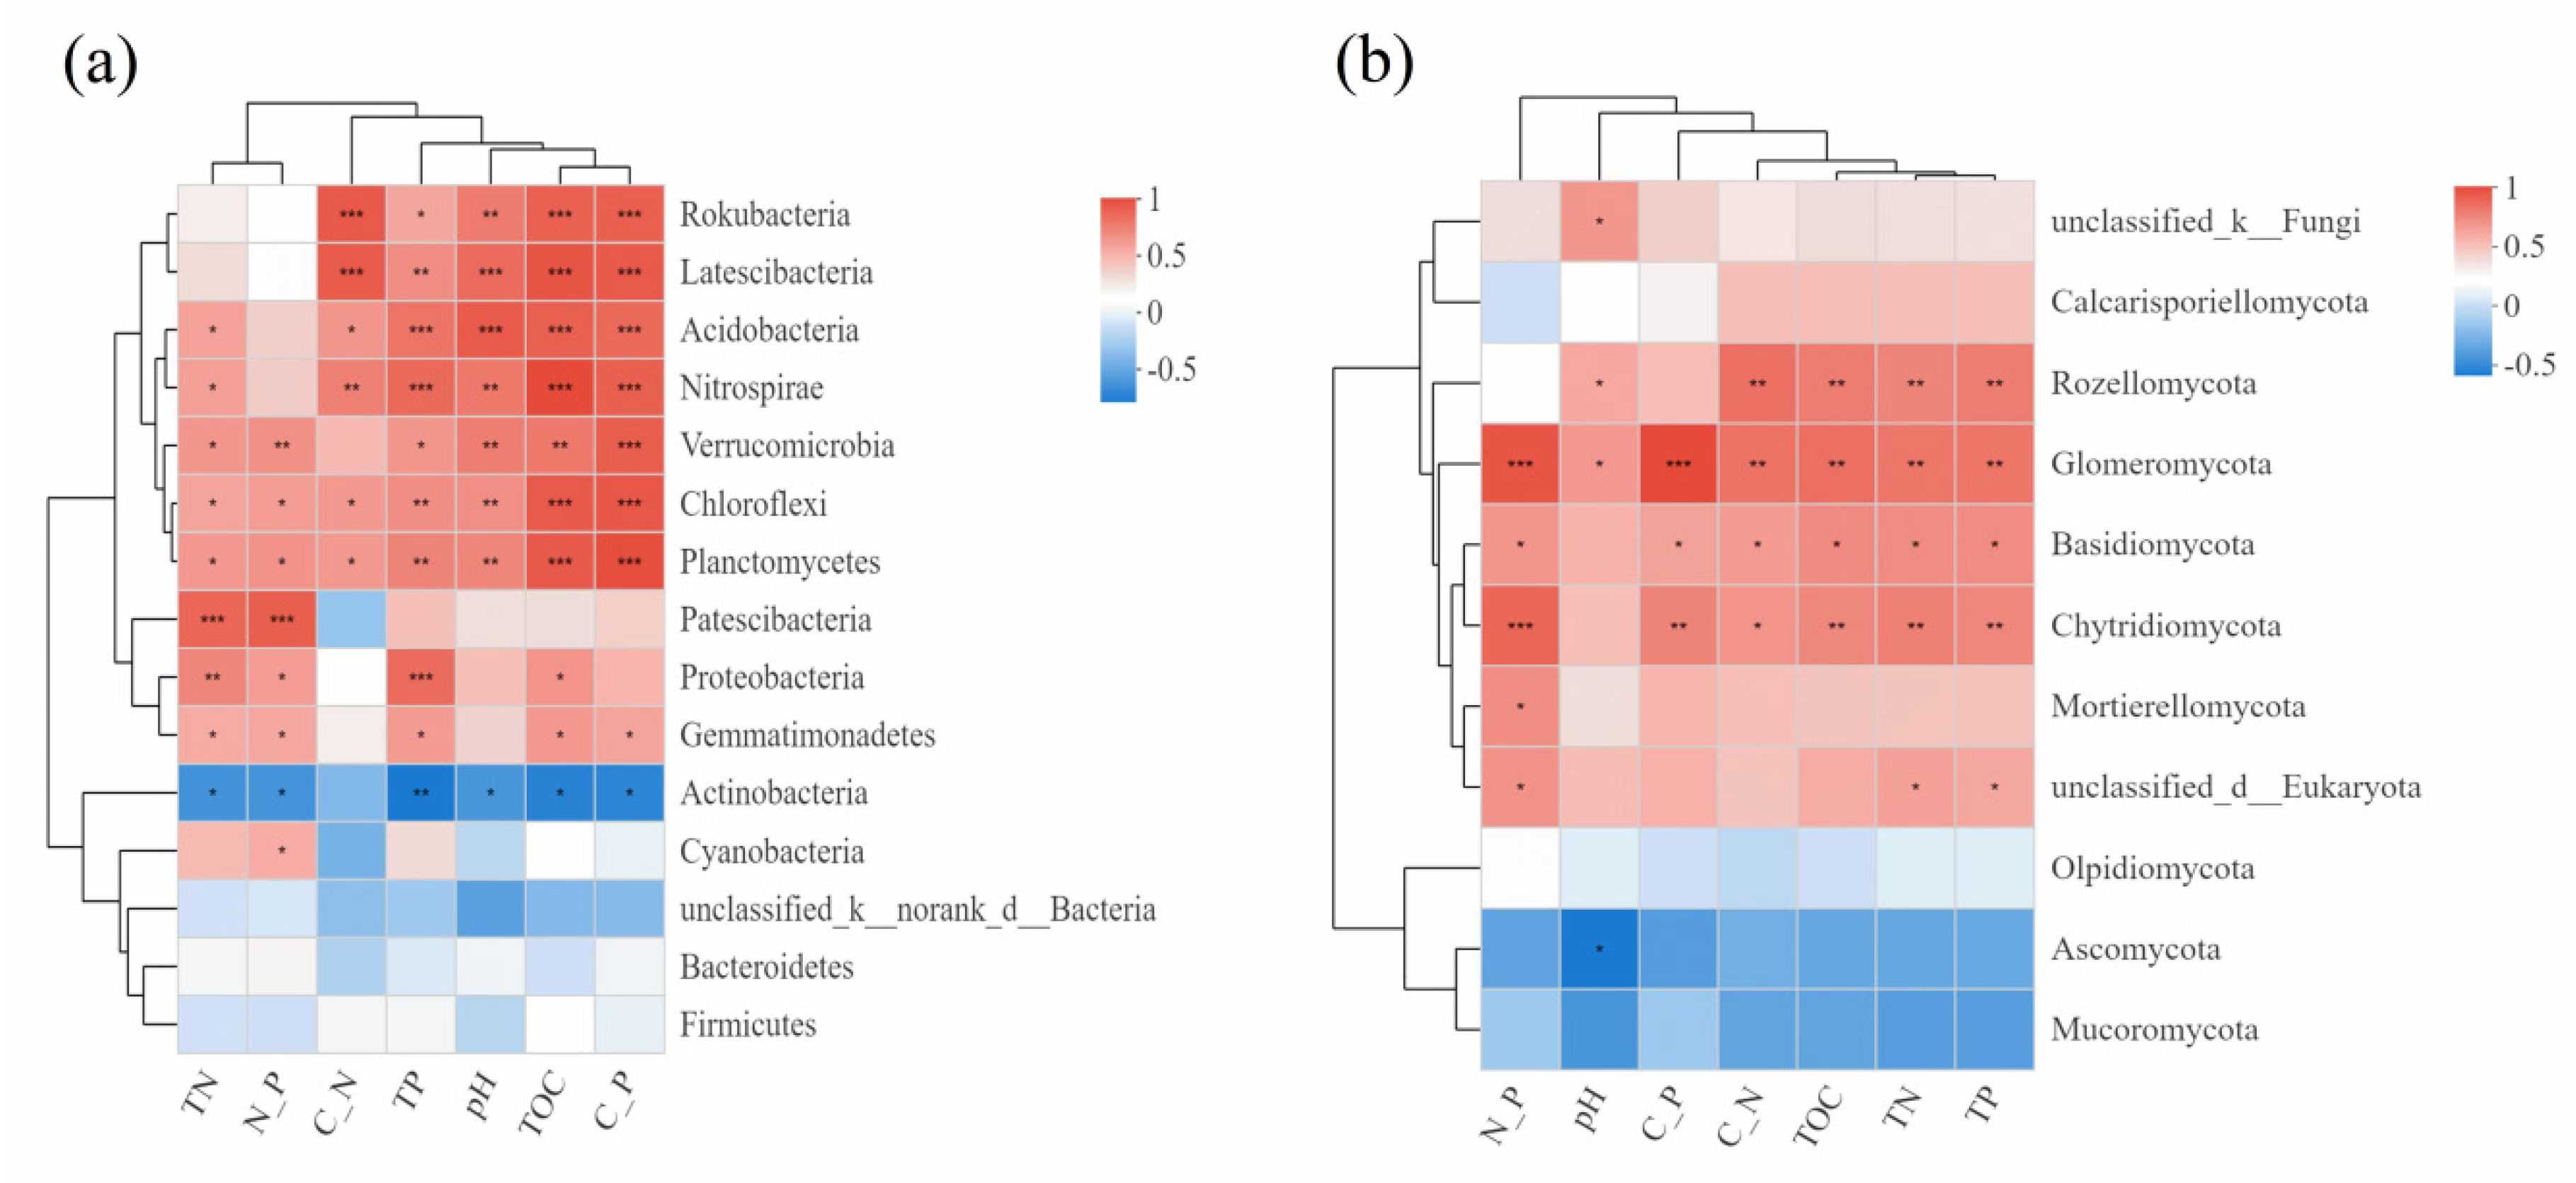
3.2.3. Correlation Analysis between Microbial Diversity and Ecological Factors

CCA was used to assess the correlation of seven ecological factors with diversity of bacterial and fungal community at the OTU level. The results showed that TOC, TN, TP, C:N, and C:P were significantly correlated with the composition of bacterial community, and the correlation between these ecological factors and bacterial communities is in a descending order: TOC (R2 = 0.7595, p = 0.001) >C:P (R2 = 0.6962, p = 0.001) >pH (R2 = 0.6264, p = 0.001) >TP (R2 = 0.5991, p = 0.002) >TN (R2 = 0.5886, p = 0.001) > C:N (R2 = 0.4366, p = 0.013) (Figure 4a and Table S2). Furthermore, TOC, TN, TP, C:N, and C:P were also significantly related to the composition of fungal community, and the correlation of these environmental factors with fungal communities is in a decreasing order as: C:P (R2 = 0.9242, p = 0.001) > N:P (R2 = 0.9222, p = 0.001) >TN (R2 = 0.8654, p = 0.001) > C:N (R2 = 0.8495, p = 0.001) > TOC (R2 = 0.7803, p = 0.001) >TP (R2 = 0.7225, p = 0.001) >pH (R2 = 0.6677, p = 0.001) (Figure 4b and Table S2). In addition, all the ecological factors were positively correlated with FS, GS and SS (Figure 4).
Spearman’s correlation analysis was adopted to investigate the correlations between dominant microflora at the phylum level and environmental factors, and the results were presented in Figure 5. The TOC, pH, TP, C:N and C:P were significantly and positively correlated with the relative abundances of Planctomycetes, Chloroflexi, Verrucomicrobia, Nitrospirae, Acidobacteria, while conversely, significantly and negatively correlated with the relative abundance of Actinobacteria. As for fungal communities, the TOC, TN, TP, C:N and N:P were in significant, positive correlation with the relative abundances of Glomeromycota, Basidiomycota, Chytridiomycota, and only pH was in significant, negative correlation with the relative abundance of Ascomycota.

4. Discussion

It is now well-accepted that soil microbial communities play a vital role in the weathering of rock, formation of soil and the succession of terrestrial biodiversity, but there are still inconsistencies on the responses of soil microbial communities to the succession and development of above-ground vegetation and soil environment. The present study shows the changes of bacterial and fungal community in soil covered by different organisms and bare rock on the Leshan Giant Buddha body, which can increase our understanding of functional connection between above-ground vegetation and soils at a small-scale spatial.

4.1. Responses of Environmental Properties to the Organism Types

Plants affect total C and N concentrations in soil directly via two major pathways: one is associated with litter, and the other with roots [38]. During litter decomposition, soil organisms redistribute organic matter, increase soil porosity and enhance soil aggregate formation, greatly increasing soil organic C and N contents [39,40,41]. Furthermore, the large number of assimilates transferred to symbionts by roots also greatly alter soil sorption capacity, water holding capacity, and other soil properties [42,43]. In the present study, TOC and TN contents increased with the change in organisms from lichen, Bryophyte, Fern to grasses and shrubs. This is consistent with the results of natural succession [44,45]. Specifically, TOC and TN contents in BS, FS, GS and SS were 4.12, 7.07, 9.88, 10.63 and 2.42, 3.13, 3.78, 3.91 times of those in LR, respectively. This agrees with the view that vascular plants can better enhance the quantity and quality of external inputs (litters and rhizosphere sediments) to soil [46,47,48]. In addition, with the progress of natural succession, the strengthened effect of biological nitrogen fixation and the increase in nitrogen mineralization in rock substrate also raised the content of soil nitrogen [49,50]. Nevertheless, the results of the concentration of TOC, TN and TP highest in SS at present study showed dissonance with Wu et al. [51], in which C and N concentration were highest in the liverwort group and P in the Fern group. The variation between the results of two independent experiments may be attributed to the different sampling locations.
Similarly, soil phosphorus content increased with the change in organisms from lichen, Bryophyte, Fern to grasses and shrubs. Nevertheless, it showed no obvious change in most studies regarding vegetation succession [52,53,54], and even showed a descending trend [55,56]. One possible explanation for this result is the specificity of the study site. In terrestrial ecosystem, carbon, nitrogen, and phosphorus have different sources. Among them, carbon and N in soil mostly originate from plant residue on the surface, while P mainly from the weathering of rocks [57]. The significant increase in TP content in sites covered with vascular plants in our study may be ascribed to the fact that vascular plants increase litters and rhizosphere sediments to soil more effectively, which in turn promoted the release of minerals by microorganisms in an environment with a rock background [46,47,48].
A disproportionately large increase in C, N, and P contents induced by different organism types may lead to changes in the C:N:P stoichiometry in the plant–soil–microbe continuum [58]. The lower C:P and N:P ratios in NR and LR sites, as well as the higher C:P and N:P ratios of vascular plant coverage sites in this study, indicated that P element is more effective at NR and LR sites on the Leshan Giant Buddha body, and N element limits plant development in the area covered by vascular plants. Previous studies on community succession series have also confirmed the limitations of N and P in the early and late succession stage, respectively [50,59].

4.2. Responses of Microbial Community Diversity and Richness to the Organism Types

Soil microbial communities, like soil nutrient availability, underwent compositional and functional shifts as aboveground organisms changed from lichens to bryophyte and vascular plants (Table 2), indicating the subtle relationship between soil microbial community and soil nutrients. In the present study, the results indicated that bacterial and fungal diversity responded differently to the variation in above-ground organism types, and the diversity and richness of bacterial communities changed significantly among different sites. The rapid growth in numbers of soil bacterial species in the early succession stages may be attributed to the selective advantage: their rapid response to nutrient inputs in newly exposed rock environment [60]. Meanwhile, soil nutrients gradually increased, providing an adequate source of carbon, nitrogen, phosphorus and energy for bacterial growth as the primary succession progresses [61]. Different from bacteria, the fungal diversity showed no obvious fluctuation and trend among the sites covered with different types of organisms except for unclassified_k_Fungi. This may be related to the random transmission of spores in the air [61], the increased intraspecific competition resulted from similar niche and the synergistic effect of these factors [62]. Distinct responses to above-ground organisms between soil bacteria and fungi may be ascribed to differences in metabolic types and adaptations to environmental changes and shifts in nutrients’ availability conditions [63,64].
Our results showed that the dominant groups of bacteria changed dramatically among sites covered with various organisms, and these significant changes may generate variations in soil microbial community related to soil carbon and nitrogen cycles. For example, the oligotrophic Actinobacteria was among the most abundant phylogenetic group in all sites, and its abundance in NR was approximately 90%, or close to triple that in other sites. The physiological adaption mechanism of Actinobacteria species to the low-nutrient environment is probably related to their talent for degrading large organic molecules, and the rich hyphae structure that facilitates absorbing nutrients from the surrounding environment [65]. Compared with NR, the abundance of Proteobacteria and Cyanobacteria in LR is significantly higher than that of Actinomycetes. Because the extracellular membrane of Proteobacteria contains lipopolysaccharides involved in carbon conversion, it is generally considered to be copiotrophic bacteria [66]. An important component of lichen symbiont, Cyanobateria are capable of fixing atmospheric CO2 and N2, contributing to accumulating organic matter on the rock surface, and supplying heterotrophic microorganisms and plant colonisation with basic nutrition. Bryophytes and vascular plants are more efficient at photosynthesis than lichens and thus can deliver more organic carbon to the soil, so the abundance of Cyanobateria began to decline in BS, FS, GS and SS. Simultaneously, TOC, TN and TP contents rose significantly in sites covered with bryophytes or vascular plants, which coincided with the increase in the abundance of copiotrophic bacteria. For example, no Nitrospirae associated with soil nitrification was found in NR and LR, and its abundance in vascular plant cover was higher than that in bryophyte cover. Interestingly, although Acidobacteria, Chloroflexi and Planctomycetes were more abundant in GS and SS than in other sites, they are commonly used as oligotrophic bacteria [67,68]. This is consistent with previous studies that oligotrophic bacteria are likely to outcompete copiotrophs in environments, for example, the Leshan Giant Buddha, where microorganisms are exposed to constant environmental stress [67,68]. Ascomycetes are the basis of lichen formation, which partly explain the higher abundance of Ascomycota in LR. The relative abundance of Basidiomycota was higher in plant-covered sites, which may stem from the ability of Basidiomycota to convert organic matter into inorganic compounds, thereby promoting the degradation and reduction of litter [69].

5. Conclusions

The results of the present study showed that the TOC, TN and TP contents increased with the change in organisms from lichens to bryophyte and vascular plants, accompanied by the increase in bacterial and fungal diversity. The types of above-ground organisms largely affected the composition and diversity of bacterial communities by regulating soil nutrients. Distinct responses of soil bacteria and fungi to above-ground organisms are possibly caused by the differences in metabolic types and adaptations to environmental changes and shifts in nutrients availability conditions. A full understanding of the succession law of microbial communities with changes of above-ground organism can provide a scientific basis for the protection of outdoor stone relics.

Supplementary Materials

The following are available online at https://www.mdpi.com/article/10.3390/su13073897/s1, Figure S1: Rarefaction curves for each sample from six groups. (a), the rarefaction curves for each sample of bacterial community; (b), the rarefaction curves for each sample of fungal community. NR: naked rock; LR: lichen-covered rock; BS: bryophyte-covered rock; FS: fern-covered rock; GS: grass-covered rock; SS: shrub-covered rock. The letters stand for the same below. Table S1: Relative abundance of bacteria and fungi phyla of six samples covered by different organism, Table S2: Values of correlation between environmental factors and the communities of bacteria and fungi.

Author Contributions

Conceptualization, H.S. and X.C.; methodology, X.C.; software, X.C.; validation, H.S. and X.C.; formal analysis, X.C.; investigation, M.W. and F.W.; resources, B.S.; data curation, M.W.; writing—original draft preparation, X.C.; writing—review and editing, H.S.; visualization, F.W.; supervision, T.Y.; project administration, H.S. All authors have read and agreed to the published version of the manuscript.

Funding

This research received no external funding.

Institutional Review Board Statement

Not applicable.

Informed Consent Statement

Not applicable.

Data Availability Statement

The data presented in this study are available on request from the corresponding author.

Conflicts of Interest

The authors declare no conflict of interest.

References

  1. Bardgett, R.D.; Mommer, L.; De Vries, F.T. Going underground: Root traits as drivers of ecosystem processes. Trends Ecol. Evol. 2014, 29, 692–699. [Google Scholar] [CrossRef]
  2. Van der Heijden, M.G.A.; Bardgett, R.D.; van Straalen, N.M. The unseen majority: Soil microbes as drivers of plant diversity and productivity in terrestrial ecosystems. Ecol. Lett. 2008, 11, 296–310. [Google Scholar] [CrossRef]
  3. Bardgett, R.D.; Freeman, C.; Ostle, N.J. Microbial contributions to climate change through carbon cycle feedbacks. ISME J. 2008, 2, 805–814. [Google Scholar] [CrossRef] [PubMed] [Green Version]
  4. Chen, Y.; Ding, J.; Peng, Y.; Li, F.; Yang, G.; Liu, L.; Qin, S.; Fang, K.; Yang, Y. Patterns and drivers of soil microbial communities in Tibetan alpine and global terrestrial ecosystems. J. Biogeogr. 2016, 43, 2027–2039. [Google Scholar] [CrossRef]
  5. Burns, J.H.; Anacker, B.L.; Strauss, S.Y.; Burke, D.J. Soil microbial community variation correlates most strongly with plant species identity, followed by soil chemistry, spatial location and plant genus. Aob Plants 2015, 7, v30. [Google Scholar] [CrossRef] [Green Version]
  6. Maharning, A.R.; Mills, A.A.S.; Adl, S.M. Soil community changes during secondary succession to naturalized grasslands. Appl. Soil Ecol. 2009, 41, 137–147. [Google Scholar] [CrossRef]
  7. Zhang, C.; Liu, G.; Xue, S.; Wang, G. Soil bacterial community dynamics reflect changes in plant community and soil properties during the secondary succession of abandoned farmland in the Loess Plateau. Soil Biol. Biochem. 2016, 97, 40–49. [Google Scholar] [CrossRef]
  8. Prober, S.M.; Leff, J.W.; Bates, S.T.; Borer, E.T.; Firn, J.; Harpole, W.S.; Lind, E.M.; Seabloom, E.W.; Adler, P.B.; Bakker, J.D.; et al. Plant diversity predicts beta but not alpha diversity of soil microbes across grasslands worldwide. Ecol. Lett. 2015, 18, 85–95. [Google Scholar] [CrossRef]
  9. Singh, B.K.; Millard, P.; Whiteley, A.S.; Murrell, J.C. Unravelling rhizosphere–microbial interactions: Opportunities and limitations. Trends Microbiol. 2004, 12, 386–393. [Google Scholar] [CrossRef]
  10. He, X.; Wang, K.; Zhang, W.; Chen, Z.; Zhu, Y.; Chen, H. Positive correlation between soil bacterial metabolic and plant species diversity and bacterial and fungal diversity in a vegetation succession on Karst. Plant Soil 2008, 307, 123–134. [Google Scholar] [CrossRef]
  11. Kielak, A.; Pijl, A.S.; Van Veen, J.A.; Kowalchuk, G.A. Differences in vegetation composition and plant species identity lead to only minor changes in soil-borne microbial communities in a former arable field. FEMS Microbiol. Ecol. 2008, 63, 372–382. [Google Scholar] [CrossRef] [Green Version]
  12. Liu, Y.; Lu, M.; Zhang, X.; Sun, Q.; Liu, R.; Lian, B. Shift of the microbial communities from exposed sandstone rocks to forest soils during pedogenesis. Int. Biodeterior. Biodegrad. 2019, 140, 21–28. [Google Scholar] [CrossRef]
  13. Zhong, Z.; Zhang, X.; Wang, X.; Fu, S.; Wu, S.; Lu, X.; Ren, C.; Han, X.; Yang, G. Soil bacteria and fungi respond differently to plant diversity and plant family composition during the secondary succession of abandoned farmland on the Loess Plateau, China. Plant Soil 2020, 448, 183–200. [Google Scholar] [CrossRef]
  14. Xu, M.; Gao, D.; Fu, S.; Lu, X.; Wu, S.; Han, X.; Yang, G.; Feng, Y. Long-term effects of vegetation and soil on the microbial communities following afforestation of farmland with Robinia pseudoacacia plantations. Geoderma 2020, 367, 114263. [Google Scholar] [CrossRef]
  15. Lazzaro, A.; Hilfiker, D.; Zeyer, J. Structures of microbial communities in alpine soils: Seasonal and elevational effects. Front. Microbiol. 2015, 6, 1330. [Google Scholar] [CrossRef] [PubMed] [Green Version]
  16. Hazard, C.; Gosling, P.; van der Gast, C.J.; Mitchell, D.T.; Doohan, F.M.; Bending, G.D. The role of local environment and geographical distance in determining community composition of arbuscular mycorrhizal fungi at the landscape scale. ISME J. 2013, 7, 498–508. [Google Scholar] [CrossRef] [PubMed] [Green Version]
  17. Yuan, X.; Knelman, J.E.; Gasarch, E.; Wang, D.; Nemergut, D.R.; Seastedt, T.R. Plant community and soil chemistry responses to long-term nitrogen inputs drive changes in alpine bacterial communities. Ecology 2016, 97, 1543–1554. [Google Scholar] [CrossRef] [PubMed]
  18. Zinger, L.; Lejon, D.P.; Baptist, F.; Bouasria, A.; Aubert, S.; Geremia, R.A.; Choler, P. Contrasting diversity patterns of crenarchaeal, bacterial and fungal soil communities in an alpine landscape. PLoS ONE 2011, 6, e19950. [Google Scholar] [CrossRef] [Green Version]
  19. Liu, Z.; Fu, B.; Zheng, X.; Liu, G. Plant biomass, soil water content and soil N:P ratio regulating soil microbial functional diversity in a temperate steppe: A regional scale study. Soil Biol. Biochem. 2010, 42, 445–450. [Google Scholar] [CrossRef]
  20. Daniel, D.W.; Smith, L.M.; Belden, J.B.; McMurry, S.T.; Swain, S. Effects of land-use change and fungicide application on soil respiration in playa wetlands and adjacent uplands of the U.S. High Plains. Sci. Total Environ. 2015, 514, 290–297. [Google Scholar] [CrossRef]
  21. Bakker, M.G.; Schlatter, D.C.; Otto-Hanson, L.; Kinkel, L.L. Diffuse symbioses: Roles of plant-plant, plant-microbe and microbe-microbe interactions in structuring the soil microbiome. Mol. Ecol. 2014, 23, 1571–1583. [Google Scholar] [CrossRef] [PubMed]
  22. Dang, P.; Gao, Y.; Liu, J.; Yu, S.; Zhao, Z. Effects of thinning intensity on understory vegetation and soil microbial communities of a mature Chinese pine plantation in the Loess Plateau. Sci. Total Environ. 2018, 630, 171–180. [Google Scholar] [CrossRef]
  23. Williams, A.; Börjesson, G.; Hedlund, K. The effects of 55 years of different inorganic fertiliser regimes on soil properties and microbial community composition. Soil Biol. Biochem. 2013, 67, 41–46. [Google Scholar] [CrossRef]
  24. Van der Heijden, M.G.; de Bruin, S.; Luckerhoff, L.; van Logtestijn, R.S.; Schlaeppi, K. A widespread plant-fungal-bacterial symbiosis promotes plant biodiversity, plant nutrition and seedling recruitment. ISME J. 2016, 10, 389–399. [Google Scholar] [CrossRef] [Green Version]
  25. Lange, M.; Habekost, M.; Eisenhauer, N.; Roscher, C.; Bessler, H.; Engels, C.; Oelmann, Y.; Scheu, S.; Wilcke, W.; Schulze, E.D.; et al. Biotic and abiotic properties mediating plant diversity effects on soil microbial communities in an experimental grassland. PLoS ONE 2014, 9, e96182. [Google Scholar] [CrossRef] [Green Version]
  26. Roy, J.; Albert, C.H.; Ibanez, S.; Saccone, P.; Zinger, L.; Choler, P.; Clément, J.C.; Lavergne, S.; Geremia, R.A. Microbes on the cliff: Alpine cushion plants structure bacterial and fungal communities. Front. Microbiol. 2013, 4, 64. [Google Scholar] [CrossRef] [PubMed] [Green Version]
  27. Hanson, C.A.; Fuhrman, J.A.; Horner-Devine, M.C.; Martiny, J.B. Beyond biogeographic patterns: Processes shaping the microbial landscape. Nat. Rev. Microbiol. 2012, 10, 497–506. [Google Scholar] [CrossRef]
  28. Chalmandrier, L.; Münkemüller, T.; Colace, M.; Renaud, J.; Aubert, S.; Carlson, B.Z.; Clément, J.; Legay, N.; Pellet, G.; Saillard, A.; et al. Spatial scale and intraspecific trait variability mediate assembly rules in alpine grasslands. J. Ecol. 2017, 105, 277–287. [Google Scholar] [CrossRef] [Green Version]
  29. Chase, J.M. Spatial scale resolves the niche versus neutral theory debate. J. Veg. Sci. 2014, 25, 319–322. [Google Scholar] [CrossRef]
  30. Chalmandrier, L.; Münkemüller, T.; Gallien, L.; de Bello, F.; Mazel, F.; Lavergne, S.; Thuiller, W. A family of null models to distinguish between environmental filtering and biotic interactions in functional diversity patterns. J. Veg. Sci. 2013, 24, 853–864. [Google Scholar] [CrossRef]
  31. Liang, Z.; Peng, X.; Luan, Z.; Li, W.; Zhao, Y. Reduction of phosphorus release from high phosphorus soil by red mud. Environ. Earth Sci. 2012, 65, 581–588. [Google Scholar] [CrossRef] [Green Version]
  32. Caporaso, J.G.; Kuczynski, J.; Stombaugh, J.; Bittinger, K.; Bushman, F.D.; Costello, E.K.; Fierer, N.; Peña, A.G.; Goodrich, J.K.; Gordon, J.I.; et al. QIIME allows analysis of high-throughput community sequencing data. Nat. Methods 2010, 7, 335–336. [Google Scholar] [CrossRef] [Green Version]
  33. Su, S.; Zhao, Y.; Liu, Z.; Liu, G.; Du, M.; Wu, J.; Bai, D.; Li, B.; Bou, G.; Zhang, X.; et al. Characterization and comparison of the bacterial microbiota in different gastrointestinal tract compartments of Mongolian horses. Microbiologyopen 2020. [Google Scholar] [CrossRef]
  34. Schultz, J.; Wolf, M. ITS2 sequence–structure analysis in phylogenetics: A how-to manual for molecular systematics. Mol. Phylogenet. Evol. 2009, 52, 520–523. [Google Scholar] [CrossRef]
  35. Caporaso, J.G.; Lauber, C.L.; Walters, W.A.; Berg-Lyons, D.; Huntley, J.; Fierer, N.; Owens, S.M.; Betley, J.; Fraser, L.; Bauer, M.; et al. Ultra-high-throughput microbial community analysis on the Illumina HiSeq and MiSeq platforms. ISME J. 2012, 6, 1621–1624. [Google Scholar] [CrossRef] [Green Version]
  36. Edgar, R.C. UPARSE: Highly accurate OTU sequences from microbial amplicon reads. Nat. Methods 2013, 10, 996–998. [Google Scholar] [CrossRef] [PubMed]
  37. Quast, C.; Pruesse, E.; Yilmaz, P.; Gerken, J.; Schweer, T.; Yarza, P.; Peplies, J.; Glöckner, F.O. The SILVA ribosomal RNA gene database project: Improved data processing and web-based tools. Nucleic Acids Res. 2012, 41, D590–D596. [Google Scholar] [CrossRef] [PubMed]
  38. Wardle, D.A. Ecological linkages between aboveground and belowground biota. Science 2004, 304, 1629–1633. [Google Scholar] [CrossRef] [PubMed]
  39. Nadal-Romero, E.; Cammeraat, E.; Pérez-Cardiel, E.; Lasanta, T. Effects of secondary succession and afforestation practices on soil properties after cropland abandonment in humid Mediterranean mountain areas. Agric. Ecosyst. Environ. 2016, 228, 91–100. [Google Scholar] [CrossRef] [Green Version]
  40. Cheng, M.; An, S. Responses of soil nitrogen, phosphorous and organic matter to vegetation succession on the Loess Plateau of China. J. Arid. Land 2015, 7, 216–223. [Google Scholar] [CrossRef]
  41. Zhu, H.; He, X.; Wang, K.; Su, Y.; Wu, J. Interactions of vegetation succession, soil bio-chemical properties and microbial communities in a Karst ecosystem. Eur. J. Soil Biol. 2012, 51, 1–7. [Google Scholar] [CrossRef]
  42. Six, J.; Bossuyt, H.; Degryze, S.; Denef, K. A history of research on the link between (micro)aggregates, soil biota, and soil organic matter dynamics. Soil Tillage Res. 2004, 79, 7–31. [Google Scholar] [CrossRef]
  43. Ponge, J. Humus forms in terrestrial ecosystems: A framework to biodiversity. Soil Biol. Biochem. 2003, 35, 935–945. [Google Scholar] [CrossRef] [Green Version]
  44. Yan, M.; Zhang, W.; Zhang, Z.; Wang, L.; Ren, H.; Jiang, Y.; Zhang, X. Responses of soil C stock and soil C loss to land restoration in Ili River Valley, China. Catena 2018, 171, 469–474. [Google Scholar] [CrossRef]
  45. Sun, C.; Liu, G.; Xue, S. Natural succession of grassland on the Loess Plateau of China affects multifractal characteristics of soil particle-size distribution and soil nutrients. Ecol. Res. 2016, 31, 891–902. [Google Scholar] [CrossRef]
  46. Cheng, Y.; Li, P.; Xu, G.; Li, Z.; Cheng, S.; Gao, H. Spatial distribution of soil total phosphorus in Yingwugou watershed of the Dan River, China. Catena 2016, 136, 175–181. [Google Scholar] [CrossRef]
  47. Lane, P.N.J.; Noske, P.J.; Sheridan, G.J. Phosphorus enrichment from point to catchment scale following fire in eucalypt forests. Catena 2011, 87, 157–162. [Google Scholar] [CrossRef]
  48. Kooijman, A.M.; Jongejans, J.; Sevink, J. Parent material effects on Mediterranean woodland ecosystems in NE Spain. Catena 2005, 59, 55–68. [Google Scholar] [CrossRef]
  49. Wen, L.; Li, D.; Yang, L.; Luo, P.; Chen, H.; Xiao, K.; Song, T.; Zhang, W.; He, X.; Chen, H.; et al. Rapid recuperation of soil nitrogen following agricultural abandonment in a karst area, southwest China. Biogeochemistry 2016, 129, 341–354. [Google Scholar] [CrossRef]
  50. Reed, S.C.; Cleveland, C.C.; Townsend, A.R. Functional ecology of free-living nitrogen fixation: A contemporary perspective. Annu. Rev. Ecol. Evol. Syst. 2011, 42, 489–512. [Google Scholar] [CrossRef]
  51. Wu, F.; Yang, W.; Sun, B.; Yang, T.; Chen, X.; Xu, Z.; Song, H. Soil C, N and P stocks and stoichiometry under different vegetation on the surface of the Leshan Giant Buddha. Soil Ecol. Lett. 2020. [Google Scholar] [CrossRef]
  52. Song, M.; Peng, W.; Du, H.; Xu, Q. Responses of soil and microbial C:N:P stoichiometry to vegetation succession in a karst region of southwest China. Forests 2019, 10, 755. [Google Scholar] [CrossRef] [Green Version]
  53. Zeng, Q.; Liu, Y.; Fang, Y.; Ma, R.; Lal, R.; An, S.; Huang, Y. Impact of vegetation restoration on plants and soil C:N:P stoichiometry on the Yunwu Mountain Reserve of China. Ecol. Eng. 2017, 109, 92–100. [Google Scholar] [CrossRef]
  54. Wang, B.; Liu, G.B.; Xue, S.; Zhu, B. Changes in soil physico-chemical and microbiological properties during natural succession on abandoned farmland in the Loess Plateau. Environ. Earth Sci. 2011, 62, 915–925. [Google Scholar] [CrossRef]
  55. Xu, C.; Xiang, W.; Gou, M.; Chen, L.; Lei, P.; Fang, X.; Deng, X.; Ouyang, S. Effects of forest restoration on soil carbon, nitrogen, phosphorus, and their stoichiometry in Hunan, southern China. Sustainability 2018, 10, 1874. [Google Scholar] [CrossRef] [Green Version]
  56. Lei, Y.; Zhou, J.; Xiao, H.; Duan, B.; Wu, Y.; Korpelainen, H.; Li, C. Soil nematode assemblages as bioindicators of primary succession along a 120-year-old chronosequence on the Hailuogou Glacier forefield, SW China. Soil Biol. Biochem. 2015, 88, 362–371. [Google Scholar] [CrossRef]
  57. Walker, T.W.; Syers, J.K. The fate of phosphorus during pedogenesis. Geoderma 1976, 15, 1–19. [Google Scholar] [CrossRef]
  58. Bui, E.N.; Henderson, B.L. C:N:P stoichiometry in Australian soils with respect to vegetation and environmental factors. Plant Soil 2013, 373, 553–568. [Google Scholar] [CrossRef]
  59. Hayes, P.; Turner, B.L.; Lambers, H.; Laliberté, E. Foliar nutrient concentrations and resorption efficiency in plants of contrasting nutrient-acquisition strategies along a 2-million-year dune chronosequence. J. Ecol. 2014, 102, 396–410. [Google Scholar] [CrossRef]
  60. Kim, M.; Jung, J.Y.; Laffly, D.; Kwon, H.Y.; Lee, Y.K. Shifts in bacterial community structure during succession in a glacier foreland of the High Arctic. FEMS Microbiol. Ecol. 2017, 93, w213. [Google Scholar] [CrossRef]
  61. Jia, G.; Cao, J.; Wang, C.; Wang, G. Microbial biomass and nutrients in soil at the different stages of secondary forest succession in Ziwulin, northwest China. Forest Ecol. Manag. 2005, 217, 117–125. [Google Scholar] [CrossRef]
  62. Juottonen, H.; Männistö, M.; Tiirola, M.; Kytöviita, M.M. Cryptogams signify key transitions of bacteria and fungi in Arctic sand dune succession. New Phytol. 2020, 226, 1836–1849. [Google Scholar] [CrossRef]
  63. Alfaro, F.D.; Manzano, M.; Marquet, P.A.; Gaxiola, A. Microbial communities in soil chronosequences with distinct parent material: The effect of soil pH and litter quality. J. Ecol. 2017, 105, 1709–1722. [Google Scholar] [CrossRef] [Green Version]
  64. Due, L.; Noll, M.; Meier, B.E. High Diversity of Diazotrophs in the Forefield of a Receding Alpine Glacier. Microb. Ecol. 2009, 1, 179–190. [Google Scholar]
  65. McCarthy, A.J.; Williams, S.T. Actinomycetes as agents of biodegradation in the environment—A review. Gene 1992, 115, 189–192. [Google Scholar] [CrossRef]
  66. Zhang, Y.; Dong, S.; Gao, Q.; Liu, S.; Zhou, H.; Ganjurjav, H.; Wang, X. Climate change and human activities altered the diversity and composition of soil microbial community in alpine grasslands of the Qinghai-Tibetan Plateau. Sci. Total Environ. 2016, 562, 353–363. [Google Scholar] [CrossRef]
  67. Pan, C.; Bao, Y.; Guo, A.; Ma, J. Environmentally Relevant-Level CeO2 NP with Ferrous Amendment Alters Soil Bacterial Community Compositions and Metabolite Profiles in Rice-Planted Soils. J. Agric. Food Chem. 2020, 68, 8172–8184. [Google Scholar] [CrossRef] [PubMed]
  68. Sait, M.; Davis, K.E.R.; Janssen, P.H. Effect of pH on isolation and distribution of members of subdivision 1 of the phylum Acidobacteria occurring in soil. Appl. Environ. Microb. 2006, 72, 1852–1857. [Google Scholar] [CrossRef] [Green Version]
  69. Chen, X.; Su, Y.; He, X.; Hu, L.; Liang, Y.; Feng, S.; Ge, Y.; Xiao, W. Basidiomycetous laccase gene diversity in two subtropical forest soils. Ying Yong Sheng Tai Xue Bao 2011, 22, 2699–2704. [Google Scholar] [PubMed]
Figure 1. Body of Leshan Giant Buddha covered by different organisms. (a) naked rock; (b) surface of sandstone covered with lichens; (c) bryophytes-covered rock; (d) rock growing with fern; (e) rock growing with gramineous plant; (f) rock growing with shrub; (g) buddha body of Leshan Giant Buddha.
Sustainability 13 03897 g001
Figure 2. Principal coordinate analysis (PCoA) based on bacterial (a) and fungal (b) community compositions of six groups. The X and Y axes represent the two selected principal axes, and the percentage represents the explanatory value of the main axis to different sample compositions. Points of different colors or shapes represent samples of different groups; the distance between sample points is proportional to the similarity of sample species composition.
Sustainability 13 03897 g002
Figure 3. Composition of bacterial and fungal community on phylum level of six groups. (a) composition of bacterial community; (b) composition of fungal community. The x-coordinate represents the groups; the y-coordinate is the percentage. The different colors represent the various taxa at phylum level.
Sustainability 13 03897 g003
Figure 4. Canonical correspondence analysis (CCA) between bacteria (a) and fungi (b) communities and environmental factors.
Sustainability 13 03897 g004
Figure 5. Spearman correlation heatmap among microbial taxa on phylum level and environment factors of bacteria (a) and fungi (b). The X-axis and Y-axis represent environmental factors and species, respectively. Red is positive correlation; blue is negative correlation. The depth of the color indicates the degree of correlation. * indicates a significant correlation between species and environmental factors: * 0.01 < p ≤ 0.05, ** 0.001 < p ≤ 0.01 and *** p ≤ 0.001.
Sustainability 13 03897 g005
Table 1. Chemical properties of samples in different samples (mean ± SD).
Sample GroupsNRLRBSFSGSSS
TOC (g·kg−1)2.45 ± 0.48 d6.48 ± 1.15 d26.71 ± 4.97 c48.51 ± 4.48 b64.03 ± 4.28 a68.86 ± 8.69 a
TN(g·kg−1)0.71 ± 0.12 e1.66 ± 0.26 d4.02 ± 0.66 c5.2 ± 0.6 b6.28 ± 0.31 a6.49 ± 0.71 a
TP(g·kg−1)0.19 ± 0.03 d0.34 ± 0.07 c0.51 ± 0.06 b0.58 ± 0.05 b0.74 ± 0.09 a0.82 ± 0.1 a
C:N3.45 ± 0.22 d3.91 ± 0.11 d6.63 ± 0.5 c9.34 ± 0.32 b10.19 ± 0.22 a10.6 ± 0.26 a
C:P12.72 ± 0.2 d18.95 ± 0.77 c52.35 ± 4.21 b84.33 ± 3.18 a86.99 ± 5.37 a83.68 ± 0.47 a
N:P3.7 ± 0.26 d4.85 ± 0.28 c7.9 ± 0.47 b9.03 ± 0.34 a8.55 ± 0.68 a b7.9 ± 0.2 b
pH6.68 ± 0.1 c6.65 ± 0.23 c6.91 ± 0.07 b c6.91 ± 0.23 b c7.28 ± 0.1 a7.15 ± 0.03 a b
TOC: Total organic carbon; TN: Total nitrogen; TP: Total phosphorus. Values with same letter are not significantly different (p < 0.05). NR: naked rock; LR: lichen-covered rock; BS: bryophyte-covered rock; FS: fern-covered rock; GS: grass-covered rock; SS: shrub-covered rock. Different letters indicate significant differences among the means of values (p < 0.05).
Table 2. α-diversity indices for bacterial and fungal communities (mean ± SD).
Sample Groupsα-Diversity Indices
SobsShannonAceChaoCoverage
NR156 ± 112 d0.71 ± 0.41 d516 ± 401 c380 ± 323 c0.9977
LR346 ± 187 d3.49 ± 0.27 c538 ± 337 c511 ± 315 c0.9968
BacteriaBS1088 ± 176 c5.4 ± 0.97 b1225 ± 219 b1285 ± 245 b0.994
FS1801 ± 52 a6.53 ± 0.13 a2054 ± 97 a2093 ± 79 a0.9891
GS1518 ± 123 a b6.29 ± 0.18 a1725 ± 113 a b1761 ± 119 a b0.991
SS1323 ± 68 b c6.17 ± 0.1 a b1475 ± 101 a b1524 ± 103 b0.9929
NR1131 ± 415 a5.05 ± 0.95 a1162 ± 407 a1180 ± 396 a0.9989
LR2434 ± 1929 a4.61 ± 2.26 a2465 ± 1941 a2482 ± 1960 a0.9979
FungiBS2927 ± 1839 a6.3 ± 1.37 a2992 ± 1850 a3025 ± 1875 a0.9963
FS4143 ± 3798 a6.91 ± 1.98 a4244 ± 3890 a4275 ± 3898 a0.9944
GS3896 ± 206 a7.69 ± 0.34 a3945 ± 217 a3998 ± 222 a0.9966
SS2805 ± 1720 a6.67 ± 1.75 a2855 ± 1699 a2889 ± 1725 a0.9974
Values with same letter are not significantly different (p < 0.05).
Publisher’s Note: MDPI stays neutral with regard to jurisdictional claims in published maps and institutional affiliations.

