Abstract
Nature-based solutions (NBS) are being deployed around the world in order to address hydrometeorological hazards, including flooding, droughts, landslides and many others. The term refers to techniques inspired, supported and copied from nature, avoiding large constructions and other harmful interventions. In this work the development and evaluation of an NBS applied to the Spercheios river basin in Central Greece is presented. The river is susceptible to heavy rainfall and bank overflow, therefore the intervention selected is a natural water retention measure that aims to moderate the impact of flooding and drought in the area. After the deployment of the NBS, we examine the benefits under current and future climate conditions, using various climate change scenarios. Even though the NBS deployed is small compared to the rest of the river, its presence leads to a decrease in the maximum depth of flooding, maximum velocity and smaller flooded areas. Regarding the subsurface/groundwater storage under current and future climate change and weather conditions, the NBS construction seems to favor long-term groundwater recharge.
1. Introduction
At the highpoint of this era of maximum aggravating human activity and limited ecological awareness, researchers are working on ways to relieve the ecosystems from pressing climate-related risks. One set of methods, that follow a long-term and site-specific approach in ecological management, is called nature-based solutions (NBS). The term refers to “techniques inspired by, supported by, or copied from nature” [1], which in essence means that by applying what we learn from observing nature, we can mitigate hazards in a sustainable manner, avoiding large constructions and other harmful interventions in an effort to address climate change impacts and move towards resilient ecosystems [2]. Nature-based solutions also foster society-oriented actions and promote broad public participation and transparency enhancement [2,3,4]. Due to this transdisciplinary, NBS can have a variety of possible positive impacts beyond environmental risk mitigation [5]; their application benefits the society (i.e., by increasing an area’s aesthetical value and enhancing the ecosystem services it provides) and the economy (i.e., energy saving, reducing economic damage; [6]). However, the main goal of NBS deployment remains the mitigation of hydrometeorological hazard impacts on the local population; hazards that are expected to become more frequent and severe due to climate change [7]. In this regard, NBS have nature-based solutions (NBS) have proved to be effective for hydrometeorological risk management [1,8,9]. NBS is a relatively new concept that offers several cost-efficient methods to address such phenomena but also discourages the use of large structural constructions like concrete buildings (green development; [1]). Additionally, the flexibility of NBS allows them to be implemented alone or integrated with other technological or engineering solutions, determined by site-specific natural and cultural contexts [10].
NBS is not the first concept focusing on green solutions that has been officially defined and referred to in academic debates and official legislation. Approaches such as ecosystem-based adaptation (EbA), urban green infrastructure (UGI) and ecosystem services (ESS) have already gained attention [11]. The exact limits of each of the aforementioned concepts are vague, thus it is useful to adopt “NBS” as a broader term connecting and interweaving those individual concepts with one another, giving prominence to their complementarity [10,11]. What distinguishes nature-based solutions from other general green approaches is that they are used to address key societal challenges that originate from a combination of natural (climate change and environmental degradation) and anthropogenic (economic and social development and human health) factors [2,10,12]. NBS have recently started to become a key priority to mainstream environmental protection and sustainable use of biodiversity at global and regional scales [12] and frameworks are being developed to enable the assessment of impacts related to specific NBS actions [13].
There are a wide variety of applied solutions, but here we focus on NBS for hydrometeorological risks: in order to tackle flood risk, for instance, it is crucial to retain water in the landscape by managing overland flow or infiltration [14,15,16]. A NBS practice is to change the land use from arable to grassland or to create buffer strips using grass and hedges. Similarly, if an increase in floodplain storage capacity is desired, artificial reservoirs or wetlands comprise common green solution techniques [17]. Additionally, several methods have already been implemented in the urban environment, aiming to decrease stormwater generated flooding. These include installations of green rooftops and walls, stormwater gardens and the construction of sustainable drainage systems [16,18].
The process of implementing NBS is rather complex, and there are still major research gaps regarding NBS assessment and implementation. In order to boost such research, the European Commission (EC) is financing several projects. One of the first is OPERANDUM (open-air laboratories for nature based solutions to manage hydrometeo risks), which aims at codesign, codevelopment, deployment and assessment of NBS’s in open-air laboratories (OAL’s) in ten countries. OAL’s in this project are natural and rural Living Labs that cover a wide range of hazards with different climates, land use and socioeconomic characteristics. Essentially living labs means that interdisciplinary and transdisciplinary research is implemented, strongly related to its territorial context and the societal changes it possibly drives.
In this work, we present the development and evaluation of an NBS applied to the Spercheios River Basin in Central Greece. The Spercheios River is generally susceptible to heavy rainfall and river bank overflow due to flood water from upstream, while at the same time deforestation increases its susceptibility to heavy rainfall [19]. Flood events occur regularly exceeding the channel capacity, affecting most elements of the socioeconomic system of the area. The risks, related to flooding in the area, include the potential loss of human life, potential loss of crop production and livestock, damage to properties and infrastructure and difficulties in transportation [20].
2. Study Area, the Spercheios River Basin and NBS Deployed
The basin of the Spercheios River is located in Central Greece between 38°44′ and 39°05′ N lat., and 21°50′ and 22°45′ E long (Figure 1). The Spercheios River springs from the mountainous parts of the basin, mainly from Tymfristos mountain in the west, and Vardousia and Oiti mountain ranges in the southwest and south respectively. The river with a total length of 82 km, has a west–east direction, is recharged by many streams of permanent and periodic flow and finally discharges in Maliakos Gulf. The steep slopes, which are present within approximately 2/3 of the total length of the river course, form a rather mountainous topography (streamy with crucial flooding peaks and very intense sediment yield). Only in the last downstream part of the Spercheios course, the topography gradually changed into a lowland relief. The basin area has an extent of approximately 1828 km2 and a mean altitude of 626 m with a maximum height of 2281 m at Oiti Mountain [21]. According to [22] the relief classification system, half of the basin is plains and hills, with an elevation lower than 600 m, whereas 14% is semimountain (600–900 m) and 30% mountain (>900 m). Approximately 32% of the entire catchment is covered by agricultural land, 2% from built-up areas and 66% from natural vegetation and bare land [23]. The study area is covered by impermeable, semipermeable, alluvial and karst formations, in percentages of 62.6%, 0.2%, 20.5% and 16.7% respectively [24]. Based on data from eight rainfall stations the mean annual precipitation for the period 1980‒2010 calculated up to 788 mm [14]. Following the Köppen–Geiger climatic characterization [25], the Spercheios basin is under the Mediterranean Climate, in Csa class, indicating a dry warm period and a wet period distributed from late autumn to early spring. Spercheios has a water discharge varying between 12.79 m3/s (in winter) and less than 1 m3/s (in summer). The dense hydrographic network, in combination with the non-permeable geological background, promotes the erosion and transfer of sediment. The total annual sediment load of the river has been estimated to be in excess of 1.5 × 10⁶ tonnes/year [26].
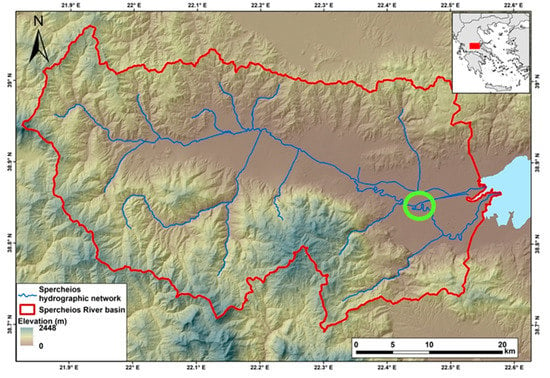
Figure 1.
Location and map of Spercheios River Basin. The green circle denotes the nature-based solutions (NBS) location.
The river morphology as described above in combination with locally heavy rainfall and riverbank overflow due to flood water from upstream, and snowmelt in the upstream mountain areas causes flooding in the Spercheios River area from October to May. Furthermore, due to irrigation demands, during the summer months, the area also faces water scarcity, which is causing adverse effects to the ecosystems. Such phenomena are related to risks including the potential loss of human life, potential loss of crop and livestock, damage to properties and infrastructure and difficulties in transportation [20]. Regarding the drought periods, there is an increased risk of disasters in natural ecosystems, forest fire and losses in agricultural crops.
In order to mitigate risks caused by hazards, an area near the village of Komma and the Alamana Bridge was selected for the NBS implementation. The criteria for the selection were the geomorphology (where the intervention is deployed), land availability accessibility, minimal disruption to other uses, sustainability, noticeable positive impact, no risk to communities and uses downstream and cost. The final location was decided after thorough discussions with local experts and local community members. The intervention selected occupies an area of 105.314 m2 and is a natural water retention measure that aims to moderate the impact of flooding and drought in the Spercheios River. The implemented solution comprises the construction of a flood storage reservoir. The construction of the reservoir is achieved by restoring and stabilizing the river banks, cleaning the bed material load, widening the river bed and diminishing the existing nearby hybrid measure that was built to regulate the water flow (Figure 2a). Specifically, the concentrated sediment was removed by excavations in the river bed and gabions were used to cover and stabilize both river bed and river banks. The objective was to hold the slopes steady using bioengineering techniques and materials from the area, cheap in their application, which will support the normal functions of the river’s ecosystems. The technique used in the project is a structure called “Cribwall” (Figure 2b). It consists of cannabinoid meshes of wood in successive layers [27]. The structure has a stone base. The trunks are bound and nailed together by making a certain type of interlocking system anchored on a layer of stones forming the “toe” of the slope [28]. The space between the longitudinal and transversal tree trunks is filled with soil above the higher point of normal water level. The new slopes that were created, alongside the existing ones are also vegetated. A crib retaining structure with live plants between trunk layers is called “vegetative” or “live crib wall”. Such constructions offer immediate protection for mass overturning and long-term benefit for stabilization by vegetation when established. At the planted areas, ramps are built for maintenance of flood works. Finally, an uncovered trench slope is located at the center of the riverbed to monitor water flow. Overall, those slopes form a transitional buffer zone that could provide multiple ecosystem services. Therefore, the water stream is being moderated mostly by the natural interventions and secondly by the existing divider. The river discharges through two channels, the recently created river bed and the old one. The resulting reservoir has a water capacity of about 600,000 m3, can absorb flood flows up to 2.167 m3/s (T = 50 years) and reduces water scarcity for agricultural areas near Anthili and Roditsa (this excess water is enough for 1000 acres of a typical crop in the area).
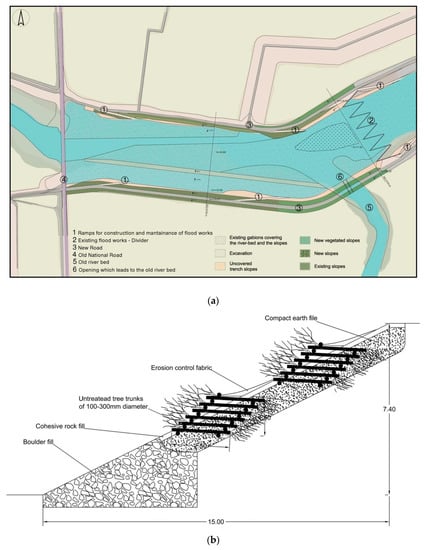
Figure 2.
(a) Engineering representation of the NBS deployed in Komma (green circle in Figure 1) and (b) cross-section of the intervention deployed.
The NBS has four main objectives. Firstly, it aims to enhance water storage by introducing a medium scale reservoir and maintaining the capacity of linked ditches, embanked reservoirs and channels. Secondly, to reduce surface runoff by increasing soil infiltration. Moreover, it slows down water flow by increasing resistance, by planting floodplain or riverside woods. Lastly, it reduces water flow connectivity by interrupting surface flows, planting buffer strips of grass and trees. An important benefit is that the NBS could also act as a place of recreational value for both local residents and residents of the nearby city of Lamia and even visitors from other areas of the country and abroad.
3. Experimental Design
In order to assess the NBS efficiency under current and future climate conditions, a series of hydrological and groundwater simulations were performed. To this end, two models were selected: (1) the TUFLOW hydraulic model [29] and (2) the MIKE-SHE (MIKE- Système Hydrologique Européen) hydrological model [30,31]. TUFLOW was selected due to its capabilities to handle very high resolutions (several meters) and MIKE-SHE has already been applied for the Spercheios River basin in several previous studies (see [19] and references within). Each model suite is presented below, followed by a description of the datasets used for defining current and future climate. Unfortunately, the area of NBS deployment is not monitored and there are no measurements to extensively evaluate the TUFLOW setup. However, the results presented below are in good agreement with a study performed in the area in 2003 [32].
3.1. Models Setup and Basic Equations
The TUFLOW hydraulic model is a suite of advanced numerical packages and supporting tools for simulating free-surface water flow for urban waterways, rivers, floodplains, estuaries and coastlines. The model is capable of solving all the necessary physical processes using 1D, 2D and 3D solutions. A fully hydrodynamic approach was adopted rather than a quasi approach as the full solution was stable and the simulations completed in reasonable computational time. There were therefore no clear benefits of a simpler quasi routing approach. A 10 m grid was selected, as offering an acceptable compromise between the need for resolution and model runtimes and a timestep of 8 s was used.
The hydraulic model was constructed using a digital terrain model (DTM) developed from a high-resolution dataset provided by the Greek Land Register (2018 dataset). The DTM was sourced from the Geospatial Data INSPIRE Geoportal of the “Hellenic Cadastre”. The DTM metadata and technical guidelines were based on EN ISO 19,115 and EN ISO 19,119 (Version 1.2). The data series of the DTM consists of a series of tiles (based on 1:5000 scale maps) with a 5 m grid resolution. The source is the “Large Scale Orthophotos” project. It is a homogenous systematic point grid that refers to terrain elevation and creates an Earth elevation model. The digital elevation model has been produced as part of the orthophotos creation from color aerial photos of the “Large Scale Orthophotos” (LSO) project, which was a part of the Big Project: “Data and Information Technology Infrastructure for a contemporary cadastre” that was implemented by the (former) CADASTRE S.A. (predecessor of the Legal Entity of Public Law “Hellenic Cadastre”) and it was cofunded by the European Union within the framework of the Operational Program “Information Society” of the 3rd Community Support Framework.
Care has been taken to exclude DTM features that unrealistically constrain/influence routing of flood flows. For example, local high or low spots, attributable to the filtering approach have been excluded (Figure 3). The goal is to produce flood depths and flood extents before and after the NBS deployment in order to examine the effects of the intervention.
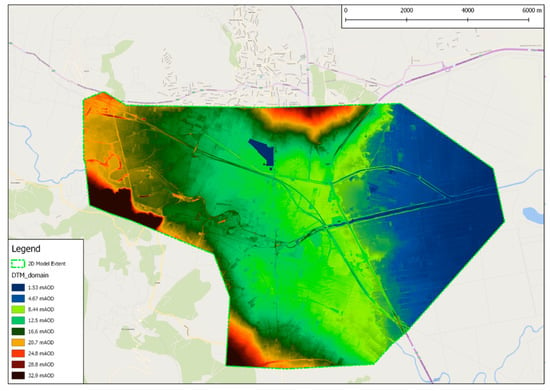
Figure 3.
River Spercheios catchment ground elevations used for DTM construction and the TUFLOW model domain.
Land use from the CORINE 2018 database [33] was employed to identify roughness values (Figure 4). Roughness within the 2D broadscale model is defined in the materials layer and roughness categories were based on the CORINE Manning’s n values (Table 1). In addition, a normal depth boundary was applied to form the downstream boundary condition. The normal depth boundary is defined based on a typical slope and the flow through the boundary was calculated during model integration. For the final broadscale simulations slopes of 0.0041–0.0048 m/m were used. This slope is the average of the left and right bank slopes, orthogonal to the main river reach. The downstream boundary was located 3 km upstream of the confluence with the sea.
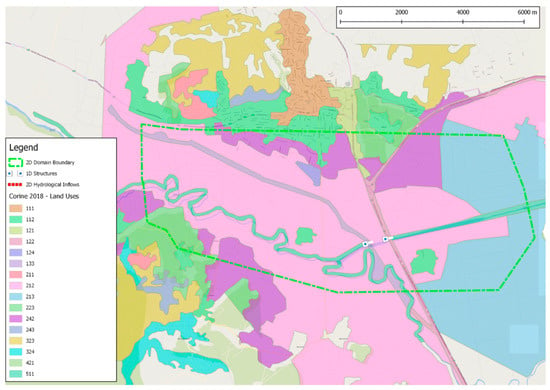
Figure 4.
River Spercheios catchment model-CORINE 2018 land uses.

Table 1.
CORINE codes with corresponding Manning’s n values and description used in TUFLOW for OAL-Greece.
The basic TUFLOW scheme is based on a numerical solution of the 1D unsteady St Venant fluid flow equations (momentum and continuity) including the inertia terms. The 1D solution uses an explicit finite difference, second-order, Runge–Kutta solution technique [34] for the 1D shallow water equations of continuity and momentum as given by the equations below. The equations contain the essential terms for modeling periodic long waves in estuaries and rivers, that is: wave propagation; advection of momentum (inertia terms) and bed friction (Manning’s equation).
where: (u) is the depth and width averaged velocity, (ζ) is the water level, (t) is the time, (x) is the distance, (A) it the cross-sectional area, (B) is the width of flow, (k) is the energy loss coefficient, (n) is the Manning’s n, (ft) is the form (Energy) loss coefficient, (R) is the hydraulic radius and (g) is the acceleration due to gravity.
Accordingly, in order to examine the impact of the deployed NBS on the groundwater resources the hydrological model MIKE-SHE was used. MIKE-SHE is a physically based distributed model that is able to simulate all hydrological processes within the land phase of the hydrological cycle in a river basin [35]. This integrated modeling tool can simulate overland flow, unsaturated flow, vegetation-based evapotranspiration, groundwater flow and fully dynamic channel flow and can describe their hydraulic relationships [30] MIKE-SHE is fully integrated with the one-dimension model MIKE Hydro River, which incorporates river hydraulics applications, flood analysis, ecology and water quality assessments and sediment transport analysis in rivers, flood plains, irrigation channels, reservoirs and other inland water bodies [31].
The overland flow was simulated using the conceptual reservoir representation based on an empirical relation between flow depth and surface detention, together with the Manning equation describing the discharge under turbulent flow conditions [32,36]. The relationship between the depth (y), the slope (L), the surface storage at equilibrium (De) and the detained surface storage prior to equilibrium (D), is given by an empirical model:
where during the recession part of the hydrograph, when D/De is greater than 1, D/De is assumed to be equal to 1. The 2-layer water balance method was used for the simulation of the unsaturated zone and is based on a formulation presented in [37]. The saturated zone simulation was achieved using the linear reservoir module, a concept firstly introduced by Zoch [38,39,40]. A linear reservoir is one, whose storage is linearly related to the output by storage constant with the dimension time, also called a time constant, as S = kq, where (S) is storage in the reservoir with dimensions length, (k) is the time constant and (q) is the outflow from the reservoir with dimensions length/time. The outflows from a linear reservoir with two outlets can also be calculated explicitly. In this case, storage is merely given as: S = kpqp = koqo + hthresh, where (kp) is the time constant for the percolation outlet, (qp) is percolation, (ko) is the time constant for the overflow outlet, (qo) is the outflow from the overflow outlet and (hthresh) is the threshold value for the overflow outlet. (qp) and (qo) at the time (t + dt) can be expressed as:
where I is the inflow to the reservoir and constant in time.
The necessary information for the model set-up concerns the topography, climatological forcing (precipitation rate, reference evapotranspiration and air temperature), land-use distribution, hydrographic network (river network, cross-sections, hydraulic structures, boundary conditions and hydrodynamic parameters), surface runoff parameters (overland flow), unsaturated zones parameters (soil map) and saturated subsurface flow parameters (linear reservoir method). The eastern part of the Spercheios river basin is structured by alluvial deposits. In this porous media, the groundwater body consists of successive permeable and impermeable soil layers forming successive unconfined and confined aquifers.
The grid spacing for the simulations was set to 400 m. The topography of the Spercheios river basin was defined from the 50 m × 50 m digital elevation model (DEM) of the area, after resampling (Figure 5). Land use is connected to vegetation distribution and therefore the actual evapotranspiration was derived for the CORINE 2018 dataset. For each land use category the time-varying values of the leaf area index (LAI), root depth and crop coefficient (Kc) were assigned in the vegetation property file based on bibliography (for more details see [41]). Reference evapotranspiration was calculated based on the Hargreaves empirical approach [42]. Model performance for the area has already been established in [41] and meet the criteria proposed by [43] during calibration and validation (Nash–Sutcliffe coefficient of efficiency > 0.50, RMSE observations standard deviation ratio < 0.70, and percent bias ± 25% for streamflow) in selected cases where river discharge measurements were available.
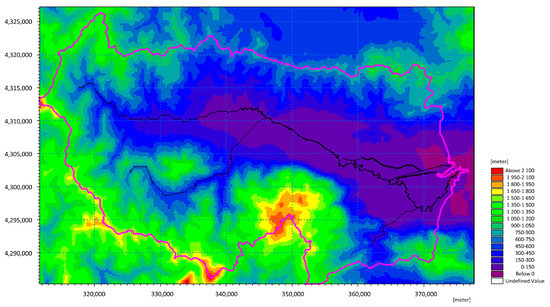
Figure 5.
Topography of the Spercheios River Basin as defined in MIKE-SHE.
The implemented NBS was included in the model by altering the topography (cross-sections) upstream of the existing hybrid solution in the Spercheios River basin. After the NBS deployment, the elevation in the said area upstream was 7 m lower (from about 11.0 to 4.0 m.a.s.l. and up to 140 m wide). The area affected by the interventions was about 600 m upstream of the hybrid solution.
3.2. Climate Data
The goal of this work was to assess the efficiency of the deployed NBS under current and future climate conditions. For the current climate, the ERA5 reanalysis data [44] from 1979 to 2018 was used. In order to investigate the future performance of the NBS, regionally downscaled climate projections from the EURO-CORDEX project were used [45]. Climate projections have three main sources of uncertainty: model uncertainty, scenario uncertainty and internal variability [46]. In order to account for model uncertainty, ideally the impact models would be run with many different pairs of global and regional climate models. To account for scenario uncertainty (uncertainty caused by our inability to know with certainty how future emissions of greenhouse gases will develop), it is possible to run simulations with multiple different emissions scenarios. To account for internal variability, it is possible to run simulations with different climate model starting conditions, known as the initial conditions. The uncertainty due to internal variability is the most important at shorter timescales of generally up to a couple of decades, whereas after a couple of decades the dominant sources of uncertainty are due to the climate model and scenario uncertainty [46]. Here, we ran the impact models with five different global (general circulation models—GCMs) and regional (regional climate models—RCMs) climate model pairs, and for one emissions scenario (RCP8.5) [47,48]. This is a trade-off based on our computing resources, while at the same time providing a reasonable quantification of the uncertainty in climate modeling. In doing so, we were able to provide a reasonable assessment of the future performance of the NBS. The global and regional climate model pairs that we used are summarized in Table 2, along with the abbreviation that will be used in the rest of the manuscript. We selected the RCP8.5 emissions scenario (until the year 2100) in order to provide the most stringent test of the performance of the NBS as possible [49].

Table 2.
The five general circulation model (GCM)/regional climate model (RCM) pairs that were used to define NBS efficiency under future climate conditions.
4. Results
The aim of the modeling procedure presented above was to provide information on the impact that NBS has on the flood levels, the flood mapping outputs and the groundwater storage levels. The outcomes were used to evaluate the efficiency and advantages of the intervention.
4.1. Flood Extent
Flood extents were produced for the 10% annual exceedance probability (AEP) events for both current and future climate conditions. The 10% AEP flood extent followed the expected pattern, with flooding followed the main river and non-main river watercourse valley. First simulations were performed for the current climate conditions of the area using the ERA5 reanalysis dataset for the years 1979–2018. The results are presented in Figure 6, which shows the difference in 10% AEP event maximum flood depths when the NBS is present minus the baseline conditions, (“baseline” conditions refer to no NBS presence).
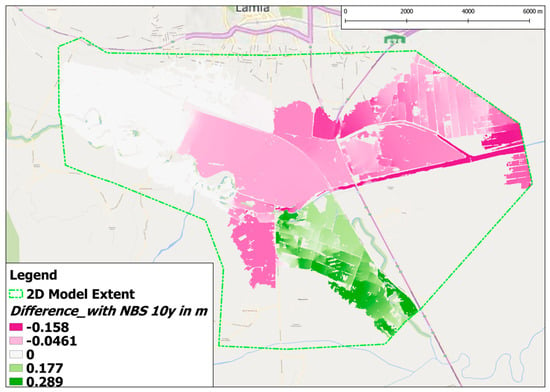
Figure 6.
River Spercheios catchment—10% annual exceedance probability (AEP) event maximum flood depths difference (with NBS—baseline) for current climate conditions, using the ERA5 dataset.
The 10% AEP event results show that without the NBS, the maximum depth of flooding (12.28 m) occurred approximately 16 h into the simulation upstream of Athinon road at the left bank. With the NBS, the maximum depth of flooding was the same (12.28 m) and occurred at the same location. The mean depth was reduced from 1.27 to 1.24 m after the addition of the NBS. Maximum water velocity occurred at the upstream end of the model where the river bed was steeper. The cause of the high velocity was the ground slope. The maximum velocity was 7.98 m/s and occurred after 16 h approximately (both with and without the NBS). The flooded area was 35.28 km2 and 34.94 km2, without and with the NBS respectively. Comparison of the results before and after the NBS deployment shows similar extent and depth of flooding at the upstream end of the model, where the impact of the NBS was less profound.
The positive impact of the NBS on flood levels was apparent from the junction with Frantzi Road and extended to the downstream boundary of the TUFLOW domain. The greatest flood depth decrease occurred immediately downstream of the NBS with a maximum flood depth reduction of 0.45 m. The residential villages of Neo Krikello, Komma and Anthli were less prone to flooding due to the NBS. There was a slight increase in flood depths in the limited area around the old river bed. This is expected, as the NBS created a reservoir for which the lowest escape route was the old river bed. Therefore, additional flows were diverted through this flood route. Nevertheless, no residential areas were affected. The 10% AEP event results provide good agreement with flood maps produced by previous studies [23]. The results for the current climate conditions in the area are presented in Table 3.

Table 3.
River Spercheios model 10% AEP event results—maximum and mean values for current climate conditions.
The impact of climate change was considered by simulating five climate change scenarios for the 10% AEP event, with and without the NBS. The scenarios considered flows of 85% (Sc1), 75% (Sc2), 101% (Sc3), 87% (Sc4) and 79% (Sc5) of the baseline 10% AEP event design flows, based on changes in the precipitation for each climate scenario. The tabulated results are shown in Table 4, Table 5, Table 6, Table 7 and Table 8 for each scenario respectively.

Table 4.
River Spercheios model 10% AEP scenario with 85% of baseline flow—maximum and mean values (Sc1).

Table 5.
River Spercheios model 10% AEP scenario with 75% of baseline flow—maximum and mean values (Sc2).

Table 6.
River Spercheios model 10% AEP scenario with 101% of baseline flow—maximum and mean values (Sc3).

Table 7.
River Spercheios model 10% AEP scenario with 87% of baseline flow—maximum and mean values (Sc4).

Table 8.
River Spercheios model 10% AEP scenario with 79% of baseline flow—maximum and mean values (Sc5).
For all climate change simulations, the NBS had a positive impact on flood depth reduction. This confirms the benefits of the intervention and the importance of maintaining the pond storage. The change in velocity with the NBS was negligible, which confirms that it did not increase the risk of erosion. On the contrary, it acted as a stilling basin for the flow arriving upstream of the “Meristis” structure.
A reduction of the flooded area with the NBS is also observed, similar to the current climate conditions and, in general, the results before and after the NBS were similar to the baseline scenarios without the NBS implementation. The greatest impact is observed in the resulting flooded area. In the Sc2 and Sc1 scenarios, the NBS results in a reduction of the flooded area of 0.2 and 0.29 km2 respectively. The positive impact of the NBS on flood levels was apparent from the junction with Frantzi Road and extended to the downstream boundary of the area. The greatest flood depth decrease occurred immediately downstream of the NBS with a maximum flood depth reduction of 0.30 m for the Sc5 flow scenario. The residential villages of Komma and Anthli were less prone to flooding due to the NBS. It should be noted here that the impact of the deployed NBS was expected to be small, due to the relatively small scale of the intervention. Still the results were significant and even a small intervention such as this is expected to help the local communities in the long-run.
4.2. Groundwater Storage Change
Precipitation is one of the most important parameters in the hydrological cycle. As mentioned above, the meteorological forcing in the present study was derived from the ERA5 dataset. The spatial distribution of the meteorological data (precipitation, reference evapotranspiration and average daily air temperature for snowmelt) during the hydrological modeling was defined as station-based. More specifically, the river basin was divided into a number of subareas, one for each “station”. In the specific case, each subarea represents each grid from the ERA5 dataset and for each ERA5 grid, the corresponding time-series was attributed.
In the case of using the ERA5 meteorological forcing for the simulation of the current state, the mean spatially averaged annual precipitation of the Spercheios River Basin for the period 1979–2018 was 899.5 mm. Without the NBS the mean spatially-averaged annual actual evapotranspiration was 561.6 mm, while with the implemented NBS the mean spatially-averaged annual actual evapotranspiration was 564.8 mm.
Based on the results, the mean spatially averaged annual subsurface/groundwater storage change for the period 1979–2018 without the implemented NBS was 125.5 mm. The groundwater storage change was slightly affected by the NBS and reached 125.9 mm for the same simulated time period (1979–2018). Generally, annual subsurface/groundwater storage change increased almost in all years between 1979 and 2018, with the only exception in four years (Figure 7).

Figure 7.
(a) Subsurface/groundwater storage change and (b) subsurface/groundwater storage change difference, with and without NBS.
This small increase of the mean annual subsurface/groundwater storage change (average annual increase 0.4 mm/0.3%) can be attributed to the small increase of the water surface/volume at the area where the NBS was implemented, which led to the increase of the water infiltration locally. This increase was practically negligible, due to the small intervention that took place, in relation to the entire area of the river basin that the analysis was performed.
In order to examine the impact of the implemented NBS on groundwater resources under future climate and weather conditions, five climate change scenarios were examined and the subsurface/groundwater storage change in the Spercheios River Basin for each scenario (Sc1, Sc2, Sc3, Sc4 and Sc5) was calculated. More specifically, the hydrological model of the Spercheios river basin was run under the meteorological forcing of the climate change scenarios mentioned above. This includes precipitation, reference evapotranspiration, and average temperature for the calculation of snowmelt. Reference evapotranspiration was calculated based on the Hargreaves empirical approach [27]. It should be noted that no change for land use or irrigation demand was considered during the scenarios examined.
For the five different climate change scenarios used in this work, the mean spatially-averaged annual precipitation was 671.8 mm in Sc1, 693.9 mm in Sc2, 717.2 mm in Sc3, 634.4 mm in Sc4 and 788.2 mm in Sc5. The mean spatially averaged annual actual evapotranspiration was 488.3 mm in Sc1, 439.8 mm in Sc2, 440.2 mm in Sc3, 391.2 mm in Sc4 and 404.3 mm in Sc5. Finally, the mean spatially averaged annual subsurface/groundwater storage change was calculated to be 66.7 mm in Sc1, 84.4 mm in Sc2, 94.2 mm in Sc3, 79.9 mm in Sc4 and 102.5 mm in Sc5 (Table 9).

Table 9.
Mean spatially averaged annual precipitation, actual evapotranspiration and groundwater storage change of Spercheios river basin for each climate change scenarios examined. The last column depicts values compared to the subsurface/groundwater storage change for the period 1979–2018 with NBS (125.9 mm).
Based on the results, the smallest groundwater storage change was simulated in Sc1. Although the precipitation was lower in the case of Sc4 than in Sc1, the groundwater storage change was higher than in the case of Sc1 due to the lower actual evapotranspiration as a result of lower air temperature (Figure 8a for Sc1 and Figure 8b for Sc4). The most profound increase of groundwater storage change was expected in the case of Sc5, due to the corresponding higher rate of precipitation (Table 9).
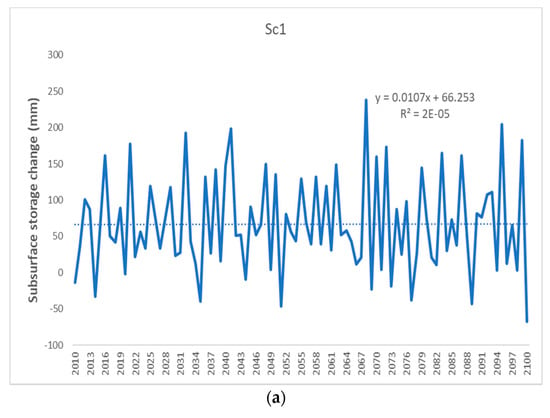
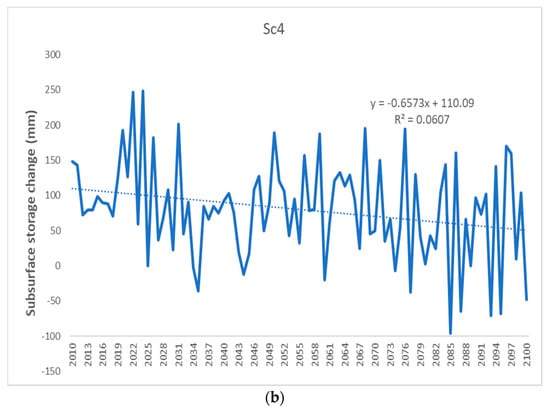
Figure 8.
Subsurface storage change for (a) Sc1 and (b) Sc4.
In all cases, the groundwater water changes demonstrated a long-term decrease for the period 2010–2100. This trend was estimated to be more profound in the case of Sc4 and the smallest in Sc1 (Figure 8a,b).
5. Conclusions and Recommendations
In this manuscript, the deployment of a nature-based solution in the Spercheios River Basin was presented. The NBS is a water retention measure, specifically designed to address hydrometeorological hazards and namely floods. In order to examine the efficiency of the intervention under current and future climate conditions, several numerical simulations were performed.
A new model of the River Spercheios fluvial catchment was constructed using the Greek Land Register 2018 based DTM and the Greek Ministry of Environment and Energy website inflows. The model had good performance and produced stable results with the flood extents being in good agreement with previous studies. When the NBS was considered, the maximum depth of flooding and the maximum velocity were reduced for all events, especially in the area around and downstream of the NBS. The flooded area was also reduced with the presence of NBS, especially for more frequent events. This is expected as the magnitude and the nature of the NBS was not to provide radical changes to the surrounding area. Therefore, the changes caused were less profound than the option of a hard structure. The positive impact of the NBS on flood levels was apparent from the junction with Frantzi Road and extended to the downstream end of the river. The greatest flood depth decrease occurred immediately downstream of the NBS. The residential villages of Neo Krikello, Komma and Anthli, were less prone to flooding due to the NBS.
Regarding the subsurface/groundwater storage under present and future climate, the NBS construction seemed to favor long-term groundwater recharge. The mean spatially averaged annual subsurface/groundwater storage change without the implemented NBS was 125.5 mm/y. With the implemented NBS recharge slightly increased by 0.4 mm/y (0.3% increase) and reached 125.9 mm/y (Figure 9).
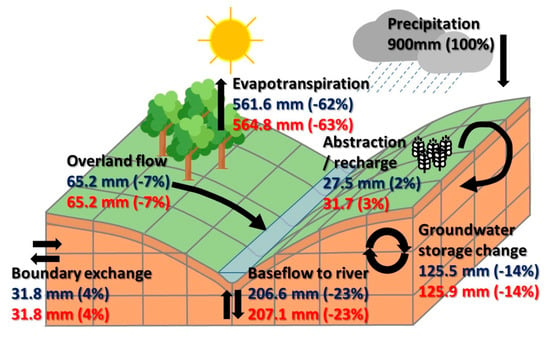
Figure 9.
Water balance for the Spercheios River Basin without the NBS (blue), and after NBS deployment (red). The numbers refer to current climate conditions.
This small increase of the mean annual subsurface/groundwater recharge could be attributed to the small increase of the water surface/volume at the area where the NBS was implemented, which led to the increase of the water infiltration locally. This increase was relatively small, due to the small intervention that took place, in relation to the entire area of the river basin that the analysis was performed. However the results were not insignificant and they indicate that by upscaling this intervention in a greater area, or in other locations along the Spercheios River Basin, the benefits could be substantial.
As for the climate change scenarios examined with the implemented NBS, the subsurface/groundwater storage change was simulated to be 66.7 mm in Sc1, 84.4 mm in Sc2, 94.2 mm in Sc3, 79.7 mm in Sc4 and 102.5 mm in Sc5. The groundwater storage change under the five climate change scenarios examined will decrease by 47.0% in Sc1, 32.9% in Sc2, 25.2% in Sc3, 36.6% in Sc4 and 18.6% in Sc5 compared to the current state with the implemented NBS.
Author Contributions
C.S. conceptualization and writing, M.L. supervision, writing and review, I.A. methodology, writing and simulations, A.M. methodology, writing and simulations, G.V. review and editing, A.P. review and editing, E.D. review and editing, D.P. investigation and editing, L.G. investigation and visualization, N.C. investigation, writing, review and editing, P.B. data provision, review and editing, S.P. data provision, review and editing, S.E.D. review and editing and P.K. review and editing. All authors have read and agreed to the published version of the manuscript.
Funding
This research was funded by the OPERANDUM (OPEn-air laboRAtories for Nature baseD solUtions to Manage hydro-meteo risks) project, funded by the Horizon 2020 under the Grant Agreement No: 776848.
Institutional Review Board Statement
Not applicable.
Informed Consent Statement
Not applicable.
Data Availability Statement
Data available on request.
Conflicts of Interest
The authors declare no conflict of interest.
References
- Sahani, J.; Kumar, P.; Debele, S.; Spyrou, C.; Loupis, M.; Aragão, L.; Porcù, F.; Rahman Shah, M.A.; Di Sabatino, S. Hydro-meteorological risk assessment methods and management by nature-based solutions. Sci. Total Environ. 2019, 696, 133936. [Google Scholar] [CrossRef]
- Dhyani, S.; Gupta, A.K.; Karki, M.B. Nature-Based Solutions for Resilient Ecosystems and Societies; Springer: Singapore, 2020; ISBN 978-981-15-4711-9. [Google Scholar] [CrossRef]
- Cohen-Shacham, E.; Walters, G.; Janzen, C.; Maginnis, S. Nature-Based Solutions to Address Global Societal Challenges; IUCN: Gland, Switzerland, 2016. [Google Scholar] [CrossRef]
- Anderson, C.C.; Renaud, F.G. A review of public acceptance of nature-based solutions: The ‘why’, ‘when’, and ‘how’ of success for disaster risk reduction measures. AMBIO 2021. [Google Scholar] [CrossRef] [PubMed]
- Seddon, N.; Chausson, A.; Berry, P.; Girardin, C.A.J.; Smith, A.; Turner, B. Understanding the value and limits of nature-based solutions to climate change and other global challenges. Philos. Trans. R. Soc. B Biol. Sci. 2020, 375, 20190120. [Google Scholar] [CrossRef] [PubMed]
- Turconi, L.; Faccini, F.; Marchese, A.; Paliaga, G.; Casazza, M.; Vojinovic, Z.; Luino, F. Implementation of Nature-Based Solutions for Hydro-Meteorological Risk Reduction in Small Mediterranean Catchments: The Case of Portofino Natural Regional Park, Italy. Sustainability 2020, 12, 1240. [Google Scholar] [CrossRef]
- Intergovernmental Panel on Climate Change, IPCC. Impacts, Adaptation, and Vulnerability. Part A: Global and Sectoral Aspects. Contribution of Working Group II to the Fifth Assessment Report of the Intergovernmental Panel on Climate Change. 2018, pp. 1–34. Available online: https://www.ipcc.ch/report/ar5/wg2/ (accessed on 22 February 2020).
- Kalantari, Z.; Ferreira, C.S.S.; Keesstra, S.; Destouni, G. Nature-based solutions for flood-drought risk mitigation in vulnerable urbanizing parts of East-Africa. Curr. Opin. Environ. Sci. Health 2018, 5, 73–78. [Google Scholar] [CrossRef]
- Natural Hazards. Nature-Based Solutions Platform. 2019. Available online: https://naturebasedsolutions.org/map (accessed on 17 November 2020).
- Science for Environment Policy. The Solution Is in Nature. Future Brief 24. Brief Produced for the European Commission DG Environment; Science Communication Unit, UWE Bristol: Bristol, UK, 2021. [Google Scholar] [CrossRef]
- Pauleit, S.; Zölch, T.; Hansen, R.; Randrup, T.B.; van den Bosch, C.K. Nature-Based Solutions and Climate Change—Four Shades of Green. In Nature-Based Solutions to Climate Change Adaptation in Urban Areas. Theory and Practice of Urban Sustainability Transitions; Kabisch, N., Korn, H., Stadler, J., Bonn, A., Eds.; Springer: Cham, Switzerland, 2017. [Google Scholar] [CrossRef]
- Balzan, M.V.; Tomaskinova, J.; Collier, M.; Dicks, L.; Geneletti, D.; Grace, M.; Longato, D.; Sadula, R.; Stoev, P.; Sapundzhieva, A. Building capacity for mainstreaming nature-based solutions into environmental policy and landscape planning. Res. Ideas Outcomes 2020, 6, e58970. [Google Scholar] [CrossRef]
- Raymond, C.M.; Berry, P.; Breil, M.; Nita, M.R.; Kabisch, N.; de Bel, M.; Enzi, V.; Frantzeskaki, N.; Geneletti, D.; Cardinaletti, M.; et al. An Impact Evaluation Framework to Support Planning and Evaluation of Nature-Based Solutions Projects; Report Prepared by the EKLIPSE Expert Working Group on Nature-Based Solutions to Promote Climate Resilience in Urban Areas; Centre for Ecology & Hydrology: Wallingford, UK, 2017; ISBN 978-1-906698-62-1. [Google Scholar]
- Jongman, B. Effective adaptation to rising flood risk. Nat. Commun. 2018, 9, 1986. [Google Scholar] [CrossRef] [PubMed]
- Pagano, A.; Pluchinotta, I.; Pengal, P.; Cokan, B.; Giordano, R. Engaging stakeholders in the assessment of NBS effectiveness in flood risk reduction: A participatory System Dynamics Model for benefits and co-benefits evaluation. Sci. Total Environ. 2019, 690, 543–555. [Google Scholar] [CrossRef]
- Debele, S.E.; Kumar, P.; Sahani, J.; Marti-Cardona, B.; Mickovski, S.B.; Leo, L.S.; Porcù, F.; Bertini, F.; Montesi, D.; Vojinovic, Z.; et al. Nature-based solutions for hydro-meteorological hazards: Revised concepts, classification schemes and databases. Environ. Res. 2019, 179, 108799. [Google Scholar] [CrossRef]
- Dadson, S.J.; Hall, J.W.; Murgatroyd, A.; Acreman, M.; Bates, P.; Beven, K.; Heathwaite, L.; Holden, J.; Holman, I.P.; Lane, S.N.; et al. A restatement of the natural science evidence concerning catchment-based ‘natural’ flood management in the UK. Proc. R. Soc. A Math. Phys. Eng. Sci. 2017, 473, 20160706. [Google Scholar] [CrossRef]
- Martín, E.G.; Costa, M.M.; Máñez, K.S. An operationalized classification of Nature Based Solutions for water-related hazards: From theory to practice. Ecol. Econ. 2020, 167, 106460. [Google Scholar] [CrossRef]
- Mentzafou, A.; Varlas, G.; Dimitriou, E.; Papadopoulos, A.; Pytharoulis, I.; Katsafados, P. Modeling the Effects of Anthropogenic Land Cover Changes to the Main Hydrometeorological Factors in a Regional Watershed, Central Greece. Climate 2019, 7, 129. [Google Scholar] [CrossRef]
- Stefanopoulou, M.; Panga, D.; Apostolidou, I.-G.; Spyrou, C.; Loupis, M. An holistic approach to Nature Based Solutions as a means to adapt to and mitigate climate change induced risks: The case study of Sperchios. In Proceedings of the 11th EGME Conference, Volos, Greece, 8 November 2019. [Google Scholar] [CrossRef]
- Psomiadis, E. Research of Geomorphological and Environmental Changes in the Sperchios’ River Basin Utilizing New Technologies. Ph.D. Thesis, Agricultural University of Athens, Athens, Greece, 2010. (In Greek). [Google Scholar]
- Dikau, R. The application of a digital relief model to landform analysis in geomorphology. In Three Dimensional Applications in Geographical Information Systems; Raper, J.F., Ed.; Taylor and Francis: London, UK, 1989; pp. 51–77. [Google Scholar]
- HCMR. Development of an Integrated Management System for Basin, Coastal and Marine Zones. Results of the Annual Evaluation of Ecological Quality of Each Water Body; Hellenic Centre for Marine Research: Anavyssos, Greece, 2015. (In Greek) [Google Scholar]
- Koutsoyiannis, D.; Mamassis, N.; Efstratiadis, A. Hydrological Study of the Sperhios Basin, Hydrological and Hydraulic Study for the Flood Protection of the New Railway in the Region of Sperhios River. Athens Technical Study. 2003. Available online: https://www.itia.ntua.gr/en/docinfo/729/ (accessed on 27 May 2020). (In Greek).
- Peel, M.C.; Finlayson, B.L.; McMahon, T.A. Updated world map of the Köppen-Geiger climate classification. Hydrol. Environ. Syst. Sci. 2007, 11, 1633–1644. [Google Scholar] [CrossRef]
- Poulos, S.; Collins, M.; Pattiaratchi, C.; Cramp, A.; Gull, W.; Tsimplis, M.; Papatheodorou, G. Erratum to “Oceanography and sedimentation in the semi-enclosed, deep-water Gulf of Corinth (Greece)”. Mar. Geol. 1997, 138, 313–314. [Google Scholar] [CrossRef]
- Acharya, M.S. Analytical Approach to Design Vegetative Crib Walls. Geotech. Geol. Eng. 2017, 36, 483–496. [Google Scholar] [CrossRef]
- Lammeranner, W.; Rauch, H.P.; Laaha, G. Implementation and monitoring of soil bioengineering measures at a landslide in the Middle Mountains of Nepal. In Eco-and Ground Bio-Engineering: The Use of Vegetation to Improve Slope Stability. Developments in Plant and Soil Sciences; Stokes, A., Spanos, I., Norris, J.E., Cammeraat, E., Eds.; Springer: Dordrecht, The Netherlands, 2007; Volume 103. [Google Scholar] [CrossRef]
- TUFLOW USER Manual—Build 2018-03-AC. Available online: https://downloads.tuflow.com/_archive/TUFLOW/Releases/2018-03/TUFLOW%20Manual.2018-03.pdf (accessed on 9 October 2019).
- DHI. MIKE HYDRO RIVER User Manual; Danish Hydraulic Institute: Copenhagen, Denmark, 2020. [Google Scholar]
- DHI. MIKE SHE User Manual; Danish Hydraulic Institute: Copenhagen, Denmark, 2020. [Google Scholar]
- ERGOSE. Environmental Impact Study, Measures to Prevent Flood Damage in Spercheios River Basin. September 2003. Available online: https://floods.ypeka.gr/egyFloods/gr07/Reports/II_4_P17_EL07.pdf (accessed on 5 February 2019).
- European Environment Agency (EEA). Copernicus Land Monitoring Service. CORINE Land Cover. Version 2020_20u1. 2012. Available online: https://land.copernicus.eu/pan-european/corine-land-cover/clc-2012 (accessed on 1 March 2020).
- Morrison, W.R.B.; Smith, P.A. A Practical Application of a Network Model. Numerical Simulation of Fluid Motion; North Holland Pub. Co.: Amsterdam, The Netherlands, 1978. [Google Scholar]
- Refsgaard, J.C.; Storm, B. MIKE SHE. In Computer Models of Watershed Hydrology; Singh, V.P., Ed.; Water Resources Publication: Highlands Ranch, CO, USA, 1995; pp. 809–846. [Google Scholar]
- Crawford, N.H.; Linsley, R.K. Digital Simulation in Hydrology’ Stanford Watershed Model 4. Yan, Jiansheng, and Keith R. Smith. Simulation of Integrated Surface Water and Ground Water Systems-Model Formulation 1. J. Am. Water Resour. Assoc. 1994, 30, 879–890. [Google Scholar] [CrossRef]
- Yan, J.; Smith, K.R. Simulation of integrated surface water and ground water systems—Model formulation. J. Am. Water Resour. Assoc. 1994, 30, 879–890. [Google Scholar] [CrossRef]
- Zoch, R.T. On the relation between rainfall and stream flow—III. Mon. Weather. Rev. 1937, 65, 135–147. [Google Scholar] [CrossRef]
- Zoch, R.T. On the relation between rainfall and stream flow—II. Mon. Weather. Rev. 1936, 64, 105–121. [Google Scholar] [CrossRef]
- Zoch, R.T. On the relation between rainfall and stream flow. Mon. Weather. Rev. 1934, 62, 315–322. [Google Scholar] [CrossRef]
- Mentzafou, A.; Vamvakaki, C.; Zacharias, I.; Gianni, A.; Dimitriou, E. Climate change impacts on a Mediterranean river and the associated interactions with the adjacent coastal area. Environ. Earth Sci. 2017, 76, 259. [Google Scholar] [CrossRef]
- Hargreaves, G.H.; Samani, Z.A. Reference Crop Evapotranspiration from Temperature. Appl. Eng. Agric. 1985, 1, 96–99. [Google Scholar] [CrossRef]
- Moriasi, D.N.; Arnold, J.G.; Van Liew, M.W.; Bingner, R.L.; Harmel, R.D.; Veith, T.L. Model Evaluation Guidelines for Systematic Quantification of Accuracy in Watershed Simulations. Trans. ASABE 2007, 50, 885–900. [Google Scholar] [CrossRef]
- Hersbach, H.; Bell, B.; Berrisford, P.; Hirahara, S.; Horányi, A.; Muñoz-Sabater, J.; Nicolas, J.; Peubey, C.; Radu, R.; Schepers, D.; et al. The ERA5 global reanalysis. Q. J. R. Meteorol. Soc. 2020, 146, 1999–2049. [Google Scholar] [CrossRef]
- Jacob, D.; Petersen, J.; Eggert, B.; Alias, A.; Christensen, O.B.; Bouwer, L.M.; Braun, A.; Colette, A.; Déqué, M.; Georgievski, G.; et al. EURO-CORDEX: New high-resolution climate change projections for European impact research. Reg. Environ. Chang. 2014, 14, 563–578. [Google Scholar] [CrossRef]
- Hawkins, E.; Sutton, R.T. The Potential to Narrow Uncertainty in Regional Climate Predictions. Bull. Am. Meteorol. Soc. 2009, 90, 1095–1108. [Google Scholar] [CrossRef]
- O’Neill, B.C.; Carter, T.R.; Ebi, K.; Harrison, P.A.; Kemp-Benedict, E.; Kok, K.; Kriegler, E.; Preston, B.L.; Riahi, K.; Sillmann, J.; et al. Achievements and needs for the climate change scenario framework. Nat. Clim. Chang. 2020, 10, 1074–1084. [Google Scholar] [CrossRef]
- Van Vuuren, D.P.; Edmonds, J.; Kainuma, M.; Riahi, K.; Thomson, A.; Hibbard, K.; Hurtt, G.C.; Kram, T.; Krey, V.; Lamarque, J.-F.; et al. The representative concentration pathways: An overview. Clim. Chang. 2011, 109, 5–31. [Google Scholar] [CrossRef]
- Hausfather, Z.; Peters, G.P. Emissions—The ‘business as usual’ story is misleading. Nat. Cell Biol. 2020, 577, 618–620. [Google Scholar] [CrossRef] [PubMed]
Publisher’s Note: MDPI stays neutral with regard to jurisdictional claims in published maps and institutional affiliations. |
© 2021 by the authors. Licensee MDPI, Basel, Switzerland. This article is an open access article distributed under the terms and conditions of the Creative Commons Attribution (CC BY) license (http://creativecommons.org/licenses/by/4.0/).