1. Introduction
The term sustainability, which means “to hold up or support”, was emerged in the 18th century for forest management issues [
1]. In recent decades, sustainability has concentrated on various fields, such as the environment, agriculture, and social sciences. Sustainability assessment has played an important role in the improvement of the decision making process. This process mainly involves intragenerational and intergenerational considerations, which lead to (1) enhanced monitoring and communication of results, (2) a supported constructive interaction among stakeholders, (3) an integration of sustainability spheres, and (4) a consideration of their interdependencies.
Sustainability assessment is an important task [
2,
3,
4,
5] that is mainly conducted based on three main aspects of sustainability, environment, economy, and society. The efficient utilization of environmental resources is a basic goal of environmental sustainability. Considering economic sustainability, financial costs and benefits are important factors [
6]. Meanwhile, social sustainability concentrates on individuals’ well-being [
7].
In recent years, various assessment tools have been developed to evaluate aspects or pillars of sustainability in several contexts such as rice production [
8], fashion business [
9], clean technological innovation [
10], and wastewater reuse [
11]. The use of pillars of sustainability could vary due to the use of different sustainability tools. Several studies took all dimensions of sustainability (environmental, economic, and social) into account [
12,
13], while some other studies only concentrated on the economic and environmental aspects [
9]. Several studies placed their focus solely on the environmental aspects [
14,
15,
16]. Other studies concentrated on the economic aspects of sustainability [
17,
18].
Janeiro and Patel [
19] defined sustainability assessment as an issue related to Multi-Criteria Decision Making (MCDM). Multi-Criteria Decision Analysis (MCDA) methods have been widely used for sustainability assessment. Considering sustainability pillars, these techniques are mainly used to determine the best alternatives for policymaking. Ness et al. [
20] presented a classification of sustainability assessment tools based on product-related assessments, integrated assessments, and non-integrated indicator-based assessments. In a study by Cinelli and Coles [
14], a comprehensive analysis was conducted of MCDA applied-methods for sustainability assessment. As a result, it was found that Dominance Based Rough Set Approach (DRSA), Preference Ranking Organization Method for Enrichment of Evaluations (PROMETHEE), ELECTRE, and Multi-Attribute Utility Theory (MAUT) could be used to manage uncertain information through the definition and use of thresholds and probability distributions.
Fuzzy logic can be used as a natural technical tool to assess sustainability. This technique is effective in emulating individuals’ skills and managing vague situations. Furthermore, it is also capable of managing complex and polymorphous concepts. Compared to traditional mathematical approaches, fuzzy logic is distinguished by its ability to utilize linguistic variables. In this technique, knowledge is represented by the IF-THEN linguistic rules. Following that, a fuzzification technique is implemented to transform real values into linguistic values. Identifying the IF-THEN rules is essential in designing assessment systems through this technique. These fuzzy rules are used during the fuzzy reasoning process of the system. The final output of the system is obtained through a defuzzification technique.
Sustainability Assessment by Fuzzy Evaluation (SAFE) [
21] was developed as a fuzzy rule-based system in measuring the overall sustainability of countries. Based on the basic indicators of sustainability, it focuses on two main dimensions, namely Human Sustainability and Ecological Sustainability. The initial SAFE model has been used to investigate sustainability problems and has been enhanced by other researchers, including Kouloumpis et al. [
22], Kouikoglou and Phillis [
23], and Andriantiatsaholiniaina et al. [
24]. The fuzzy logic approach was used in SAFE, where the dimensions in this model comprise hierarchical Fuzzy Inference Systems (FISs). Furthermore, SAFE consists of 75 inputs. The fuzzy rules discovered from SAFE data are used to obtain the final output in each dimension and overall sustainability. The overall sustainability index could be seen in [0, 1]. Notably, SAFE is a flexible technique as it accepts any number of inputs. In respect of the basic sustainability indicators, this technique could also manage several types of information, such as quantitative and qualitative information. The number of inputs in SAFE plays an important role in measuring the level of sustainability through the number of fuzzy rules. Additionally, through using SAFE, the overall sustainability of a country is identified using a combination of two main dimensions, namely societal/human sustainability and ecological sustainability.
SAFE is a comprehensive assessment system as it considers the main elements of ecological sustainability and societal/human sustainability, which are also known as indicators. These elements are land integrity, economic welfare, biodiversity, political aspects, health, water quality, air quality, and education. Furthermore, through the use of more elementary variables including pressure indicators, response, and state, the evaluation of these indicators is conducted. Due to time and human resources, a small subset of indicators is usually taken into account to optimize sustainability. Furthermore, information regarding the SAFE model could be found on the website
http://www.sustainability.tuc.gr/ (accessed on 4 December 2019).
This study aims to extend previous literature on sustainability assessment by presenting a new method that uses machine learning techniques. Specifically, two types of machine learning techniques, namely supervised and unsupervised learning techniques, were applied to measure the sustainability performance of the countries. The main reason for developing the method by applying these techniques was its ability in automatic decision rules discovery from the data for the prediction models. Automatic decision rules discovery regarding sustainability is important, as the manual construction of the prediction models from the data is a challenging process due to the data’s complex nature. In addition, without the incorporation of automatic learning techniques, it would be time-consuming to manually determine sustainability performance from a large set of data. It was also found that the use of supervised and unsupervised learning techniques could present highly effective outcomes of measuring countries’ sustainability performance. The outcome of this research can address the shortcomings of previous methods and enhance prediction accuracy.
Hence, in this research, a new method to measure the sustainability performance of countries was implemented, through using Self-Organizing Map (SOM) and Classification and Regression Trees (CART). SAFE data were used to evaluate this method. Following is a summary of the contributions of this research:
A new method to assess sustainability performance was implemented, where machine learning techniques were used. In contrast to previous studies on sustainability assessment which only relied on knowledge-based approaches, unsupervised learning and supervised learning techniques were used in this study to assess sustainability performance.
For an improved efficiency of the sustainability assessment, a clustering technique was applied to construct the groups of data which included similar cases based on sustainability features. In addition, this technique was based on SOM, a neural network approach that is used to identify the clusters of data for the assessment of sustainability performance.
A supervised learning technique was implemented to construct prediction models. These models were used to determine the level of sustainability. Furthermore, the CART technique, which is based on the regression and classification approaches, was applied so that an accurate evaluation of sustainability performance through a set of real-world data was gained. The CART models were developed for ensemble learning. To the best of our knowledge, ensemble learning approaches have not been used extensively to assess sustainability performance.
The proposed method was evaluated on a real-world dataset, which involved the data regarding sustainability assessment in 128 countries. The dataset consisted of two main dimensions of sustainability, namely human sustainability and ecological sustainability within a comprehensive set of indicators.
Overall, we hypothesize that the integration of clustering and supervised learning techniques with the aid of an ensemble learning approach can enhance the efficiency of the assessment systems for sustainability performance in terms of prediction accuracy.
In this article,
Section 2 elaborates on studies related to sustainability assessment tools. The research method is presented in
Section 3. This is followed by
Section 4, in which data analysis and the method of sustainability assessment are presented. The discussions and recommendations from the research are provided in
Section 5. This article ends with a conclusion, which is presented in
Section 6.
2. Literature Review
Sustainability assessment has been investigated by several studies from different theoretical and methodological perspectives. In the rest of this literature review, we will summarize many of the key studies that have influenced the sue of big data, decision analysis, and sustainability assessment.
In the study by Wiek and Binder [
25], a decision support tool for sustainability assessment was used. Through this tool, the systemic knowledge and normative aspects were taken into account to achieve sustainable development in the city-regions. Meanwhile, the authors in [
26] developed a sustainability assessment tool based on a multi-criteria approach for the energy power system. Through this tool, several indicators were used, such as the economy, environmental, social, and resource indicators. Zarghami and Azemati [
27] used Fuzzy Analytic Hierarchy Process (FAHP) to develop a sustainability assessment tool. This process involved Leadership in Energy and Environmental Design (LEED), Building Research Establishment Environmental Assessment Method (BREEAM), Comprehensive Assessment System for Built Environment Efficiency (CASBEE), and Sustainable Building Tool (SBTool) indicators in the assessment system. The research evaluated five categories of international assessment tools, water efficiency, materials and resources, energy efficiency, sustainable site, and quality of the indoor environment. As a result, it was found that Energy Efficiency was the most prominent category of the sustainability assessment tool in Iran. The authors in [
5] proposed ANFIS as an approach to assess sustainability levels in countries. This approach was based on the sustainability dimensions and indicators that were used in SAFE.
For sustainable supplier selection, Amindoust et al. [
28] developed a ranking model based on a fuzzy inference system. Economic, environmental, and social indicators were used in the assessment model in three stages of evaluation. To prove the feasibility of the method, an illustrative example for a company with five candidate suppliers was presented. Meanwhile, the authors in [
29] used field scale indicators and fuzzy logic to evaluate the impacts of pesticides and tillage on agroecosystems. Toxicity and the dose applied were regarded as the main variables in deciding the final influence of a pesticide application, and Tillage Impact (TI) was evaluated in terms of its influence on the quantity of stubble left after tillage processes and the soil aggregates’ stability. As a result, it was found that fuzzy logic was beneficial for effective environmental analysis and evaluation. In a case study that was conducted by Azadi et al. [
30] in Southwest Iran, fuzzy logic was applied to manage the vague and uncertain concept of sustainability. Triangular and trapezoidal membership functions were applied to construct the membership functions of the prediction model. In addition, 27 fuzzy rules were used to determine the overall equilibrium.
The authors in [
31] developed a method through ensembles of neuro-fuzzy techniques for measuring country sustainability performance. They used SAFE model criteria to assess sustainability performance. The authors in [
32] used the SAFE model to assess the sustainability performance of 128 countries. The study investigated the link between ecological sustainability, human sustainability, and overall sustainability performance by utilizing the decision rules. The authors used fuzzy clustering and decision trees for measuring country sustainability performance. The result of this study demonstrated that the hybrid approach that combines clustering and prediction machine learning techniques can improve the prediction accuracy of ANFIS. The authors in [
33] used fuzzy Decision Making Trial And Evaluation Laboratory (DEMATEL) for the assessment of sustainability indicators of green building manufacturing. Research outcomes presented that energy efficiency and quality of the indoor environment are the most significant indicators. On the other hand, innovation and water efficiency are the least significant indices in evaluating green buildings in Malaysia. In the study by Li et al. [
34], the authors conducted a study to assess the sustainability of hydrogen production technologies through the MCDM approach. They used objective grey relational analysis and the DEMATEL method to identify the criteria weights. They used DEMATEL to consider the causal relationships among criteria. In the study by Ren et al. [
35], a two-stage MCDM method was developed for sustainability assessment of hydrogen production technologies. Five aspects were adopted for the sustainability evaluation of HPTs: political, technological, social, environmental, and economic. The method is developed using the fuzzy best-worst method and fuzzy TOPSIS. The aim was to find the importance level of factors in the proposed model. The authors in [
36] developed a method using an advanced hybrid MCDM approach to evaluate the sustainable hydrogen production options. They used AHP as an MCDM technique to determine the weights of the criteria and sub-indicators in the model. The outcome of the study revealed that the wind electrolysis approach is the answer to sustainable hydrogen-producing followed by the biomass gasification method.
Streimikiene and Skulskis [
37] developed a method for sustainability assessment in the green building context. They used the interval TOPSIS method for sustainability assessment. The outcomes of multicriteria sustainability evaluation of inorganic and organic building insulation materials indicated that sheep wool and recycled glass are the most desirable choices in several contexts. The authors in [
38] used the PROMETHEE method to assess the sustainability of large-scale composting technologies. They used social, economic, environmental, and technical criteria in the sustainability assessment. The outcomes of the study indicated that reactor techniques are more sustainable than enclosed techniques, which are ranked as more sustainable than open technologies. The results also indicated that the rotating drum is the most sustainable composting technique among the economic, environmental, technical, and social aspects. Akhanova and Nadeem [
39] conducted a study for building sustainability assessment through an MCDM technique. They used step-wise assessment ratio analysis for weight allocation. The research indicated the most general classes of globally accepted tools, among which, site selection, materials, energy efficiency, quality of the indoor environment, water efficiency, and waste.
The authors in [
40] used multiple criteria decision analysis for assessing national energy sustainability. The proposed approach was based on various energy sustainability indicators that entail three main aspects: energy system, human system, and environment. The authors used the ROMETHEE method for the evaluation of the sustainability performance of 43 European countries. The result of their study was interesting. The authors found that there is a significant relationship between geographical and income groupings and energy sustainability performance. The authors in [
41] conducted a study for sustainability performance through revised SAFE. In fact, the SAFE model was updated for the fourth time in this study. The aim was to perform a sensitivity analysis to show which indicators can improve sustainability the most. The study indicated that forest change, renewable energy production, corruption, and threatened species are the main important indicators globally. On the other hand, the CO2 emissions indicator is the most significant indicator in developed countries.
The authors in Amini, Rohani [
42] developed a method for sustainability assessment of rice production system. They used fuzzy logic for sustainability assessment through agricultural and economic models. Various sources of energy and sustainability and environmental loading indices of rice were inspected. The outcome of the study confirmed that the rice indices are not adequate. The authors in [
43] conducted a study for assessing global environmental sustainability through the unsupervised clustering approach. They used a self-organizing map as a clustering technique. Focusing on the environmental dimension of sustainability, the authors presented a novel framework to allow countries to reach informed decisions and define efficient directions. The authors in [
44] used fuzzy logic for sustainability performance evaluation through the SAFE model. According to the results of their study, the major factors that influence sustainability were: energy use, terrestrial protected areas, and political rights issues of the pacific island countries. The authors in [
45] developed an integrated model through MCDM for the sustainability performance assessment of insurance companies. A group of 4 social, 3 environmental, and 8 economic indices were utilized in this study. The indices were categorized into two sets to assess the companies focusing on the financial and managerial prospects. The authors used principal component analysis to cut the number of evaluation indices and the analytic hierarchy process to rank the indices. Asrol and Papilo [
46] presented a machine learning model to evaluate the sustainability performance using a machine learning approach and focusing on the environmental dimension of sustainability of the bioenergy industry. In a study by Attia and Alphonsine [
47], the economic, social, and ecological aspects were incorporated to define main performance indices for evaluating sustainable housing and to design a selection tool for student housing.
Based on previous literature on sustainability assessment, it was found that there is a limited number of studies for assessing sustainability performance by implementing clustering and prediction machine learning techniques. In addition, most of the studies on sustainability assessment relied on knowledge-based approaches. These approaches were based on fuzzy logic or MCDM techniques, where the experts’ knowledge and perspective were involved in the assessment. However, it is important to develop methods for the acquisition of a large set of data for this assessment which involves sustainability indicators and dimensions. Additionally, automatic data acquisition is not possible through the MCDM approaches. Overall, this is the main disadvantage of these approaches. In fact, the methods which are based on experts’ knowledge may not be efficient for large datasets as they require interventions from individuals to perform sustainability assessment. Accordingly, in this research we propose a new method for the assessment of sustainability performance using machine learning techniques. In the following section, we introduce the proposed method along with the techniques used in each step of data analysis for the performance assessment.
3. Methodology
Several methods have been applied in previous studies that involved supervised machine learning techniques to measure country sustainability performance, still, the disadvantages of these methods were present when applied to large datasets. It was believed that the clustering techniques could be useful in managing large datasets in sustainability assessment systems. Among the clustering techniques, SOM was shown to be effective in clustering tasks. This study also aims to apply this clustering technique for the clustering tasks in the context of country sustainability. Through this clustering technique, the data were clustered into different classes for a more efficient prediction task. In conducting this task on the sustainability data, an effective supervised technique, CART, was implemented. This technique is based on regression and classification approaches [
48]. In addition, an ensemble approach, Random Forest (RF), that relies on CART models is applied to each cluster of SOM. Thus, the proposed method tried to address the shortcoming of previous approaches and enhance the efficiency of assessment systems for sustainability performance in terms of prediction accuracy.
This study is the first to employ the SOM and CART techniques to assess country sustainability. It was believed that the combination of clustering and the learning techniques of the prediction machine could be an effective method of measuring sustainability performance. It could also alleviate the shortcomings of the previous methods and enhance prediction accuracy.
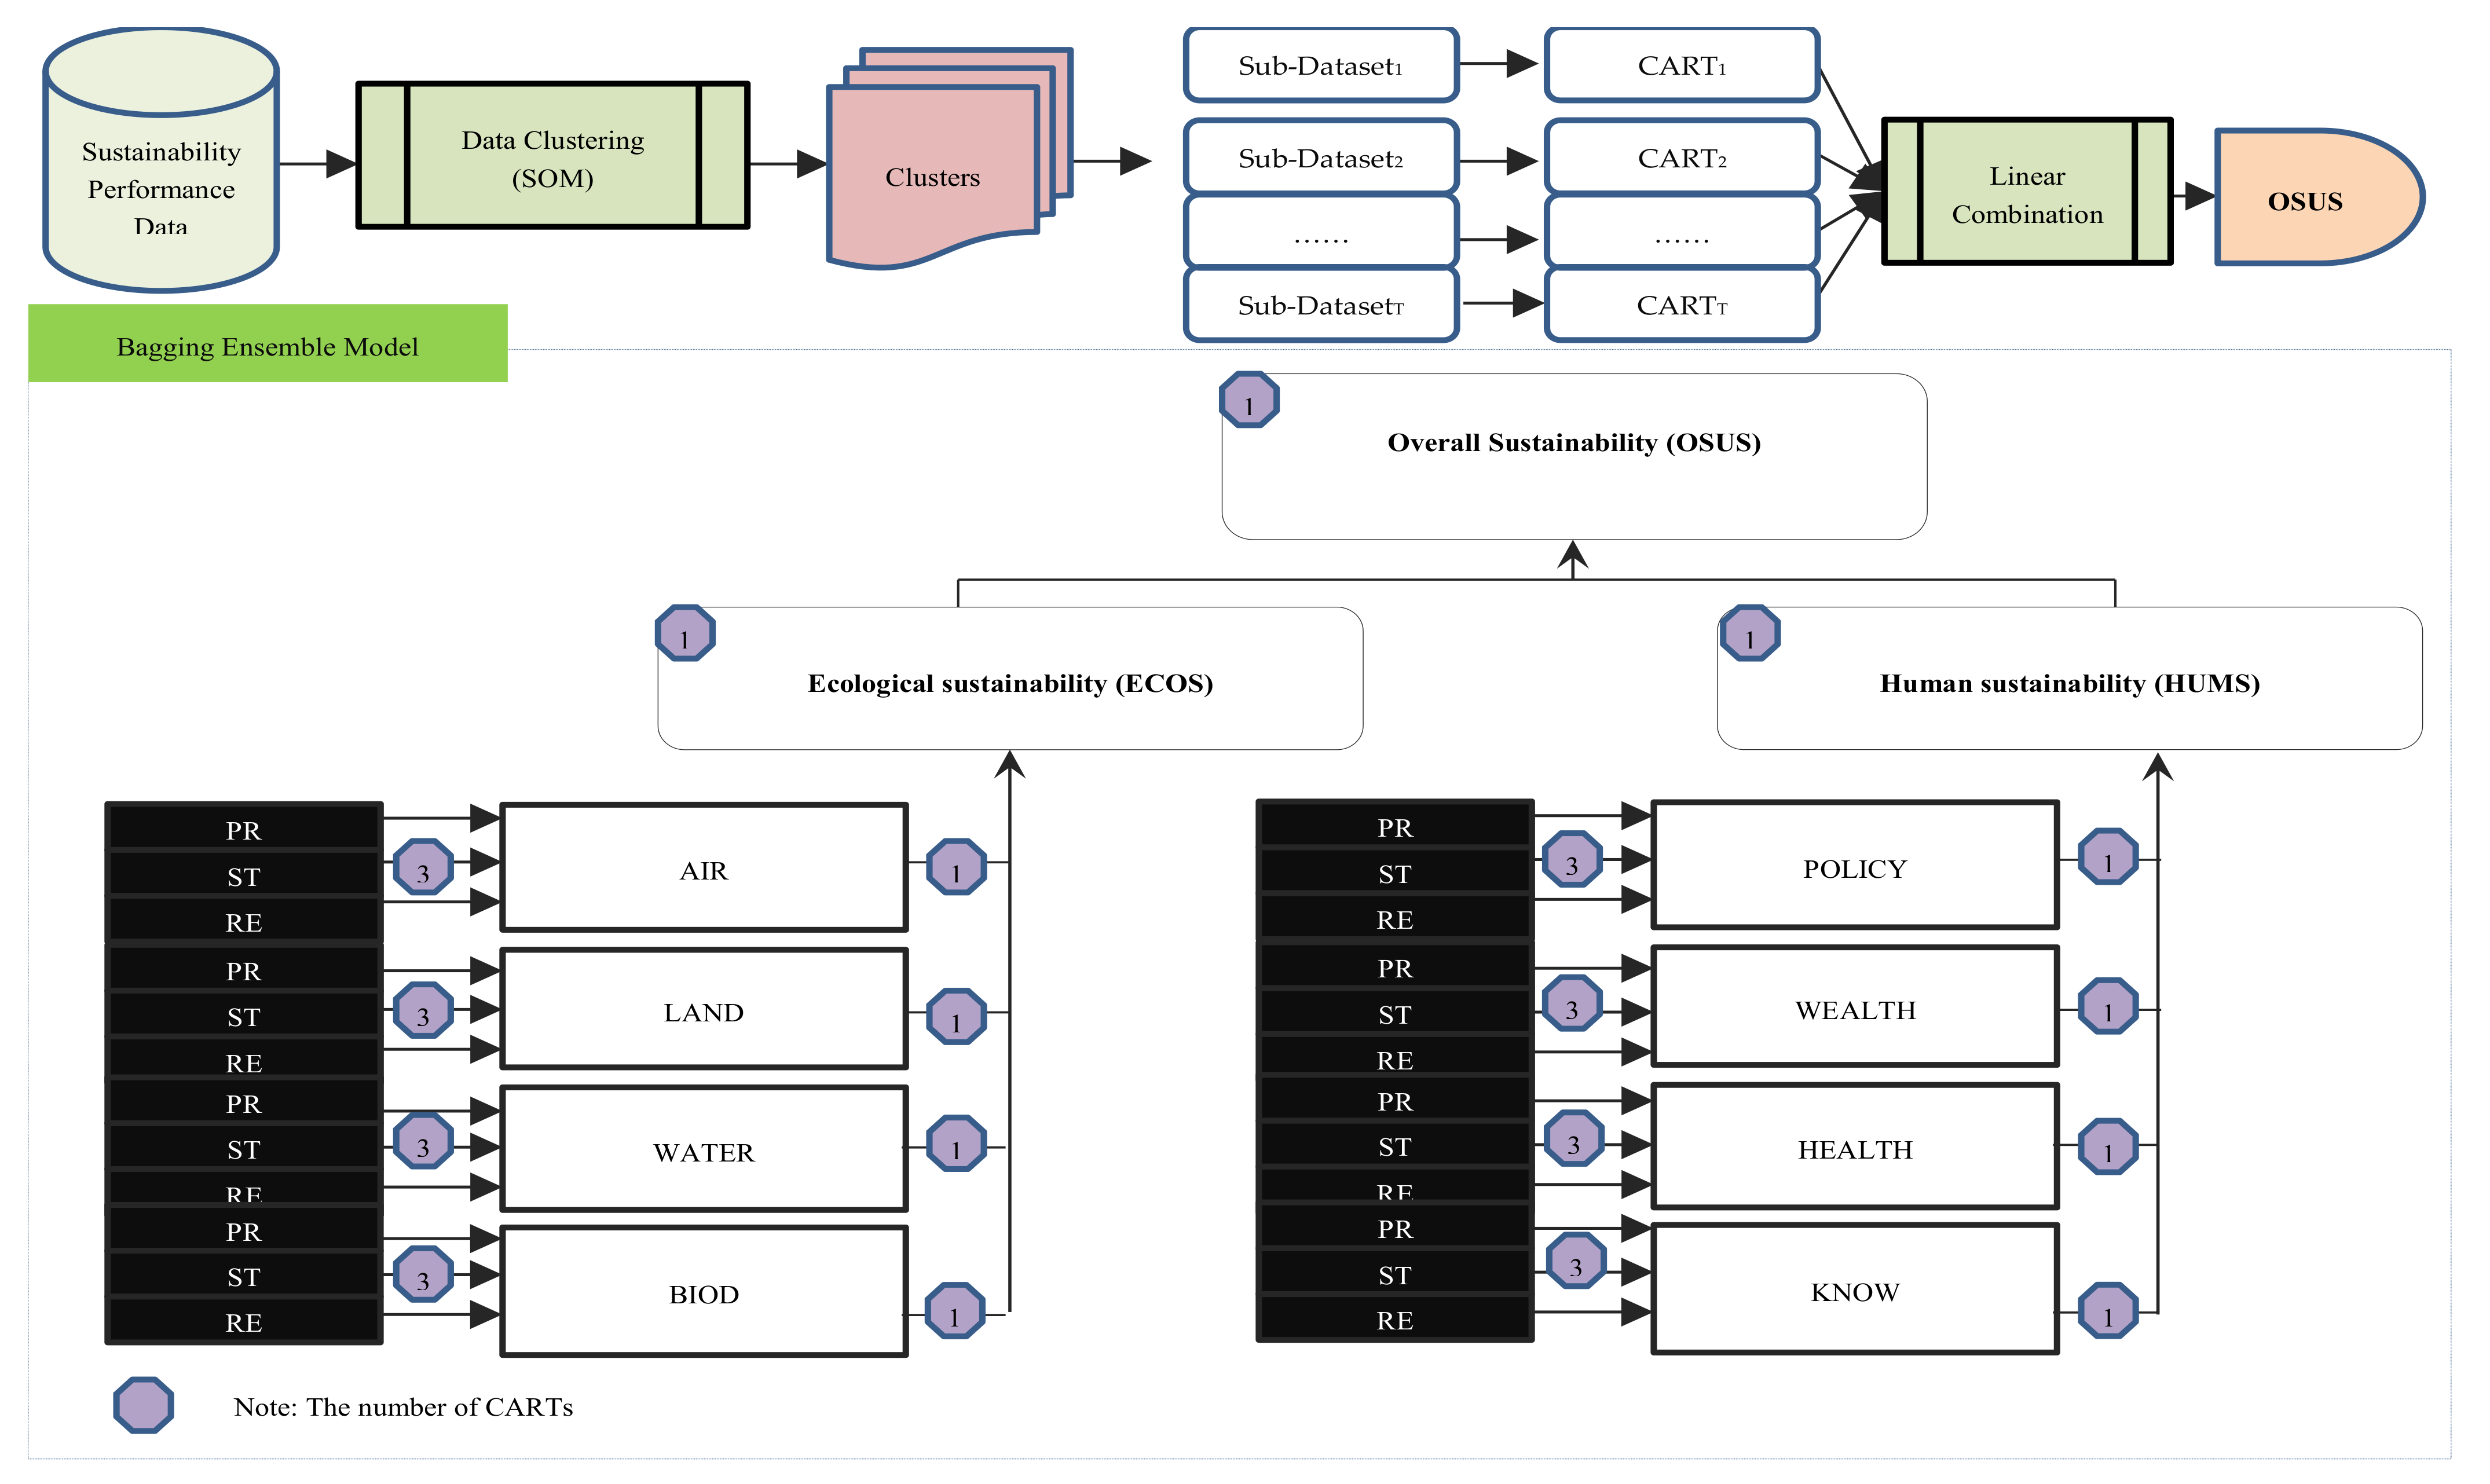
The machine learning technique, which was applied in this study, took two main components of the SAFE model into account, namely ecological sustainability (ECOS) and human sustainability (HUMS). There were four indicators focused by ECOS, namely “water quality (WATER)”, “land integrity (LAND)”, “air quality (AIR)”, and “biodiversity (BIOD)”. Meanwhile, HUMS took four indicators into account, namely “political aspects (POLICY)”, “economic welfare (WEALTH)”, “health (HEALTH)”, and “education (KNOW)”. Each of these indicators in ECOS and HUMS was measured through more elementary variables including Response (RE), State (ST), and Pressure (PR) indicators. These elementary variables were previously used in the SAFE model.
Figure 1 displays the aforementioned components, indicators, and elementary variables. The Overall Sustainability (OSUS) was performed through the combination of results gained from different levels of the proposed model.
Figure 1 also presents the hybrid method of clustering and supervised prediction techniques. It could be seen from the figure that before the prediction task, the data should be clustered into different groups, where each cluster comprised similar data regarding sustainability performance. Furthermore, the method in this study included the CART in four levels of sustainability assessment. The second level was developed to take the dimensions of sustainability into account. Sustainability indicators were used for the assessment according to each dimension in the third level. In the fourth level of this assessment, sustainability was evaluated through elementary variables. In the final level, the computation of the overall sustainability of countries was done. Therefore, for each cluster, a total of 35 CART models were developed, and each CART output in the lower level was identified as the upper level’s input. Notably, the total number of prediction models was influenced by the number of clusters generated by the SOM technique.
3.1. CART
CART has been utilized effectively for regression problems as it discovers nonlinear relationships without variable transformations [
48,
49]. This method is widely used in finding the relationship between inputs and output in decision-making systems. In this method, through recursive binary partitioning, each decision tree in CART is constructed [
50]. In addition, it has been shown that outliers have limited impacts on results. Furthermore, there is no significant impact of predictors’ collinearity on the accuracy in CART [
51]. In the CART approach, the goal is to find (learn) the relationship between a set of predictor variables and a dependent variable through a learning algorithm that employs recursive portioning. Although CART is considered an accurate method for prediction and classification tasks, the ensemble of different decision trees through the bagging approach can present more effective results. Through bagging which is based on bootstrapping approach, repeatedly selection of random subsets of the training data is performed to develop multiple classification trees. This is called Random Forests which is an ensemble approach that relies on CART models [
52,
53]. The structure of the bagging ensemble model proposed in this study is shown in
Figure 1.
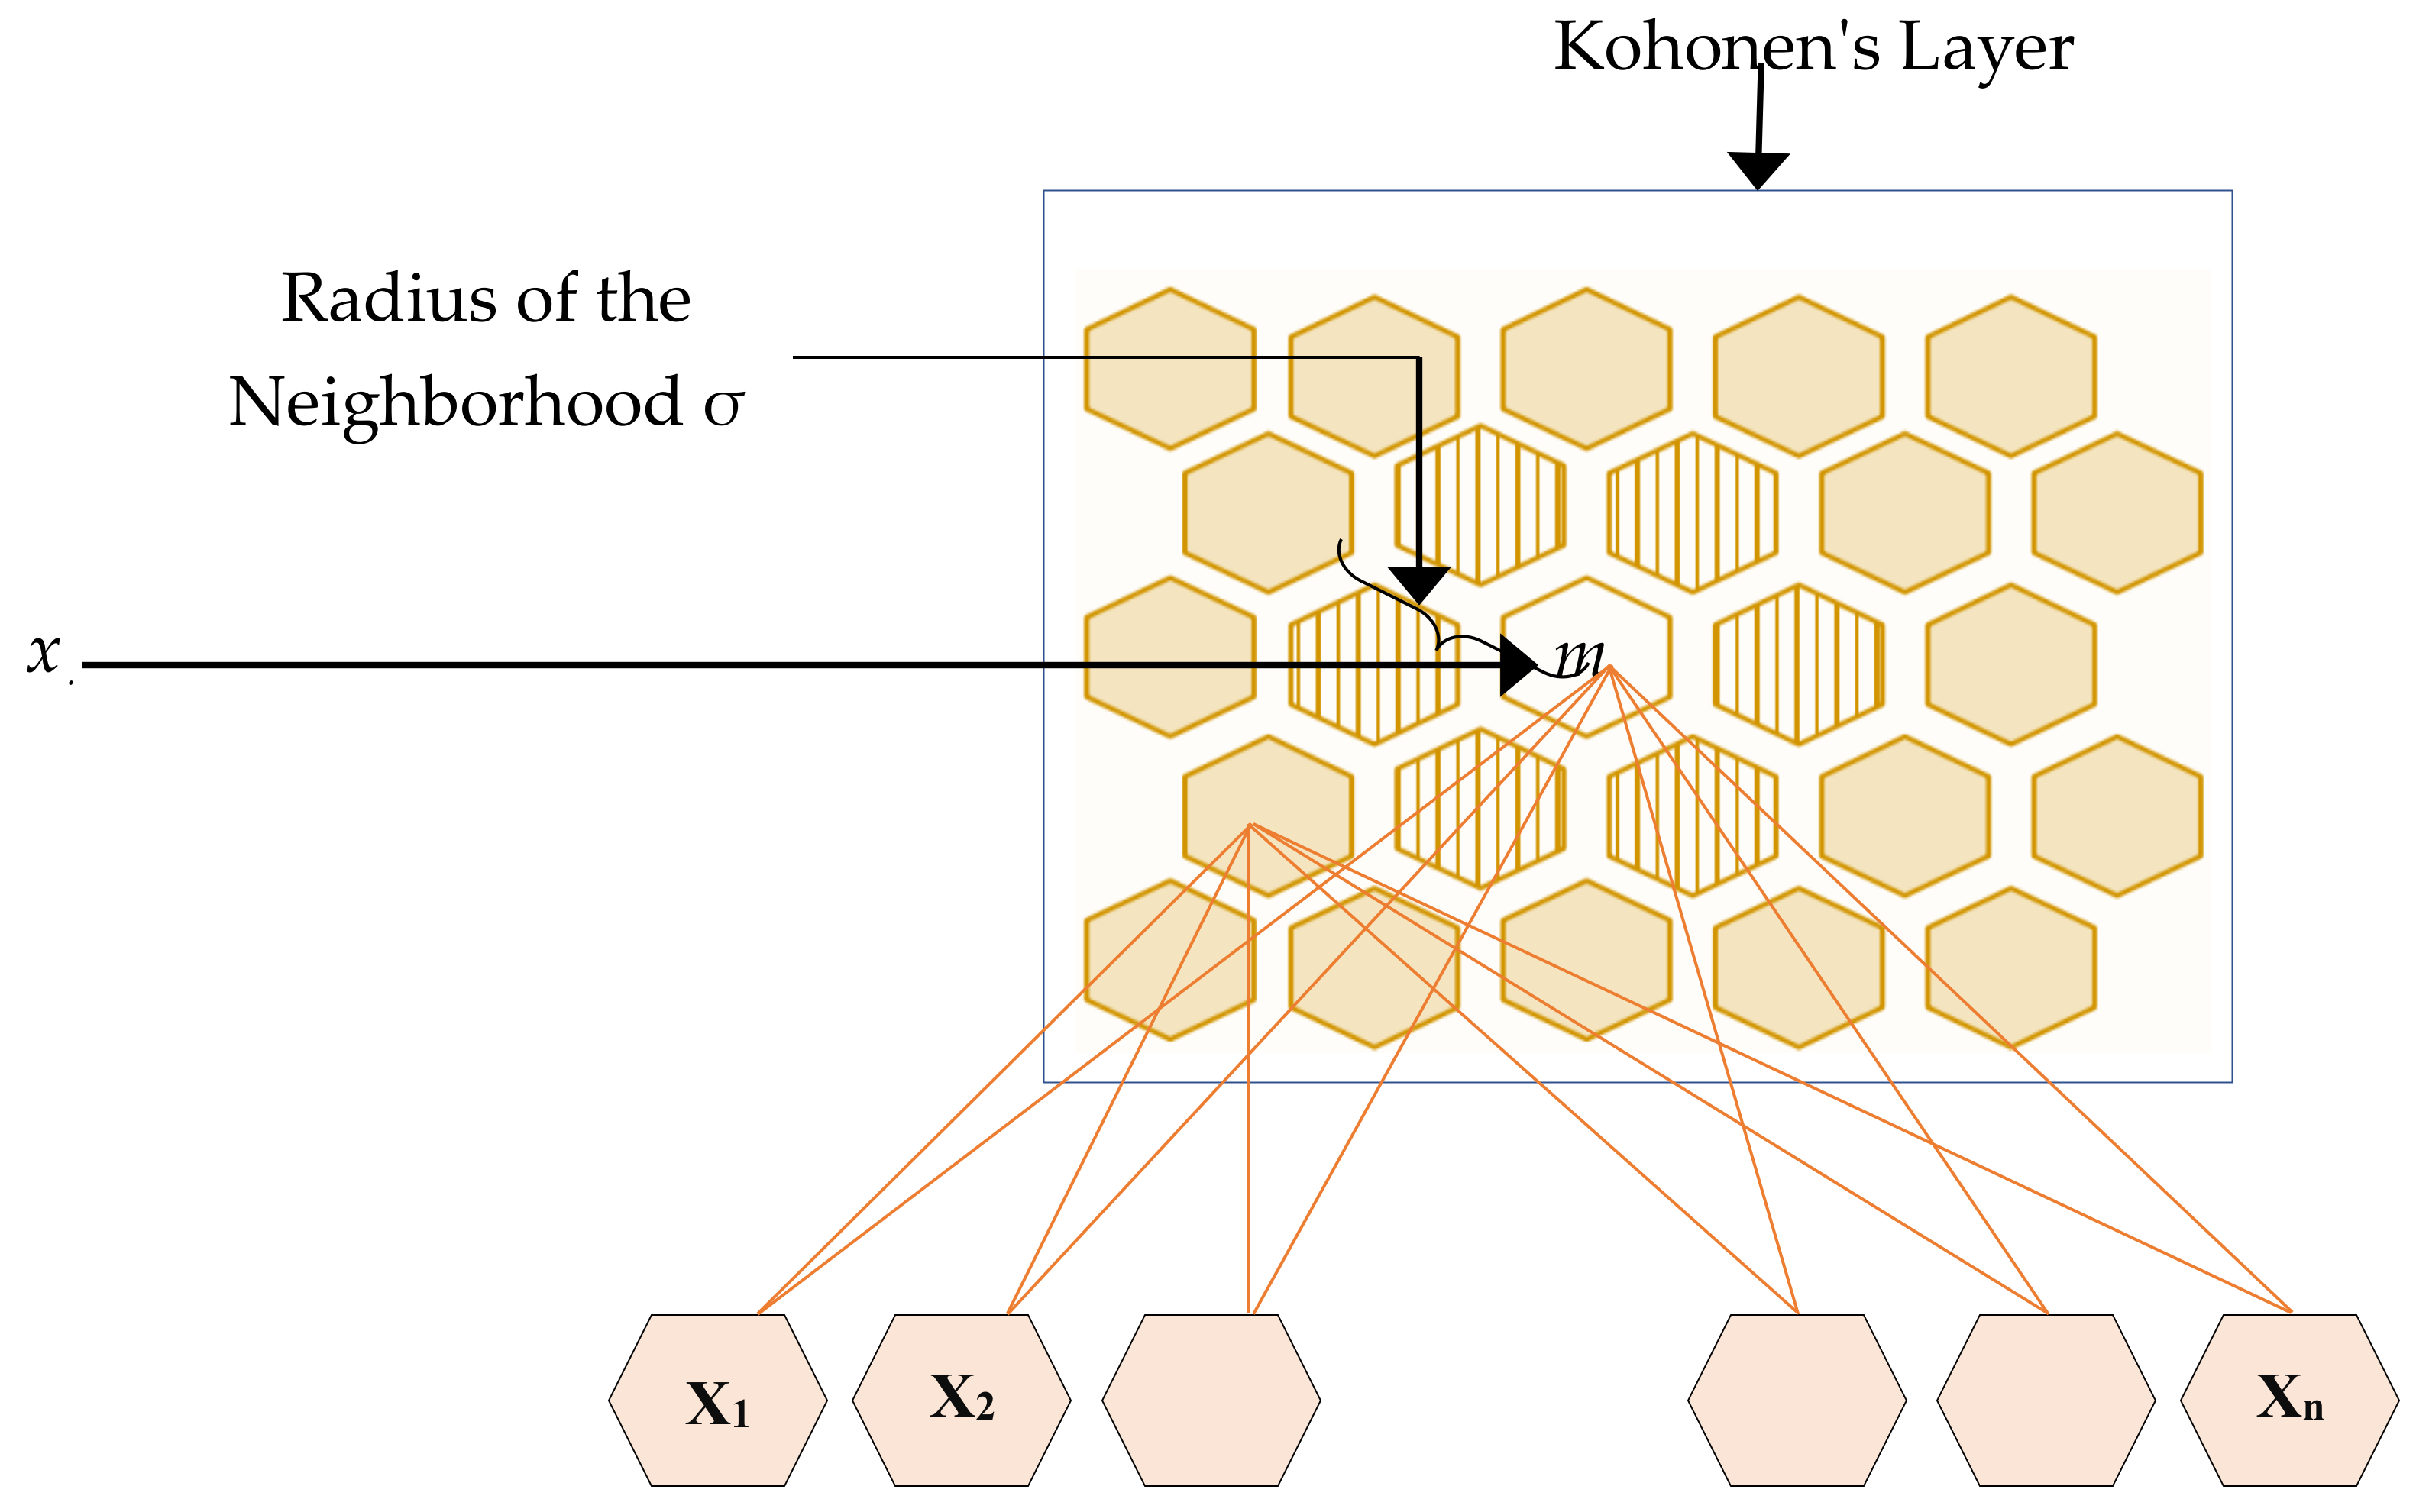
3.2. SOM
Clustering plays an important role in developing prediction methods. We used SOM for data clustering [
54,
55,
56]. The clusters were discovered in different map spaces, which allowed us to transform higher-dimensional input spaces into lower-dimensional map space. The goodness of clustering algorithm results was evaluated by a technique for final clustering size and map.
In SOM, the inputs in the dataset are projected onto the neural net, with connections between the neurons, in the cortical area. In fact, in SOM, output neurons of the model are interconnected in a lower-dimensional space within a defined neighborhood (see
Figure 2). In SOM the following main steps are performed:
All data points xj are compared with all nodes mi to find the nearest node mb which is called the best-matching unit (BMU) for each data point;
Each node mi in the 2D space is updated to averages of the attracted data, including data located in a specified neighborhood σ;
Step 1 and Step 2 are repeated a specified number of times.
4. Data Analysis and Method Evaluation
This study aims to measure country sustainability performance by implementing the SOM and CART techniques through a set of input indicators in the SAFE dataset. SAFE data were used to assess the used method.
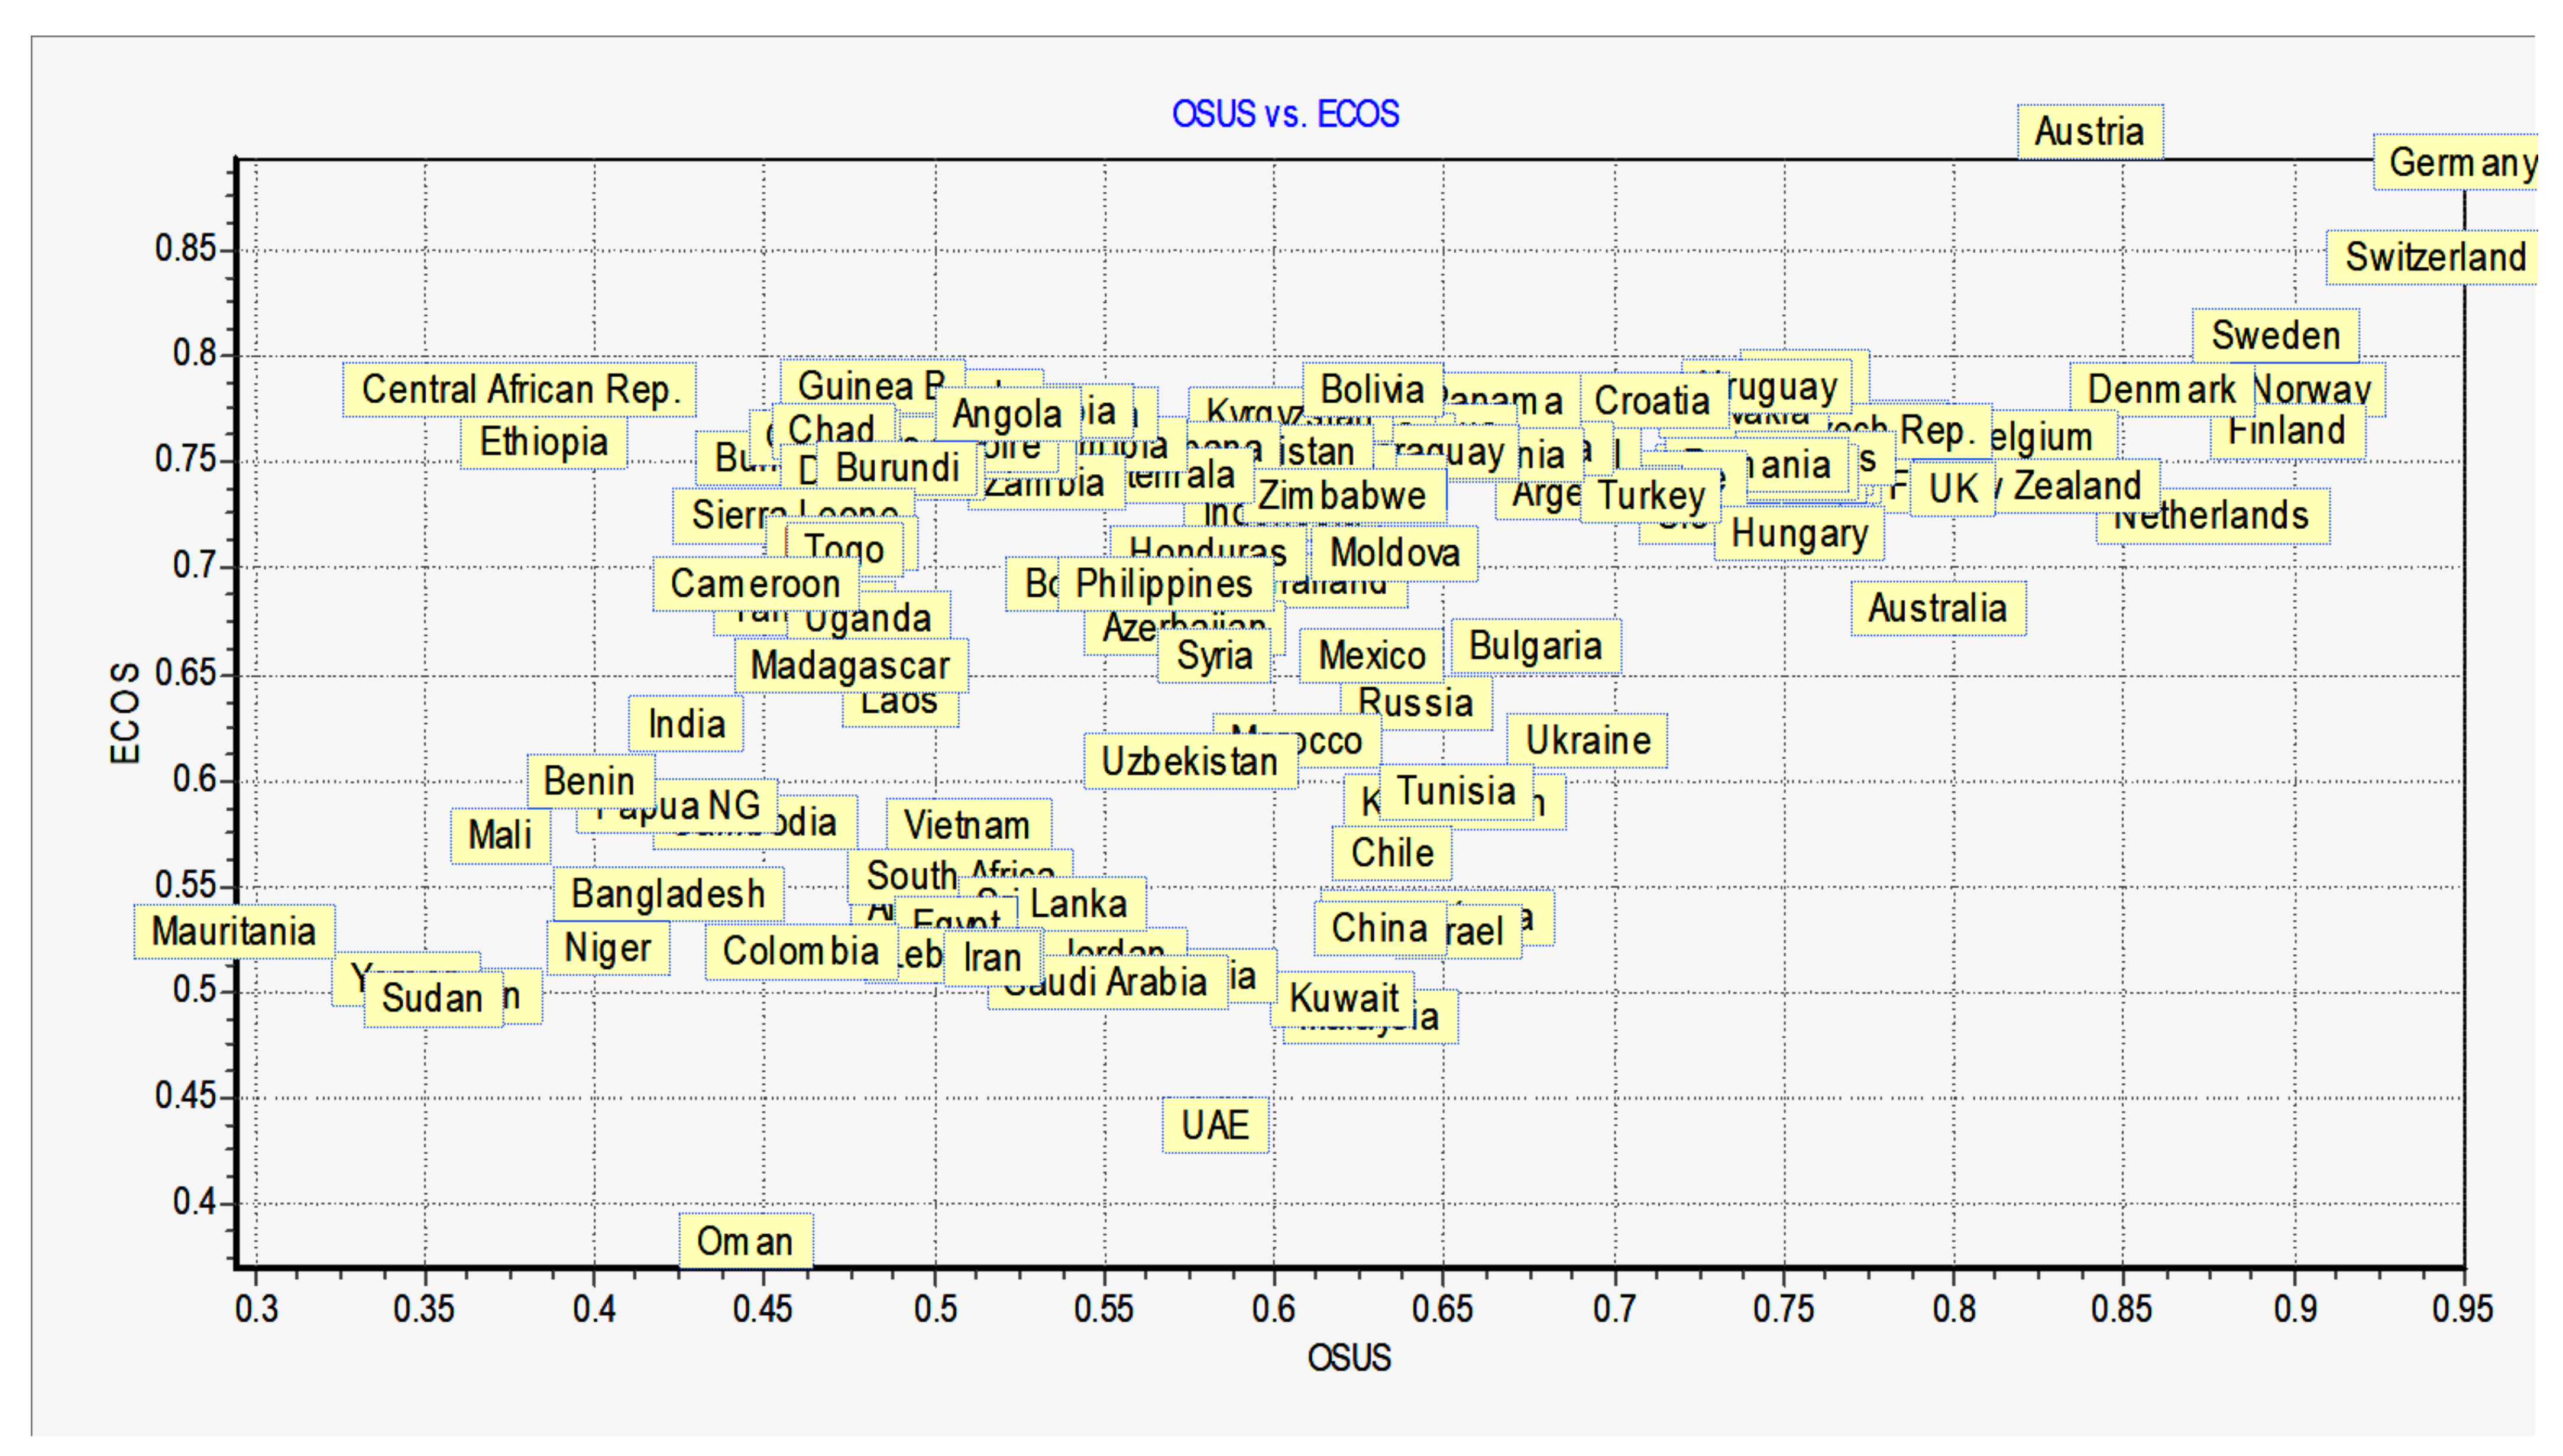
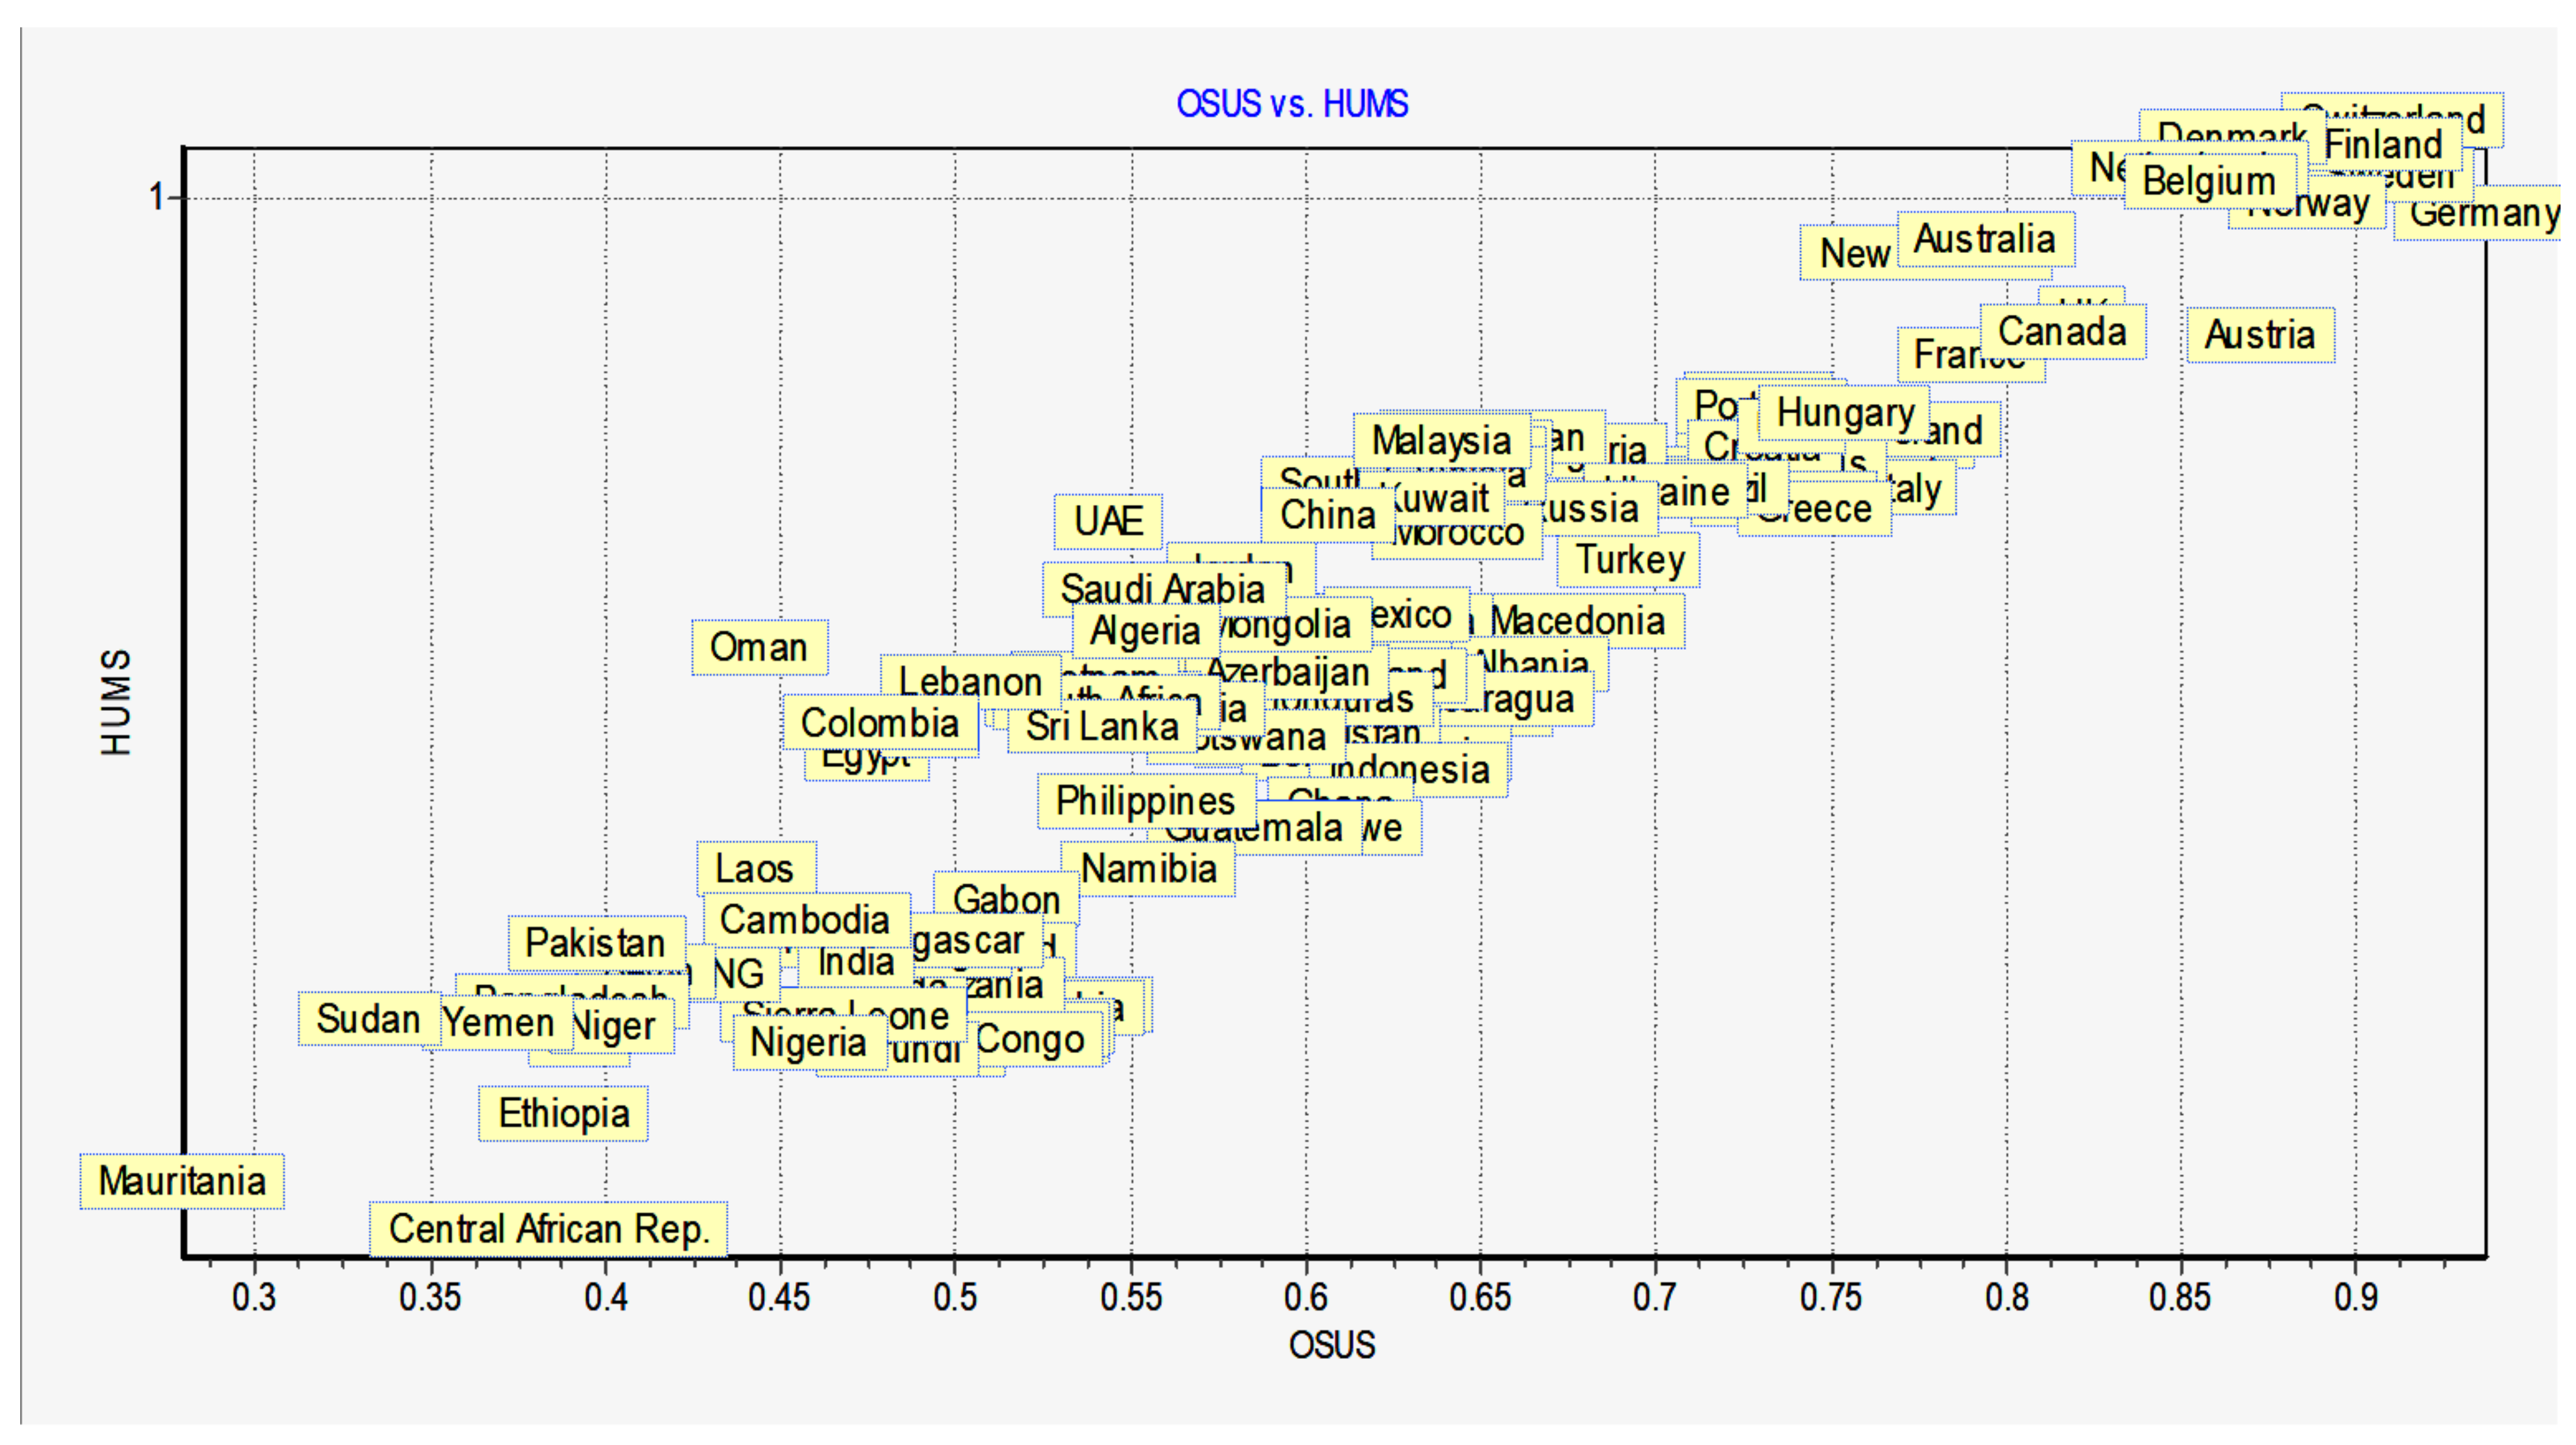
Figure A1 and
Figure A2 in
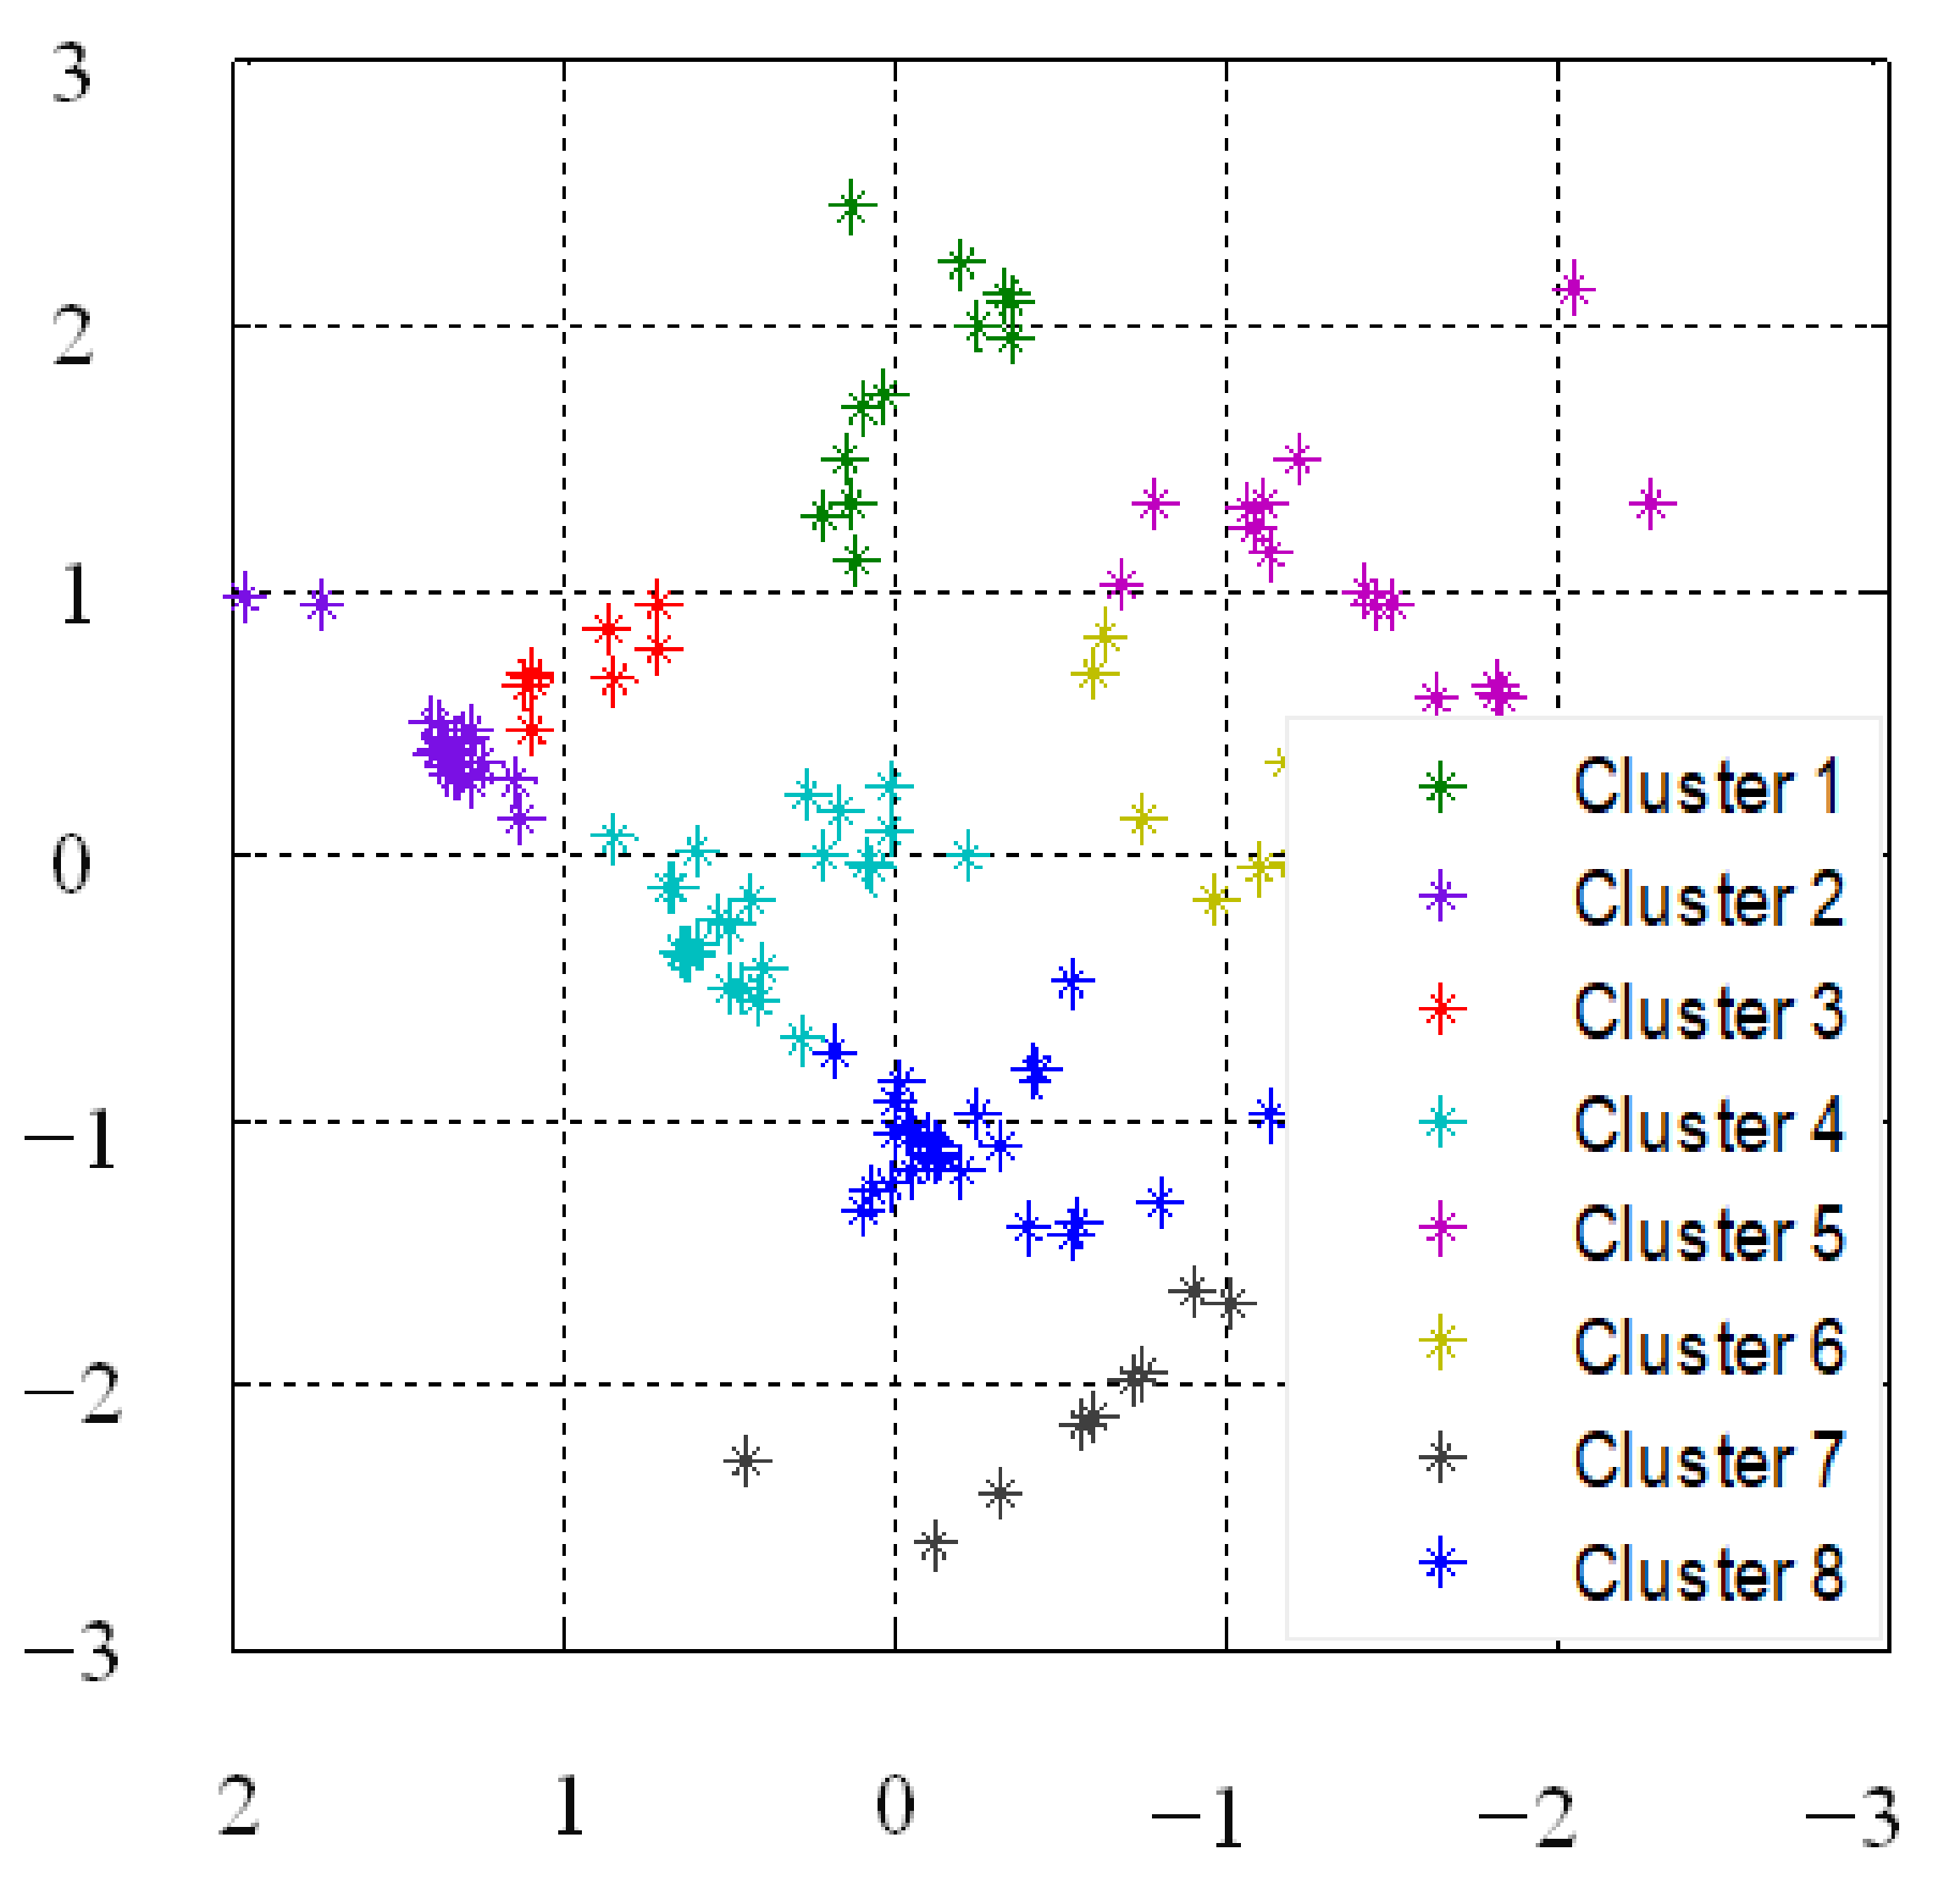
Appendix A present the sustainability data of 128 countries based on ECOS and HUMS. It could be seen from the figures that, similar to ECOS and OSUS, HUMS and OSUS were correlated to each other. Furthermore, societal/human sustainability and ecological sustainability levels were also determined. The first step of this study was the clustering of data into several classes using SOM. In this process, different SOM sizes were tested, and the best number of clusters was selected based on the SOM map quality. To be specific, an attempt of using SOM 2 × 2, SOM 2 × 3, SOM 2 × 4, and SOM 3 × 4 was done for SOM clustering. Meanwhile,
Figure 3 displays SOM 2 × 4 clustering results, as the accuracy value of SOM 2 × 4 (8 clusters) clustering was higher compared to the accuracy of other SOM.
In the next procedure of this research, prediction models were constructed using CART from the SAFE data by identifying the rules for decision-making. In fact, the use of CART allowed the identification of relationships between the inputs and outputs. Furthermore, CART was used to determine the relationship between X and Y based on Y = f(X
1, X
2, …, X
n). The sustainability of countries was measured through four levels of CART, as shown in
Figure 1. The information about the indicators of the SAFE model could be seen on the website
http://www.sustainability.tuc.gr/ (accessed on 4 December 2019).
Figure 1 also shows that each dimension in the SAFE model consists of several indicators, which are considered as the inputs for the CART models of this study. The main relationships between the inputs and outputs as per
Figure 1 are presented in Equations (1)–(11). These equations will be identified from the data through 10-fold cross-validation in CART models.
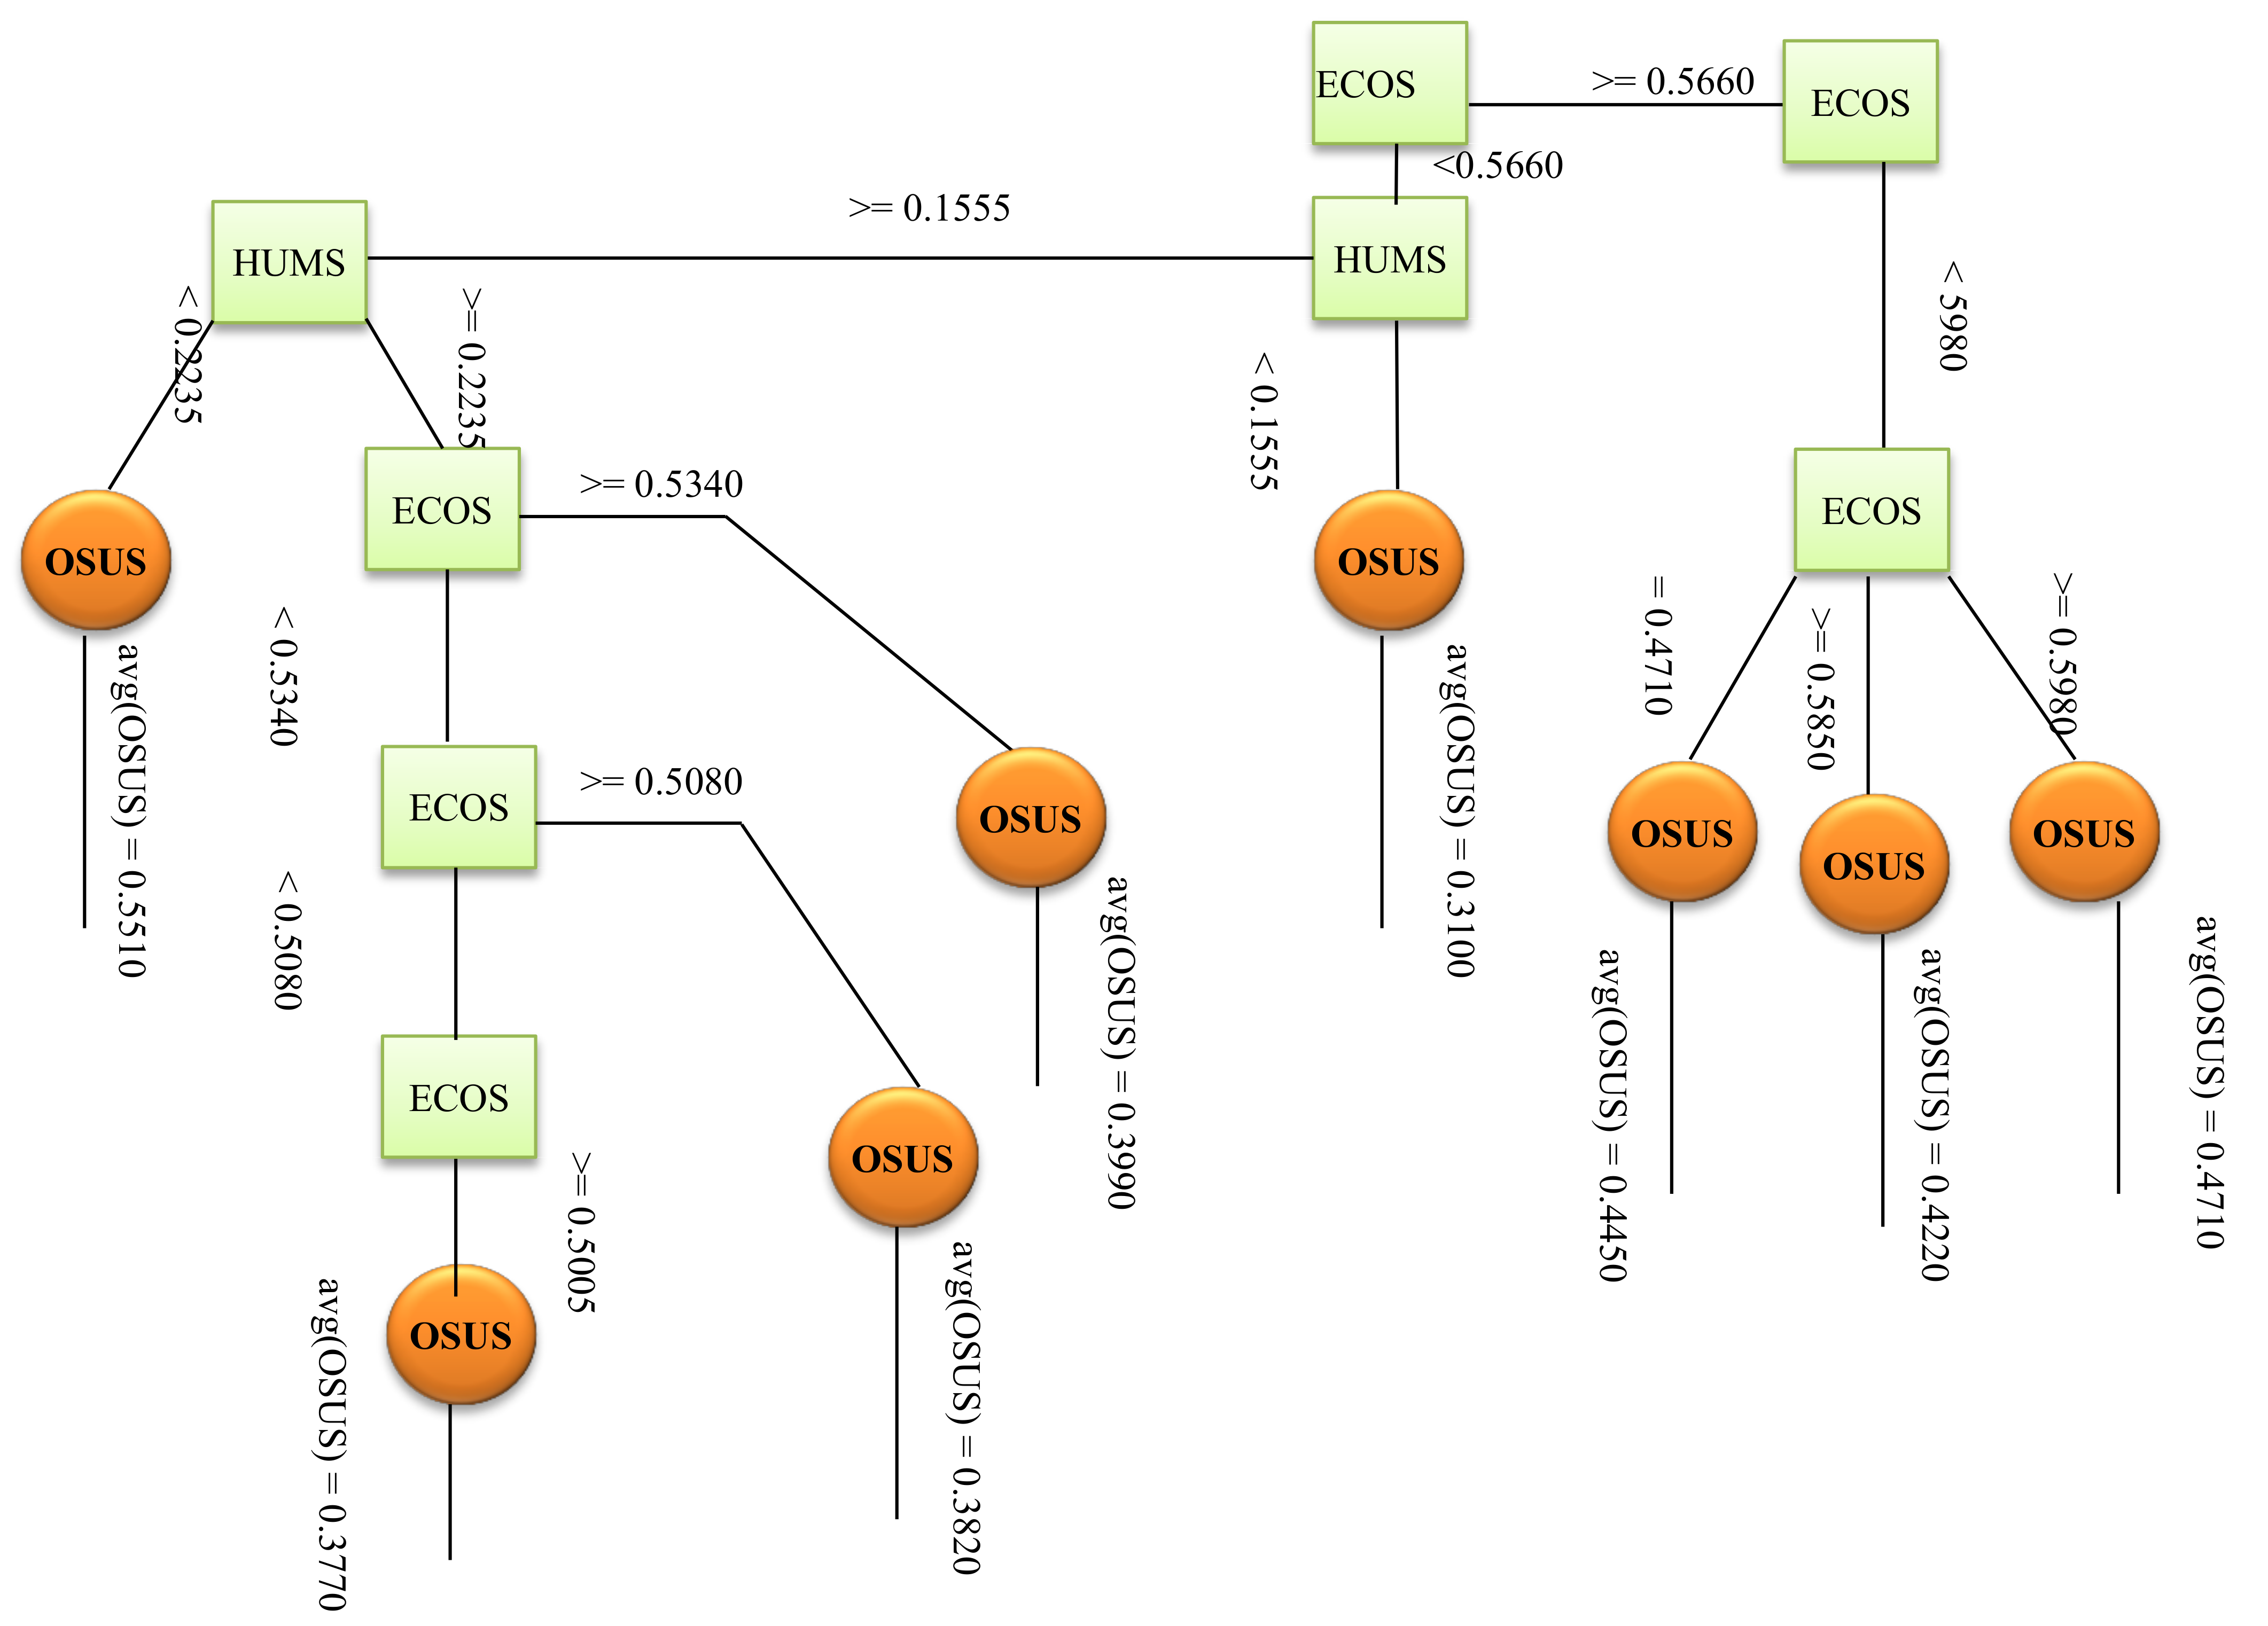
CART was applied to each cluster generated by SOM to determine the relationship between the inputs and outputs of SAFE data. Through this relationship, the overall sustainability performance of a country was assessed. Additionally, the decision trees for sustainability performance were induced from SAFE data. The identification of the rules was done to determine country sustainability performance. Essentially, these decision rules are important as they are used in the proposed system for sustainability ranking. In
Figure 4 and
Table 1 the decision trees discovered from Cluster 1 are visualized. For other clusters, we present the decision trees in
Table A1,
Table A2,
Table A3,
Table A4,
Table A5,
Table A6 and
Table A7 in
Appendix B. It could be seen from the results that CART was useful for an effective generation of the decision rules for performance prediction. To be specific, these rules were automatically developed from the data, which could accurately predict the output based on the input. In addition, SOM was also useful for the effective development of the decision rules in each cluster as similar data regarding country sustainability were presented in each cluster. In respect to the first cluster of countries, namely Laos, India, Cambodia, Papua NG, Benin, Mali, Bangladesh, Niger, Pakistan, Yemen, Sudan, and Mauritania, eight decision rules were discovered from the data. These data were involved in OSUS prediction, which was based on ECOS and HUMS. In respect to the second cluster of countries, namely Gabon, Kenya, Malawi, Zambia, Nepal, Gambia, Rwanda, Congo, Mozambique, Guinea B, Burkina Faso, Côte d’Ivoire, Guinea, Angola, Chad, DR Congo, Burundi, Ethiopia, and Central African Rep., eight decision rules were discovered from the data. Similarly, these data were used for OSUS prediction based on ECOS and HUMS.
In this study, we used the coefficient of determination (
to assess all CART models through a 10-fold cross-validation approach. The
approach is presented in Equation (12).
Based on the equation above, represent the number of observations, actual output, predicted value, actual mean value, predicted mean value, and the number of independent variables, respectively.
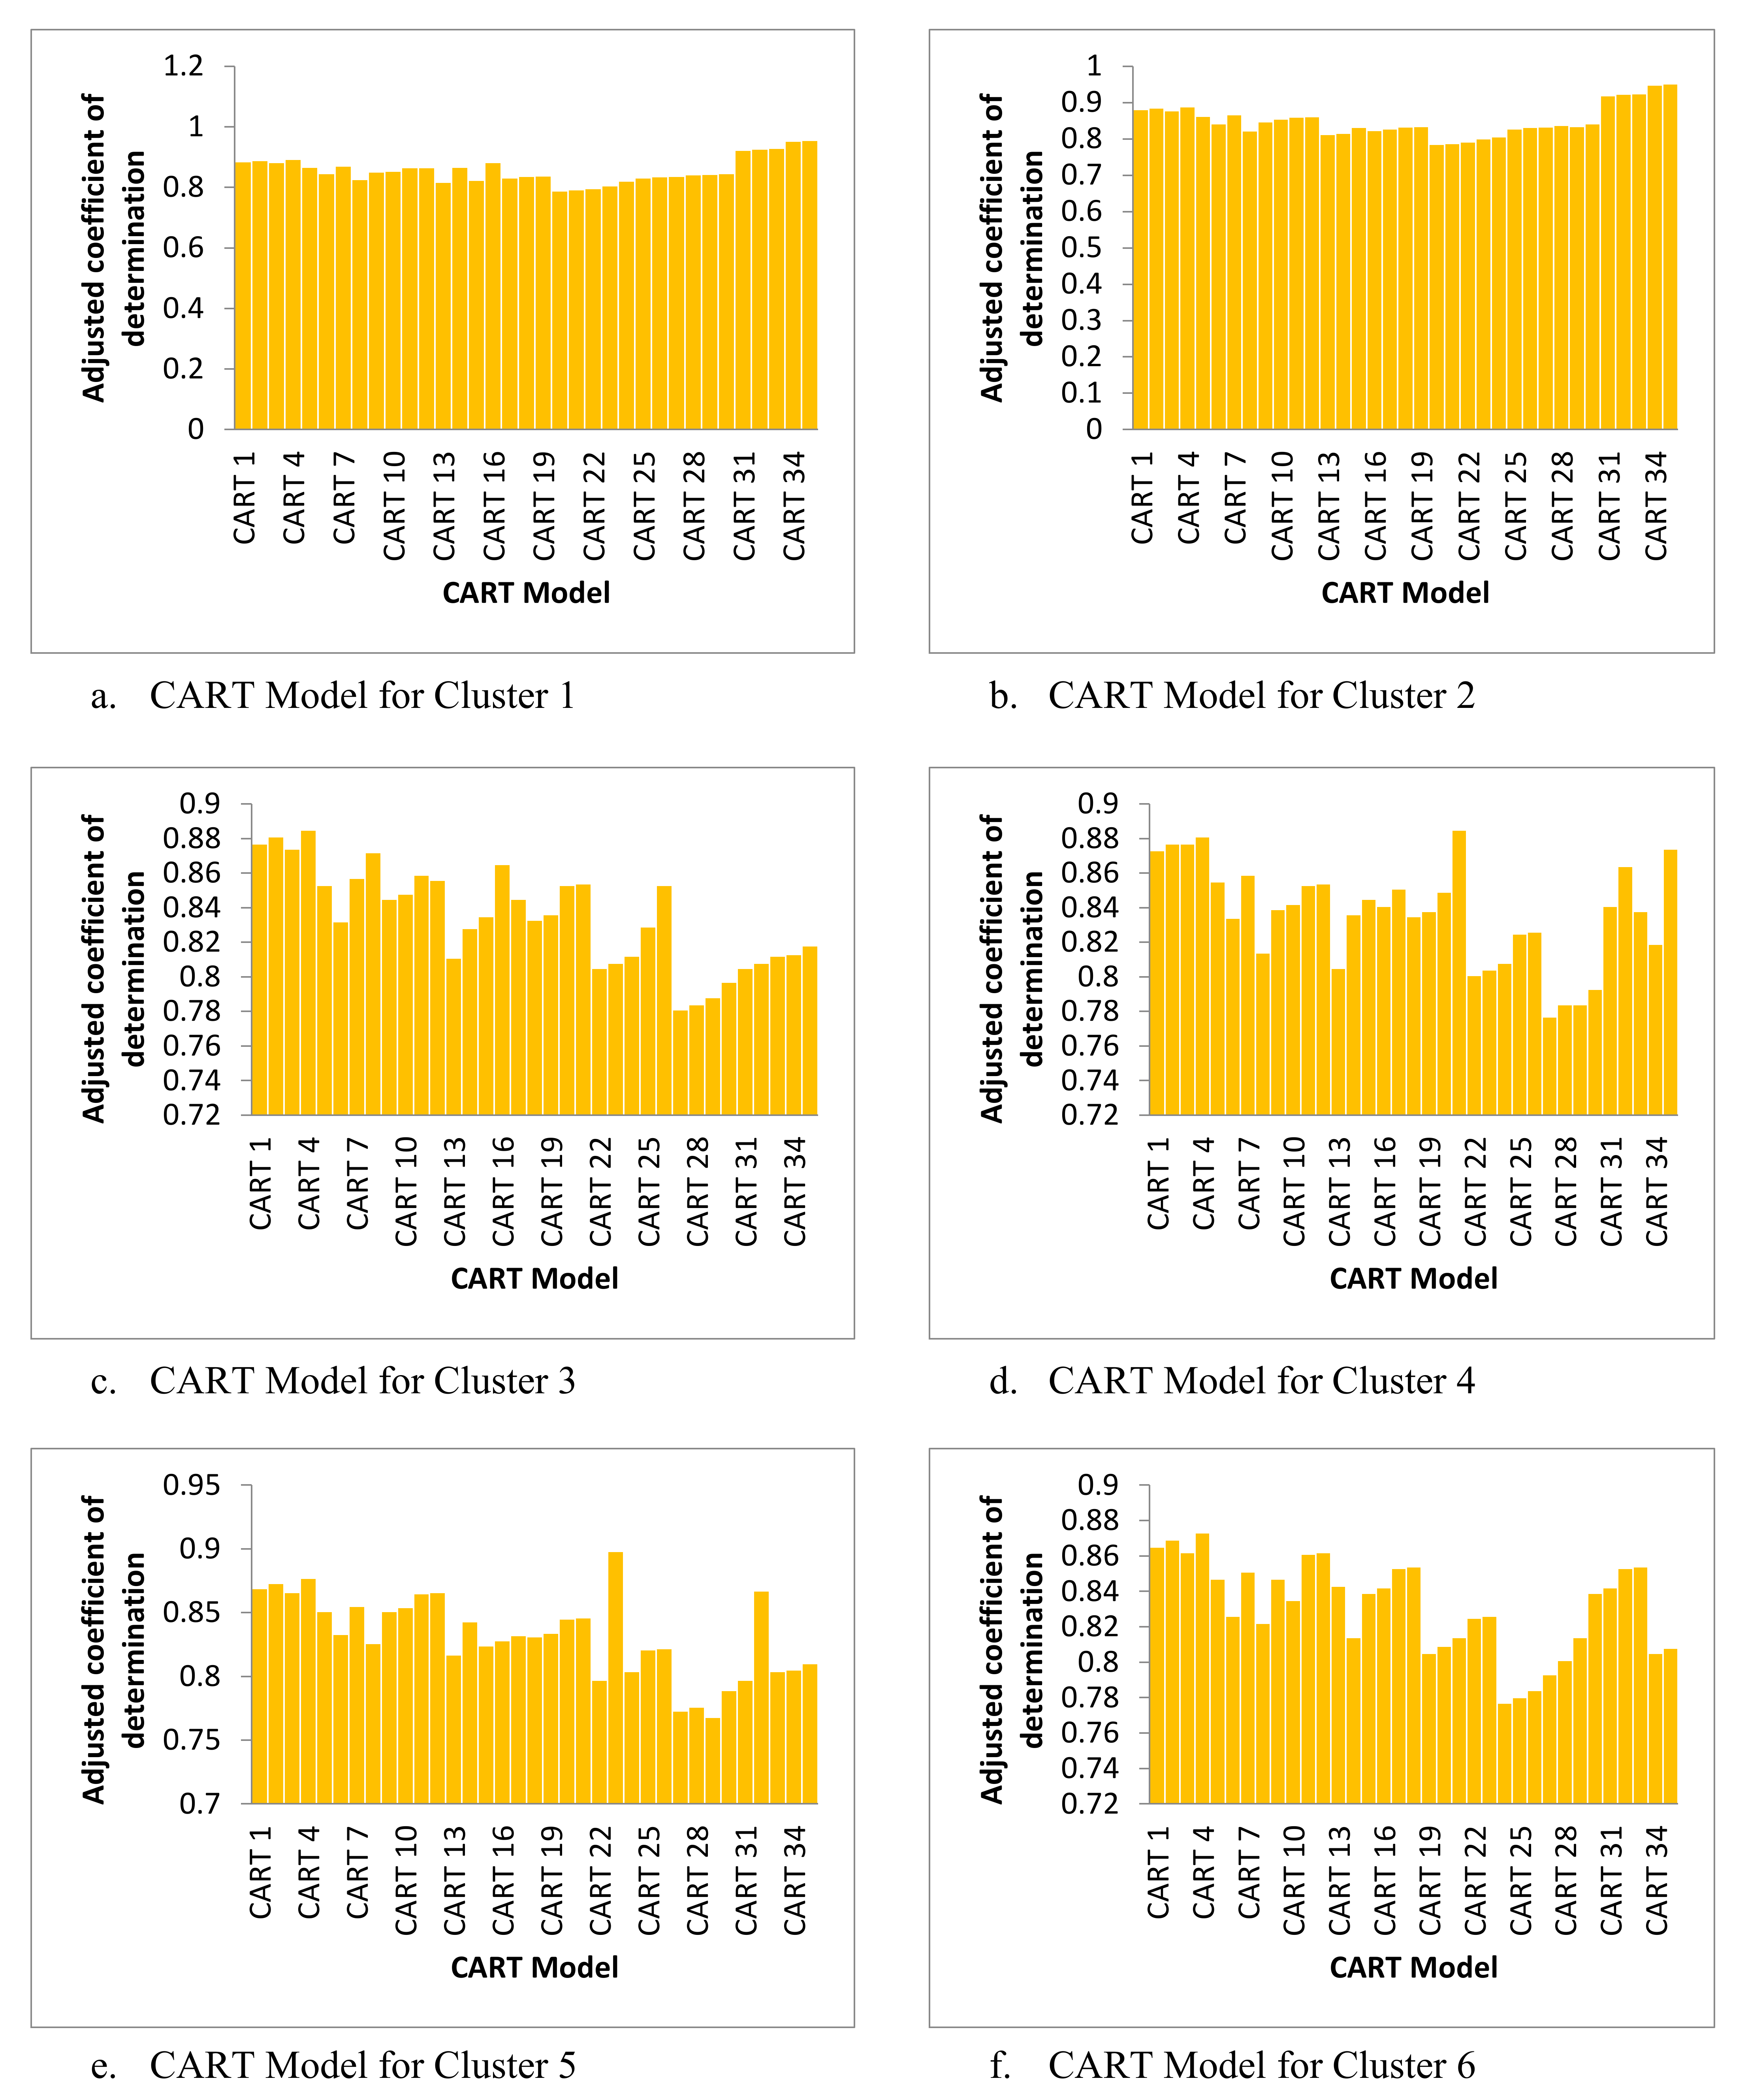
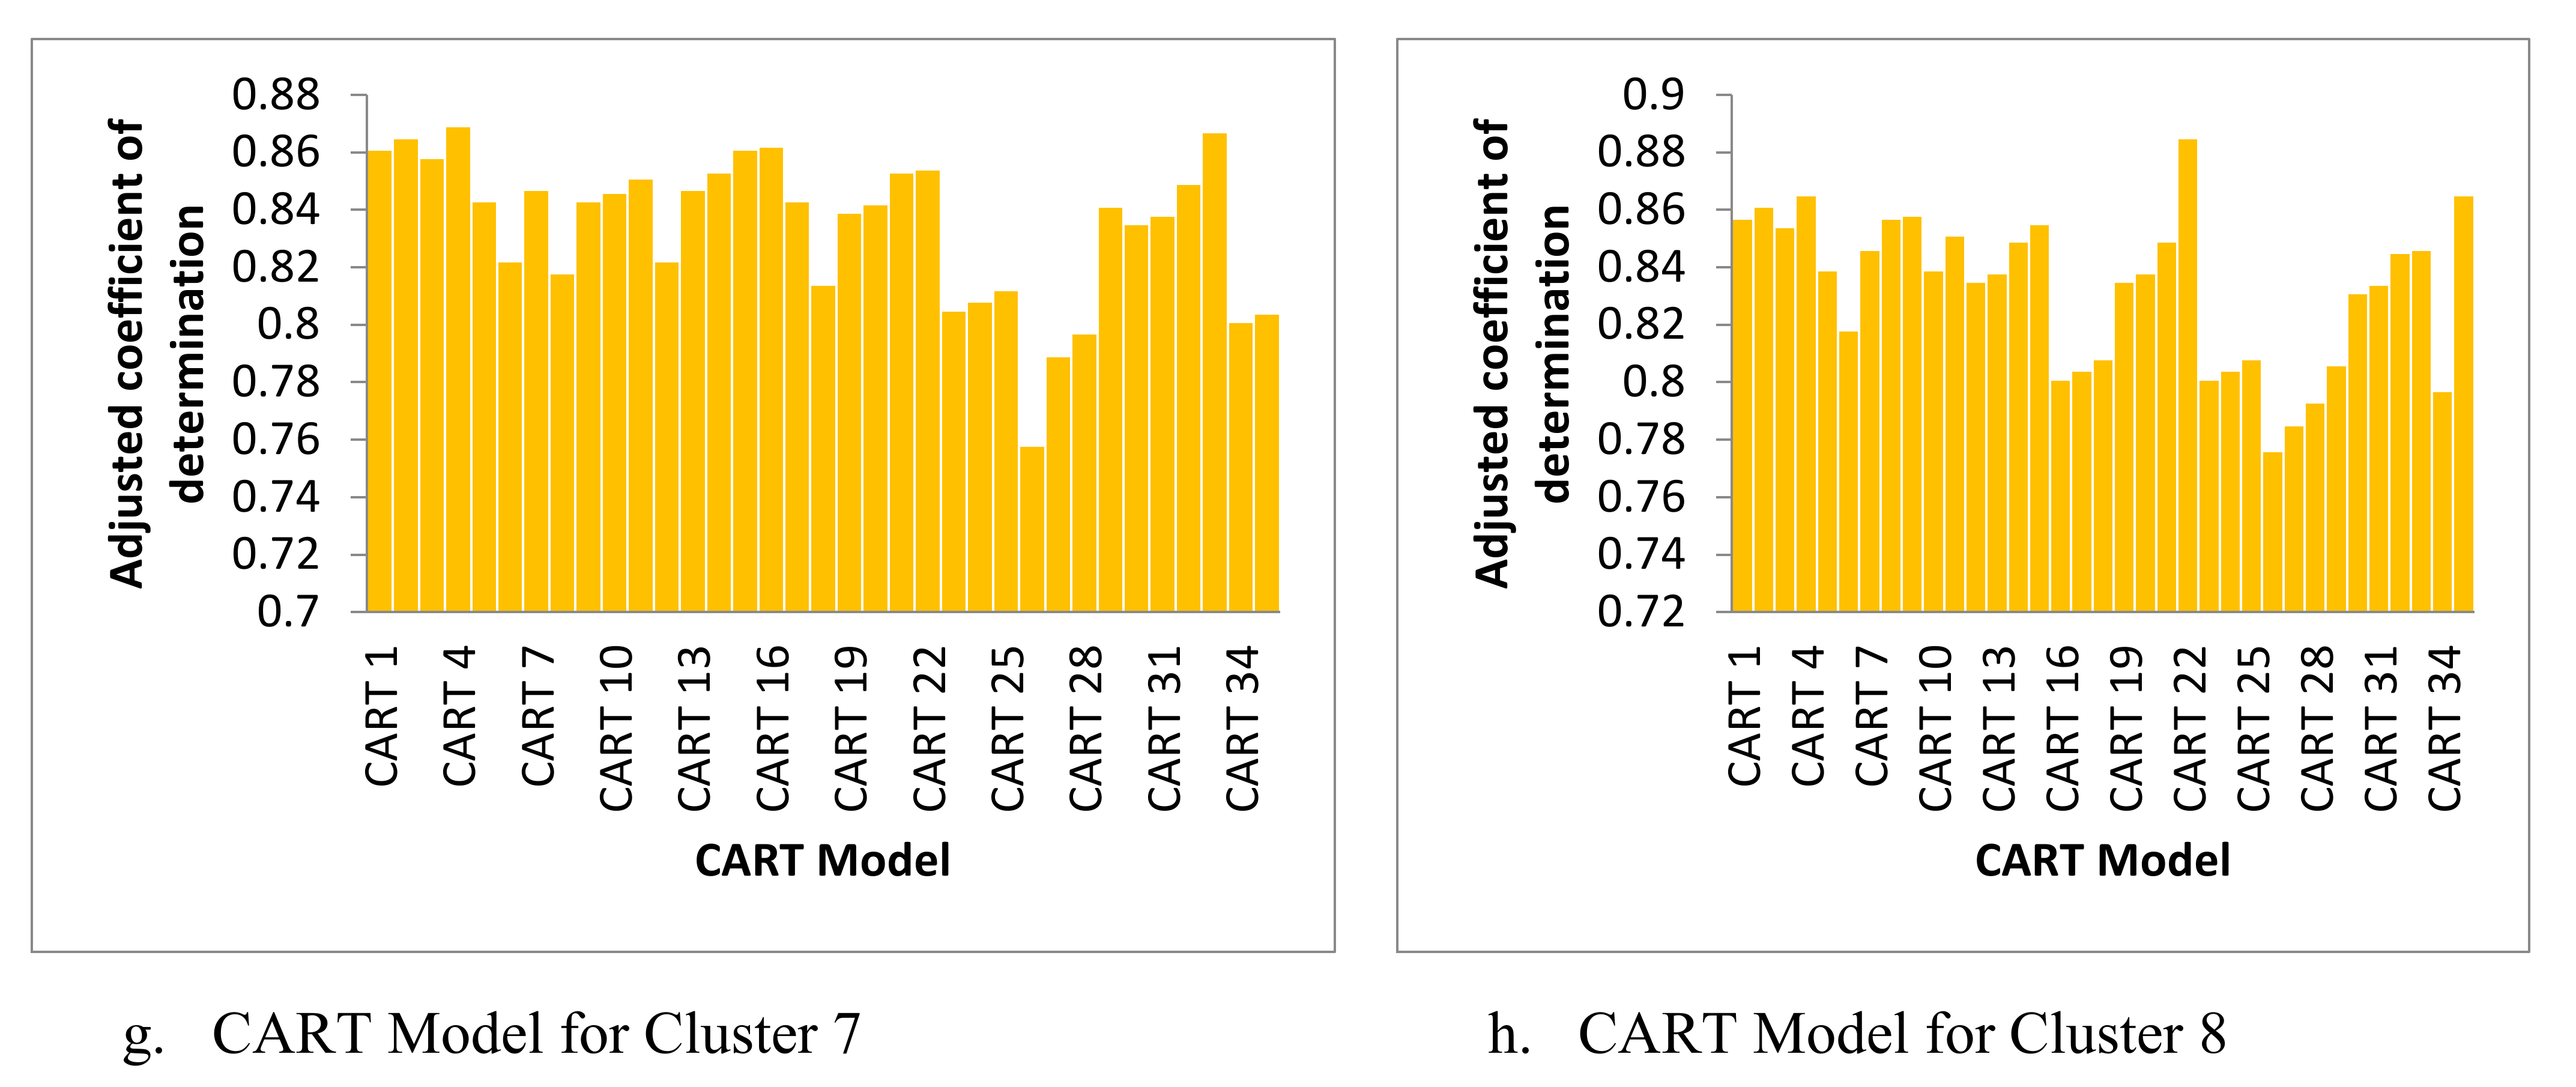
The accuracy of all CART models for the eight clusters of SOM could be seen from
Figure 5a–h. From the results, it is noticeable that the CART’s prediction modules have provided high
values in all clusters. Accordingly, this technique could be useful for effectively modeling the tools used for sustainability performance evaluation.
This research also applied the bagging approach as one of the most popular ensemble methods to obtain final results. This was performed through aggregating and bootstrap resampling methods. Through bagging bootstrapped, replicas of original data in the clusters were derived and with replacement from the training dataset, different training sub-datasets were randomly drawn. Accordingly, through this procedure, different prediction models were generated and applied for the prediction of the entire data from the subsets. Finally, using the aggregation approach [
57], various estimated models were aggregated for final results. In this research, for ensemble learning, a CART model was built through a procedure that is repeated 20 times to get 20 individual forecast models in each cluster. Each of these prediction models was used to predict the output and finally, the linear combination of these predictions was used as the final prediction result. The results for SOM+Ensembles of CART, CART [
32], Adaptive Neuro-Fuzzy Inference System (ANFIS) [
32], Neural Network (NN) [
32], Multiple Linear Regression (MLR) [
32], Fuzzy C-Means + CART [
32], and Fuzzy C-Means + ANFIS [
32] techniques are shown in
Table 2. The results of this study’s analysis revealed that the combination of SOM and CART techniques with the aid of ensemble learning resulted in a more superior performance compared to CART, ANFIS, NN, MLR, Fuzzy C-Means + CART, and Fuzzy C-Means + ANFIS in the measurement of country sustainability performance. As shown in
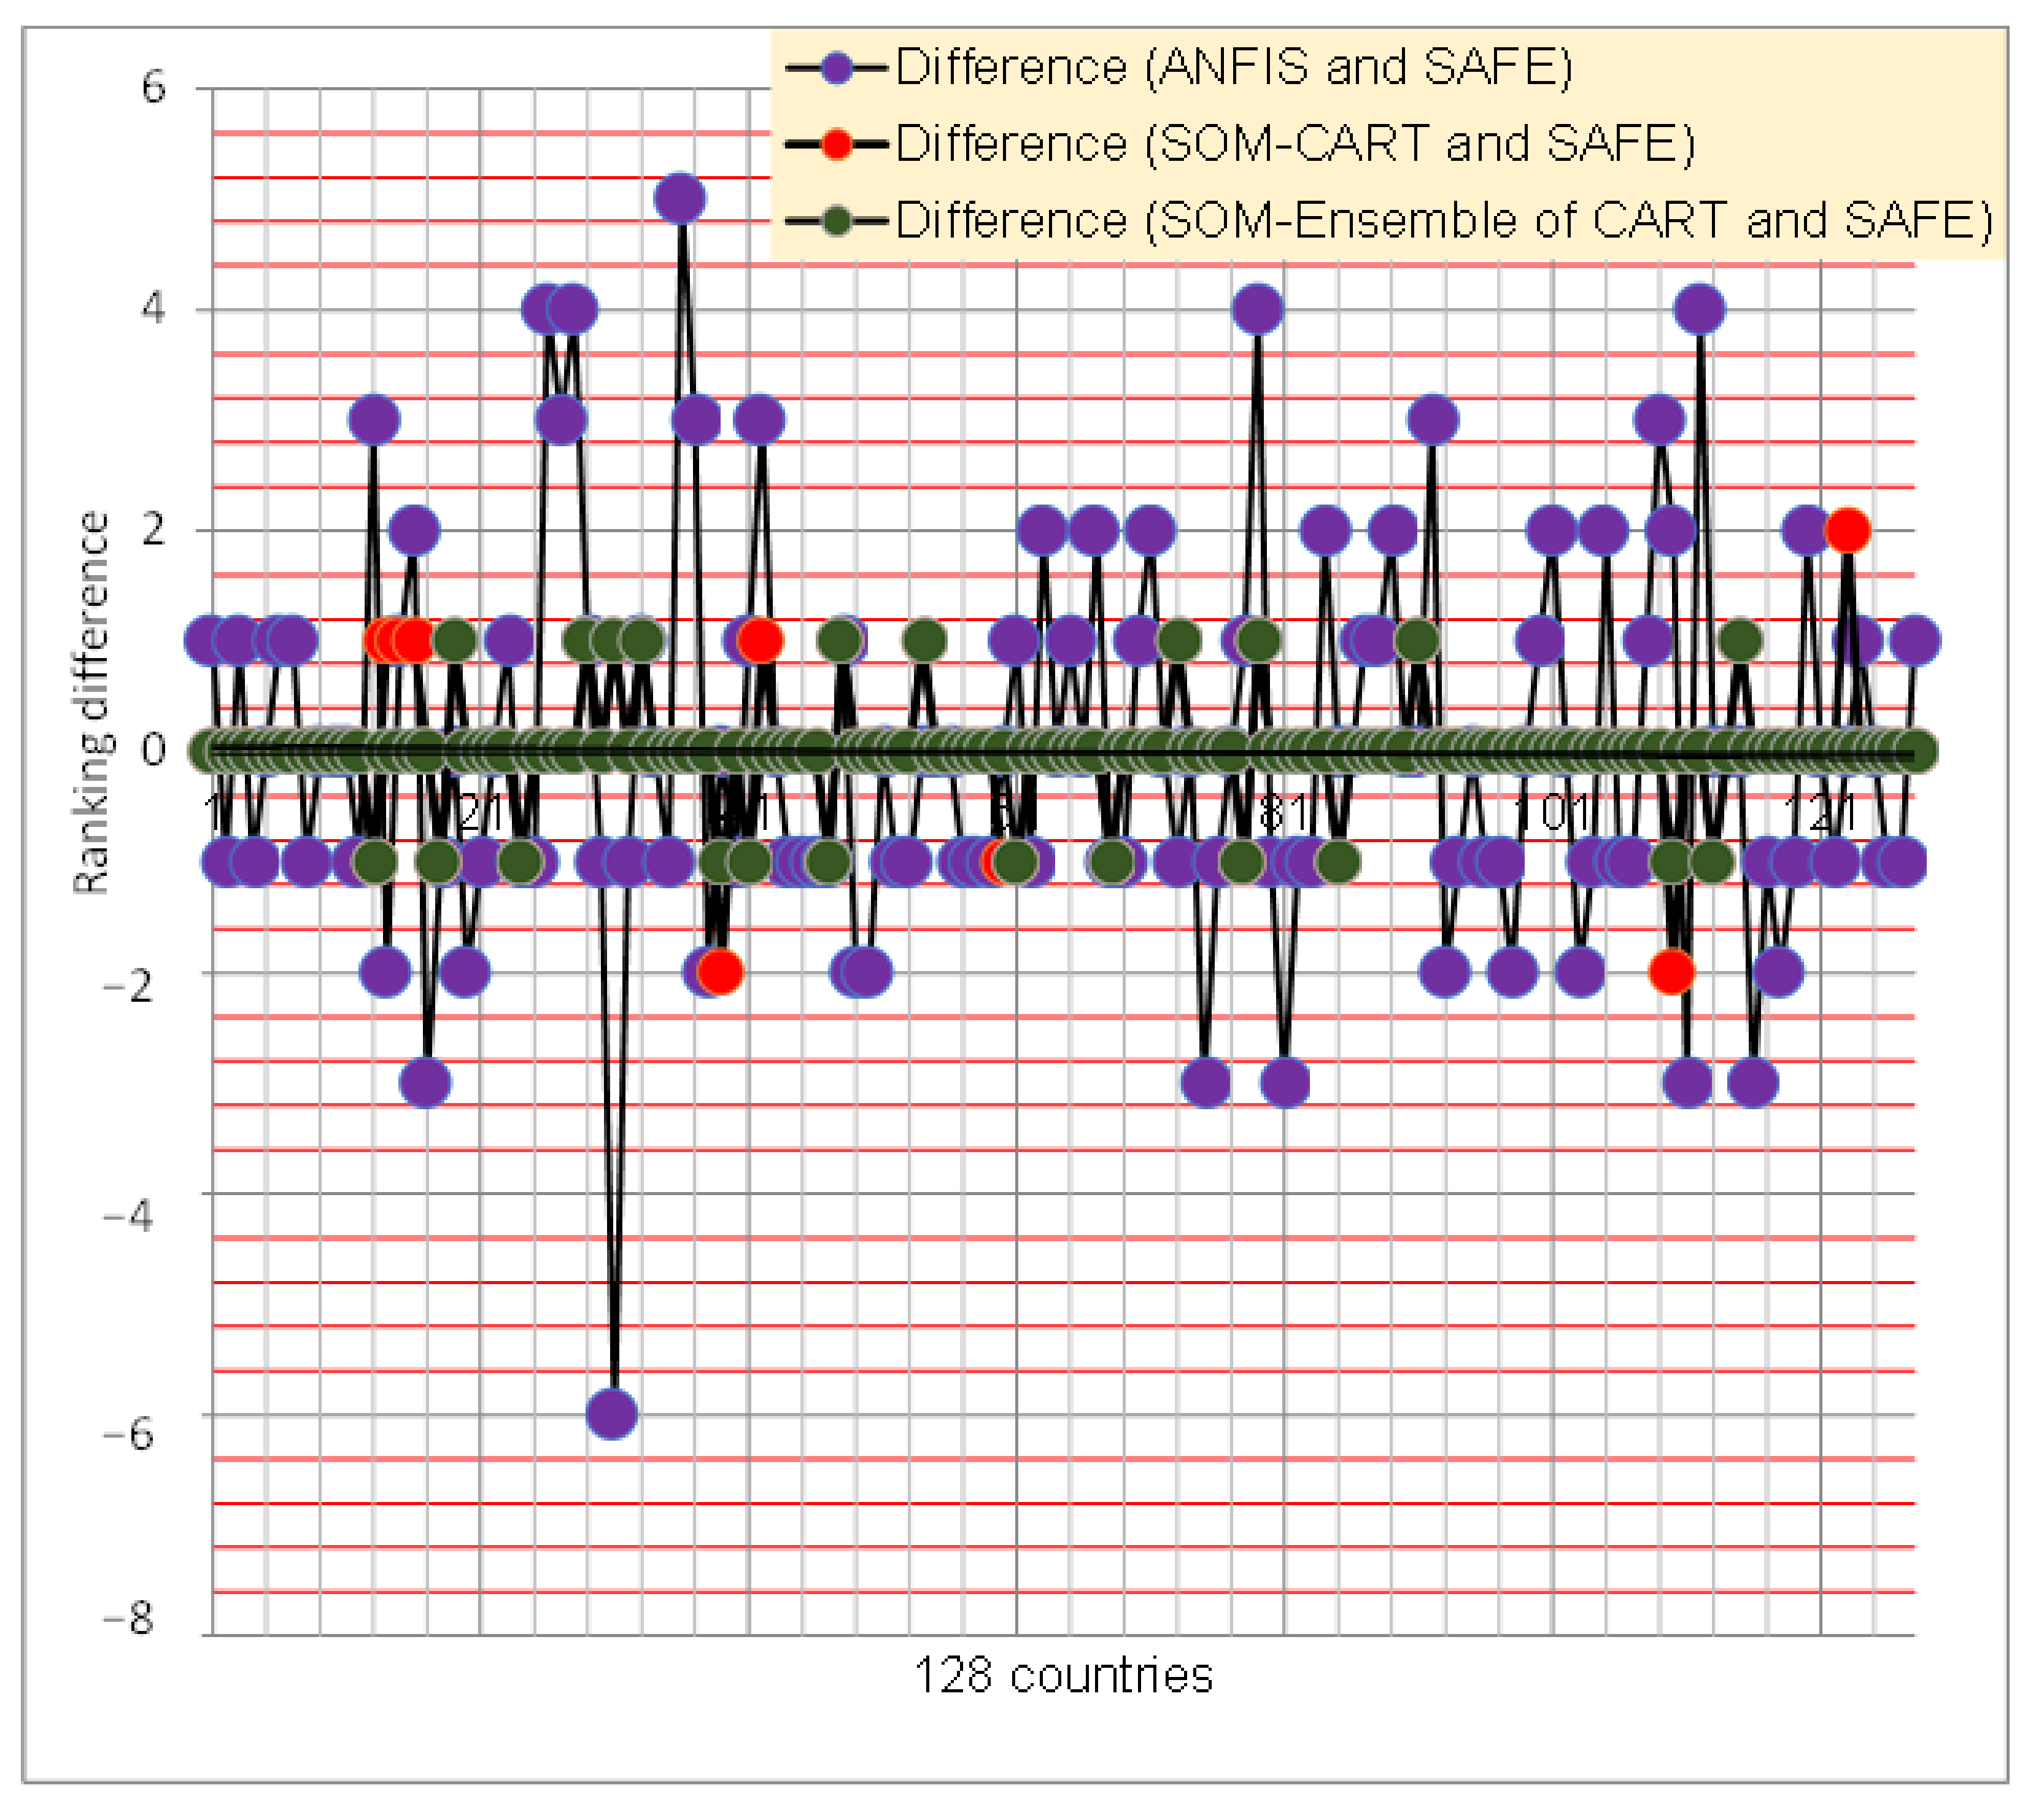
Figure 6, the final results showed that minor differences were present between SAFE and the proposed method for the country sustainability rankings (see
Table A8 in
Appendix B).
5. Discussion and Managerial Implications
In recent years, sustainability assessment and management have become increasingly important. Accordingly, developing integrated and accurate tools to measure sustainability performance has been a challenging task. Several attempts have been made to develop measurement tools based on sustainability indicators to solve specific sustainability issues [
31,
37,
40]. Furthermore, a growing number of approaches for sustainability assessment have been developed to support policy-makers and decision-makers to promote global sustainable development [
58]. Among the approaches, machine learning techniques have been utilized effectively in developing methods to solve complex environmental issues. In line with sustainable development, a new scheme was developed based on the unsupervised (SOM) and supervised (CART) learning techniques with the aid of an ensemble learning approach for the assessment of the sustainability of countries. Country sustainability is considered a complex issue, particularly in the context of sustainable decision-making [
59]. Moreover, an attempt to provide the prediction models for non-linear relationships between the sustainability indicators was also made.
One of the main advantages of the proposed method, which was confirmed in the results, is its ability to handle large datasets in sustainability assessment systems. The SOM method is capable of managing a significant number of tuples for different levels of sustainability assessment. Furthermore, it is a robust clustering technique, which is based on neural network learning used to identify similar groups from the data. In fact, based on the centroids of the clusters, new data could easily be located in a particular group they originate from. Particularly, the outcome of this study presented additional support to previous literature that indicated the effectiveness of using SOM to cluster large datasets in terms of sustainability assessment [
43]. In respect of CART, this technique is capable of effectively identifying the non-linear relationships between the inputs and outputs of the complex models. This technique was applied in this study on the sustainability performance data in each cluster of SOM to effectively determine the relationship between the inputs and outputs. It was found that CART displayed a better accuracy when it was applied to the clustered data. The construction of the prediction models could be improved when the CART was combined with the SOM clustering. In addition, when presenting a new case for sustainability assessment, the method implemented in this study could identify the closest cluster through the cluster centroids and select the corresponding CART model to predict sustainability performance through a set of sustainability indicators.
This study extended the previous studies and provided a new solution for sustainability assessment. As presented in [
31], previous approaches, which were based on the manual technique to discover fuzzy rules and determine the membership functions are time-consuming approaches. Compared to SAFE, the method implemented in this study could automatically determine the relationship between the inputs and outputs, which is effective in identifying the decision-making rules. This study’s proposed method could be complementary to the previous assessment models based on knowledge-based approaches. As the previous studies rely on fuzzy rules for sustainability performance assessment, the fuzzy rules can be extracted through the CART technique. As a result, the time complexity could be improved. Overall, the limitations of the previous methods should be addressed focusing on future studies for the rule induction module.
In this study, the indicators used in the SAFE model were emphasized. This study also took ecological sustainability and societal/human sustainability in the SAFE model into account. However, other indicators could also be included in the proposed assessment system to evaluate the country’s sustainability performance. The indicators highlighted in the literature were economic, environmental, social, resource, fuel, carbon steel, CO2, SO2, NOx, energy costs, investment, efficiency, job, and diversity indicators.
The method used in this study will benefit other assessment methods using the automatic acquisition of the data for large datasets. The indicators of sustainability are not constant in most cases, therefore, the methods which can accept new indicators possess higher efficiency compared to the method with fixed indicators. Accordingly, such methods can be effectively enhanced for real-world applications in sustainability development. This enhancement should be emphasized by the environmentalists, governmental authorities, and policy-makers of sustainability development so that more methods of sustainability performance evaluation could be developed.
6. Conclusions and Future Work
This study aims to develop a new method for measuring the sustainability performance of countries. The method proposed in this study was developed through clustering and prediction machine learning techniques. Furthermore, SOM and CART techniques were used to cluster the sustainability data and predict country sustainability performance. The CART models were also developed for ensemble learning. The SAFE dataset was used for the evaluation of the method. It was shown from this study’s analysis that clustering could improve the readability of the data and improve the CART technique in its prediction of sustainability performance. It was also found that when clustering the data, the CART model could effectively perform the prediction task in each group, which consisted of similar data regarding sustainability performance. Moreover, the ensembles of CART could enhance the prediction accuracy of individual CART models. The results of this study’s analysis were compared with the results of CART, ANFIS, NN, MLR, Fuzzy C-Means + CART, and Fuzzy C-Means + ANFIS techniques. It was revealed that the combination of SOM and CART techniques with the aid of ensemble learning resulted in a more superior performance compared to CART, ANFIS, NN, MLR, Fuzzy C-Means + CART, and Fuzzy C-Means + ANFIS in the measurement of country sustainability performance. The final results showed that minor differences were present between SAFE and the proposed method for the country sustainability rankings.
Several limitations were present in this study. First, two main dimensions of sustainability were taken into account for performance evaluation. Furthermore, the real-world dataset used in this study included a fixed number of indicators in each dimension. Therefore, it is suggested that the proposed method is evaluated on other datasets using different indicators of sustainability instead of the fixed number of indicators. Second, non-incremental CART was used for the assessment of country sustainability performance. The non-incremental CART was not capable of conducting online predictions of country sustainability performance. Specifically, the method developed by the CART technique is not capable of incremental learning of the models from the data. To construct the learning models, it needs to recompute all the training data, presenting a limitation of the proposed method. Essentially, large datasets require real-time prediction, and further updates on the prediction models must be made. This is followed by trained models, which are among the memory requirements. As a solution, the incremental version of CART (Crawford, 1989) may be considered as a more suitable approach to construct the perdition models. Additionally, with minimal computational burden, the combination of incremental CART with the clustering techniques would lead to improved performance of the sustainability assessment system. With all these points highlighted, the proposed method in this study could be further improved through incremental machine learning techniques. It is also recommended that the computation time of the proposed method and the complexity of the tree are investigated in future works. Furthermore, more studies using machine learning and big data decision analysis are needed to perform complex sustainability assessments at the country level. This future work will advance the field, help practitioners and policy makers, while also advancing our understanding where countries should focus efforts to be more sustainable.


 ,
, 


