Article

Demographic Changes in Slovak Roma Communities in the New Millennium

by
Janetta Nestorová Dická
Institute of Geography, Faculty of Science, Pavol Jozef Šafárik University, Jesenná 5, 040 01 Košice, Slovakia
Sustainability 2021, 13(7), 3735; https://doi.org/10.3390/su13073735
Submission received: 6 February 2021 / Revised: 22 March 2021 / Accepted: 24 March 2021 / Published: 26 March 2021
(This article belongs to the Section Health, Well-Being and Sustainability)

Abstract

:
The study identifies the Roma population’s demographic specifics in Slovakia and graphically depicts the current situation and ongoing developments. The research methodology consisted of sociological surveys and data from secondary sources, including “The Statistical Office” and previous research on this issue. Demographic analysis from 1996 to 2018 was performed on the Roma study sample, and population changes were examined separately based on the degree of concentration in Slovak municipalities. The particular emphasis here is placed on those with a Roma population proportion of at least 80%. The new millennium indicates changes in the Roma population’s reproductive behavior, with a decline in birth rate, fertility, and population growth. Moreover, the increased average life expectancy signals an improved mortality rate, especially during childhood. While these changes do not indicate a reduction or stabilization of the growth of the Roma population in Slovakia, population growth is slightly declining due to changes in the reproductive behavior of Roma women, which is a positive indicator of social emancipation. The work provides valuable insight into the main demographic features of behavior and changes in the behavior and population development of the Roma ethnic group in Slovakia.

1. Introduction

The Roma population is an ethnic minority of northern Indian origin living in almost 50 countries due to migratory movements [1]. Roma groups have become the most significant ethnic minority lacking a unified state in the European Union, and The Council of Europe’s (2012) average estimate of the Roma population in its region is close to 11 million [2]. This number includes 2.8 million Roma in Turkey and 1.2 million in the former Soviet Union. A further 1 million Roma live in the Western Balkans, and the remaining 6 million live within European Union territory. Roma people are particularly numerous in Central and Eastern Europe and the western part of the former Soviet Union. Moreover, Süli-Zakar (2012) [3] reports that the number of European Roma has doubled and almost tripled in the four decades since the International Romany Union. They now have more than 7% ethnicity in Bulgaria, Macedonia, Romania, Serbia, Slovakia, and Hungary. Many European population studies, therefore, indicate their specific demographic status. Unfortunately, current information is not concrete and accurate enough for this, and further research is, therefore, essential. Herein, Slovakia is a suitable study area because of its significant percentage of Roma ethnic population.
The growing number of Roma in several European regions, including Slovakia, has promptly increased research in an endeavor to understand this ethnic group’s demographic behavior. Haviarová (2004) [4] further contends that it is essential for this ethnic minority to have accurate demographic knowledge to plan and take successful measures.
Demographic indicators also highlight that the Roma community in Slovakia is represented by a youthful population with a progressive age structure where reproductive norms significantly differ from the Slovak people. The Roma household survey conducted by the European Union Fundamental Rights Agency, United Nations Development Program, and the World Bank indicate that the Roma population has higher birth rates and a smaller proportion of older people in the population [5]. The high number of Roma children reflects the traditional family model and a low level of education. The result is a demographic profile that contrasts strongly with the narrowing general population pyramid. Central and South-Eastern European countries are now facing rapid ageing of the majority population [6], which unfortunately creates a significant challenge for the productive integration of the growing Roma population in mainstream society.
Current research into the Roma population is beset with problems. The significant difficulty is the lack of reliable statistical data on the structure and demographic processes in the Roma community. For example, Knežević (2013) [7] and Šprocha (2014) [8] consider that statistical monitoring of demographic and socio-economic changes in the Roma population based on data census and vital statistics are challenging because Roma tend to hide their ethnic identity, and this conceals the true demographic situation. Süli-Zakar (2012) [3] further explains that the European Roma population constitutes one ethnic group but does not constitute a homogeneous community. Therefore, the various groups have different integration levels, which must be considered in all unifying strategies. Similar observations are made in Slovakia, where demographic changes in the Roma population are closely associated with their level of social integration. The most noticeable demographic deviations have appeared in segregated Roma settlements with the minor integration level [9]. This lifestyle is often comparable to less developed countries.
One of the most significant challenges in demography and population geography is to determine the demographic behavior of ethnic minorities accurately. This especially applies to the Slovak Roma population, and our study, therefore, examines the trends in their demographic processes from the end of the 1990s. This required close monitoring and evaluation of trends that converged and diverged from those of the Slovak population. While monitoring this entire ethnic population group, the review was primarily concentrated on Slovak municipalities with a high Roma concentration and low degree of integration. We ensured that the sample covered the characteristics of the entire target group as closely as possible, and we were able to establish essential data on Roma living in extreme conditions. The surveyed Roma population lags significantly behind the majority of Slovakia in the demographic transition. As Šprocha and Tišliar (2016) [10] point out in connection with the Roma population, it should be noted that this is probably the last relatively large population group in the European environment for several centuries, in which the process of demographic transition has not yet been completed. On the other hand, Šprocha and Bleha (2018) [11] claim that it is debatable whether we can even talk about the beginning of the demographic transition in the case of the Roma in Slovakia. Both populations are divergent in demographic behavior due to different levels of cultural and economic development. The research results may provide some insight into the movement of demographic transition that the Roma do not seem to have yet overcome.

2. A Brief Overview of the Roma Population in Slovakia

The number of Roma in Slovakia has increased tenfold in the last 120 years, while Slovakia’s population has only doubled (Table 1), and the very first estimates of the number of Roma in Slovakia were compiled from an inventory in the reign of Maria Theresa and Joseph II at the end of the 18th century. While Table 1 depicts the recording of this census at approximately 20,000 [12], it was impossible to determine the exact number, e.g., Džambazovič (2001) [13] used the 1893 Hungarian census to record 36,000 Roma in the territory. While more accurate numbers were expected from the 1927–1947 inventories, Jurová (1993) [14] considered those numbers underestimated. Moreover, the registration of nomadic Roma happened to be difficult, and Slovak/Hungarian borders were going through changes from world war redistributions. Despite these before-mentioned anomalies, there is a 35% increase registered in the number of Slovak Roma from 1927 to 1947, while Slovakia recorded only a 3% population increase.
State policy after World War II was oriented to Roma assimilation. While policies included mandatory schooling, access to residential housing, and steady employment [6], Slovakia did not formally recognize the existence of Roma nationality from 1945 to 1990. More reliable data came from those in 1970 and 1980, but this information was evaluated separately [16].
National authorities recorded 160,000 (3.5%) in Slovakia in 1970, and only 10 years later, in 1980, 200,000 Roma (4.1%) were identified. At that time, the Slovak census commissioner endeavored to determine the total Romany population from local records of Roma inhabitants, with emphasis on both who was identified as Romany and who identified as such, and then on the determination of Roma lifestyle, native language, and anthropological features.
The last more reliable records of Roma in Slovakia come from 1989. Here, Jurová (1993) [14] assessed data collected by National Committees for social benefit payment, and this identified 254,000 Roma residing in Slovakia. This was 4.8% of the national population, but this estimation is most likely because the Census Commissioner ruling and national committee records on social benefits remain questionable. Vaňo and Haviarová (2002) [16] then estimated that up to 263,000 (app. 5% of the national population) Roma lived in Slovakia in 1989. However, a comparison of the last 20-year’s Slovak censuses indicates a 60% increase in Romany inhabitants. Finally, Liégeois (1995) [17] published the exaggerated own estimate of 520,000 Romany in Slovakia, and Šuvada and Slavík (2016) [18] claim that this figure is often found quoted by foreign authors.
While the fall of the socialist regime in 1989 provided new opportunities for Slovak Roma, on the other hand, it also created problems. The Declaration of Basic Human Rights and Freedoms, accepted by the Federal Assembly of Czechoslovakia on 9 January 1991, secured Roma’s right to decide about ethnic self-affiliation freely. 1991, 2001, and 2011 post-socialist censuses made it possible to identify one’s nationality by self-determination. Only 76,000 people declared Roma nationality in 1991 (1.4% of the Slovak population), 90,000 in 2001 (1.7%), and 106,000 in 2011 (2%). The number of self-identified ethnic Roma has always been far less than the number estimated by experts—official data indicates that Roma self-identification specifies only approximately 25% of Slovak Roma.
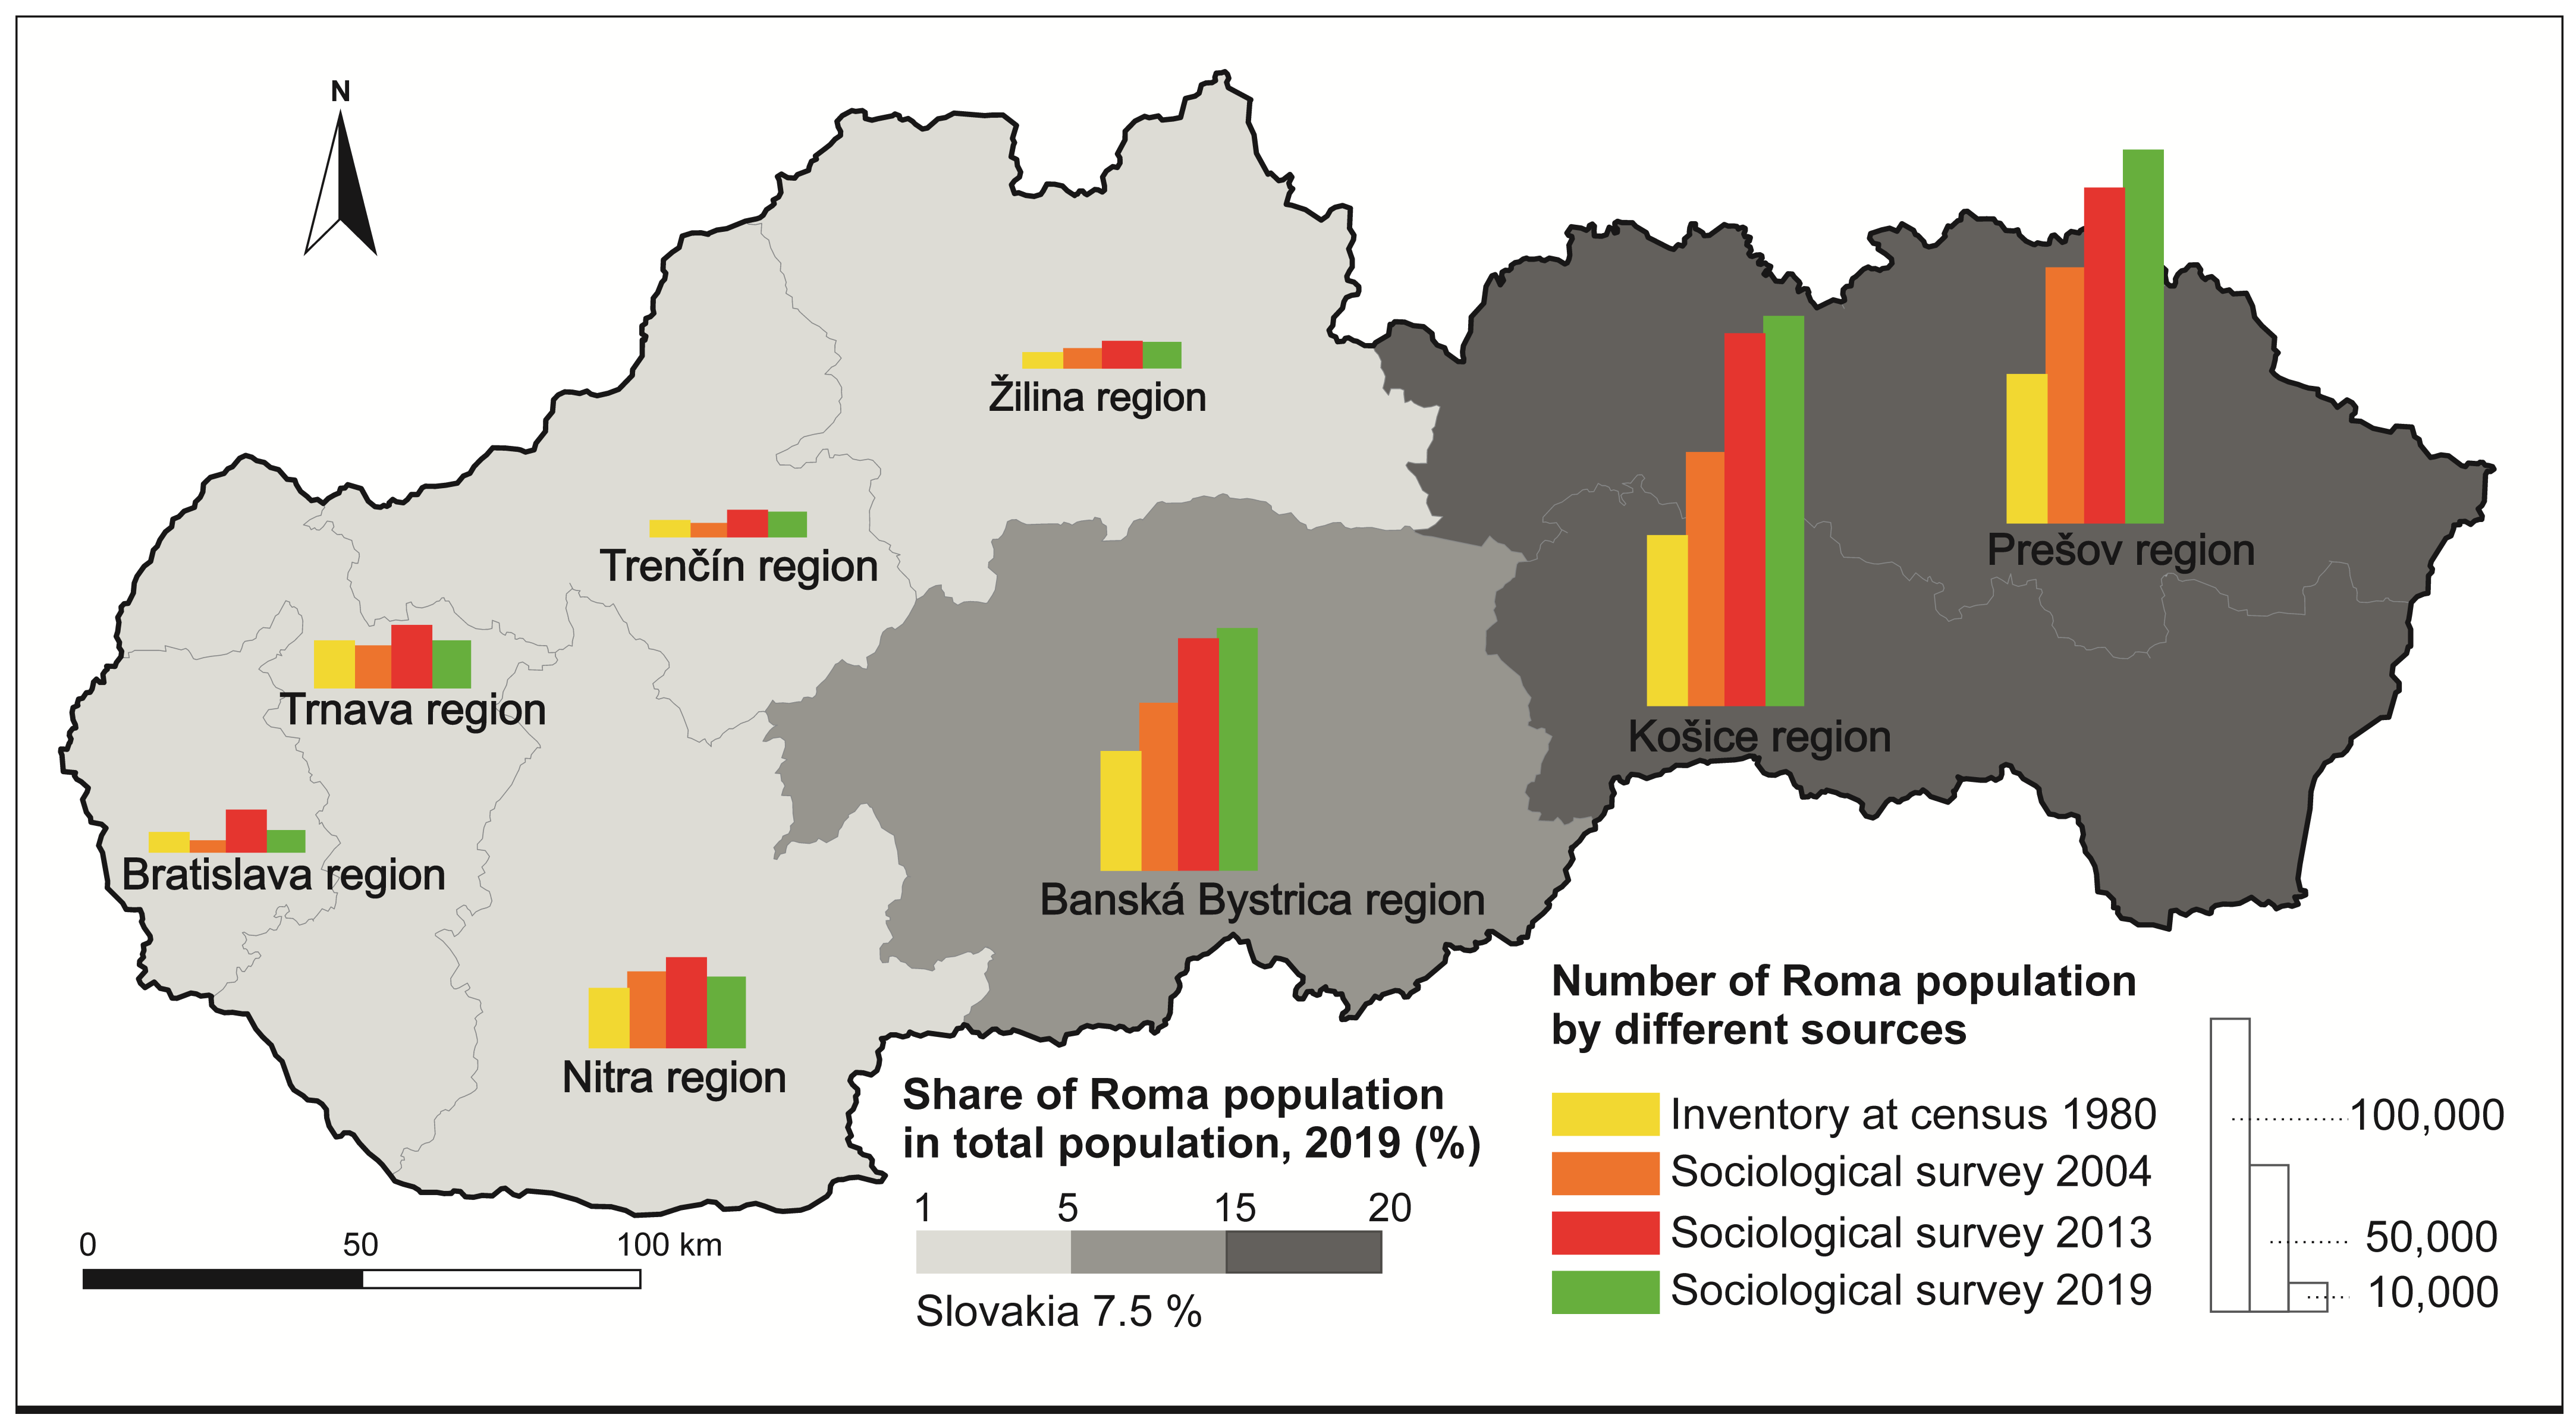
The irrelevance of data on the number of Roma from post-socialist censuses is corrected by qualified estimates from sociological surveys published in the Atlas of Roma Communities. These are quoted for 2013 by Mušinka et al. (2014) [19] and for 2004 plus 2019 by The Government Plenipotentiary for Roma Communities and Institute for Labor and Family Research [20,21]. Social surveys have shown a significant concentration of the Roma population within Eastern Slovakia (Figure 1).
However, even those data do not capture all Roma in Slovakia. Kriglerová and Rybová’s (2004) [22] estimation from these sources places the number of Roma at 320,000 (6%), and Šuvada (2015) [23] estimates 450,000 (8.3%). The 2019 Ravasz [24] Plenipotentiary for Roma Communities most recently specified the Roma population in Slovakia at 440,000 people. The before-mentioned trend in Roma population growth in Slovakia denotes both their absolute number and proportion of the total population; Šprocha (2014) [8] forecasts a continuing tendency of Roma number increase. Although the middle variant expectation is approximately 590,000 people by 2030 (10.6%), the author does not assume that the Roma population in Slovakia will currently exceed 500,000. The rate of the Roma population in the population of Slovakia has an impact on the economic outcomes of the country. The constant increase in the share of Roma in the country’s population is equal to the increase in the population with low human capital and economic decline through reduced human capital accumulation and reduced growth of per-capita output, notes Azarnert (2010, 2018) [25,26].
Finally, the 2019 sociological survey suggests that prognostic scenarios for Roma population development will not be rapidly fulfilled. Moreover, Ravasz (2019) [24] recently reported that the Roma population growth in Slovakia is gradually declining as a result of improved living conditions. The author explains, “One example is access to drinking water: in the 100 largest communities in Slovakia, 61% of the population has a water supply system. In 2013, it was 48%, and in 2004 only about 36%. We also see a significant shift in other areas”.

3. Data Source and Research Methodology

Investigation of the Roma population’s demographic behavior is challenging because available statistical data on the population’s exact size contain significant errors [27], and data from official statistics do not reflect the proper demographic status of the Roma population. Besides, the demographic processes of the Roma population in Slovakia can be investigated only indirectly [28,29], and therefore we employed a nonstandard approach with a particular survey of statistical data, which retains the character of sample surveys. Podolák (2000) [30] further reports that research into Slovak Roma reproduction processes is based either on censuses or on various specific sociological and field surveys that are incapable of capturing the entire Roma population. Moreover, the official statistical records fail to provide separate data on the Roma population. Although the Slovak Statistical Office has been recording natural and migratory Roma population movements since 1993, these data are also incomplete through non-inclusion of the entire Roma population (ethnic hiding). While current population censuses capture only a portion of the Roma population, demographic analyses overcome these problems by collecting specific data through sample surveys. Based on the knowledge of small statistical files, conclusions are then formulated with a broader general validity.
Despite the problem of data irrelevance, many authors in Slovakia base their evaluation on data from the Slovak Republic Statistical Office [11,28,30,31,32,33,34,35,36]. In contrast, other authors employ data obtained from field observations and local government estimates [15,37,38,39,40].
Several scientific approaches are also used to define the Roma population and differentiate it from the remaining population. Kertesi and Kezdi (1998) [41] summarize four distinguishing methods. These methods are based on 1. Groups of people speaking a Roma language, 2. Maintenance of relevant ethnic identity, 3. Categorization by the researcher, and 4. Assessment of the individual and household environment. Although the first two separation methods can be based on self-identification, many Romany do not identify as Roma. This is also confirmed by national census results. The research interviewer can direct the latter categorization procedures by enquiring if the individual disapproves of inclusion as Roma and then look for further verification from the rest of the population. However, different distinguishing methods produce different results, and some researchers, therefore, combine census and survey data [8,28,42,43].
There are valuable studies on demographic changes in Roma minorities in Central and South-Eastern Europe. Research examining the Roma population based on data from three different sources has provided excellent theoretical and methodological results. For example, many studies integrate a micro-demographic survey of local resources [27,38,44,45,46,47,48,49,50,51]. Other studies employ national or regional sociological surveys where respondents self-identify or are identified as Roma by a majority of inhabitants [15,37,43,52,53,54,55,56,57,58,59,60]. Finally, others use census information which contains ethnic data [7,8,27,28,29,61,62,63].
The demographic status of the Roma population depends on the degree of segregation, socio-economic integration, and the intensity of Romany “ethnic transfer” [7] into an ethnic population entity. Here, the authors have identified differences in reproductive and demographic behavior in Romany groups with different degrees of segregation in various settlements [3,7,8,27,39,50,53,60,64]. Besides, the 2019 Atlas of Roma Communities [21] records that only 18% of the total 405,000 Roma live integrated with the majority population, while up to 82% of the Roma population are concentrated within a municipality, on its edges or entirely outside it (Table 2).
The methodology of our ethnic research commenced with databases compiled from sociological surveys, integrated data from the Statistical Office, and recorded research results. Particular emphasis was placed on municipalities where the proportion of the Roma population is above 80% in the data from the sociological survey conducted in 2019 (Figure 2). Demographic characteristics related to the Roma population living in settlements with the highest degree of segregation and separation (Table 2), geographically and socially separated from the rest of the majority, would be monitored in such an allocated population.
Slovak analysis was used as the proxy for the entire set of segregated settlements, and we investigated the demographic behavior of this sample from 1996 to 2018. Although this risks indicator’s credibility, especially in the initial observation stages, the risk is somewhat alleviated by monitoring the settlements individually and by categorizing the concentration intensity. Municipalities had exceedingly above average fertility and birth rates at the commencement of the survey, which indicates a high Roma population at that time. Changes were examined separately in the categories for 80%, 90%, and 100% Roma concentrations in relevant municipalities dispersed throughout the three NUTS 3 regions and Figure 2 highlights that these are situated in the 16 Slovak Eastern and Southern districts of Košický, Prešovský, and Banská Bystrica regions. The analysis is based on data from the Slovak Republic Statistical Office obtained from statistical reports of natural population movements and numerical demographic balances from 1996 to 2018.
The data and processes presented in this manner provide a slightly reduced informative value because they are given only for individuals living in the Slovak municipalities selected for Roma concentration intensity. However, demographic characteristics such as age, ethnicity, education, and social status confirm that this is a relatively homogeneous population. Besides, the selected sample’s size is representative and allows generalizations for this highly segregated Roma population. Finally, this study identifies the demographic specifics of the Slovak Roma population over the last two decades and compares them with the Slovak population, not including the studied Roma population.
The claims were verified by examining the relationships between demographic parameters and the degree of Roma concentration in the municipalities of Slovakia (Prešov, Košice, and Banská Bystrica regions) through correlation analysis. The verification was at the beginning and the end of the examined period with the degree of concentration of the Roma population in the municipalities according to the last sociological survey in 2019. This was followed by a one-way analysis of variance (ANOVA), which identifies statistically significant differences or similarities in clusters of municipalities according to the degree of concentration of the Roma population on selected demographic indicators.
Correlation analysis showed statistically significant connections between the rates of Roma concentration in municipalities and demographic characteristics (Table 3). Minor differences are in the development of correlation coefficients, which can be explained by the effect of the demographic situation in Slovakia when the difference between the average age of the Roma population and the population of Slovakia was not significant at the beginning of the observed period when the population of Slovakia was also relatively younger than it is today, especially the population of eastern Slovakia. For ANOVA tests, clusters were created for municipalities according to the degree of concentration of the Roma population. As follows: cluster 10 contains municipalities with 10–19.9% of the Roma population, cluster 20 contains municipalities with 20–29.9%, etc., until finally for the first Anova test cluster 90 contains municipalities with 90–100% (Table 4), and for the second Anova test, the municipalities with 100% Roma population were separated from this last cluster 90 and cluster 100 was created (see Table 5). As a result, the first ANOVA test was applied to all clusters 10 to 90 and the second only to the clusters used in our analysis, i.e., clusters 80, 90, and 100. The results indicate that while in the first case the differences between clusters are significant and statistically significant at the level (significance level) p < 0.001 (Table 4), in the second case, the differences were small and statistically insignificant at p < 0.001 (Table 5), which means that the demographic characteristics in the given clusters were similar with low variance. Verification has shown that the survey of the Roma population in municipalities with a concentration above 80% is statistically reliable.

4. Research Results and Discussion

4.1. Population Growth

Slovakia is a post-communist state in Central and Eastern Europe that has experienced significant demographic changes in recent decades. Although this has resulted in low overall population growth, the Roma population has proved an exception. Table 1 records that this population has doubled between 1980–2019, and demographic indicators suggest that their number will continue to increase. Besides, the comparison shows that the proportion of Roma in the total population of Slovakia rose from 4.1% to over 7.5% between the special census in 1980 and the last national sociological survey in 2019, while the Slovak population increased by only 9%. Similarly, the surveyed group of Slovak municipalities with more than 80% concentration of Roma people recorded a significant population increase. The research of Šlezák (2013) [65] and Šlezak and Belić (2019) [66] in the Croatian Region Međimurje also showed similar findings, which most significantly change the ethnic composition of the region.
Changes in population growth over the last 22 years indicate an almost doubling of the surveyed population (Table 6, Figure 3), while the Slovak population has grown by only less than 1%. Despite the continuous increase in the Roma population, we can observe a decrease in the dynamics of population changes (Figure 4). The ratio of the change in the population in the first half of the period under review represented an average growth of 3.1% per year, and in the second half of the period, it recorded only 2.4% per year. Population growth has declined, although not significantly.
A more substantial decrease in population growth rate from the 1996–2007 subperiod to the 2007–2018 subperiod is observed in two categories with 100% and 80% Roma population. This is most visible in two municipalities with 100% of the Roma population: a decrease from 5.6% per year to 3.9% per year. In other categories, the rate of population growth was low: 3.5% compared to 3.3% in 90% of Roma municipalities and 3.1% compared to 2.3% in 80% of municipalities. Finally, although we do not see an increase in the rate of population growth, the decrease in population growth was mainly due to municipalities with a 100% Roma population. The number of such municipalities is much smaller (2) than the number of municipalities in other categories.
Šprocha (2014) [8] provided projections calculated for the number and ratio of the Roma population by 2030, where approximately 10% of the total 5,500,000 Slovak citizens will be ethnic Roma. These projections are expected for the gradual decline in the growth rate of Roma recorded in recent surveys, as well as for the low mortality of Roma, which is also pointed out by Šlezák (2010) [65] or Šlezák and Belić (2019) [66]. And as Ravasz (2019) [24] argues, the improvement of living conditions in many Roma municipalities contributes to the slowdown of population growth or, more precisely, reduces reproduction. With the evidence of the improved quality of life and with a record decline in the rate of population growth of Roma, lower population growth can be expected in the future compared to estimates from the beginning of the new millennium. Zamfir (2013) [67] notes that all populations are engaged in the process of social change and reconstruction of the transition from traditional to modern cultural patterns imposed by a dynamic society undergoing fast modernization. This also applies to the Roma population in Slovakia.

4.2. Natality and Fertility

Roma population growth is influenced by specific reproductive behavior, which reflects their cultural and economic development. While the birth rate in Slovakia has not changed significantly over the last 22 years and has remained at 10‰ for a long time, the current Roma birth rate is almost three times higher (Table 7, Figure 5). At the end of the last century, the number of live births in Roma equalized to 32 children per 1000 inhabitants of the surveyed population born each year. The current annual average birth rate is now approximately 26‰. Slezak and Belić (2019) [66] recorded up to four times higher birth rates and stabilization in the current development of the Roma population in Croatia.
The majority of Roma communities recorded decreased birth rates in all examined categories, and this was again the most prevalent in municipalities with a 100% Roma population (Figure 5). Šprocha’s (2015) [68] survey of the Lunik IX municipality in the Eastern Slovak Kosice city area recorded similar findings, and these were further supported by Kemény (2004) [52] in Hungary and Gamella (2018) [51] in Spain. The decrease was also recorded when recalculating live births to the female part of the Roma population. Figure 6 depicts an annual reduction of up to 12 live births per 1000 women, despite an increasing number of Roma women. This decrease was recorded in all categories and again most pronounced in the 100% Roma population municipalities which registered an annual reduction of almost 40 live births annually per 1000 women. However, the frequency of Roma live births in the population is growing due to the expansion in Roma society. Population growth continues despite declining fertility rates, as so far, the level is sufficient to assure the renewal of the population due to a favorable young population structure that is conducive to population growth. The favorable age distribution is the product of past fertility, perhaps even mortality. Fertility rates are still above the replacement level for the Roma population, which explains the continuing population growth of the Roma population.
According to Kalibová (1991) [69], the total fertility rate decreases after 1970, but the values are still extremely high compared to the majority population. The comparison can be approximated through the gross rate of reproduction, which was around 3.0 in the early 1970s and since the end of the 1980s the values are approximately 2.0. Podolák (2000) [30] states in his study that the total fertility rate at the beginning of the 1990s was 3.65 for the Roma population. While the 1970s and 1980s socialist-era surveys registered Roma fertility decline, there was a renewed increase during Slovak’s 1990s post-socialist times [70]. Potančoková et al. (2008) [62] added that this change in fertility mainly affected segregated Roma’s with high unemployment, social exclusion, poverty and squalor, and dependency on state social welfare. However, this increasing trend has now reversed for Roma women in segregated settlements. Šprocha (2007) [71] reported that changes in the number of children for Roma women were related to age generation and the degree of Roma community integration. The explanation of the increase in fertility in the immediate post-socialist period is related, on the one hand, to the loss of certainty of many Roma, such as employment or financial income. Social benefits have primarily replaced this income and were more generous at the beginning of the transition period. Later restrictions on subsidy social policy could have caused a smaller reduction in fertility in the Roma population.
Fertility dropped over the period under review but remains high. The average number of live births per reproductive woman decreased by about one child per woman (Table 7). The most significant decrease occurred again in municipalities with a 100% Roma population (Table 8, Figure 7). Also, it is currently estimated that the total fertility rate is about three children, depending on ethnic concentration and degree of segregation. While in the Slovak population, it is only 1.5 children, which does not even reach the replacement of the population. The situation in Slovak Roma communities is quite complex and diverse.
Nowadays, women in Slovakia give birth to their children between the age of 29–30 and not between the age of 25–26, as was typical 22 years ago. The mean age at childbirth of Roma women, however, has remained at 24 years, and there has been no noticeable change over the past few decades (Table 9). The research results point to a high and early level of reproduction of the investigated Roma population in comparison with the Slovak population. There is, however, different fertility noted in Roma motherhood with a visible change in child-bearing intensity rather than timing. Their most fertile age interval of 20–24 years remains. For the four age groups of Roma females, we observe an increase in the number of live births per 1000 women from the 2004–2007 subperiod to the 2008–2011 subperiod and then a sudden drop in the 2012–2015 subperiod due to changes in the registration of the number of live births by place of birth. Even, according to Janky (2006) [53], who examined the social position and fertility of Roma women, the mother’s age at birth tends to decrease if job opportunities are severely limited, or more precisely as one of the consequences of the narrowing sphere of labor market opportunities following the regime change. This is compounded by Pukačová and Mládek (2014) [72] and Šprocha’s (2014) [8] consideration that the high fertility and natality of Roma women are related to traditional perceptions of children in the family and female status in the Roma community. The high fertility rate among Roma women is in close connection with the low education level, the extremely low employment level, and the degree of segregation. These aforementioned factors are also known as frequent indicators of poverty, which Bereczkei (1998) [73] rejects and sees as the cause of the high reproduction of the Roma population in the size of the kinship network as a valuable resource of direct childcare assistance and services that ensure a steady and high level of reproduction.
Research has shown high fertility and birth rates but also a slight decrease over the last 22 years, which was also pointed out by Šprocha (2017) [74] and Szabó et al. (2020) [75] for the Roma population in Slovakia but also in Hungary, Serbia, and Romania. Although the early onset of reproduction and fertility at a young age remains unchanged, the total fertility rate may have decreased by approximately one child per reproductive woman. This registered decrease is remarkable and significant, more so for the increasing number of women of child-bearing age in the Roma population. However, the magnitude of change is embodied in Roma population concentrations, which is evident, especially in municipalities including 100% Roma inhabitants.
In line with Podolák (2005) [76] or Ravasz (2019) [24], it can be observed that the eventual change of such reproductive behavior requires a change of living conditions, improvement of the living standard, and the education level. Considering the experience from other publications on Roma communities [7,43,51,53,60], it can be assumed that the fertility reduction of Roma women will continue and will result in a gradual stabilization of fertility to a lower level. However, the level of fertility will be high for a long time compared to the total population of Slovakia. Of course, Roma reproduction and the range lag behind the majority population in terms of demographic transition. According to Kirk (1996) [77], there are diverse approaches to causation, such as socio-economic, economic, and institutional, that preceded fertility transition in developed countries. However, Low (1994) [78] argues that it is not at all clear whether the Roma population is a type of traditional society, or whether they form a transitional state between traditional and industrial societies, or have just crossed the threshold of demographic transition. Thus, Roma fertility is higher than in neighboring populations but lower compared to preindustrial societies [73].

4.3. Mortality and Life Expectancy

Šprocha (2014) [8] recorded unfavorable mortality rates of the Roma population in Slovakia during the last century. The life expectancy at birth in the Roma population was at a significantly lower level compared to the Slovak population. This supports our findings, where we recorded that the Roma mortality rate has improved compared to the last century. The male life expectancy at birth in municipalities with over 80% of Roma inhabitants is now approximately 70 years, four years longer than in the late 1990s. The life expectancy at birth for Roma females is now 75 years, and although this is only a two year increase, women maintain lower mortality rates than men. In support, Hablicek (2008) [43] reported a similar improvement in Roma mortality in Hungary.
The Roma life expectancy has increased, but not as significantly as recorded for the Slovak population. Despite the improvement, the difference in life expectancy between Roma and the Slovak population continues to widen (Table 10). Furthermore, Masseria et al. (2010) [79] and Bogdanović et al. (2007) [61] reported that the average life expectancies of Roma men and women were 12.1 and 14.4 years lower than in the total population of Slovakia. These findings were based on the comparison of the last socialist censuses in Slovakia. Koupilová et al. (2001) [80] added that the high Roma death rates in infancy significantly contributed to this lowered life expectancy.
The mortality rates registered for the Roma population do not fall within the typical values for the Slovak population, and the differences were identified by age-at-death analysis. The Roma population has a significantly higher mortality rate in childhood (Table 11). However, while death at a young age has fallen sharply in recent decades, mortality rates are increasing in the more advanced age groups. This is reflected in increasing life expectancy in the Roma population. In the age groups of 45–59 and 60+, we observed an increase in the death rate, while the mean age of death in the Roma population also declined. Figure 8 highlights the distressing statistics that the Roma population has a lower mean-age-at-death by more than 15 years compared to the Slovak population. Bogdanović et al. (2007) [61] considered that this is to be expected in Slovakia because this corresponds with the results of studies from other Central and Eastern European countries [27,79,81,82,83]. The most unfavorable mortality rates are noted in municipalities with a 100% Roma concentration, but some improvement has been observed. However, once again, we follow the most significant advancement in 100% of Roma municipalities. While life expectancy prolongation is evident in both populations and Roma mortality has improved significantly, the differences from the Slovak population are now more significant than at the beginning of this review. Šprocha and Ďurček (2019) [84] report that this is due to the more intensive ageing of the Slovak population.
Increased Roma mortality at an early age is an established phenomenon [27,61]. This significantly affects overall life expectancy. Infant mortality is currently up to 3.5 times higher than that in the Slovak population. Šprocha (2014) [8] considers that the intensity of Roma infant mortality in the 1970s and 1980s was approximately 2.0–2.5 times higher than in the total Slovak population, with a similar trend in the 1990s. While Vaňo and Haviarová (2003) [16] report that Roma infant mortality is gradually declining, this decrease is less dynamic than in the Slovak population. Although the infant mortality rate is declining in the surveyed Roma population, it still exceeds the infant mortality rate in industrial societies and, on the contrary, lags behind the rate in more traditional societies. Bereczkei (1998) [73] states similarly.
The Roma population has seen a positive decline in child mortality, but it does not apply to municipalities with a 100% share of the Roma, where the infant mortality rate has probably increased due to the persistence of adverse living conditions and insufficient early diagnosis of diseases (Figure 9). Bogdanovic et al. (2007) [61] and Ravasz (2019) [24] contend that the unfavorable demographic situation of the Roma community is associated with adverse living conditions, where basic infrastructure, including electricity, sewage, water and fixed roads, is lacking in many areas. A large percentage of Roma still live in overcrowded homes, where more than three people share one room. Such living conditions pose a significant risk for a higher rate of morbidity [27]. Due to poor living conditions and low education, they usually turn to doctors [61] in the later stages of the disease, which is the reason for lower life expectancy and high infant mortality. Similar findings were described for Roma populations in other countries [85]. Regions of Slovakia with a significant concentration of Roma population with a high degree of spatial segregation are often referred to as regions of poverty [35,86,87].

4.4. Age Structure and Population Ageing

As a result of high natural increments, the age structure of the Roma population differs significantly from the Slovak population. This is a youthful population with the proportion of children under five as high as 12.5%, but it progressively decreases in each subsequent age group. While the population pyramid shape is explained by high Roma population growth, it highlights higher morbidity and lowers the life expectancy at birth than those in the Slovak population [27,52,61,79,80].
The Roma age structure has 36% of children in pre-productive age, almost 60% in productive years, and 5% post-productive. Besides, while the Roma child-ratio at the end of the last century was 1.7 times higher than that in the Slovak population, it is now up to 2.3 times higher as a result of the decrease in the Slovak child population [88] caused by the rapid decline in fertility. While the Roma population has an age structure similar to the less developed countries and is in the initial stages of demographic transition [89], the Slovak population is now in the final phase of typical low population increments with the intensive ageing population.
Population processes in the Roma community indicate the increasing number of Roma children until the end of the first decade of this millennium, but changes are eventually established in all Roma categories. Table 12 shows that the current Roma age structure remains similar to 1996. Although there is some improvement, it is not very marked. This confirms the trend of a slow decline in the ratio of children in the Roma population. This supports the results from our limited population sample, and Vaňo and Haviarova (2002) [16] stress that similar changes can be assumed in all Roma communities. The authors add that it indeed has occurred in Roma populations integrated into mainstream society, and most likely to a greater extent. In the category with 100% Roma population, the group of children aged 0–14 recorded the most significant decrease up to 9 p.p. between 2007 and 2018.
The Roma population will continue to expand in the long term due to the larger emerging generations of girls, despite the slow fertility decline of Roma women. This increase, however, will not be as significant as in previous periods.
Comparison of 1996–2018 ageing indicators for the Roma population and the Slovak population indicates some ageing process in both populations but with different intensity. The ageing of the Roma population is far slower than that in the Slovak population, and Knežević (2013) [7] and Hablicsek (2008) [43] also recorded similar results in Roma populations in Hungary and Serbia. Despite the increase in the mean age of the Roma population age in 2007–2018, they continue to be the most youthful Slovak ethnic group. In comparison, the average age of the total Slovak population was nearly 41 years in 2018.
While the 1996–2018 proportion of young people up to 14 years of age decreased slightly from 36.6% to 35.9% in the Roma population, the more significant difference is seen in 15–64 year-olds (Table 12, Figure A1, Figure A2, Figure A3, Figure A4 and Figure A5 in Appendix A). Despite the declining proportion of children compared to productive people, this entails that the Roma age structure presents the foundation for future growth. The percentage of Slovak productive-aged people declined between 2007 and 2018, while it increased from 56% to 60% in the Roma population. This slight Roma ageing increase suggests that their ageing process is directly affected by a decline in birth rates. The ageing of the population from the center of the population pyramid can be indicated [90].

5. Conclusions

Demographic changes in the Roma population in Slovakia are closely linked to the level achieved in their social integration. There is a wide-spread consideration that global Roma populations are heterogeneous. The largest Roma demographic peculiarities turn out in communities with a significant degree of low economic and cultural development compared to the majority of the population. The traditional and peculiar way of life is characteristic of the Roma people living in settlements with a high degree of segregation and ghettoization. The degree of segregation of Roma localities significantly increases the differences in demographic values between the Roma population and the Slovak population.
However, the processes of segregation and ghettoization of the Roma in Slovakia accelerated again after 1989, and according to Šuvada (2015) [23], in most cases, it was exclusively uncontrolled and spontaneous segregation. The immediate post-socialist period significantly worsened the overall position of the majority of the Roma population and thus may, to some extent, also have contributed to a decline in the dynamics of promoting changes in reproductive behavior [10,23]. At this stage of development, the reproduction of the Roma increased again. The reversal occurs only after changes in Slovakia’s social subsidy policy, which limit various transfers associated with birth and childcare in combination with the difficult position of women and insufficient opportunities to prevent further unwanted conceptions, as argued by Šprocha and Tišliar (2016) [10].
Where the theory of demographic transition is concerned, the studied Roma population belongs approximately to the late stage of population expansion when the reduced mortality rate is combined with a slight decrease in birth rate and natural increase. According to Kniezevic (2013) [7], although the Roma population lives mainly on the margins of society, there have been significant demographic changes that should lead from a traditional to more modern Roma society. Compared to the demographic development of the Slovak population, this represents a considerable time lagging in the demographic transformation. The Slovak population is placed in the post-transitional stage of demographic transition, with a very low rate of natural increase. Due to the considerable population growth of the Roma population, it may already be the largest ethnic minority in Slovakia. This is evidenced by studies of the Hungarian population in Slovakia [91,92,93], which point to its significant population ageing with a shallow rate of natural increase. The Roma population is qualitatively different from other minorities, and Podolák (2000) [30] claims that this is due to its origin, language, way of life, historical and social backwardness, social-class structure, and anthropologically.
Despite the research limitations on studies, some changes in Roma reproductive behavior have been observed in the new millennium. This is especially apparent in the changes from 1996 to 2018 when there was a decline in fertility and birth rates and a consequent slowdown of population growth. Besides, the noted increase in Roma life expectancy signals improved mortality rates and significantly better child death rates. Demographic changes were most pronounced in municipalities with a 100% Roma population. These populations are attended in only two municipalities in Slovakia and produce only 17.5% of the examined population. The changes are also related, to some extent, to changes in Slovakia social welfare policy. Furthermore, social security benefit allowances are an essential part of family income and maybe influencing reproductive strategies, especially for segregated Roma women [62]. Demographic development in other “almost-only-Roma” municipalities remains almost the same or with slight changes.
While this research has faced limitations and prejudices, it offers valuable insight into the main features of demographic behavior and changes in Roma population development. The presented study provides a solid foundation for future exploration. Although this contribution has no claim to complexity from either a historic or problem-solving perspective, its focus and scope contribute to clarifying connections in the demographic characteristics of the Roma minority in the Slovak Republic. It also demonstrates the demographic behavior of the Roma population and points to the fact that its development is greatly influenced by the degree of segregation and differentiation in economic, social, and living conditions. However, it is necessary to realize that not every segregated settlement in Slovakia shows significant demographic differences from the majority population. The Slovak Roma population is heterogeneous in integration, with the latest 2019 sociological survey identifying that almost 82% of the Roma population is not integrated and living in settlements with a high degree of separation from the general population.
Demographic analysis indicates that the Roma population is undergoing slight changes in reproduction, and although reproduction remains within a solid traditional framework, the changes are an initial indicator of socio-economic integration. Finally, the developments noted in recent decades indicate that the Slovak Roma population is slowly but surely changing the intensity of fertility, birth rate and mortality, and these have an impact on gradually reducing population growth, especially in purely Roma communities. Consequently, a better understanding of Roma demographic behavior is essential for any forecast about the demographic and economic future of Slovakia. It is necessary to stress that this community should experience a decline in population growth due to sustainable development in the country’s economy. Otherwise, according to Azarnert (2018) [26], an increasingly growing population with lower skills, productivity, and labor force participation relative to the majority population will generate a threat for the prospects of sustainable economic growth in Slovakia, as has been broadly argued about the minority populations of non-European origin in Western Europe.

Funding

This research received no external funding.

Institutional Review Board Statement

Not applicable.

Informed Consent Statement

Not applicable.

Data Availability Statement

Publicly available datasets were analyzed in this study. Data can be found here: [http://datacube.statistics.sk, https://www.minv.sk/?atlas-romskych-komunit]. Non-publicly available datasets were also analyzed available on request due to restrictions [Statistical Office of the Slovak Republic].

Acknowledgments

This article was developed within the project VEGA 1/0514/21 “Spatial redistribution of human capital as an indicator of the formation of the regional system in Slovakia”. I am thankful to research partners, especially Ladislav Novotný and Alena Gessert, for valuable advice and scientific discussion. The author would like to thank the reviewers for their comments, suggestions and notes, which helped improve the original version of the paper.

Conflicts of Interest

The author declares no conflict of interest.

Appendix A

Figure A1. The age structure of the Roma population, 1996 and 2018.
Sustainability 13 03735 g0a1
Figure A2. The age structure in municipalities with 100% of the Roma population, 1996 and 2018.
Sustainability 13 03735 g0a2
Figure A3. The age structure in municipalities with 90% of the Roma population, 1996 and 2018.
Sustainability 13 03735 g0a3
Figure A4. The age structure in municipalities with 80% of the Roma population, 1996 and 2018.
Sustainability 13 03735 g0a4
Figure A5. The age structure of the Slovak population, 1996 and 2018.
Sustainability 13 03735 g0a5

References

  1. Kolukirik, S.; Toktaş, Ş. Turkey’s Roma: Political Participation and Organization. Middle East. Stud. 2007, 43, 761–777. [Google Scholar] [CrossRef]
  2. European Commission Memo: Roma Integration—2014 Commission Assessment: Questions and Answers. 2014. Available online: http://europa.euúrapidúpress-relase_MEMO-14-249_en.htm (accessed on 25 January 2021).
  3. Süli-Zakar, I. The question of the roma’s integration in Europe and Hungary. In Roma Population on the Peripheries of the Visegrad Countries—Spatial Trends and Social Challenges; Didakt: Debrecen, Hungary, 2012; pp. 9–30. [Google Scholar]
  4. Haviarová, E. Demographic and Socioeconomic Data on the Roma in Slovakia and Their Use by Public Administration. In Proceedings of the Communication Présentée lors de la Conférence du NISPAcee (Réseau d’instituts et D’écoles D’administration Publique dans les PECO) sur L’administration Publique, Vilnius, Document Interne; 2004. Available online: http://unpan1.org/intradoc/groupsúpublic/documents/nispacee/unpan018442.pdf (accessed on 14 December 2020).
  5. UNDP/WB/EC Regional Roma Survey. 2011. Available online: https://cps.ceu.edu/article/2012-10-16/undpworld-bankec-regional-roma-survey-2011 (accessed on 26 January 2021).
  6. Cekota, J.; Trentini, C. The Educational Attainment, Labour Market Participation and Living Conditions of Young Roma in Bulgaria, Hungary and Romania; United Nations Economic Commission for Europe: Geneva, Switzerland, 2011. [Google Scholar]
  7. Knežević, A. Demographic Characteristics of Roma Population in Belgrade as an Indicator of Their Social Integration. Rev. Rom. Geogr. Polit. 2013, 15, 43–55. [Google Scholar]
  8. Šprocha, B. Reprodukcia Rómskeho Obyvatel’stva Na Slovensku a Prognóza Jeho Populačného Vỳvoja; Infostat: Bratislava, Slovakia, 2014. [Google Scholar]
  9. Šprocha, B. Prognóza Rómskej Populácie Na Slovensku Do Roku 2030. Slov. Štat. Demogr. 2011, 21, 22–46. [Google Scholar]
  10. Šprocha, B.; Tišliar, P. Transformácia Plodnosti Žien Slovenska v 20. a Na Začiatku 21. Storočia; Muzeológia a kultúrne dedičstvo, o.z. v spolupráci s Centrom pre historickú demografiu a populačný vývoj Slovenska, FiF UK v Bratislave: Bratislava, Slovakia, 2016; ISBN 978-80-89881-02-4. [Google Scholar]
  11. Šprocha, B.; Bleha, B. Does Socio-Spatial Segregation Matter?‘Islands’ of High Romany Fertility in Slovakia. Tijdschr. Voor Econ. En Soc. Geogr. 2018, 109, 239–255. [Google Scholar] [CrossRef]
  12. Horváthová, E. Cigáni Na Slovensku: Historicko-Etnografickỳ Náčrt; Vydavatel̕stvo Slovenskej akadémie vied: Bratislava, Slovakia, 1964; Volume 14. [Google Scholar]
  13. Džambazovič, R. Rómovia v Uhorsku Koncom 19. Storočia. Sociológia-Slovak Sociol. Rev. 2001, 491–506. [Google Scholar]
  14. Jurová, A. Vỳvoj Rómskej Problematiky Na Slovensku Po Roku 1945; Goldpress: Košice, Slovakia, 1993. [Google Scholar]
  15. Kandráčová, V. Rómske osídlenie Slovenska. In Geografické Poznatky bez Hraníc. Výber z Maďarských a Slovenských Príspevkov z Fyzickej a Humánnej Geografie. Plné Znenie Príspevkov Slovenských Autorov; UPJŠ: Košice, Slovakia, 2010; pp. 127–144. [Google Scholar]
  16. Vaňo, B.; Haviarová, E. Demografické trendy rómskej populácie. In Čačipen pal o Roma. Súhrnná Správa o Stave Rómoch na Slovensku; IVO: Bratislava, Slovakia, 2002; pp. 475–502. [Google Scholar]
  17. Liégeois, J.P. Rómovia, Cigáni, Kočovníci; Charis: Bratislava, Slovakia, 1995. [Google Scholar]
  18. Šuvada, M.; Slavík, V. Prínos Slovenskej Geografie Do Vỳskumu Rómskej Minority v Slovenskej Republike. Acta Geogr. Univ. Comen. 2016, 60, 207–236. [Google Scholar]
  19. Mušinka, A.; Škobla, D.; Hurrle, J.; Matlovičova, K.; Kling, J. Atlas Rómskych Komunít Na Slovensku 2013. Regionálne centrum Rozvojového Programu OSN Pre Európu a Spoločenstvo, 2014. Available online: http://www.minv.sk/?atlas_2013 (accessed on 5 October 2020).
  20. Atlas Rómskych Komunít. 2004. Available online: https://www.minv.sk/?atlas_2004 (accessed on 25 January 2021).
  21. Atlas Rómskych Komunít. 2019. Available online: https://www.minv.sk/?atlas-romskych-komunit-2019 (accessed on 25 January 2021).
  22. Kriglerová, E.; Rybová, J. Sociografické mapovanie rómskych komunít na Slovensku—Lessons learnerd. In Mechanismy Sociálního Vyloučení Romských Komunit na Lokální Úrovni a Nástroje Integrace; Barrister & Principal: Brno, Czech Republic, 2004; pp. 167–180. [Google Scholar]
  23. Šuvada, M. Rómovia v Slovenských Mestách; Politologický odbor Matice slovenskej: Bratislava, Slovakia, 2015. [Google Scholar]
  24. Ravasz, A. Ábel Ravasz Predstavil Nový Atlas Rómskych Komunít—Trendy sú Pozitívne, Ministerstvo Vnútra Slovenskej Republiky. Available online: http://www.minv.sk/?spravy_rk&sprava=abel-ravasz-predstavil-novy-atlas-romskych-komunit-trendy-su-pozitivne (accessed on 26 January 2021).
  25. Azarnert, L.V. Immigration, Fertility, and Human Capital: A Model of Economic Decline of the West. Eur. J. Polit. Econ. 2010, 26, 431–440. [Google Scholar] [CrossRef] [Green Version]
  26. Azarnert, L.V. Refugee Resettlement, Redistribution and Growth. Eur. J. Polit. Econ. 2018, 54, 89–98. [Google Scholar] [CrossRef] [Green Version]
  27. Preda, M.-D. Demographic Behaviour of the Roma Population-Between Tradition and Modernity. Case Study: Oltenia Region, Romania. Hum. Geogr. 2010, 4, 105. [Google Scholar]
  28. Matlovič, R. Geografia Obyvatel’stva Slovenska so Zretel’om Na Rómsku Minoritu; Prešovská Univerzita: Prešov, Slovakia, 2005. [Google Scholar]
  29. Vaňo, B. Demografická Charakteristika Rómskej Populácie v SR; Infostat: Bratislava, Slovakia, 2001. [Google Scholar]
  30. Podolák, P. Geografické a Demografické Charakteristiky Rómskeho Obyvatel’stva Na Slovensku. Geogr. Cas. 2000, 52, 269–284. [Google Scholar]
  31. Mládek, J. (Ed.) Atlas Obyvateľstva Slovenska; Univerzita Komenského: Bratislava, Slovakia, 2006. [Google Scholar]
  32. Kandráčová, V. Rómske Osídlenie Košickej Kotliny. Geogr. Cassoviensis 2007, 1, 67–73. [Google Scholar]
  33. Bleha, B.; Vaňo, B.; Bačík, V. Demografický Atlas Slovenskej Republiky|Orientačná Mapa Obcí SR; Prírodovedecká Fakulta Univerzity Komenského a Inštitút Informatiky a Štatistiky: Bratislava, Slovakia, 2015. [Google Scholar]
  34. Benža, M.; Kusendová, D.; Majo, J.; Tišliar, P. Národnostný Atlas Slovenska; Dajama: Bratislava, Slovakia, 2015. [Google Scholar]
  35. Székely, V. Roma and Rural Poverty: Regional Benchmarking of Selected Rural Regions of Slovakia. Rural Areas Dev. 2015, 12, 149–164. [Google Scholar]
  36. Korec, P. Regionálny Rozvoj Slovenska v Rokoch 1989–2004: Identifikácia Menej Rozvinutỳch Regiónov Slovenska; Geo-grafika: Bratislava, Slovakia, 2005. [Google Scholar]
  37. Matlovičová, K.; Matlovič, R.; Mušinka, A.; Židová, A. The Roma population in Slovakia. Basic characteristics of the Roma population with emphasis on the spatial aspects of its differentiation. In Roma Population on the Peripheries of the Visegrad Countries. Spatial Trends and Social Challenges; Didakt: Debrecen, Hungary, 2012; Volume 2012, pp. 77–104. [Google Scholar]
  38. Michaeli, E.; Ivanová, M.; Solár, V. Specific Aspects of the Quality of Life of the Roma Ethnic Group in Selected Areas Under Study in the East of the Slovak Republic. Acta Univ. Palacki. Olomouc. 2014, 45, 37–47. [Google Scholar]
  39. Pukačová, J. Obyvateľstvo Rómskej Národnosti Na Slovensku. Bachelor’s Thesis, Univerzita Komenského, Prírodovedecká Fakulta, Bratislava, Slovakia, 2006. [Google Scholar]
  40. Veselovská, Z.; Pirová, B. Rómske Okresy—Nositelia Sociálnych Problémov. Geogr. Cassoviensis 2014, 8, 96–106. [Google Scholar]
  41. Kertesi, G.; Kézdi, G. A Cigány Nepesség Magyarországon: Dokumentáció és Adattar; Socio-typo: Budapest, Hungary, 1998; ISBN 978-963-03-6352-5. [Google Scholar]
  42. Kemény, I.; Janky, B. A 2003. Évi Cigány Felmérésről. Beszélő 2003, 10, 64–76. [Google Scholar]
  43. Hablicsek, L. The Development and the Spatial Characteristics of the Roma Population in Hungary-Experimental Population Projections Till 2021. Demogr. Engl. Ed. 2008, 51, 85–123. [Google Scholar]
  44. Mann, A.B. Vỳvoj Rómskej Rodiny Na Príklade Troch Spišskỳch Obcí. Demografie 1992, 34, 118–130. [Google Scholar]
  45. Kumanová, Z. Demografický Výskum Rómskej Rodiny v Plaveckom Štvrtku. Slov. Národop. 1997, 45, 87–105. [Google Scholar]
  46. Ladányi, J.; Szelényi, I.; Millward, J. Patterns of Exclusion: Constructing Gypsy Ethnicity and the Making of an Underclass in Transitional Societies of Europe; Columbia University Press: New York, NY, USA, 2006. [Google Scholar]
  47. Šprocha, B. Základné Charakteristiky Úmrtnostnỳch Pomerov vo Vybranỳch Rómskych Lokalitách Na Slovensku. Slov. Štat. Demogr. 2009, 19, 52–69. [Google Scholar]
  48. Šprocha, B.; Pukačová, J. Špecifiká rómskej populácie na Slovensku. In Populačný vývoj Slovenska na Prelome Tisícročí. Kontinuita či Nová Éra? Geografika: Bratislava, Slovakia, 2009; pp. 166–183. [Google Scholar]
  49. Dolná, Z. The Demographic Situation of the Roma Minority in the Micro-Region “Stráže”. Folia Geogr. 2009, 49, 74–82. [Google Scholar]
  50. Durst, J. Minden Évben Máshogy Fordul a Világ-A Telepfelszámolástól a Szegregált Cigány Faluig. Elimin. Gypsy Settl. Segreg. Gypsy Village Anblokk 2010, 4, 34–38. [Google Scholar]
  51. Gamella, J.F. Marriage, Gender and Transnational Migrations in Fertility Transitions of Romanian Roma Women. Intersect. East Eur. J. Soc. Polit. 2018, 4, 57–85. [Google Scholar] [CrossRef]
  52. Kemény, I. A Magyarországi Cigány Népesség Demográfiája. Demográfia 2004, 47, 335–346. [Google Scholar]
  53. Janky, B. The social position and fertility of Roma women. In Changing Roles: Report on the Situation of Women and Men in Hungary 2005; TÁRKI Social Research Institute: Budapest, Hungary, 2005; pp. 132–145. [Google Scholar]
  54. Mureşan, C. Impact of Induced Abortion on Fertility in Romania. Eur. J. Popul. Eur. Demogr. 2008, 24, 425–446. [Google Scholar] [CrossRef]
  55. Kertesi, G.; Kézdi, G. Roma Employment in Hungary after the Post-Communist Transition 1. Econ. Transit. 2011, 19, 563–610. [Google Scholar] [CrossRef]
  56. Pásztor, I.Z.; Pénzes, J.; Tátrai, P.; Pálóczi, Á. The Number and Spatial Distribution of the Roma Population in Hungary–in the Light of Different Approaches. Folia Geogr. 2016, 58, 5. [Google Scholar]
  57. Rosinský, R. Rómovia v číslach na Slovensku a v nitrianskom kraji. In Odlišnosti by Nás Mali Spájať—Nie Rozdeľovať! Sponka: Nitra, Slovakia, 2014; pp. 92–117. [Google Scholar]
  58. Toshevska, B.A.; Madjevikj, M.; Ljakoska, M.; Sokoloski, P. The Reproductive Behaviour of the Female Population in the Only Roma Governed Community in Europe. Hum. Geogr. 2018, 12, 157–174. [Google Scholar]
  59. Sika, P.; Vidová, J.; Rievajová, E. Regional View on Housing of the Marginalized Roma Population in the Slovak Republic. Sustainability 2020, 12, 5597. [Google Scholar] [CrossRef]
  60. Pásztor, Z.I.; Pénzes, J. Spatial Distribution and Demographic Trends of the Roma Population in Northeastern Hungary. In Roma Population on the Peripheries of the Visegrad Countries; Didakt: Debrecen, Hungary, 2012; pp. 60–76. [Google Scholar]
  61. Bogdanović, D.; Nikić, D.; Petrović, B.; Kocić, B.; Jovanović, J.; Nikolić, M.; Milošević, Z. Mortality of Roma Population in Serbia, 2002–2005. Croat. Med. J. 2007, 48, 720. [Google Scholar] [PubMed]
  62. Potančoková, M.; Vaňo, B.; Pilinská, V.; Jurčová, D. Slovakia: Fertility between Tradition and Modernity. Demogr. Res. 2008, 19, 973–1018. [Google Scholar] [CrossRef] [Green Version]
  63. Koytcheva, E.; Philipov, D. Bulgaria: Ethnic Differentials in Rapidly Declining Fertility. Demogr. Res. 2008, 19, 361–402. [Google Scholar] [CrossRef]
  64. Durst, J. Kirekesztettség És Gyermekvállalás. A Romák Termékenységének Változása Néhány “Gettósodó” Aprófaluban (1970–2004). Ph.D. Thesis, Corvinus University of Budapest, Budapest, Hungary, 2007. [Google Scholar]
  65. Šlezak, H. Uloga Roma u Demografskim Resursima Međimurske Županije. Sociol. Prost. 2013, 51, 21–43. [Google Scholar] [CrossRef] [Green Version]
  66. Šlezak, H.; Belić, T. Projekcije Kretanja Romske Populacije u Međimurju-Put Od Manjine Ka Većini. Geoadria 2019, 24, 141–167. [Google Scholar]
  67. Zamfir, E. Roma People within the Global Process of Change. Rev. Cercet. Şi Interv. Soc. 2013, 40, 149–165. [Google Scholar]
  68. Šprocha, B. Reprodukčné Správanie Obyvateľstva Sídliska Luník IX. Geogr. Cassoviensis 2015, 9, 56–68. [Google Scholar]
  69. Kalibová, K. Demografické Charakteristiky Romské Populace v Československu. Dizertačná Práca; Přírodovědecká fakulta Karlové University: Praha, Czech Republic, 1991. [Google Scholar]
  70. Vaňo, B.; Mészáros, J. Reprodukčné Správanie Obyvatel’stva v Obciach s Nízkym Životnỳm Štandardom; Infostat: Bratislava, Slovakia, 2004. [Google Scholar]
  71. Šprocha, B. Pôrodnost a Plodnost Rómskych Žien Na Slovensku. Available online: http://www.demografie.info/?cz_detail_clanku=&artclID=469 (accessed on 26 January 2021).
  72. Pukačová, J.; Mládek, J. Špecifické Črty Reprodukčného Správania Rómskeho Obyvatel’stva Na Slovensku. Geogr. Cas. 2014, 66, 133–159. [Google Scholar]
  73. Bereczkei, T. Kinship Network, Direct Childcare, and Fertility among Hungarians and Gypsies. Evol. Hum. Behav. 1998, 19, 283–298. [Google Scholar] [CrossRef]
  74. Šprocha, B. Rómska Populácia Na Slovensku a Kohortná Plodnost’ Rómskych Žien Podl’a Vỳsledkov Sčítania Obyvatel’ov, Domov a Bytov 2011. Demografie 2017, 59, 118–131. [Google Scholar]
  75. Szabó, L.; Kiss, I.; Sprocha, B.; Spéder, Z. Fertility of Roma Minorities in Central and Eastern Europe. Work. Pap. Popul. Fam. Welf. 2020. [Google Scholar] [CrossRef]
  76. Podolak, P. Demographic Changes OT Rural Population in Slovakia. Rural Areas Dev. 2005, 3, 49–62. [Google Scholar]
  77. Kirk, D. Demographic Transition Theory. Popul. Stud. 1996, 50, 361–387. [Google Scholar] [CrossRef] [PubMed]
  78. Low, B.S. Men in the Demographic Transition. Hum. Nat. Hawthorne N. 1994, 5, 223–253. [Google Scholar] [CrossRef] [PubMed]
  79. Masseria, C.; Mladovsky, P.; Hernández-Quevedo, C. The Socio-Economic Determinants of the Health Status of Roma in Comparison with Non-Roma in Bulgaria, Hungary and Romania. Eur. J. Public Health 2010, 20, 549–554. [Google Scholar] [CrossRef] [Green Version]
  80. Koupilová, I.; Epstein, H.; Holčík, J.; Hajioff, S.; McKee, M. Health Needs of the Roma Population in the Czech and Slovak Republics. Soc. Sci. Med. 2001, 53, 1191–1204. [Google Scholar] [CrossRef]
  81. Braham, M. The Untouchables: A Survey of the Roma People of Central and Eastern Europe: A Report to the Office of the United Nations High Commissioner for Refugees; Office of the United Nations High Commissioner for Refugees (UNHCR): Geneva, Switzerland, 1993. [Google Scholar]
  82. Ginter, E.; Krajcovicova-Kudlackova, M.; Kacala, O.; Kovacic, V.; Valachovicova, M. Health Status of Romanies (Gypsies) in the Slovak Republic and in the Neighbouring Countries. Bratisl. Lek. Listy 2001, 102, 479–484. [Google Scholar]
  83. Kovac, C. A Government Survey Has Found That the Overall Health of Hungary’s Roma (Gypsies) Is Much Worse. (News). Br. Med. J. 2002, 324, 755–756. [Google Scholar] [CrossRef] [PubMed]
  84. Šprocha, B.; Ďurček, P. Starnutie Populácie Slovenska v Čase a Priestore; Prognostický Ústav, Centrum Spoločenských a Psychologických Vied SAV, Katedra Ekonomickej a Sociálnej Geografie, Demografie a Územného Rozvoja Prírodovedecká fakulta Univerzity Komenského: Bratislava, Slovakia, 2019. [Google Scholar]
  85. Ferrer, F. The Health Status of the Gypsy Community in Spain. A Review of the Literature. Gac. Sanit. 2003, 17, 2–8. [Google Scholar] [CrossRef]
  86. Rochovská, A.; Rusnáková, J. Poverty, Segregation and Social Exclusion of Roma Communities in Slovakia. Bull. Geogr. Socio-Econ. Ser. 2018, 42, 195–212. [Google Scholar] [CrossRef] [Green Version]
  87. Michálek, A.; Madajová, M.S. Identifying Regional Poverty Types in Slovakia. GeoJournal 2019, 84, 85–99. [Google Scholar] [CrossRef]
  88. Fiala, T.; Langhamrová, J.; Pechholdová, M.; Ďurček, P.; Šprocha, B. Population Develompent of Czechia and Slovakia after 1989. Demografie 2018, 60, 202–218. [Google Scholar]
  89. Roser, M.; Ritchie, H.; Ortiz-Ospina, E. World Population Growth. Available online: https://ourworldindata.org/world-population-growth (accessed on 26 January 2021).
  90. MacKellar, F.L. The Predicament of Population Aging: A Review Essay. Vienna Yearb. Popul. Res. 2003, 1, 73–99. [Google Scholar] [CrossRef]
  91. Majo, J. Niekol’ko Poznámok k Fenoménu Etnicity v Súčasnej Slovenskej Humánnej Geografii. Acta Geogr. Univ. Comen. 2014, 58, 149–172. [Google Scholar]
  92. Gyurgyík, L. Zmeny v demografickej, sídelnej a sociálnej štruktúre Maďarov na Slovensku. In Maďari na Slovensku (1984–2004). Súhrnná Správa. Od Zmeny Režimu po Vstup do Európskej Únie; Fórum inštitút pre vỳskum menšin: Šamorín, Slovakia, 2008; pp. 155–198. [Google Scholar]
  93. Gyurgyík, L. The Demographic Trends of the Ethnic Hungarian Population of Slovakia in Light of the 2011 Census to the Present. Minor. Stud. 2013, 15, 53–66. [Google Scholar]
Figure 1. The Roma population in Slovakia from different sources by NUTS 3 from 1980 to 2019. Note: NUTS—Nomenclature of Territorial Units for Statistics of European Union.
Sustainability 13 03735 g001
Figure 2. Location of Slovak municipalities with a high concentration of Roma population.
Sustainability 13 03735 g002
Figure 3. Development of the studied Roma and Slovak population, 1996–2018. Source: Statistical Office of the Slovak Republic.
Sustainability 13 03735 g003
Figure 4. Population growth of Roma and Slovak population, 1996–2018. Source: Statistical Office of the Slovak Republic.
Sustainability 13 03735 g004
Figure 5. Average annual Roma and Slovak population birth rate development in 1996–2018.
Sustainability 13 03735 g005
Figure 6. The average annual development of live births per 1000 Roma women, 1996–2018.
Sustainability 13 03735 g006
Figure 7. The total fertility rate in Roma and Slovak population, 1996–2018.
Sustainability 13 03735 g007
Figure 8. The mean age of death in Roma and Slovak populations between 1996 and 2018.
Sustainability 13 03735 g008
Figure 9. Infant death rates in Roma and Slovak population between 1996 and 2018.
Sustainability 13 03735 g009
Table 1. Development of the number of Roma people in Slovakia by population censuses, state inventories, and other estimations since the late 18th century.
Roma PopulationSlovakia PopulationRoma Population (%)Source
177020,0001.3 mil1.5estimate, Horváthová 1964
189340,0002.7 mil.1.5estimate, Ďzambazovič 2001
192180003.0 mil.0.3census 1921
192762,0003.2 mil.2.0estimate, Horváthová 1964
193031,2003.3 mil.0.9census 1930
194784,4003.3 mil.2.5estimate, Kalibová 1991, Jurová 1993
1968165,4004.5 mil.3.7estimate, Srb, Vomáčková 1969, Jurová 1998
1970160,0004.5 mil.3.5census 1970, inventory at census
1980200,0005.0 mil.4.0census 1980, inventory at census
1985230,3005.2 mil.4.4estimate, Hetteš 1987
1989254,0005.3 mil.4.8inventory, Jurová 1993
1990263,0005.3 mil.5.0estimate, Vaňo and Haviarová 2002
199176,0005.3 mil.1.4census 1991
200190,0005.4 mil.1.7census 2001
2001380,0005.3 mil.7.0estimate, Vaňo 2002
2004281,0005.4 mil.5.2sociological survey, Atlas of Roma communities 2004
2004320,0005.4 mil.5.9estimate, Kriglerová and Rybová 2004
2011106,0005,4 mil.2.0census 2011
2013403,0005.4 mil.7.5sociological survey, Atlas of Roma communities 2013
2015450,0005.4 mil.8.3estimate, Šuvada 2015
2019405,0005.4 mil.7.5sociological survey, Atlas of Roma communities 2019
2019440,0005.4 mil.8.1estimate Ravasz 2019
2020499,0005.4 mil.9.2forecast for the middle variant, Vaňo 2002
2020508,0005.4 mil.9.4forecast for the middle variant, Šprocha 2014
2025524,0005.4 mil.9.7forecast for the middle variant, Vaňo 2002
2030590,0005.5 mil.10.6forecast for the middle variant, Šprocha 2014
Source: Kandráčová (2010) [15], Vaňo and Haviarová (2002) [16], and modified by the author.
Table 2. Structure of Roma Settlements in Slovakia.
SlovakiaStudy
in Thous%in Thous%
Roma population4057.5500.9
Integrated7418.30.00.0
Non-integrated33181.750.099.9
Outside the settlement5714.07.514.9
On the edge of the settlement14736.321.142.1
inside the settlement12731.421.542.9
Source: own compilation based on data from Atlas of Roma Communities, 2019.
Table 3. Correlation analysis between municipalities with Roma concentration and demographic characteristics, 1996–2018.
RegionNatalityIndex of FertilityPre-Productive AgeMean Age
12121212
Banská Bystrica 0.720.670.650.710.620.81−0.45−0.86
Košice 0.750.690.730.660.660.76−0.41−0.82
Prešov0.700.710.680.710.650.80−0.39−0.81
Note: 1—period 1996−2000, 2—period 2015−2019, Source: Atlas Roma communities 2019, Statistical Office of the Slovak Republic.
Table 4. One-way analysis of variance (ANOVA) test of clusters of municipalities according to Roma concentration on demographic characteristics, 1996–2018.
Demographic CharacteristicsCluster 10Cluster 20Cluster 30Cluster 40Cluster 50Cluster 60Cluster 70Cluster 80Cluster 90 *One-Way ANOVA
n= 127n = 88n = 119n = 66n = 49n = 38n = 36n = 21n = 21Fp-Value
Natality (‰)12.4 113.714.415.519.121.723.027.127.048.6240.000
10.7 211.912.414.517.619.619.024.323.351.2380.000
Index of fertility (‰)265.8288.6310.1314.9411.1433.5447.6557.0524.437.6020.000
221.6243.1260.4305.3374.8414.3369.3516.6460.657.8160.000
Pre-productive age (%)21.322.422.222.725.927.029.433.833.136.0790.000
16.118.319.221.724.928.527.634.731.289.0350.000
Mean age (years)36.135.336.235.334.532.931.129.028.722.9520.000
40.238.638.336.434.632.031.328.028.7103.3380.000
Note: 1—period 1996–2000, 2—period 2015–2018, * Custer 90 includes municipalities with 100% Roma population. The source of significant differences (p < 0.001). Source: author’s calculations.
Table 5. One-way ANOVA test of clusters of municipalities according to Roma concentration above 80% on demographic characteristics, 1996–2018.
Demographic CharacteristicsCluster 80Cluster 90Cluster 100One-Way ANOVA
n = 21n = 19n = 2Fp-Value
Natality (‰)25.7 125.244.86.8290.002
22.4 222.827.80.5600.575
Index of fertility (‰)517.5487.5874.65.1690.009
460.1456.7497.80.0790.925
Pre-productive age (%)32.532.242.22.0310.142
31.830.537.21.0140.371
Mean age (years)29.629.323.22.2330.118
29.529.323.72.3030.111
Note: 1—period 1996–2000, 2—period 2015–2018. The source of significant differences (p < 0.001). Source: author’s calculations.
Table 6. Population change index by the ratio of Roma population, 1996–2018.
Categories
(by the Ratio of Roma Population)
Number of Settlements
(by Sociological Survey in 2019)
Number of PopulationPopulation Change IndexPopulation Change Index (Annual)
1996200720181996–20072007–20181996–20181996–20072007–2018
10024250771998791.821.282.321.0561.039
99–901910,47313,99418,7451.341.341.791.0351.033
89–802116,16421,66727,7661.341.281.721.0311.023
Total4230,88743,38056,3901.401.301.831.0311.028
Source: Atlas of Roma communities 2019, Statistical Office of the Slovak Republic.
Table 7. Estimated total fertility rates, mothers’ child-bearing age, and crude birth rates for the Roma population, 1996–2018.
Year PeriodTFRMean Age of MothersWomenChildrenPopulationCBR
19963.723.6741290930,88729.4
19974.423.77501108731,62234.4
19984.223.67820107332,71532.8
19994.023.88164106834,07131.3
20003.823.88447105335,23329.9
20013.723.98974108836,32530.0
20023.823.89202116437,78230.8
20034.023.99503124238,84832.0
20043.924.09818125040,04331.2
20053.723.810,098121441,06629.6
20063.824.010,488129142,28030.5
20073.923.910,774136543,38031.5
20083.924.011,092139544,50931.3
20093.924.111,425145045,87631.6
20103.724.211,739141447,11430.0
20113.624.012,216141548,81629.0
20123.424,012,616136649,86727.4
20133.023.512,946125950,78924.8
20143.123.613,265134051,88225.8
20153.223.713,516143552,93427.1
20163.123.613,805139253,93725.8
20173.123.214,152146355,19826.5
20183.023.514,527144456,39025.6
1996–20073.923.89017115037,02131.1
2007–20183.423.812,673139550 05828.0
Source: author survey based on a selected sample of the Roma population in Slovakia, Statistical Office of the Slovak Republic. TFR: Total fertility rate, the estimated number of children per woman. Mean age of mothers: mean age of all women who give birth in the corresponding year. Women (N): Number of women from 14 to 49 years in the sample in the study period. Children (N): Children born in the studied population in the monitored year. Population (N): Total population of the sample, estimated for 1996 to 2018. CBR: Crude birth rate; the number of births per thousand people.
Table 8. Total fertility rate by the ratio of Roma population in Slovak municipalities, 1996–2018.
Categories
(by the Ratio of Roma Population)
Number of Settlements
(by Sociological Survey 2019)
Total Fertility RateChange
1996200720181996–2018
10026.34.62.7−3.6
99–90193.53.33.0−0.5
89–80214.04.03.1−0.9
Total424.54.13.1−1.4
Source: Statistical Office of the Slovak Republic, and the Roma Surveys of 1996 and 2018.
Table 9. The number of live births per 1000 women in each age group, the total fertility rate in Roma and Slovak population between 1996 and 2018.
PeriodAge GroupsTotal Fertility Rate
15–1920–2425–2930–3435–3940–4445–4915–49
Slovak population
1996–199926.9100.988.741.314.92.70.139.21.4
2000–200320.571.883.545.116.03.00.134.81.2
2004–200718.958.185.358.721.03.70.236.41.2
2008–201120.653.088.478.330.65.40.341.31.4
2012–201521.048.382.578.334.26.10.239.81.4
2016–201823.954.989.686.539.47.20.343.01.5
Roma population
1996–1999185.0273.1177.4104.854.513.70.4139.34.1
2000–2003174.9232.5170.3107.661.213.60.3130.53.8
2004–2007173.1228.5167.7111.661.516.30.9129.43.8
2008–2011161.4231.1166.8114.262.817.21.5127.23.8
2012–2015147.6187.5143.386.149.111.10.4107.33.2
2016–2018154.2178.3130.483.242.39.70.0103.43.0
Source: Statistical Office of the Slovak Republic, and the Roma Surveys of 1996 and 2018.
Table 10. Life expectancy at birth in Roma and Slovak population between 1996 and 2018.
Periods/YearsRomaSlovakiaChange
MenWomenMenWomenMenWomen
1996–199867736976−2−3
2016–201870757480−4−5
Source: own calculation with data by the Statistical Office of the Slovak Republic.
Table 11. The number of deaths per 1000 people in each age group in the Roma and Slovak populations between 1996 and 2018.
PeriodAge GroupsMean Age of Death
0−1415−2930−4445−5960+
Slovak population
1996−19990.730.672.087.8049.6069.3
2000−20030.620.621.877.4048.3669.9
2004−20070.600.561.677.3447.2370.6
2008−20110.570.551.446.9643.3471.3
2012−20150.510.521.256.2139.0572.2
2016−20180.450.491.235.6936.9872.9
Roma population
1996−19993.081.042.619.7247.5957.2
2000−20033.140.902.389.9043.6958.9
2004−20072.940.882.159.9547.0557.8
2008−20112.110.742.369.9348.8557.9
2012−20152.180.762.5210.9352.1458.1
2016−20181.990.762.5711.0857.0155.6
Source: Statistical Office of the Slovak Republic, and the Roma Surveys of 1996 and 2018.
Table 12. Roma and Slovak population age structure.
Age Structure19962001200720122018
Roma population
Mean age26.724.924.724.825.7
Median age2220202021
Modal age04031
Pre−productive age (0−14) in %36.638.638.638.035.9
Productive age (15−64) in %56.356.057.057.959.5
Post−productive (65+) in %7.15.54.44.14.6
Age 0−4 in %13.214.914.513.612.5
Reproductive age of woman (14−49) in %48.248.949.951.052.0
Ageing index (%)20.014.27.710.812.7
Child-woman ratio (‰)548.3609.5583.9538.2486.1
Roma population in 100%
Mean age26.519.820.821.723.7
Median age2316171820
Modal age03017
Pre−productive age (0−14) in %36.846.444.942.336.1
Productive age (15−64) in %58.751.753.856.261.6
Post−productive (65+) in %4.51.91.31.52.3
Age 0−4 in %12.519.216.714.311.8
Reproductive age of woman (14−49) in %51.550.349.852.656.2
Ageing index (%)13.42.62.83.46.5
Child-woman ratio (‰)500.0761.6677.7552.5423.4
Roma population in 90%
Mean age27.326.326.125.926.6
Median age2322222222
Modal age22001
Pre−productive age (0−14) in %35.136.335.735.834.4
Productive age (15−64) in %57.057.359.159.660.6
Post−productive (65+) in %8.06.45.24.65.0
Age 0−4 in %12.513.712.912.912.7
Reproductive age of woman (14−49) in %49.149.650.951.351.8
Ageing index (%)22.717.814.512.814.5
Child-woman ratio (‰)506.0550.0509.2507.3497.8
Roma population in 80%
Mean age26.225.625.125.225.8
Median age2221212121
Modal age040410
Pre−productive age (0−14) in %37.337.538.238.036.9
Productive age (15−64) in %55.456.356.857.358.1
Post−productive (65+) in %7.36.25.04.85.1
Age 0−4 in %13.814.314.813.912.7
Reproductive age of woman (14−49) in %46.948.149.350.250.7
Ageing index (%)19.916.513.012.513.7
Child-woman ratio (‰)590.9598.7600.0554.0502.6
Slovak Population
Mean age34.635.737.638.940.7
Median age3334363840
Modal age1822283339
Pre−productive age (0−14) in %21.018.615.615.115.5
Productive age (15−64) in %67.869.972.471.768.3
Post−productive (65+) in %11.311.412.013.216.2
Age 0−4 in %5.85.04.95.35.3
Reproductive age of woman (14−49) in %53.553.752.550.047.2
Ageing index (%)53.761.577.387.3104.1
Child-woman ratio (‰)212.4182.2180.0207.2218.4
Publisher’s Note: MDPI stays neutral with regard to jurisdictional claims in published maps and institutional affiliations.

