Article

The Levels, Sources, and Spatial Distribution of Heavy Metals in Soils from the Drinking Water Sources of Beijing, China

1
Key Laboratory of Agricultural Water Resources, Center for Agricultural Resources Research, Institute of Genetics and Developmental Biology, Chinese Academy of Sciences, Shijiazhuang 050022, China
2
University of Chinese Academy of Science, Beijing 100049, China
3
Hebei Institute of Geological Survey, Shijiazhuang 050081, China
4
Land Consolidation and Rehabilitation Center of Hebei Province, Shijiazhuang 050051, China
*
Author to whom correspondence should be addressed.
Sustainability 2021, 13(7), 3719; https://doi.org/10.3390/su13073719
Submission received: 20 February 2021 / Revised: 17 March 2021 / Accepted: 23 March 2021 / Published: 26 March 2021

Abstract

:
Our study area is the upstream watershed of the Guanting and Miyun Reservoirs; together, these two reservoirs comprise the main drinking water source of Beijing, China. In order to prevent crop contamination and preserve the quality of the water and soil, it is important to investigate the spatial distribution and the sources of the heavy metals in farmland soils on the watershed scale. For this study, we collected 23,851 farmland surface soil samples. Based on our analysis of the concentrations of eight heavy metals in these samples, we found that the overall soil quality in our study area is excellent, but that the Cd, Cu, Zn, and Cr contamination risks are relatively high. Moreover, a percentage of samples exceeded the Cd (1.54%,), Cu (0.28%), Zn (0.25%), Cr (0.13%), Pb (0.09%), As (0.05%), Ni (0.04%), and Hg (0.02%) risk screening values for soil contamination in agricultural land. In addition to determining the spatial distribution characteristics of the heavy metal concentrations of the soil samples, we also conducted a factor analysis and an R cluster analysis (CA) whcih can gathered the similar variables to track the sources of the heavy metals. We found that the Cd, Pb, and Zn are likely sourced from a quartz syenite porphyry body and from coal-fired enterprises, while the Cr, Cu, and Ni contaminations are mainly caused by runoff from iron ore smelting. Additionally, agricultural production contributes to the local accumulation of Cu, and industrial (smelting) discharge is partially responsible for the As contamination. As a result of the atmospheric deposition of pollutants, areas with high Hg concentrations are generally centered on large- and medium-sized cities. Due to these high natural heavy metal background values, the existing and future heavy metal contamination in the watershed poses a serious ecological risk to both the soil and the surface water.

1. Introduction

Because microorganisms in the soil can not degrade most heavy metals which may persist in the soil as more toxic compounds, the accumulation of these metals in organisms throughout the food chain ultimately endangers human health [1,2,3]. As a result, heavy metal contamination in the soil has been classified as a worldwide environmental problem [4,5,6]. Although heavy metal contamination has been recognized as a severe environmental problem for decades, the situation has continued to worsen in recent years; the issue is exacerbated by the fact that there are few feasible solutions to heavy metal contamination. At present, it is recommended that environmental and government agencies should do their best to identify and control the sources of the heavy metals, as well as perform regular risk assessments of the overall soil contamination. At present, most of the research scales are near industrial and mining enterprises, towns with pollution, and national scopes. For example, Dudka et al. [7], Khosravi et al. [8], Li et al. [9], and Li et al. [10] studied the spatial distribution and transport characteristics of heavy metals introduced into the environment by the mining and smelting industries using field surveys and geostatistical analytical methods. Loska et al. [11] and Srinivasa Gowd et al. [12] analyzed soil samples from industrial areas and assessed the contamination factors and the degrees of contamination. Based on the results of those surveys, they also discussed the spatial distribution, degree of correlation, and possible remedial measures for the heavy metals in the soil. Cai et al. [13], Morton-Bermea et al. [14], Pan et al. [15], and Szolnoki et al. [16] collected testing data and conducted a principal component analysis (PCA) and a cluster analysis (CA) in order to identify the possible sources of heavy metals in cities and towns at risk of pollution. In order to determine the possible ecological and health risks caused by heavy metal contamination in agricultural soils, Bednářová et al. [17], Dartan et al. [18], Shao et al. [19], and Wang et al. [20] evaluated the spatial concentrations and risks posed by the presence of heavy metals on a national scale.
However, little comprehensive research has been conducted on the soil quality at the watershed scale. As a continuous spatial-temporal variant in the watershed system, the soil in the watershed is the likely location for heavy metal build-up that may facilitate the redistribution of the heavy metals into surface water. As such, it is important to determine if the quality of the soil in the watershed is an environmental factor that affects (or is affected by) human activities [21]. Wu et al. [22] concluded that within the river water of the upper reaches of the Diaojiang River (a tributary of the Pearl River), which flows through the Dachang super-large ore field, the zinc (Zn), arsenic (As), cadmium (Cd), and antimony (Sb) concentrations exceed the environmental quality standards for surface water (WQS) by more than an order of magnitude. Zhang et al. [23] reported that the site rank indices (SRI) of the water and the sediment or paddy soil were strongly correlated to one another, indicating that these systems are highly interrelated.
The soil environmental problems directly affect the quality and the safety of the agricultural products, the surface water, and the groundwater. Furthermore, clean drinking water is one of the main tenets of human health. As the sources of Beijing’s drinking water, the Guanting and Miyun Reservoirs and their upstream regions are important water conservation areas. The goals of this study are to quantify the current heavy metal accumulation in these two watersheds by conducting soil environmental quality testing, to provide a scientific basis for the risk management and control measures for water and soil contamination in this area, and to provide guidance on the construction of the Zhangcheng water conservation facility.
In this study, we collected 23,851 soil samples from the watershed areas of these two reservoirs in order to determine the current heavy metal concentrations in these soils. After evaluating these heavy metal concentrations with respect to the relevant national soil environmental standards, we then conducted a factor analysis and a cluster analysis in order to identify the sources of the heavy metals in these soil samples.

2. Materials and Methods

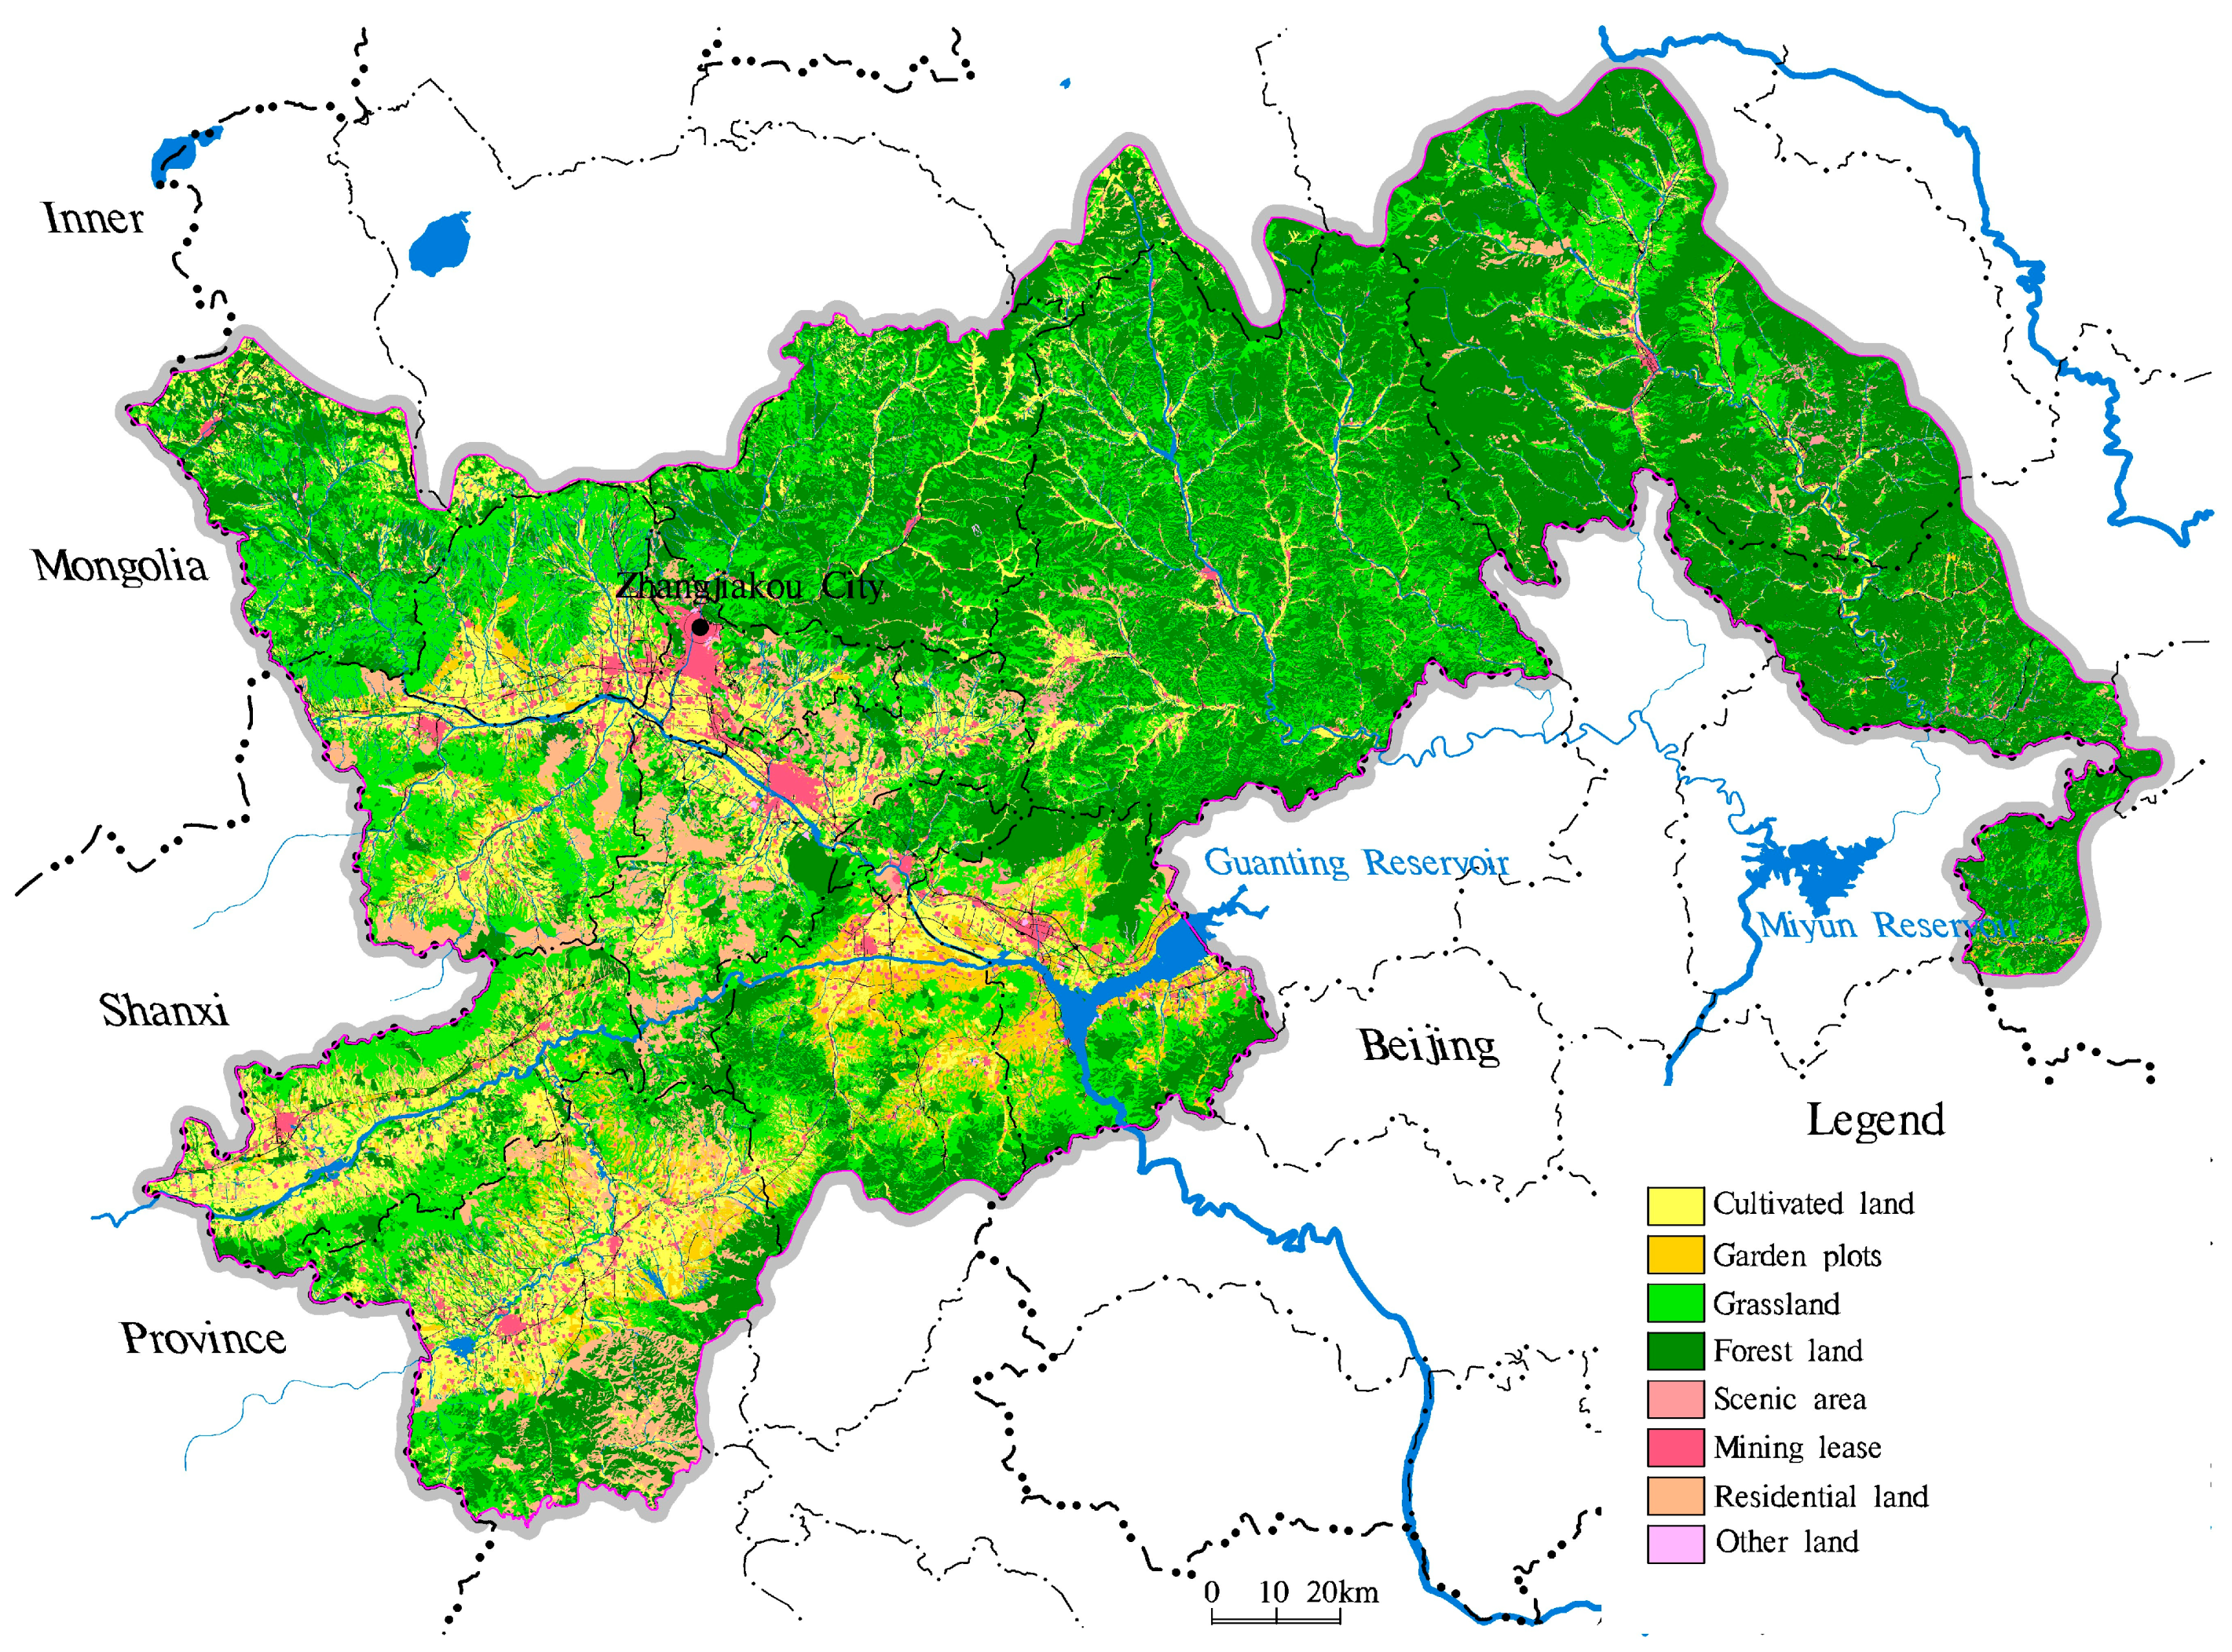
2.1. Study Area and Sampling Design

Our study area (39°33’–41°37’ N, 113°49’–117°35’ E), which is located in the upstream watershed (in Hebei Province) of the Guanting and Miyun Reservoirs, covers thirteen counties (cities) and a total area of 30,100 km2 (Figure 1). The upstream watershed of the Guanting Reservoir is the Yongding River Basin, which is fed by three major rivers: the Yanghe River, the Sanggan River, and the Yongding River. The upstream watershed of the Miyun Reservoir is the Chaobai River Basin, which is fed by four major rivers: the Baihe River, the Hehe River, the Tanghe River, and the Chaohe River. The main land-use types in our study area are forest land, grassland, and cultivated land. In terms of soil type, there are fourteen soil groups that largely consist of cinnamon soils, castano-cinnamon soils, and brown earth. Typical lithological facies in this region include Quaternary and Cretaceous strata. The dominant topographic features in our study area are middle mountains, low mountains, basins, and river valley plains. The maximum possible exploitation of the available groundwater resources (which includes the groundwater systems of the Chaobaiji Canal and the Yongding River) is 50,000 to 100,000 m3 a−1 km−2. After the early-stage reconnaissance, it was found that the heavy metal contamination of soil in the study area was mainly affected by mining activities including non-ferrous metals mining and dressing, coal mining and dressing, and mining and mineral processing of iron mines.
In order to assess the impact of human activities on the soil environment, we collected soil samples from January to August of 2017, where each land-use type was sampled according to different sampling point configurations. The sampling density of the cultivated land and the garden plots was 4 samples/km2, while that of forest land and grassland was 1 sample/4 km2. Of the 23,851 soil samples collected, 15,322 samples were collected from cultivated land, 3168 samples were located in garden plots, 2417 samples were located in forest land, and 2944 samples were collected from grasslands. The sampling depths ranged from 0 cm to 20 cm. During the practical sampling process, we used a Global Positioning System (GPS) to log the locations of the samples and to collect multi-point mixed samples. We employed the sample quartering method to ensure that each sample had a total weight of 1 kg. After removing impurities such as debris and plant residue from the sample, we ground, air dried, and forced the samples through a 20-mesh sieve.

2.2. Chemical Analyses

In the laboratory, the soil samples were passed through a 200-mesh sieve and then dissolved using aqua regia. We employed atomic fluorescence spectrometry (Type: AFS2202E) to determine the As and Hg concentrations in the soil samples and plasma mass spectrometry (Type: I Cap Qc) to determine the Cu, Pb, Zn, Cd, Cr, and Ni concentrations in the soil samples. The detection limits for elements Pb (2.0 mg kg−1) and Zn (2.0 mg kg−1) were one to two orders of magnitude higher than those of As (0.01 mg kg−1), Hg (0.01 mg kg−1), Cu (0.6 mg kg−1), Cd (0.03 mg kg−1), Cr (0.4 mg kg−1), and Ni (0.3 mg kg−1). The reporting rates were 100% for all of the elements. Moreover, the accuracy and precision of the analytical data were controlled using the national first-grade certified reference material, which was inserted as a code sample. The eligible rate of accuracy and precision was 100%. The national first-grade certified reference material was provided by the Institute of Geophysical and Geochemical Exploration of the Chinese Academy of Geological Sciences (IGGE of CAGS).

2.3. Statistical Analyses

We conducted the statistical and source identification analyses of the heavy metals in the soil samples using SPSS 18.0 software. The parameters for the descriptive statistics include the maximum, minimum, mean, median, and standard deviation. According to the Soil Environmental Quality Risk Control Standard for Soil Contamination of Agricultural Land (Trial) (GB15618-2018), which was developed jointly by the Ministry of Ecology and Environment and the State Administration for Market Regulation, we determined the risk screening values and the risk intervention values for soil contaminated by heavy metals based on the soil pH value and the land use type. With ArcGIS 10.2, we evaluated the spatial distribution of the agricultural land at risk for soil contamination in our study area.
We quantified the spatial distributions of the heavy metals in the soils with the GeoIPAS V3.2 Geochemical Exploration Pro software. In this software, we gridded the discrete data using the Kriging interpolation method and then created geochemical contour maps using contour lines defined according to the cumulative frequency values of 0.5, 2.5, 5, 15, 25, 30, 50, 70, 80, 90, 97.5, and 99.5%. For our grading standards, we defined areas with heavy metal contents of <2.5% as anomalously low-value areas (dark blue), heavy metal contents of 2.5 to 15% as low-value areas (blue), heavy metal contents of 15% to 30% as low background regions (light blue), heavy metal contents of 30% to 70% as background regions (yellow), heavy metal contents of 70 to 90% as high background regions (light red), heavy metal contents of 90 to 97.5% as high-value areas (red), and heavy metal contents of >97.5% as anomalously high-value areas (crimson).
After the Z-score standardized processing of the heavy metal soil data, we identified the sources of the contamination using factor analysis and an R CA. For the CA, a single linkage was selected for the amalgamation rule, while a 1-Pearson’s r was chosen for the distance measure. Moreover, for the factor analysis, a rotating component matrix was used to separate out the possible elemental combinations, and three factors with accumulative variance contributions of greater than 70% were chosen for further analysis.

3. Results and Discussion

3.1. Degree of Heavy Metal Accumulation

The descriptive statistical results for the eight heavy metals found in our soil samples are presented in Table 1.
As shown in Table 1, the mean pH value of the farmland soil in the study area (including cultivated land, the garden plots, forest land, and grassland) was 8.44 (range of 4.66 to 10.27). Areas with pH values greater than 7 accounted for 94.24% of the total study area, indicating that the farmland soil in the target watershed is largely alkaline in nature. While the heavy metal activity in the soil is relatively low, the concentrations of the eight heavy metals vary significantly. Specifically, these soil samples contained relatively high average concentrations of Zn (67.7 mg kg−1) and Cr (62.8 mg kg−1), moderate average concentrations of Ni (27.5 mg kg−1), Cu (22.5 mg kg−1), Pb (22 mg kg−1), and As (9.53 mg kg−1), and low average concentrations of Cd (0.14 mg kg−1) and Hg (0.028 mg kg−1). With the exception of Pb and Cd, these values are mostly lower than the corresponding background concentrations for Zn, Cr, Ni, Cu, As, and Hg in Hebei Province (CNEMC, 1990). According to the risk screening and risk intervention values provided by the Soil Environmental Quality Risk Control Standard for Soil Contamination of Agricultural Land (Trial) (GB15618-2018), which was developed jointly by the Ministry of Ecology and Environment and the State Administration for Market Regulation, only the As contents of two samples, the Cd contents of two samples, and the Cd content of one sample exceeded the risk intervention values for soil contamination in agricultural land (100 mg As kg−1, 4 mg Cd kg−1, and 1300 mg Cr kg−1). Strict control measures, such as prohibiting the cultivation of edible agricultural products and returning farmland to forests, should be adopted in the areas that exceed these standard values in order to create an artificial contamination barrier between the heavy metal pollution source and the agricultural land. Furthermore, soil remediation and governance work should also be considered and undertaken where necessary. However, the proportions of sample points with concentrations greater than the risk screening values for soil contamination in agricultural land (0.6 mg Cd kg−1, 3.4 mg Hg kg−1, 25 mg As kg−1, 170 mg Pb kg−1, 250 mg Cr kg−1, and 100 mg Cu kg−1) were 1.54% for Cd, 0.28% for Cu, 0.25% for Zn, 0.13% for Cr, 0.09% for Pb, 0.05% for As, 0.04% for Ni, and 0.02% for Hg. Overall, the environmental quality of our study area is excellent, but the risks of Cd, Cu, Zn, and Cr contamination are relatively high. We recommend that decision-makers and governmental bodies should conduct more rigorous soil environmental and cooperative agricultural product monitoring and implement safer utilization measures such as agronomy regulation and substitute planting. The variation coefficient (CV) values for the eight heavy metals in the soil samples from our study area fall between 0.28 and 2.03, with the highest CV values (CV > 0.5) and the largest fluctuations corresponding to Hg, Cd, and Pb. Hg has the highest CV value (2.03), and its regional enrichment was obvious. We observed medium variations in Zn, Cu, Ni, and Cr, which had CV values ranging from 0.2 to 0.5. The overall spatial distribution of all eight heavy metals was uneven.

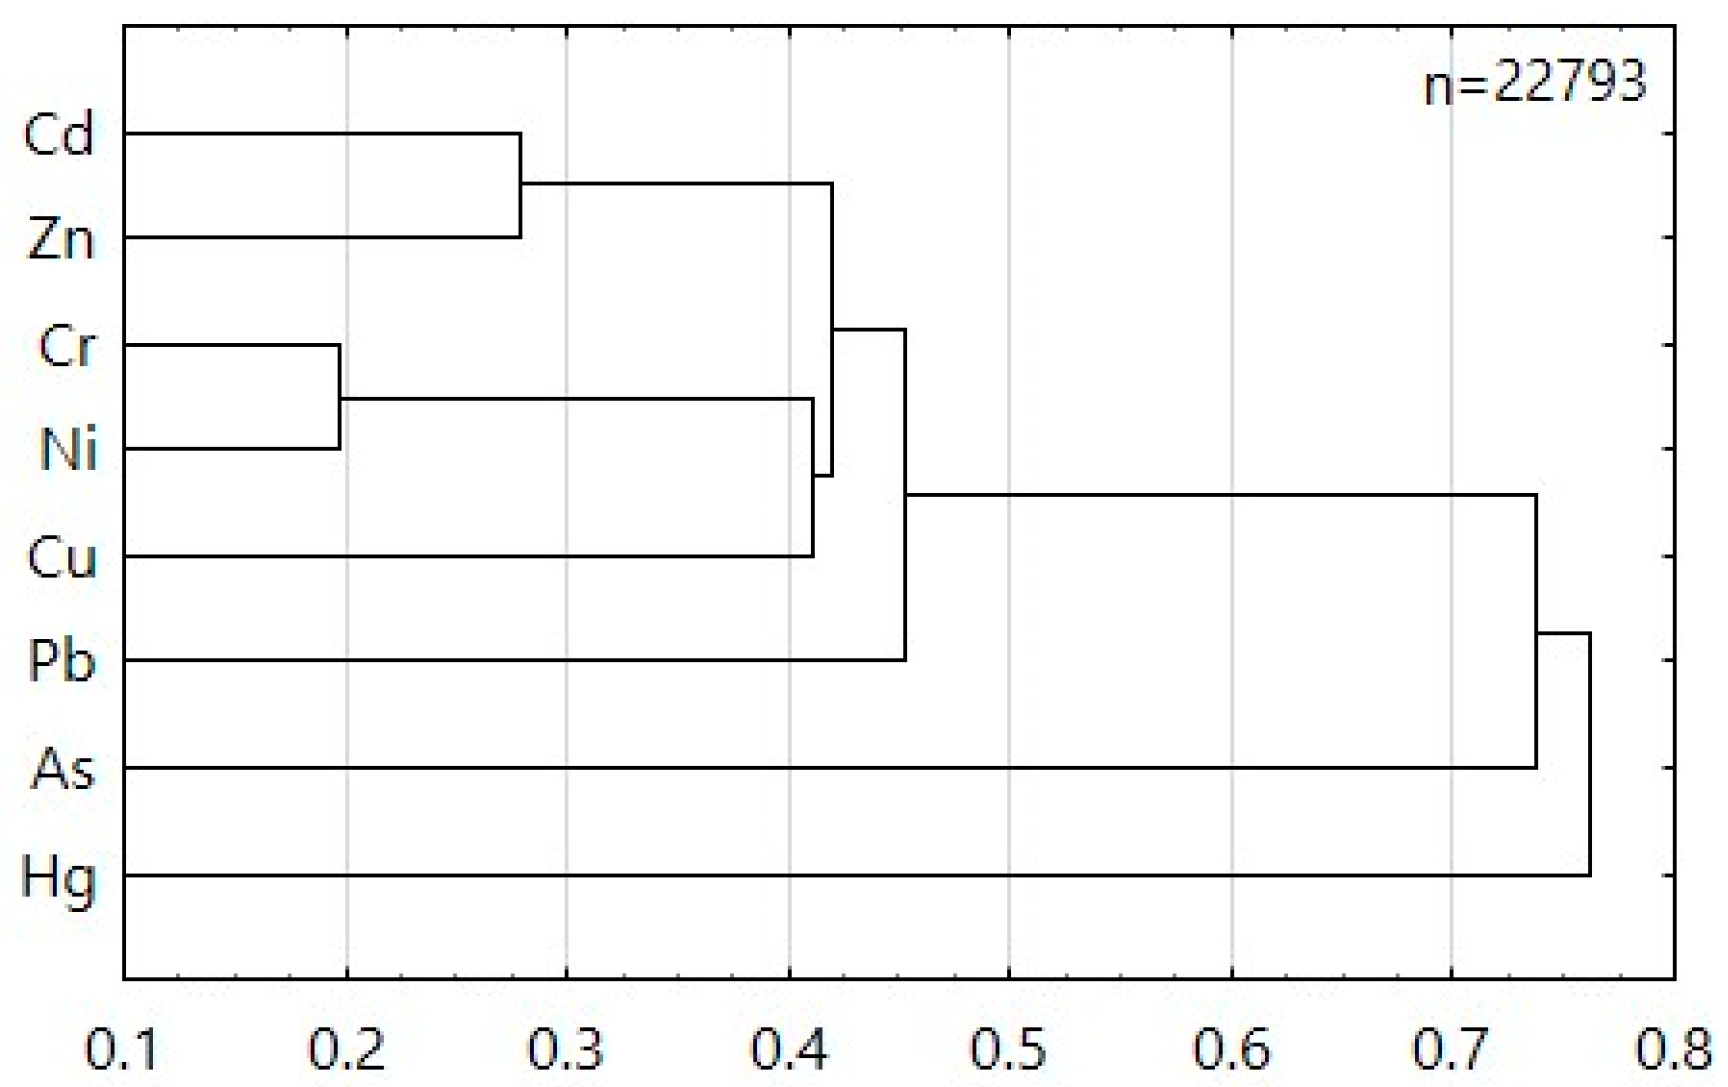
3.2. Identification of the Heavy Metal Sources

The PCA results of the factor loadings are presented in Table 2. There were three factors with eigenvalues greater than one; the cumulative contribution rate of the total variance for these three factors was 70.61%. Specifically, the first factor explained 36.31% of the total variance and largely consisted of contributions from Cr, Ni, and Cu. Factor 2, which was dominated by Cd, Zn, and Pb, accounting for 22.11% of the total variance. Factor 3, which included contributions from Hg and As, accounted for 12.19% of the total variance.
CA classifies a set of observations into two or more mutually exclusive unknown groups based on a combination of internal variables. CA is often coupled with PCA to validate the PCA results and to aid in a better grouping of the PCA variables [24,25].
In this study, we used CA to evaluate the source similarities of the eight heavy metals in the soil samples collected from our study area. The CA results for the heavy metals are shown in the dendrogram in Figure 2. The eight heavy metals were classified into three clusters: (1) Cd and Zn, (2) Cr, Ni, and Cu, and (3) Hg and As. The CA results are largely consistent with the PCA results in that there appear to be three potential heavy metal sources. The first source, which contributes to most of the Cd, Pb, and Zn contamination, is coal-burning processes [15,19,20,26]. Moreover, as sulfophiles, these elements can form sulfide precipitates with low solubilities when combined with the sulfur in the soil; as such, they can be absorbed by iron and manganese oxides and hydroxides. The Cr, Ni, and Cu contamination are attributed to a similar coal-burning source. The elements in this group are mainly siderophile elements [27]. Because elements of the same type have certain commonalities in supergene geochemistry, high contents of these elements are often found in mafic rocks, ultramafic rocks, and clay soils. The third group, which includes Hg and As, is human activity sources such as coal-fired enterprises, coal transportation, and coal-producing processes [28,29,30].

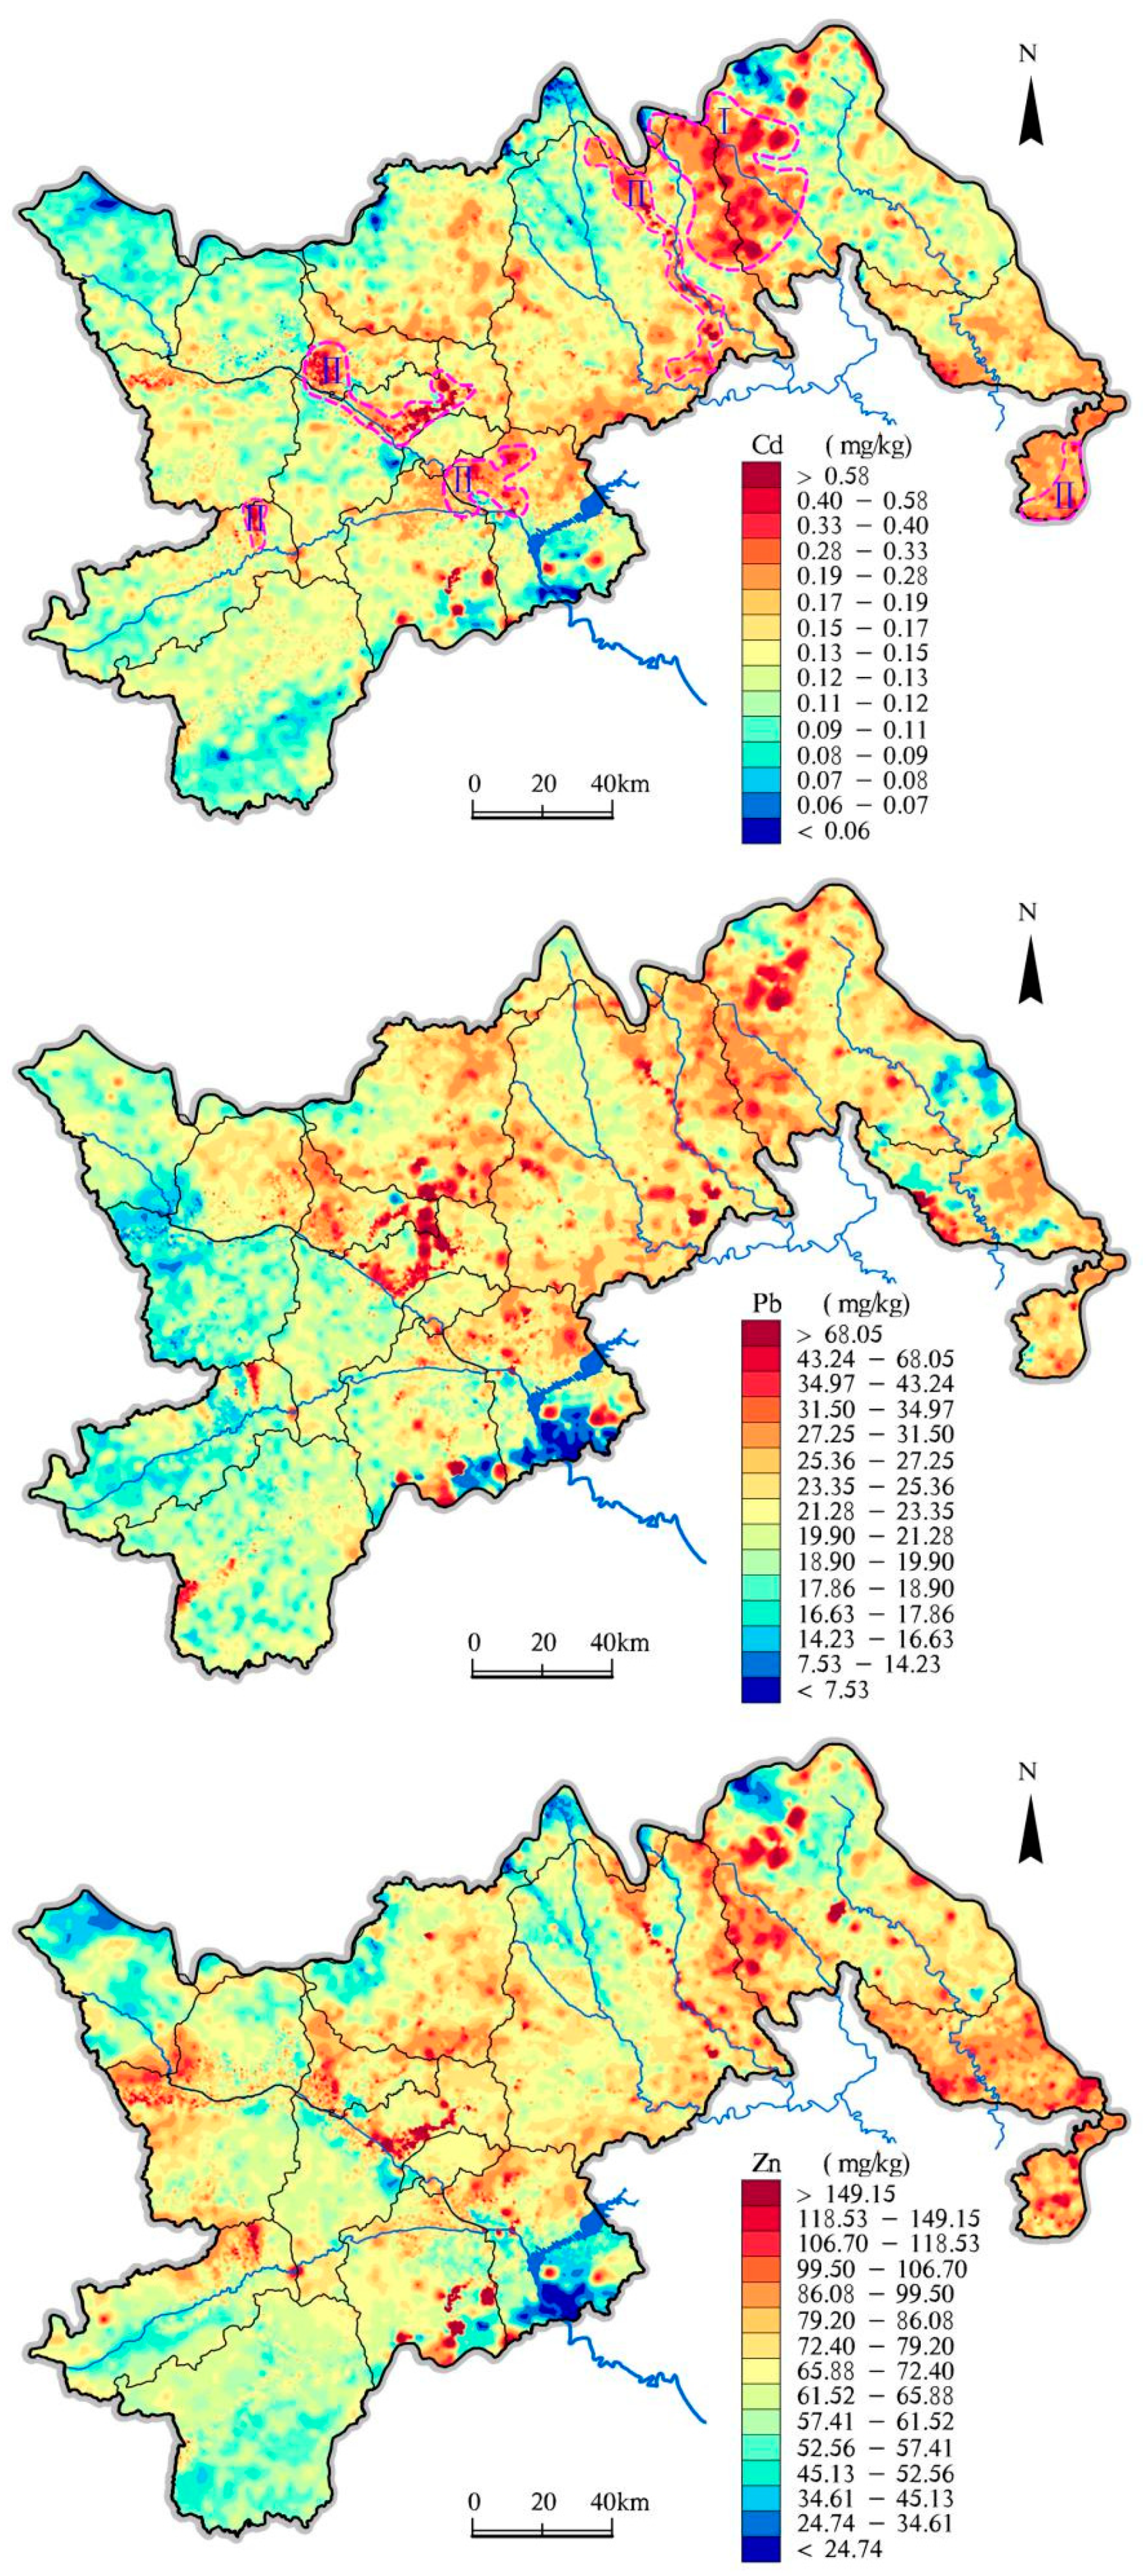
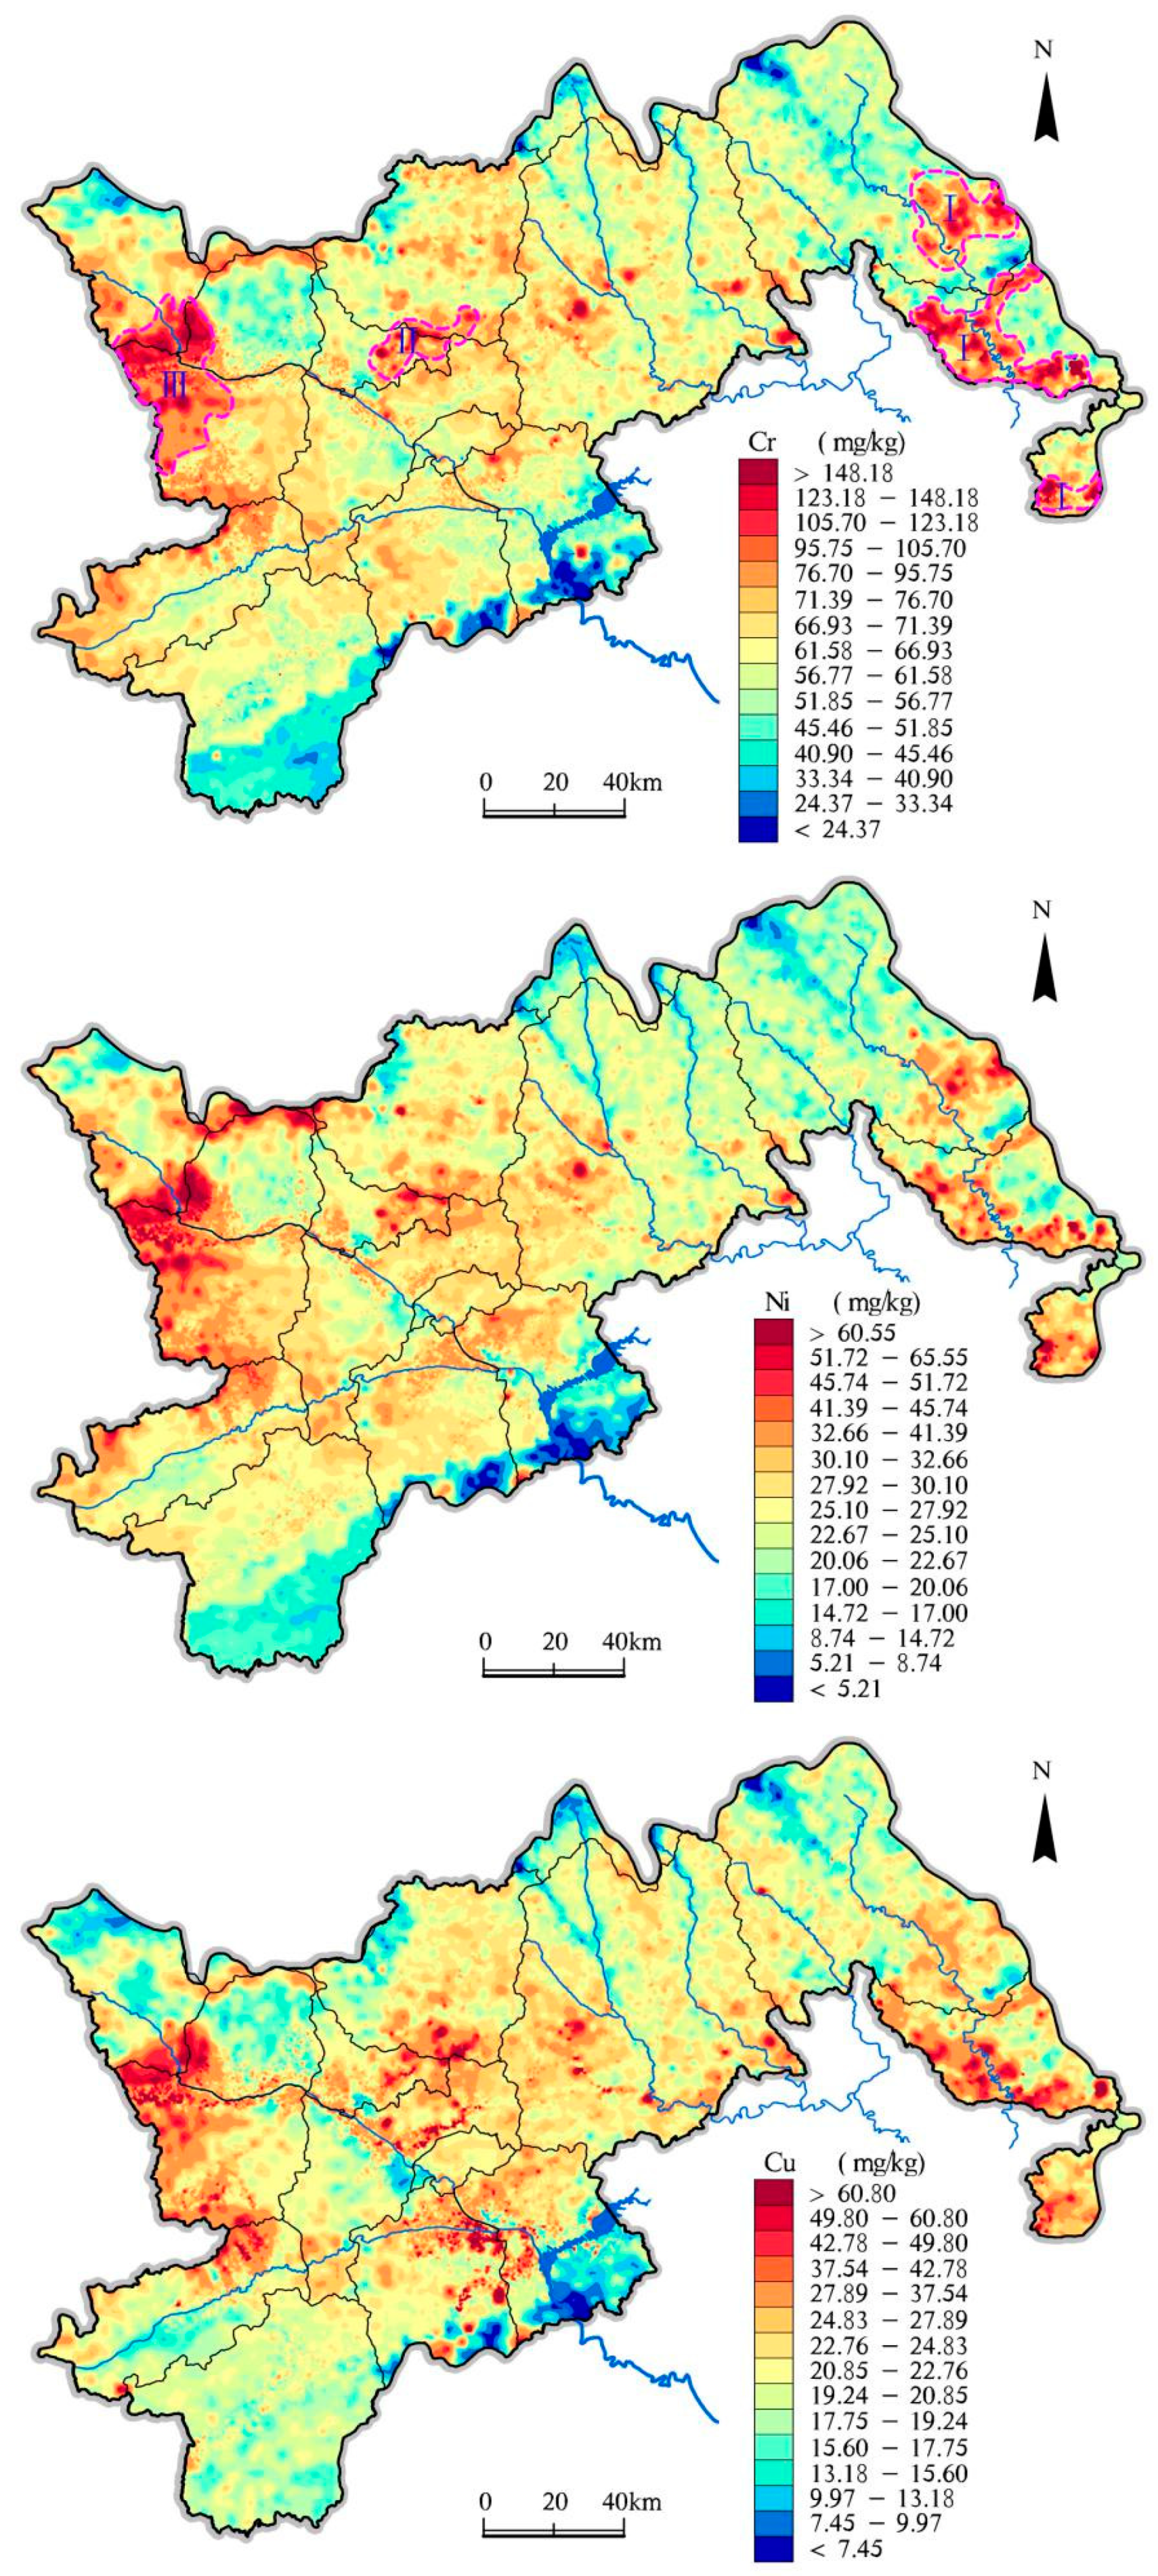
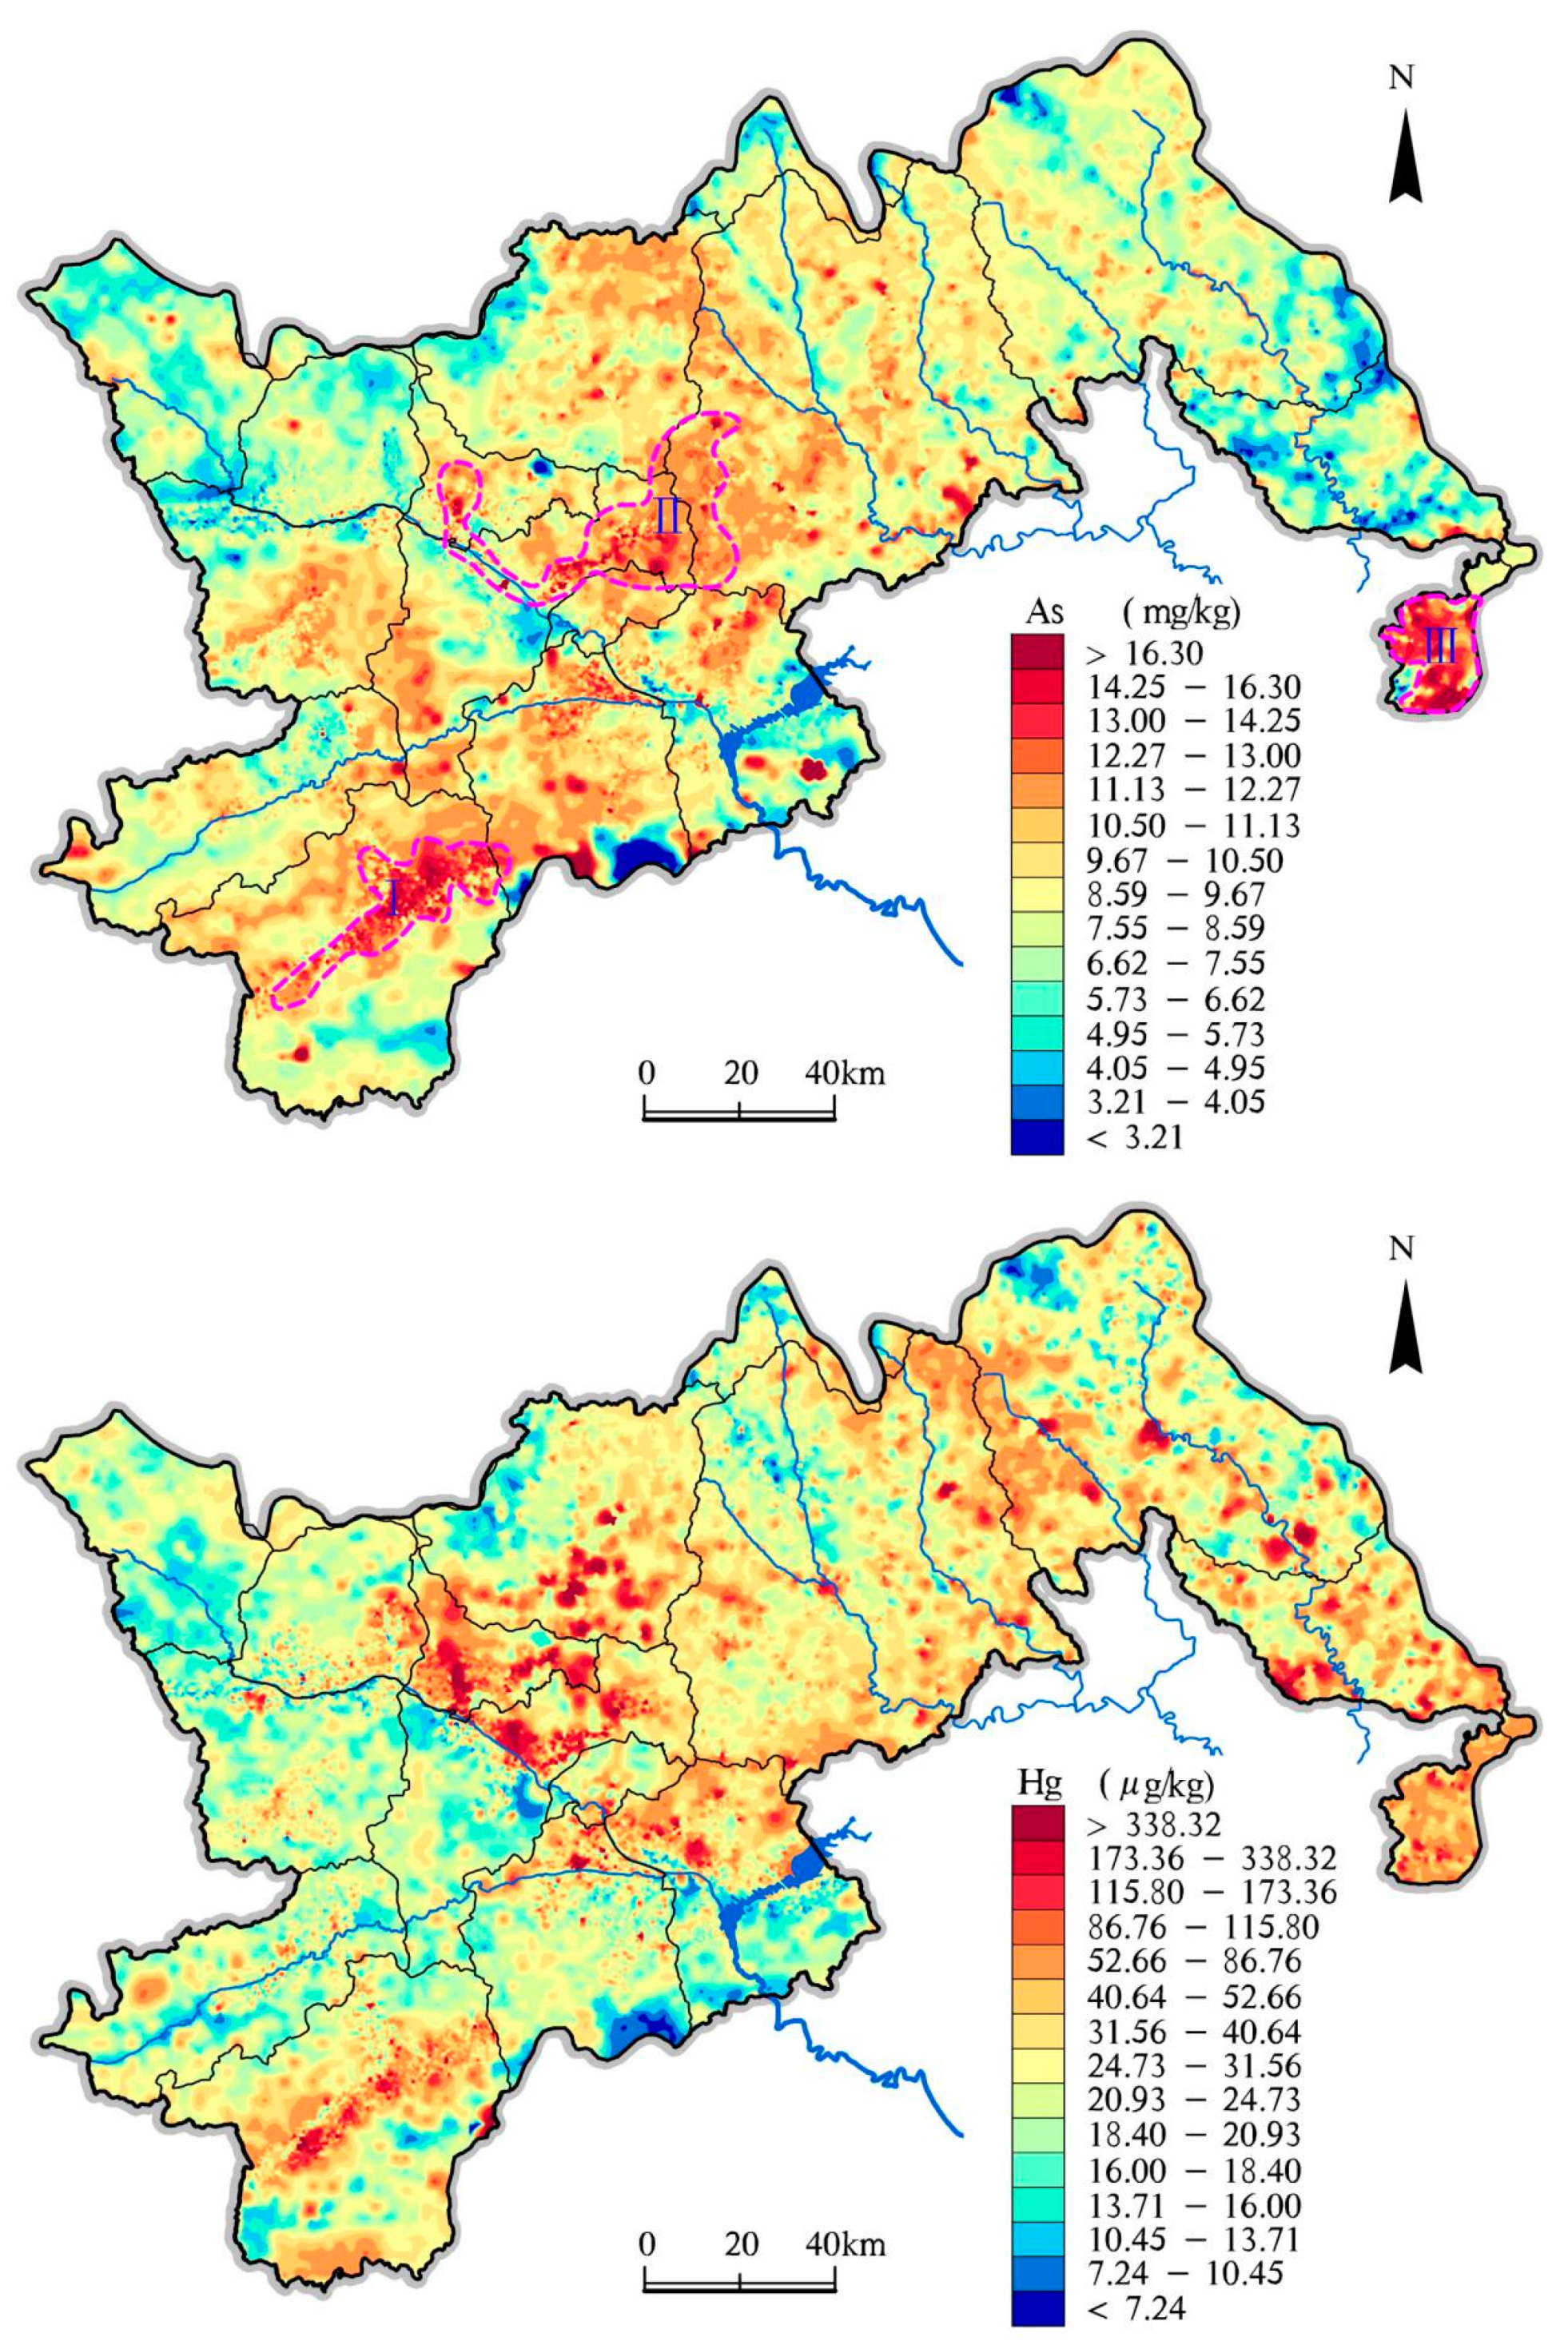
3.3. Spatial Distributions

Understanding the spatial distribution of the heavy metals in the soils is an important prerequisite for monitoring and evaluating the eco-environment in our study area. The spatial distributions of the heavy metals in the soils were visualized by drawing heavy metal distribution maps using ArcGIS (Figure 3, Figure 4 and Figure 5).
The maps exhibit several distinct geographic trends; the strongest trends are those of Cd and Pb. Hotspots for these two elements are found in two areas (Figure 4): at the junction of Fengning Manchu Autonomous County and Chicheng County (Area I) and north of the middle part of the Yanghe River system (Area II). The areas with low heavy metal contents are located in the surrounding middle and low mountain regions. In Area I, the average concentrations of Cd (0.25 mg kg−1), Pb (28.84 mg kg−1), and Zn (84.64 mg kg−1) were well above the average levels for the entirety of our study area. Area I contains 28.65% of the samples that exceeded the risk screening values for Cd. The samples with the maximum Cd, Pb, and Zn contents were all located in Area II; a significant proportion of the samples that exceeded the risk screening values for Cd (51.29%), Pb (68.18%), and Zn (51.72%) are also located in Area II.
Area I coincides with the known boundaries of the late Early Cretaceous quartz syenite porphyry unit. The types and concentrations of the elements in the soil are closely related to the parent materials of the soil. While human activities contribute to the spatial variability in the heavy metal concentrations, natural factors are the main cause of the larger heavy metal spatial distribution trends [31,32]. Based on contrast analysis of the quartz syenite porphyry and the surrounding granitic masses (Table 3), the Cd, Pb, and Zn concentrations of the quartz syenite porphyry are generally higher than those of the surrounding granite masses. For example, the average Cd concentration of the quartz syenite porphyry is 0.14 mg/kg, which is 2–5 times higher than those of the other surrounding rock masses. Because it is directly affected by the parent rock, the soil developed from the quartz syenite porphyry has higher Cd, Pb, and Zn concentrations. Furthermore, the Pb-Zn mining in this area has also contributed to higher concentrations of Cd, Pb, Zn, and Cu in the soil [7,33].
In contrast, we attribute the presence of heavy metals in Area II to human factors. In this area, there are a large number of coal-burning enterprises and coal yards. That is, the Datang International Power Plant, which supplies power to the capital city, Beijing, and four major coal mining areas including Xiahuayuan, Babaoshan of Huailai, Wujiagou of Zhuolu, and Yangjuan of Yuxian are all located in Area II. Due to coal combustion, sulfophilic elements such as Cd, Pb, and Zn will settle into the soil in the form of exhaust gas that transforms into atmospheric dust; the presence of this dust results in higher Cd, Pb, and Zn concentrations in Area II. By comparing the ratio values of the heavy metal concentrations in samples of the near-surface dust and the soil (Table 4), we determined that the high surface dust concentrations of Cd (4.89 mg/kg), Zn (5.14 mg/kg), and Pb (2.71 mg/kg) indicate that the enrichment of Cd, Pb, and Zn in Area II is caused by the aerial disbursement of coal combustion byproducts.
Additionally, the areas with high Cr, Cu, and Ni concentrations are closely aligned with the known locations of the Archean Qianxi Rock Group and the Chongli Lower Rock Group. The lithology of these units is granulite facies supracrustal rocks with iron-containing layers. The heavy metal hotspots are located in three areas: the Luanping area in the Chaobai River Basin (Area I), the Zhangjiakou City-Xuanhua District-Chongli District (Area II), and in Huaian County-Yangyuan County (Area III). The soil samples that exceeded the risk intervention values for Cr were all located in Area I. The average concentrations of Cr (91.32 mg kg−1), Cu (35.23 mg kg−1), and Ni (31.60 mg kg−1) were relatively high; it is unsurprising that many of the samples that exceeded the risk screening values for Cr (87.88%), Ni (90%), and Cu (33.53%) were also located in Area I. In contrast, relatively few samples in Area II and Area III exceeded the risk screening values for those elements.
Large-scale iron mining and smelting occur in these three areas. Among them, there are a large number of small sedimentary metamorphic iron ores in Area I. The small iron ores are distributed densely and contiguously, and open-pit mining activities took place around the year 2010. Secondly, Area II has large sedimentary rock iron ores such as the Zhaochuan Iron Mine and Pangjiabao Iron Mine. Thirdly, large metamorphic rock iron ores such as the Dukoubao Iron Mine can be found in Area III. Besides, tailings sands from the magnetic separation of iron mine were piled up arbitrarily at a large scale which will have a certain impact on the production environment. These activities have been shown to be significant sources of Cr. During the development and utilization of iron ore, the associated heavy metals (Cr, Ni, and Cu) are brought to the surface. Furthermore, the tailings produced during mineral processing are discarded at the surface, which facilitates the horizontal migration of elements such as Cr, Ni, and Cu and eventually results in the contamination of the surrounding soil.
The use of agrochemicals such as herbicides and livestock manure also contributes to Cu soil contamination. For example, due to the application of the Bordeaux mixture, a protective fungicide, the viticultural region of Huailai County has a high Cu concentration. This conclusion is validated by the conclusions of previous studies focusing on identifying the source(s) of Cu soil contamination [16,32,34].
The areas with high As and Hg concentrations correspond to the polluting enterprise zone, which forms clusters in three areas: along both sides of the Huliu River (Area I), the Zhangjiakou City-Xuanhua District-Chongli District (Area II), and the Chengde Xinglong coal mining area (Area III). The areas with lower Hg and As values are co-located with arborescent areas on both sides of the river, while the locations of the high-value Hg samples were more widely dispersed. In these three areas, 80.77% and 20% of the samples exceeded the risk intervention values for As and Hg, respectively.
Both As and Hg are sulfophiles. The major sources of the high As and Hg concentrations are industrial (smelting) emissions and coal combustion. In addition to the three aforementioned Hg hotspots, we also observe rings of high Hg concentrations centered on large- and medium-sized cities. These northern Chinese cities are powered by coal combustion, which eventually results in the atmospheric deposition of pollutants in the areas surrounding these large cities [32,35].

4. Conclusions

By investigating and analyzing the surface water sources of Beijing, China, we found that despite the relatively high Cd, Cu, Zn, and Cr contamination risk, the overall soil environment quality in our study area is excellent.
We determined that point sources are primarily responsible for the accumulation of heavy metals in our study area. For example, coal combustion results in high concentrations of Cd, Pb, Zn, and As in the soil, iron ore smelting is largely responsible for the Cr, Cu, and Ni in the soil, and human activities centered on large and medium cities result in the surficial deposition of Hg. Because it is difficult for heavy metal elements to migrate large distances physically or chemically, they are more likely to contaminate soils than they are to contaminate surface water sources. However, the high background heavy metal levels are not caused by non-point sources; the soil that is sourced from the late Early Cretaceous quartz syenite porphyry unit is enriched in Cd, Pb, and Zn, which directly impacts the heavy metal content of the surface water resources in this small watershed [36,37]. This issue will be further investigated and discussed in a follow-up study.
In this study, we examined the spatial distribution and the influencing factors of heavy metal contamination in farmland soils on the watershed scale. This work provides a scientific basis for the collaborative prevention and comprehensive control of heavy metal contamination in water and soil. The naturally high background heavy metal levels in the water source soil require more effort in terms of contamination risk control, detection, and supervision.

Author Contributions

Data curation, J.W. and X.Z.; Formal analysis, J.W., X.Z., J.L., G.Z., Y.Z., C.W. and Y.L.; Funding acquisition, J.W.; Investigation, J.W., X.Z., G.Z., Y.Z. and C.W.; Methodology, J.W., X.Z. and J.L.; Project administration, J.W.; Resources, J.W., X.Z., J.L., G.Z., Y.Z., C.W. and Y.L.; Supervision, J.L.; Writing—original draft, J.W., X.Z., G.Z., Y.Z., C.W. and Y.L.; Writing—review & editing, J.L. All authors have read and agreed to the published version of the manuscript.

Funding

This research was supported by the Hebei Provincial Department of Finance (grant number [2016] 826). The funders had no role in any part of this work, including the study design, the sample collection, the statistical analyses, the data interpretation, the manuscript composition, or the article submission.

Institutional Review Board Statement

Not applicable.

Informed Consent Statement

Not applicable.

Data Availability Statement

Not applicable.

Acknowledgments

We thank LetPub (www.letpub.com, accessed on 19 February 2021) for its linguistic assistance during the preparation of this manuscript.

Conflicts of Interest

The authors declare no conflict of interest.

Abbreviations

As, arsenic; CA, cluster analysis; Cd, cadmium; CNEMC, China National Environmental Monitoring Center; Cr, chromium; Cu, copper; CV, variation coefficient; GPS, Global Positioning System; Hg, mercury; IGGE of CAGS, the Institute of Geophysical and Geochemical Exploration of the Chinese Academy of Geological Sciences; Ni, nickel; Pb, lead; PCA, principal component analysis; Sb, antimony; SD, standard deviation; SRI, site rank index; WQS, standards for surface water; Zn, zinc.

References

  1. Chen, X.; Chen, X.; Wang, Y.; Wang, X.; Wang, M.; Liang, Y.; Zhu, G.; Jin, T. A nomogram for predicting the renal dysfunction in a Chinese population with reduction in cadmium exposure based on an 8 years follow up study. Ecotoxicol. Environ. Saf. 2020, 191, 110251. [Google Scholar] [CrossRef]
  2. Huang, J.; Peng, S.; Mao, X.; Li, F.; Guo, S.; Shi, L.; Shi, Y.; Yu, H.; Zeng, G. Source apportionment and spatial and quantitative ecological risk assessment of heavy metals in soils from a typical Chinese agricultural county. Process Saf. Environ. Prot. 2019, 126, 339–347. [Google Scholar] [CrossRef]
  3. Wang, Y.; Duan, X.; Wang, L. Spatial distribution and source analysis of heavy metals in soils influenced by industrial enterprise distribution: Case study in Jiangsu Province. Sci. Total Environ. 2020, 710, 134953. [Google Scholar] [CrossRef]
  4. Eze, P.N.; Udeigwe, T.K.; Stietiya, M.H. Distribution and potential source evaluation of heavy metals in prominent soils of Accra Plains, Ghana. Geoderma 2010, 156, 357–362. [Google Scholar] [CrossRef]
  5. Guo, G.; Wu, F.; Xie, F.; Zhang, R. Spatial distribution and pollution assessment of heavy metals in urban soils from southwest China. J. Environ. Sci. 2012, 24, 410–418. [Google Scholar] [CrossRef]
  6. Solgi, E.; Esmaili-Sari, A.; Riyahi-Bakhtiari, A.; Hadipour, M. Soil contamination of metals in the three industrial Estates, Arak, Iran. Bull. Environ. Contam. Toxicol. 2012, 88, 634–638. [Google Scholar] [CrossRef] [PubMed]
  7. Dudka, S.; Piotrowska, M.; Chlopecka, A.; Witek, T. Trace metal contamination of soils and crop plants by the mining and smelting industry in Upper Silesia, South Poland. J. Geochem. Explor. 1995, 52, 237–250. [Google Scholar] [CrossRef]
  8. Khosravi, Y.; Zamani, A.A.; Parizanganeh, A.H.; Yaftian, M.R. Assessment of spatial distribution pattern of heavy metals surrounding a lead and zinc production plant in Zanjan Province, Iran. Geoderma Reg 2018, 12, 10–17. [Google Scholar] [CrossRef]
  9. Li, S.; Zhao, B.; Jin, M.; Hu, L.; Zhong, H.; He, Z. A comprehensive survey on the horizontal and vertical distribution of heavy metals and microorganisms in soils of a Pb/Zn smelter. J. Hazard. Mater. 2020, 400, 123255. [Google Scholar] [CrossRef]
  10. Li, X.; Yang, H.; Zhang, C.; Zeng, G.; Liu, Y.; Xu, W.; Wu, Y.; Lan, S. Spatial distribution and transport characteristics of heavy metals around an antimony mine area in central China. Chemosphere 2017, 170, 17–24. [Google Scholar] [CrossRef] [PubMed]
  11. Loska, K.; Wiechuła, D.; Korus, I. Metal contamination of farming soils affected by industry. Environ. Int. 2004, 30, 159–165. [Google Scholar] [CrossRef]
  12. Srinivasa Gowd, S.; Ramakrishna Reddy, M.; Govil, P.K. Assessment of heavy metal contamination in soils at Jajmau (Kanpur) and Unnao industrial areas of the Ganga Plain, Uttar Pradesh, India. J. Hazard. Mater. 2010, 174, 113–121. [Google Scholar] [CrossRef] [PubMed]
  13. Cai, L.M.; Wang, Q.S.; Wen, H.H.; Luo, J.; Wang, S. Heavy metals in agricultural soils from a typical township in Guangdong Province, China: Occurrences and spatial distribution. Ecotoxicol. Environ. Saf. 2019, 168, 184–191. [Google Scholar] [CrossRef]
  14. Morton-Bermea, O.; Hernández-Álvarez, E.; González-Hernández, G.; Romero, F.; Lozano, R.; Beramendi-Orosco, L.E. Assessment of heavy metal pollution in urban topsoils from the metropolitan area of Mexico City. J. Geochem. Explor. 2009, 101, 218–224. [Google Scholar] [CrossRef]
  15. Pan, L.B.; Ma, J.; Wang, X.L.; Hou, H. Heavy metals in soils from a typical county in Shanxi Province, China: Levels, sources and spatial distribution. Chemosphere 2016, 148, 248–254. [Google Scholar] [CrossRef]
  16. Szolnoki, Z.; Farsang, A.; Puskás, I. Cumulative impacts of human activities on urban garden soils: Origin and accumulation of metals. Environ. Pollut. 2013, 177, 106–115. [Google Scholar] [CrossRef]
  17. Bednářová, Z.; Kalina, J.; Hájek, O.; Sáňka, M.; Komprdová, K. Spatial distribution and risk assessment of metals in agricultural soils. Geoderma 2016, 284, 113–121. [Google Scholar] [CrossRef]
  18. Dartan, G.; Taşpınar, F.; Toröz, İ. Assessment of heavy metals in agricultural soils and their source apportionment: A Turkish district survey. Environ. Monit. Assess 2015, 187, 99. [Google Scholar] [CrossRef] [PubMed]
  19. Shao, D.; Zhan, Y.; Zhou, W.; Zhu, L. Current status and temporal trend of heavy metals in farmland soil of the Yangtze River Delta Region: Field survey and meta-analysis. Environ. Pollut. 2016, 219, 329–336. [Google Scholar] [CrossRef] [PubMed]
  20. Wang, P.; Li, Z.; Liu, J.; Bi, X.; Ning, Y.; Yang, S.; Yang, X. Apportionment of sources of heavy metals to agricultural soils using isotope fingerprints and multivariate statistical analyses. Environ. Pollut. 2019, 249, 208–216. [Google Scholar] [CrossRef]
  21. Doyi, I.; Essumang, D.; Gbeddy, G.; Dampare, S.; Kumassah, E.; Saka, D. Spatial distribution, accumulation and human health risk assessment of heavy metals in soil and groundwater of the Tano Basin, Ghana. Ecotoxicol. Environ. Saf. 2018, 165, 540–546. [Google Scholar] [CrossRef] [PubMed]
  22. Wu, W.; Qu, S.; Nel, W.; Ji, J. The impact of natural weathering and mining on heavy metal accumulation in the karst areas of the Pearl River Basin, China. Sci. Total Environ 2020, 734, 139480. [Google Scholar] [CrossRef] [PubMed]
  23. Zhang, H.; Zeng, H.; Jiang, Y.; Xie, Z.; Xu, X.; Ding, M.; Wang, P. Using the compound system to synthetically evaluate the enrichment of heavy metal(loid)s in a subtropical basin, China. Environ. Pollut. 2020, 256, 113396. [Google Scholar] [CrossRef] [PubMed]
  24. Facchinelli, A.; Sacchi, E.; Mallen, L. Multivariate statistical and GIS-based approach to identify heavy metal sources in soils. Environ. Pollut. 2001, 114, 313–324. [Google Scholar] [CrossRef]
  25. Wang, S.; Cai, L.M.; Wen, H.H.; Luo, J.; Wang, Q.S.; Liu, X. Spatial distribution and source apportionment of heavy metals in soil from a typical county-level city of Guangdong Province, China. Sci. Total Environ. 2019, 655, 92–101. [Google Scholar] [CrossRef]
  26. Sun, L.; Guo, D.; Liu, K.; Meng, H.; Zheng, Y.; Yuan, F.; Zhu, G. Levels, sources, and spatial distribution of heavy metals in soils from a typical coal industrial city of Tangshan, China. Catena 2019, 175, 101–109. [Google Scholar] [CrossRef]
  27. Marrugo-Negrete, J.; Pinedo-Hernández, J.; Díez, S. Assessment of heavy metal pollution, spatial distribution and origin in agricultural soils along the Sinú River Basin, Colombia. Environ. Res. 2017, 154, 380–388. [Google Scholar] [CrossRef]
  28. Cai, L.; Xu, Z.; Ren, M.; Guo, Q.; Hu, X.; Hu, G.; Wan, H.; Peng, P. Source identification of eight hazardous heavy metals in agricultural soils of Huizhou, Guangdong Province, China. Ecotoxicol. Environ. Saf. 2012, 78, 2–8. [Google Scholar] [CrossRef] [PubMed]
  29. Franco-Uría, A.; López-Mateo, C.; Roca, E.; Fernández-Marcos, M.L. Source identification of heavy metals in pastureland by multivariate analysis in NW Spain. J. Hazard. Mater. 2009, 165, 1008–1015. [Google Scholar] [CrossRef]
  30. Lv, J.; Liu, Y.; Zhang, Z.; Dai, J.; Dai, B.; Zhu, Y. Identifying the origins and spatial distributions of heavy metals in soils of Ju country (Eastern China) using multivariate and geostatistical approach. J. Soils Sediments 2015, 15, 163–178. [Google Scholar] [CrossRef]
  31. Nanos, N.; Rodríguez Martín, J.A. Multiscale analysis of heavy metal contents in soils: Spatial variability in the Duero river basin (Spain). Geoderma 2012, 89–90, 554–562. [Google Scholar] [CrossRef]
  32. Rodríguez, J.A.; Nanos, N.; Grau, J.M.; Gil, L.; López-Arias, M. Multiscale analysis of heavy metal contents in Spanish agricultural topsoils. Chemosphere 2008, 70, 1085–1096. [Google Scholar] [CrossRef] [PubMed] [Green Version]
  33. Stefanowicz, A.M.; Woch, M.W.; Kapusta, P. Inconspicuous waste heaps left by historical Zn–Pb mining are hot spots of soil contamination. Geoderma 2014, 235–236, 1–8. [Google Scholar] [CrossRef]
  34. Sun, C.; Liu, J.; Wang, Y.; Sun, L.; Yu, H. Multivariate and geostatistical analyses of the spatial distribution and sources of heavy metals in agricultural soil in Dehui, Northeast China. Chemosphere 2013, 92, 517–523. [Google Scholar] [CrossRef]
  35. Lu, A.; Wang, J.; Qin, X.; Wang, K.; Han, P.; Zhang, S. Multivariate and geostatistical analyses of the spatial distribution and origin of heavy metals in the agricultural soils in Shunyi, Beijing, China. Sci. Total Environ. 2012, 425, 66–74. [Google Scholar] [CrossRef]
  36. Ouyang, W.; Wang, Y.; Lin, C.; He, M.; Hao, F.; Liu, H.; Zhu, W. Heavy metal loss from agricultural watershed to aquatic system: A scientometrics review. Sci. Total Environ. 2018, 637–638, 208–220. [Google Scholar] [CrossRef] [PubMed]
  37. Rey, J.; Martínez, J.; Hidalgo, M.C.; Rojas, D. Heavy metal pollution in the Quaternary Garza basin: A multidisciplinary study of the environmental risks posed by mining (Linares, southern Spain). Catena 2013, 110, 234–242. [Google Scholar] [CrossRef]
Figure 1. Map of land use types.
Sustainability 13 03719 g001
Figure 2. Dendrogram results for eight heavy metals obtained using the Ward method of hierarchical cluster analysis.
Sustainability 13 03719 g002
Figure 3. Geochemical maps of cadmium (Cd), lead (Pb), and zinc (Zn) contents.
Sustainability 13 03719 g003
Figure 4. Geochemical maps of chromium (Cr), nickel (Ni), and copper (Cu) contents.
Sustainability 13 03719 g004
Figure 5. Geochemical maps for arsenic (As) and mercury (Hg) contents.
Sustainability 13 03719 g005
Table 1. Descriptive statistics of the heavy metal concentrations (mg kg−1) in our soil samples.
MaximumMinimumMedianMeanSDCVBackground Concentrations
Zn2700.007.6967.7072.0835.530.4978.4
Cr1258.007.5062.8065.0417.970.2868.3
Pb999.002.4022.0023.3713.540.5821.5
Ni177.003.0027.5028.057.910.2830.8
Cu354.002.2922.5025.0611.200.4521.8
Cd6.890.040.140.160.130.820.094
Hg4.4300.0030.0280.0460.0932.030.036
As148.000.359.539.402.910.3113.6
pH10.274.668.448.290.590.07--
Abbreviations: As, arsenic; Cd, cadmium; Cr, chromium; Cu, copper; CV, variation coefficient; Hg, mercury; Ni, nickel; Pb, lead; SD, standard deviation; Zn, zinc.
Table 2. Total variance of the contents of eight heavy metals in the soil samples in our study area.
ComponentInitial eigENVALUEsExtraction Sums of Squared LoadingsRotation Sums of Squared Loadings
Total% of VarianceCumulative%Total% of VarianceCumulative%Total% of VarianceCumulative%
12.90536.30936.3092.90536.30936.3092.37529.69229.692
21.76922.11258.4211.76922.11258.4212.29828.73058.421
30.97512.18870.6090.97512.18870.6091.22915.36170.609
40.86610.82481.433
50.6958.68390.117
60.4075.09195.208
70.2433.03498.242
80.1411.758100.000
Table 3. Comparison of the Cd, Pb, Zn, and Cu concentrations (mg/kg) of the quartz syenite porphyry unit and its surrounding granitic masses.
Rock MassCdPbZnCu
Chicheng Baicai quartz syenite porphyry0.14079.86168.598.68
Chicheng Sandaogou granite0.05316.7052.376.73
Fengning Nanhou granite0.03418.4038.265.32
Fengning Laohugou granite0.05817.1630.905.43
Fengning Heishanzui monzonite porphyry0.08731.7678.135.24
Fengning Pingdingshan granite0.03722.8548.999.05
Chicheng Bingshanliang monzonite granite0.04223.3018.336.67
Fengning Jizhazi granite0.03120.8532.255.69
Fengning Shangyingzi granite0.03723.3233.919.37
Abbreviations: Cd, cadmium; Cu, copper; Pb, lead; Zn, zinc.
Table 4. Comparison of heavy metal contents in the near-surface dust and the soil around coal-burning enterprises.
ElementsAsCdCrCuHgNiPbZn
Mean element content value of the near-surface dust9.551.32172.5456.960.09641.8999.63729.37
Mean element content value of the soil9.790.276937.440.09132.0136.75141.94
Ratio0.984.892.501.521.051.312.715.14
Abbreviations: As, arsenic; Cd, cadmium; Cr, chromium; Cu, copper; Hg, mercury; Ni, nickel; Pb, lead; Zn, zinc.
Publisher’s Note: MDPI stays neutral with regard to jurisdictional claims in published maps and institutional affiliations.

