Article

The Management of Polymer and Biodegradable Composite Waste in Relation to Petroleum-Based Thermoplastic Polymer Waste—In Terms of Energy Consumption and Processability

by
Tomasz Stachowiak
1,* and
Katarzyna Łukasik
2
1
Faculty of Mechanical Engineering and Computer Science, Czestochowa University of Technology, 42-201 Częstochowa, Poland
2
Faculty of Management, Czestochowa University of Technology, 42-201 Czestochowa, Poland
*
Author to whom correspondence should be addressed.
Sustainability 2021, 13(7), 3701; https://doi.org/10.3390/su13073701
Submission received: 21 February 2021 / Revised: 19 March 2021 / Accepted: 21 March 2021 / Published: 26 March 2021
(This article belongs to the Special Issue Sustainable Development of Building Process Cycle on the Environment)

Abstract

:
The article presents a comparative analysis of the flow and utilisation of biodegradable polymer waste in relation to the waste of petroleum-based thermoplastic polymers. It compares energy expenditures and the costs of the reutilisation of both types of plastics in industrial applications. The performed studies and an analysis of the yielded results enabled the acquisition of real data involving the subject of managing petroleum-based plastic waste after the end of its life cycle, as well as biodegradable plastic waste, over the recent years, which is the main purpose of the study. So far, this subject has not been analysed very frequently, and, considering climate change, the predatory economy and the growing population of our planet, it is becoming an important topic, within the scope of which it is necessary to develop a new approach and new solutions regarding legal regulations and social awareness, as well as the technological possibilities of their implementation. The authors’ own research will indicate factual results related to managing various types of waste, based on the example of data acquired from a company involved in the retreatment of plastics and give answers to bothering questions such as: Is there an impact of retreatment on technological indicators defined by means of the mass flow rate? Is the retreatment of biodegradable plastics justified in terms of economy, energy and ecology? Is the retreatment of biodegradable plastics efficient?

1. Introduction

Nowadays, the plastic industry is facing the challenge of efficient waste management aimed at minimising the degradation of the natural environment. It is believed that the main issues that require actions for the abovementioned purpose include, e.g., the reduction of the regular release of greenhouse gases, paying attention to the shortage of space available for waste removal (escalating accumulation of waste materials), or the use of natural deposits for the production of plastics. The reduction of these effects, which are detrimental to the natural environment, primarily comes down to proper waste management, which is being demanded by the anxious society, and which results in strategies established under domestic public policy, strictly related to the institutional, legal, political and economic context of every country [1]. The EU has one of the world’s highest environmental standards, developed over the course of decades. Its environmental policy helps to make the EU’s economy more environmentally friendly; it protects the natural resources of Europe and guarantees the health and well-being of the EU’s inhabitants (articles 11 and 191–193) [2]; in spite of this, the statistical data presented in the following part of the paper indicates that the effects of waste management are still quite controversial and require even more radical actions for more efficient waste management in Europe. These actions must lead to the offering of solutions favouring sustainable management of waste, simultaneously promoting its recycling and efficient conversion of waste into energy and other precious chemicals [3]. These conversion procedures can be reached via the use of biological processes, such as anaerobic decomposition, or thermochemical procedures, such as pyrolysis. The following paper shows which results of the above have already been achieved.

2. Review of the Literature

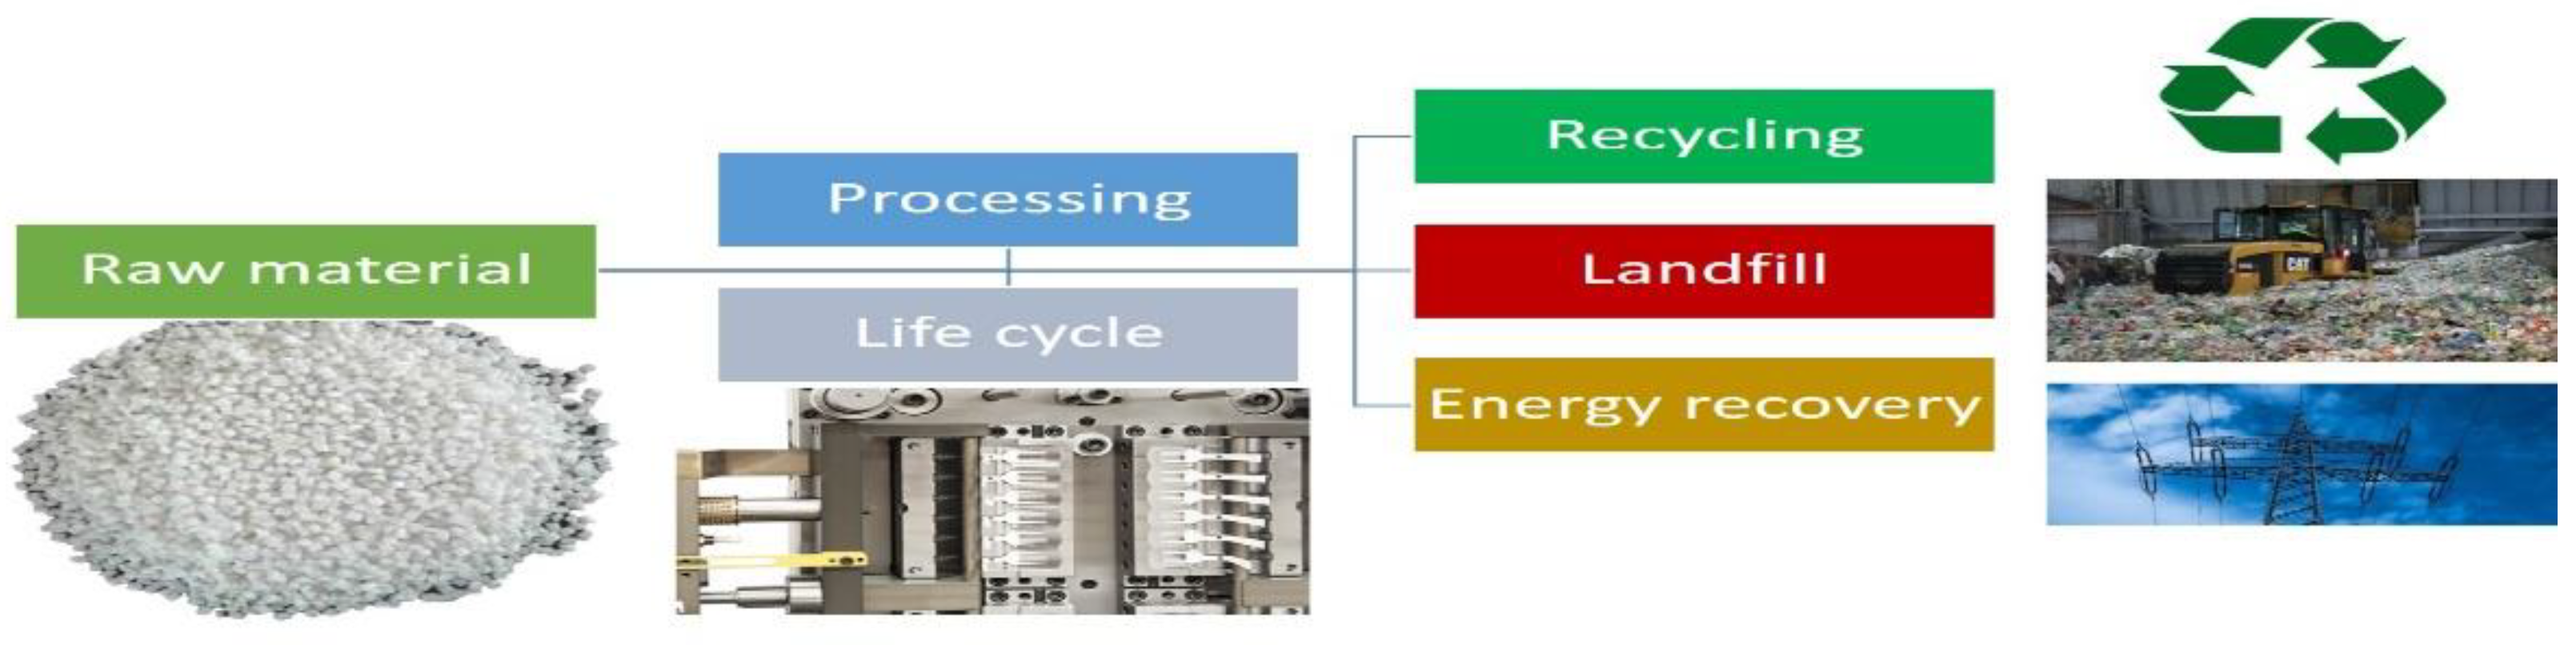
2.1. Waste Management

Currently, the system of waste management (WM) and disposal in various industries is considered to be one of the most important issues of environmental management [4]. Since efficient WM is of key significance for sustainable development [5,6], its efficiency constitutes a basis for environmental policy all over the world [7], and the world of politics and industry is considering newer and newer methods for the recycling of plastics [8], or their application to energy recovery, limiting the development of waste plastic landfills (Figure 1); this primarily involves polymers, polymer materials and polymer composites contaminated with additional substances, all of which are hard to process [9]. Due to the above, the studies of waste management are pursued at a large scale both in Europe and in the world [10,11,12,13,14]. What is equally important is that the commonly used waste management methods presented in Figure 1 do not always work to the same advantageous extent during waste retreatment.
WM methods should complement each other; e.g., energy recovery is a necessary, fully functional method for utilising waste plastics, complementary to recycling, enabling full utilisation of the potential of waste for the production of energy and heat [15]. Recycling may prove to be unecological and uneconomic for the recovery of certain plastics, due to various factors limiting the capabilities of recycling [16,17]:
  • The magnitude and quality (homogeneity, purity, toxicity) of the waste stream gathered under selective collection,
  • Available sorting technologies,
  • Market demand for products recovered from plastic waste and the requirements concerning their quality.
Solid waste management is a problem of EU politicians, as well as, primarily, most contemporary production companies, especially from the industry of artificial materials. With the minimisation of traditional landfilling, plastics are currently undesirable for the environment. Moreover, there is a problem of the generation of enormous amounts of polymer waste in certain countries of the EU. Most solid polymers (plastics) are used as protective coatings of everyday items, packaging, bottles, and electronic devices. The ability to design polymer materials with varying properties causes them to also serve an important function in the development of medicine or the transport industry (aviation, automotive, space industry). In most cases, they are designed and manufactured to be resistant to environmental degradation, including biodegradation, which is their greatest drawback. However, plastics are still more economical than metals, wood and glass in terms of the costs of their production, the weight to strength ratio and the amount of required energy and water; on the other hand, they are produced from petroleum, which is a non-renewable material whose resources may be depleted in the near future, which in fact generates a number of problems and causes the polymer waste management to be an urgent matter that requires the rapid development of newer and newer environmentally friendly solutions at a long-term scale [18].
This is because the production of plastics increased rapidly over only several decades from 1.5 million tonnes in 1950 to 359 million tonnes in 2018 globally. It was accompanied by an increase in the amount of plastic waste [19]. Currently, plastic waste constitutes a major problem all over the world [20]. Its scale is presented by the studies according to which as many as 75% of plastics produced so far currently constitute waste. To convert this data to numbers, it means as many as 6.3 billion tonnes of plastic trash [21,22,23,24]. In 2015, around 55% of global plastic waste was discarded, 25% was incinerated, and 20% was recycled [16]. However, in Europe during 2017, 32.5% of plastic waste was recycled, 42.6% was recovered through energy recovery processes and 24.9% was landfilled [25]. The statistics related to the reuse of these plastics are not any better; less than 10% of them were recycled and only 12% underwent energy recovery. The remaining part, which is approximately 5 billion tonnes, are currently dumped in landfills and in various places not intended for this, such as forests, meadows, illegal landfills and beaches, with the greatest damage being done by waste stored in the marine environment. Therefore, if the current production trends are maintained, then by 2050, plastics may be responsible for 20% of petroleum consumption, 15% of greenhouse gas emissions, and there may be more plastics than fish in the sea [26].
Disposable plastic packaging, used mainly in the food industry, generate the greatest amount of plastic waste. Among them, one should list packaging, such as shopping bags made of polyethylene and polypropylene, lunch bags and various kinds of wrappings, as well as PET (Poly (ethylene terephthalate)) bottles [27]. It is not only the food industry that uses plastics in its activities; in fact, this phenomenon is also noticed in other industries, e.g., packaging, building and construction, automotive, electrical and electronics, household, leisure and sport, agriculture and others.
In the world, only 14% of used polymer packaging is currently being recycled; this number reflects the economic challenges resulting from the implemented collection and post-consumer processing of diverse packaging materials and formats, often using insufficiently developed systems of post-consumer utilisation [28]. While thermoplastics, constituting approximately 78% by mass of all plastic waste, can be easily recycled and consist mainly of polyolefins, such as PP (Polypropylene), PE (Polyethylene), PVC (polyvinyl chloride) and PS (polystyrene), the remaining part includes thermosetting plastics, which are not so easily recyclable [29]. Due to the unified effort aimed at new designs and systems of post-consumer utilisation, recycling can become an economically appealing alternative for the remaining 50% of polymer packaging. Although the viability of recycling is higher for certain types of packaging, such as, e.g., PET bottles, in general, the cost of segregation and other activities outweighs the income. In Europe, it is estimated that this cost ranges from 170 to 250 dollars per one tonne of collected waste, considering the average value resulting from the diversification of the collection and segregation systems, legal environment, geographical conditions and package types. However, this does not include additional ecological and social benefits of polymer recycling, such as: the limited emission of greenhouse gases, lower impact on the natural environment (soil and air quality) and the creation of jobs. For example, collecting one tonne of waste for recycling allows avoiding the emission of one tonne of CO2 equivalent (compared to storage and combustion for energy recovery). This translates into a social value of about 100 dollars per one tonne of waste collected with the intention of recycling [30].
Europe is facing a challenge, because, according to the European Commission, by 2030, all plastic packaging in the EU will be reusable or recyclable in a feasible manner, and more than half of all plastic waste generated in Europe will be recycled [31]. The EU’s policy concerning waste is clear—the establishment of a circular economy, in which materials and resources are maintained in management for as long as possible, and where waste disposal is the final option of waste management, which constitutes progress towards more recycling and a smaller amount of stored waste [32].

2.2. Statistical Data-Scale of the WM Problem

Therefore, it is the intention of the EU’s waste management policy to reduce the impact of waste on the environment and health, as well as to improve the efficiency of the utilisation of the EU’s resources. The long-term goal of these policies involves reducing the amounts of the generated waste, and when it cannot be avoided, promoting it as a resource and reaching higher levels of recycling and safe waste removal. Hazardous waste can pose an elevated risk to human health and the environment if it is not managed and removed in a safe manner. Among all waste generated in the EU in 2016, 94.7 million tonnes (4.2% of all) were categorised as hazardous waste [33].
In 2016, approximately 2097 million tonnes of waste were processed in the EU. This does not include exported waste, but it does include the treatment of waste imported into the EU, which is why the declared amount cannot be directly compared to data involving the generation of waste.
Figure 2 presents the development of waste treatment in the EU in a general aspect, as well as the two main categories of treatment—recovery and disposal—in the years 2004 to 2016. The amount of waste that is being recovered, meaning subjected to recycling, used for backfilling (the use of waste in excavated areas for the restoration of escarpments or for safety, or for engineering purposes in landscaping), or burnt for energy recovery, increased by 26.7% from 870 million tonnes in 2004 to 1103 million tonnes in 2016. As a result, the share of such recovery in all of waste treatment increased from 45.9% in 2004 to 52.6% in 2016. The amount of waste subjected to disposal decreased from 1027 million tonnes in 2004 to 995 million tonnes in 2016, which constitutes a drop by 3.1%. The overall share of waste disposal dropped from 54.1% in 2004 to 47.4% in 2016.
Referring to the considerations of plastic waste management, it is estimated that approximately 42% of plastic packaging waste were recycled in 2017 in the EU. In seven member states of the EU, more than half of the exported plastic packaging waste was recycled in 2017 (Figure 3).
Compared to 2005, the recycling rate of plastic packaging waste in the EU increased by 18% (from 24% in 2005 to 42% in 2017). This upward trend is observed with various intensities in all member states of the EU, except Croatia. In 2017, each inhabitant of the EU accounted for 173.8 kg of packaging waste. This value ranged from 63.9 kg per inhabitant in Croatia to 230.9 kg per inhabitant in Luxembourg. The highest shares corresponded to paper and cardboard (41%), plastics (19%), glass (18%), wood (17%) and the common types of packaging waste in the EU.
On the other hand, compared to 2016, the amount of packaging waste generated in 2017 increased by 2.9%. The amount of recycled packaging waste and recovered packaging waste increased by 2.8%, respectively. While the amount of generated packaging waste increased by 7.4% in the years 2007 to 2017, both its recycling (+22.5%) and recovery (+18.8%) in 2017 were considerably higher than in 2007 (Figure 4).

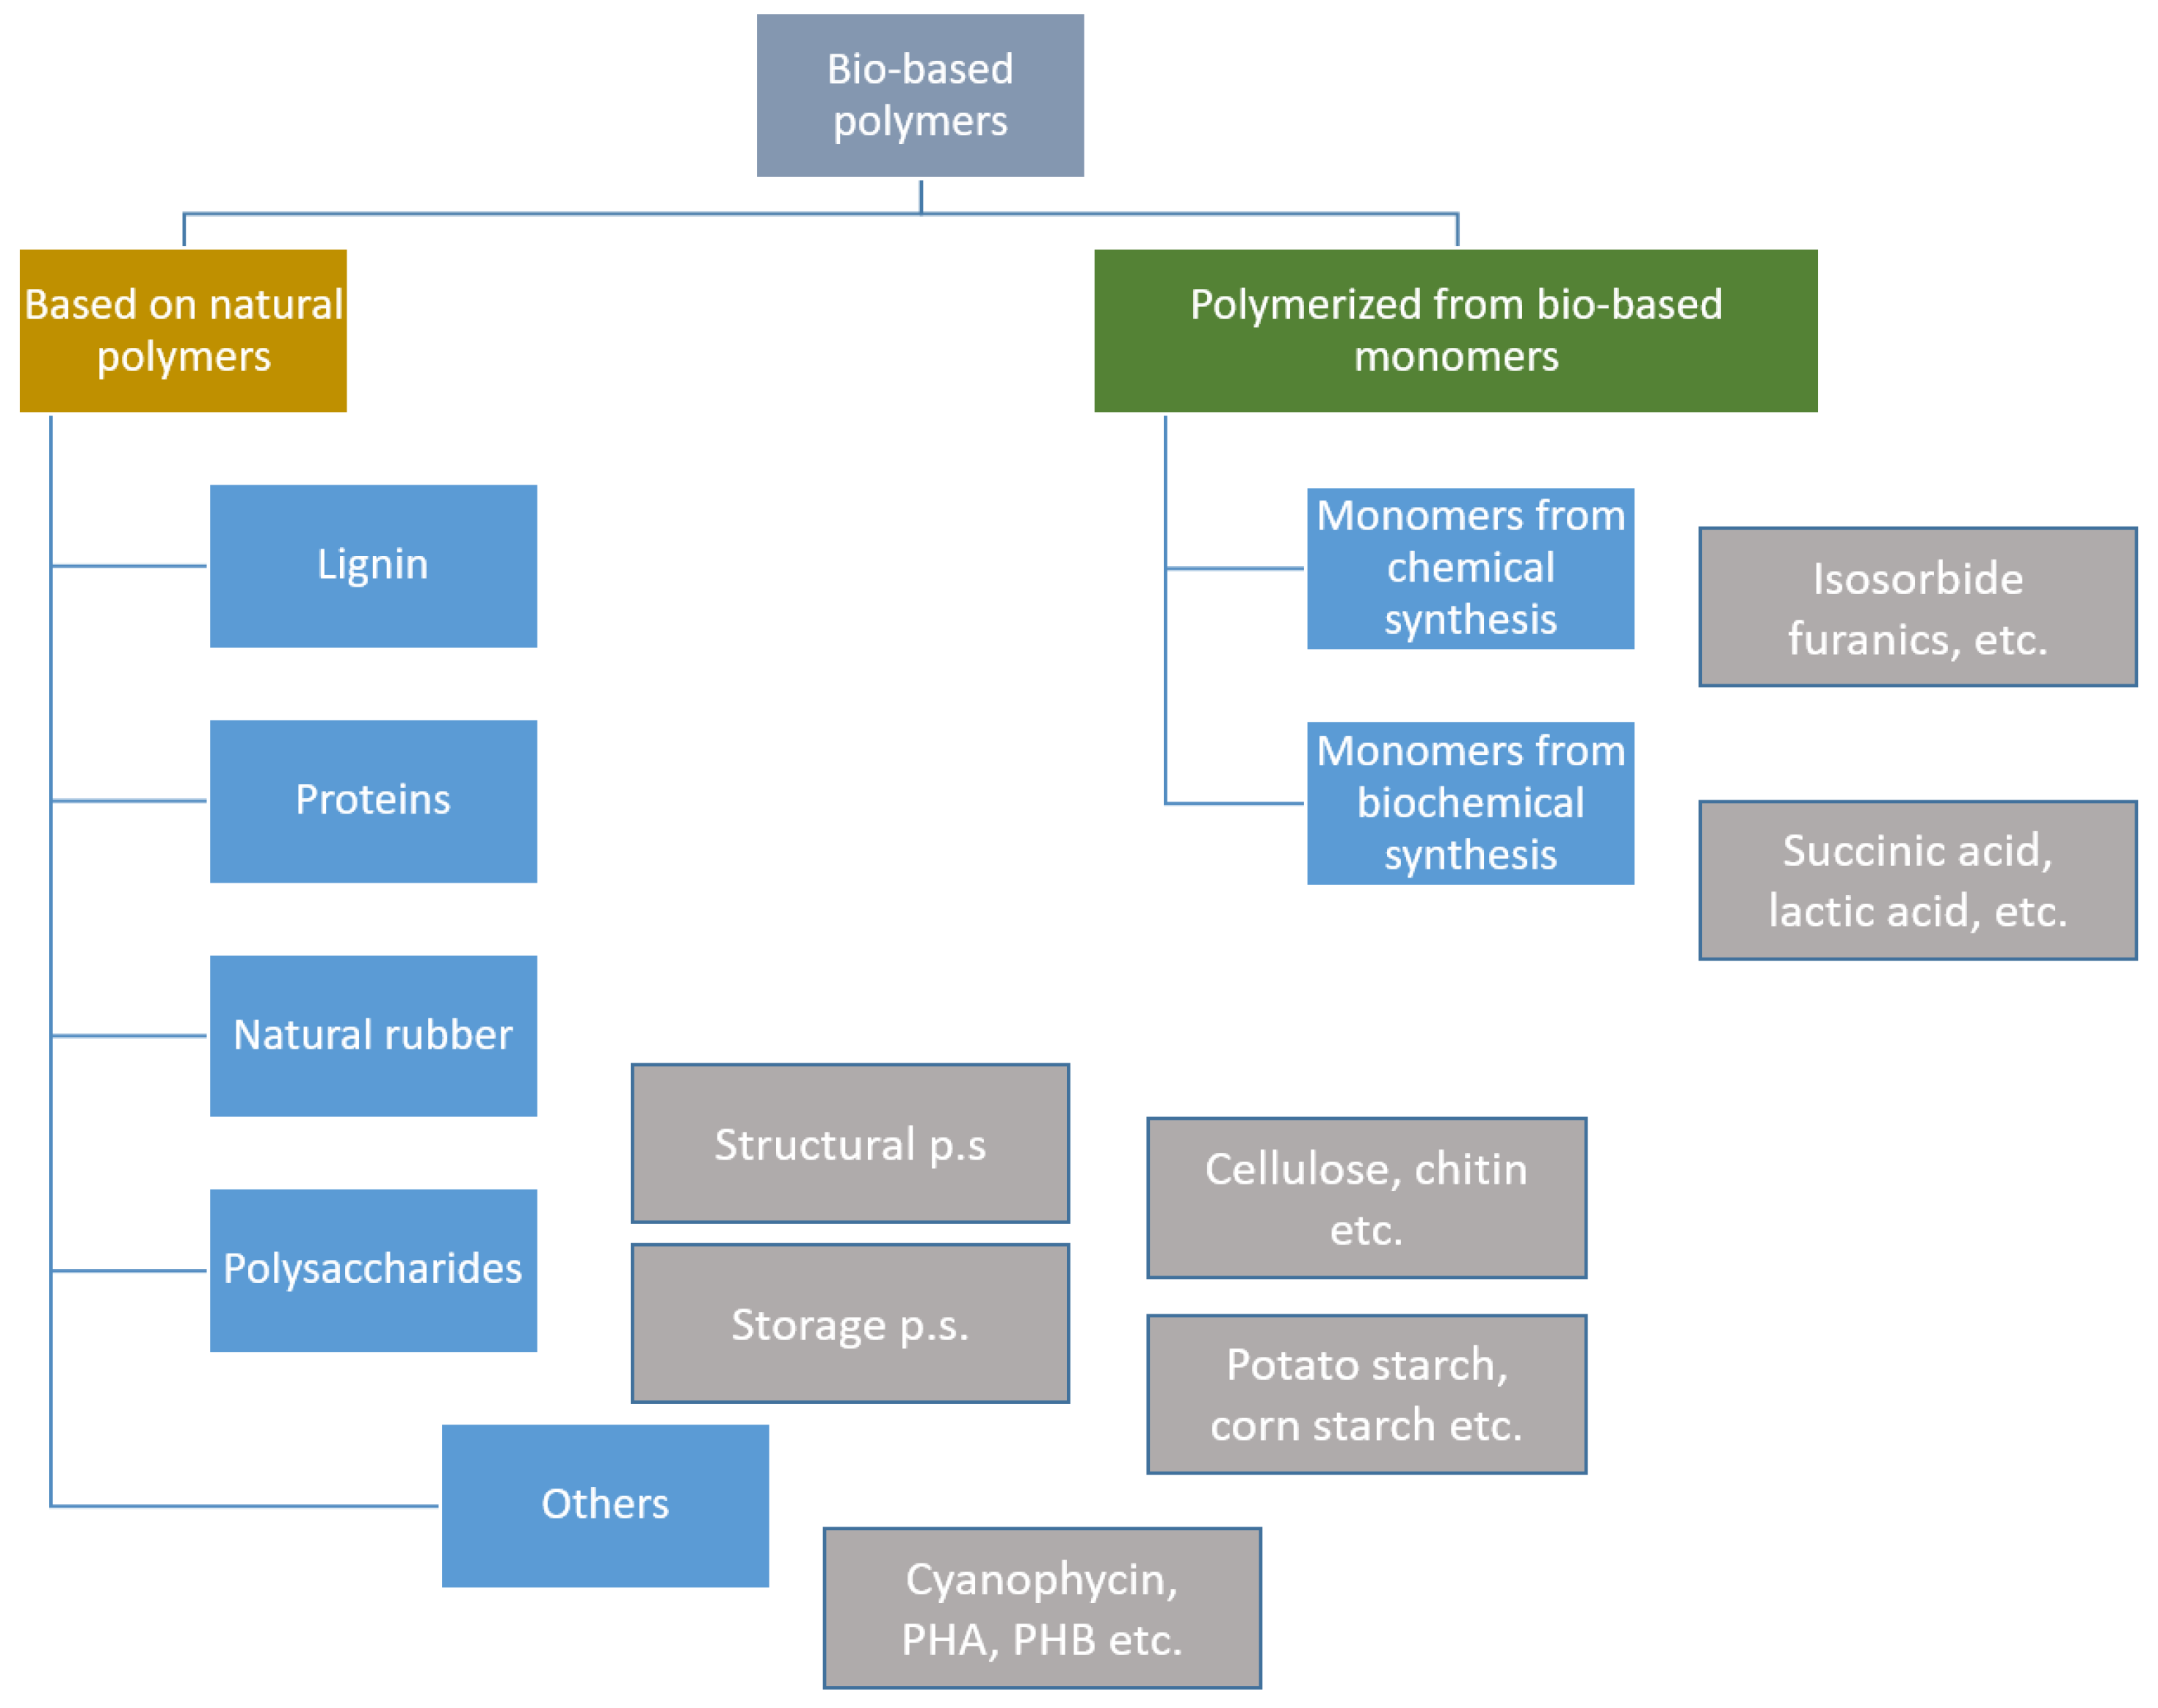
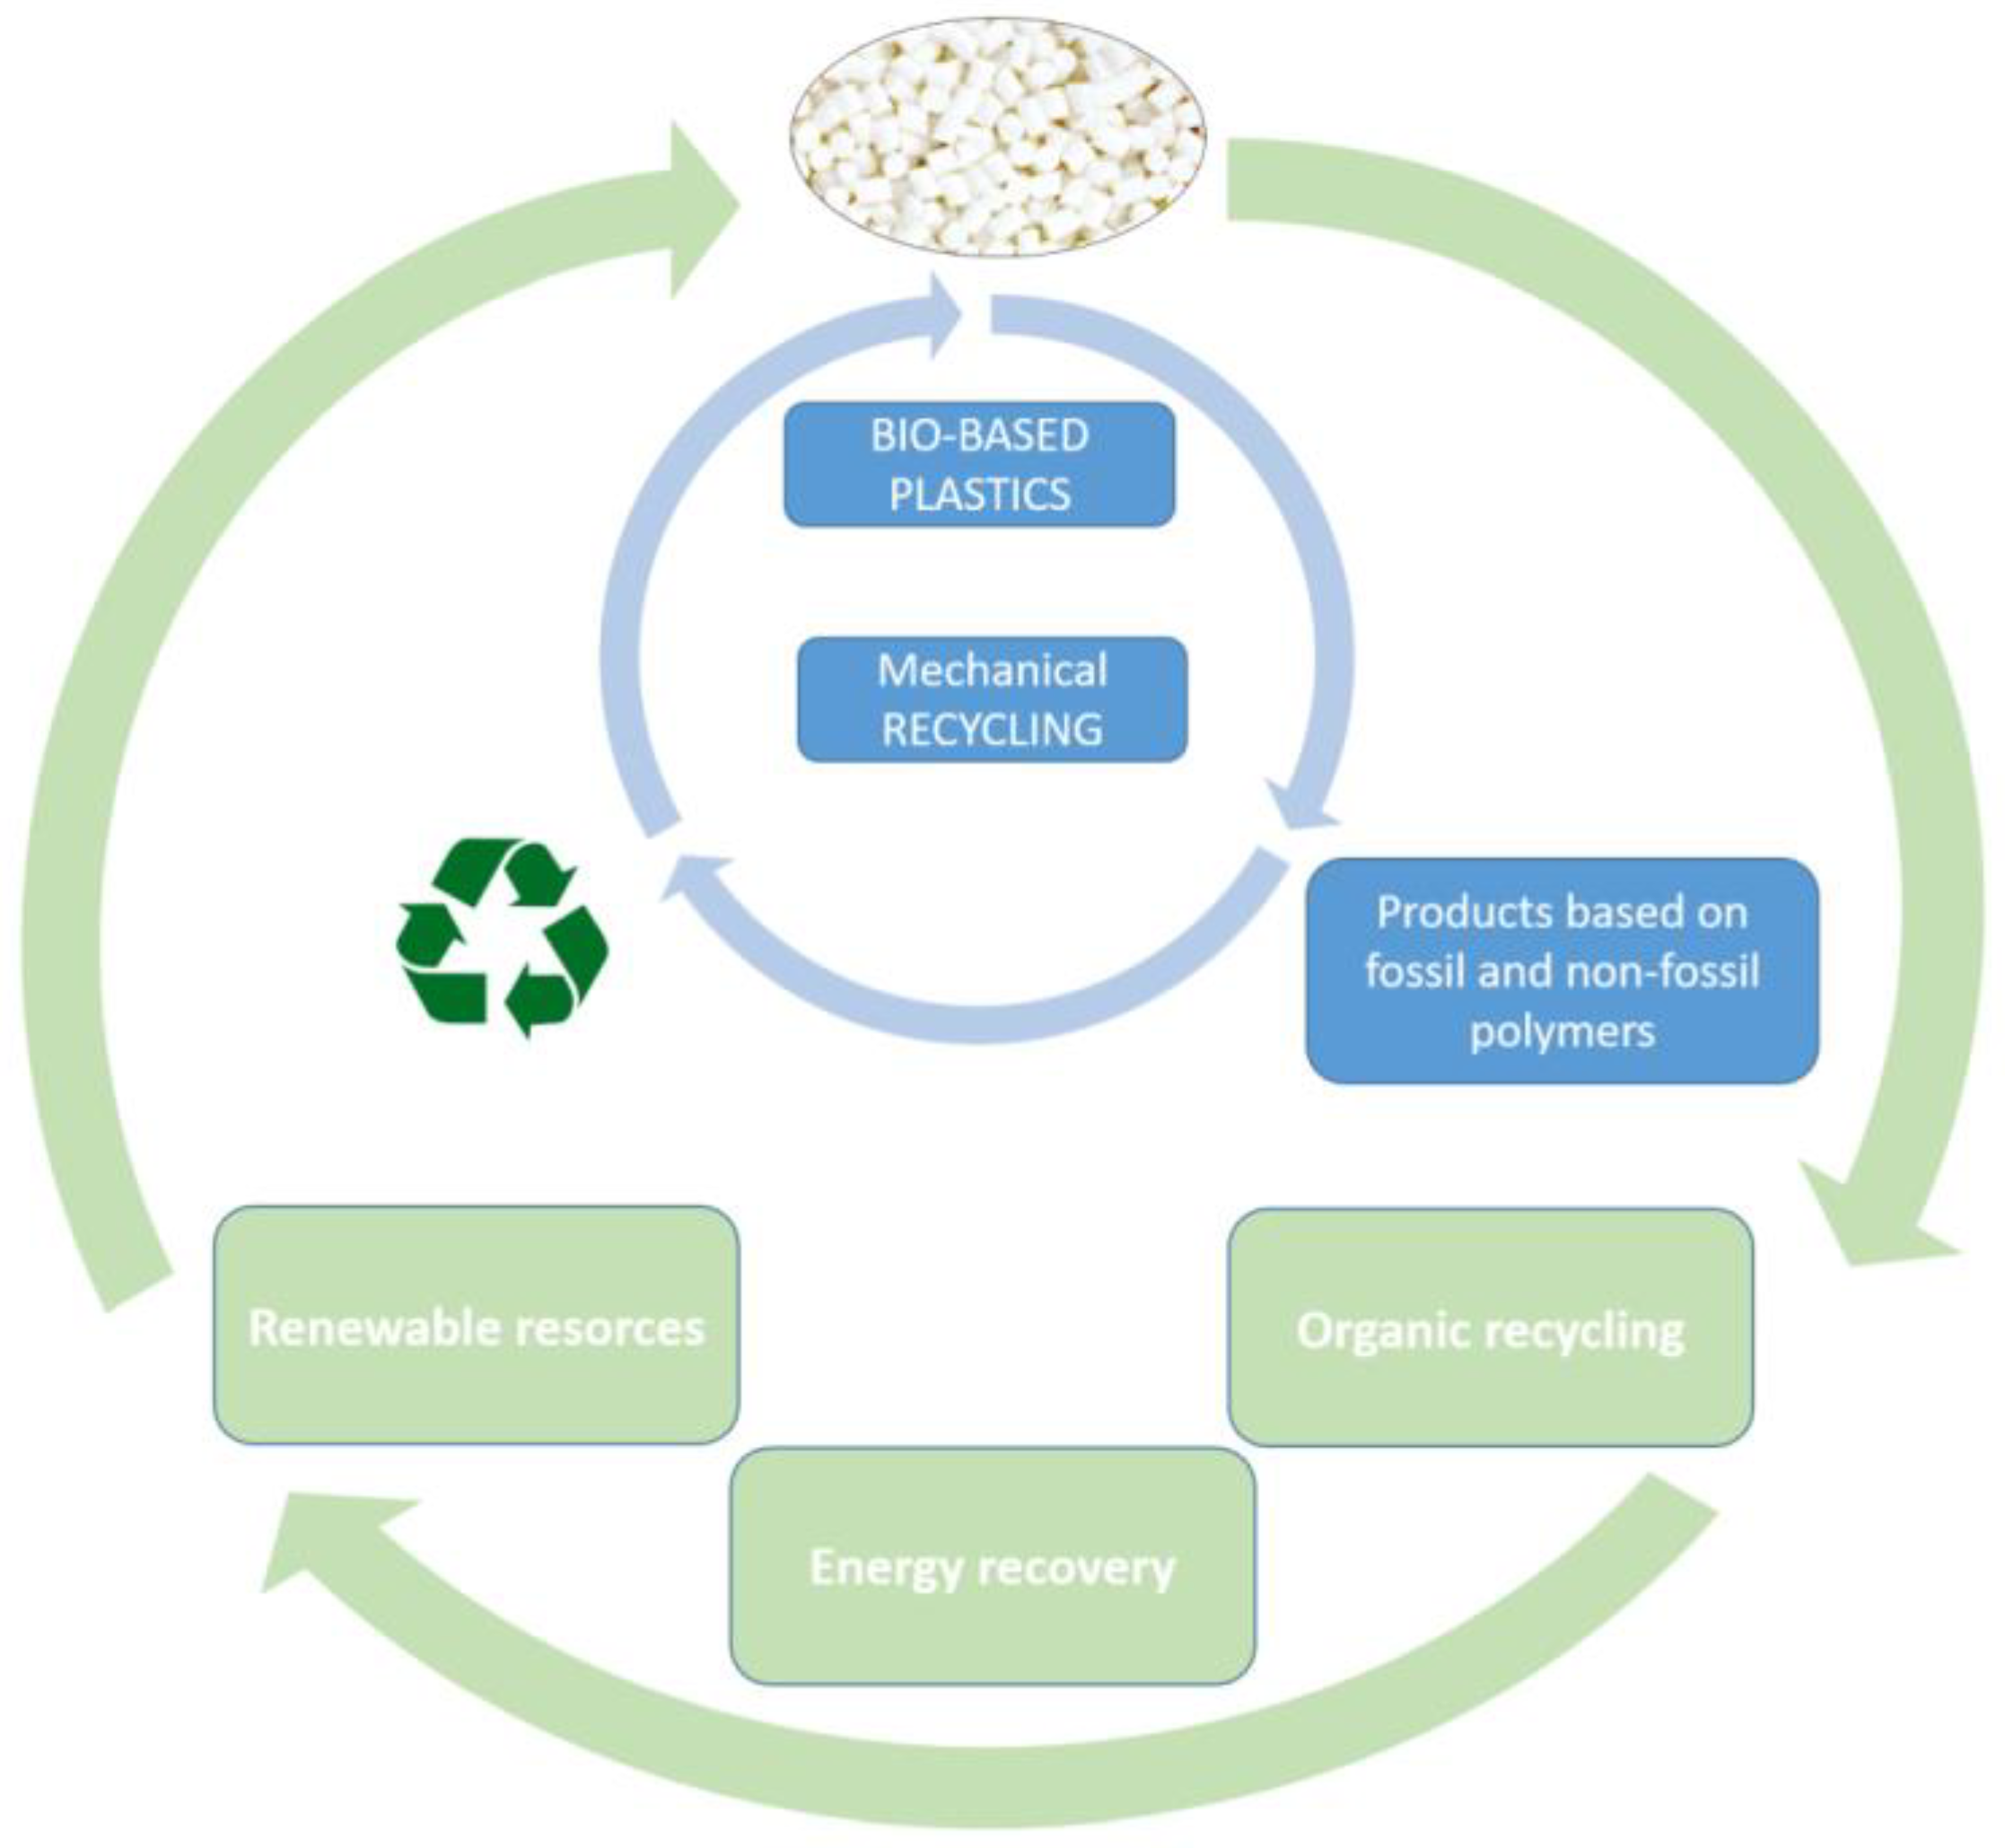
2.3. Biodegradable Plastic Waste Management

As already mentioned above, the largest waste stream consists of packaging, which is usually generated from polymers such as PE, PP and PET. Biodegradable plastics are a perfect alternative for this type of materials, since they are thin-walled products that, after a short time, will undergo decomposition/biodegradation. It should be noted in here that this does not mean arbitrary disposal of packaging made of biodegradable plastics, since their decomposition requires specific conditions (temperature, humidity, bacteria, oxygen, etc.). Polymers that consist mainly of petroleum are categorised in the manner presented in Figure 5.
On the other hand, with respect to biodegradable polymers, it is possible to categorise them in a manner presented in the diagram below (Figure 6).
The first polymers categorised as biodegradable plastics were invented in the 1930s, namely PLA, which was not in wider use until the beginning of the 21st century. Currently, most products made of biodegradable materials are indeed produced using PLA. However, it should be noted that this market is young and its situation changes extremely dynamically. It is becoming more common that the producers of polymer plastics turn to biodegradable materials, which speeds up the work on new biopolymers with surprising physical and chemical properties enabling their use in newer and newer applications that are becoming more in demand (Figure 7) [35].
Bio-based plastics can circulate in a closed loop, which complies with the approach of sustainable development, but also with the approach related to the closed life cycle of a product, LCA [36,37] (Figure 8).
Bio-based and, most importantly, biodegradable polymers currently seem to be the only alternative and the right direction of industrial development, considering the dramatically progressing climate change and the continuously increasing burden on the natural environment. In the case of bio-based plastics, polymer materials, such as polyolefins, PET or PVC, etc., can be produced based on biological substances or partially based on biological substances. These plastics technically correspond to their equivalents produced from petroleum; however, they help to reduce the carbon footprint of the final product. Moreover, they can be subjected to mechanical recycling in existing recycling streams. Biodegradable plastics are those that undergo total decomposition by microorganisms into biomass, carbon dioxide (or methane) and water under strictly specified conditions [38,39,40].
However, it should be noted that biodegradable plastics will not necessarily undergo decomposition after their disposal (which may be a tempting solution for many people); while they do require specifying the timeframe of biodegradation, its level and the required specific conditions, such as temperature, humidity, the availability of oxygen, the presence of bacteria, etc. [34].
Therefore, the approach stating that bio-based plastics have an open road to recycling and their reuse, similar to polymers derived from fossil fuels, while biodegradable plastics go only to a composter, may be misguiding and lead to the emergence of another problem—being flooded by biodegradable waste without being able to know how to decompose it all in due time.
In the case of plastics derived from fossil fuels, the possibility of their reutilisation has been mentioned above. In the case of thermoplastics, it is possible to perform several types of recycling, including material recycling, chemical recycling (for selected polymers, it is possible to decompose them to primary monomers and use them for the production of fuels), as well as the so-called energy recovery, based on recovering the energy stored in polymers via their combustion under controlled conditions (the main factor of safe combustion being the temperature).
In the case of biodegradable plastics, this rule has not yet been deeply considered and investigated. The main assumption of biodegradable plastics and their utilisation involves the possibility of their safe use and, after completing the life cycle of the product, composting, intended to lead to their decomposition into simpler substances with no negative impact on the natural environment [41,42,43]. The diagram below presents possible biodegradation mechanisms for biodegradable polymers (Figure 9).

3. Results and Discussion

3.1. Method and Research Questions

The adopted research method involved the analysis of actual results yielded when managing the flow of a waste stream consisting of biodegradable plastics and petroleum-based plastics. The data was acquired during the authors’ own measurements. The following research questions were asked in relation to the abovementioned performance of the above research.
  • Q1: Is there an impact of retreatment on technological indicators defined by means of the mass flow rate?
  • Q2: Is the retreatment of biodegradable plastics justified in terms of economy, energy and ecology?
  • Q3: Is the retreatment of biodegradable plastics efficient?
The considerations and studies currently in progress are aimed at analysing the capabilities of the retreatment and utilisation of biodegradable polymers. The thickness of the product wall seems to be the main factor deciding the possibility of their recycling. In the case of packaging, wrapping and all kinds of thin-walled products (thin-walled products are to be understood as those whose wall thickness does not exceed one millimetre), retreatment seems to make no sense, since they can be recycled in an easy and effective manner. However, attention should be paid to the amount of this waste, and perhaps the volume will decide that they are worth “giving a second life” after all, before they are composted.
In the case of products whose wall thickness exceeds one millimetre, composting can be more difficult, or at least prolonged (the duration of composting and decomposition into simple substances extends along with an increase in the wall thickness); the performed studies of compostability and biodegradability are mainly related to wrapping.
Therefore, if the recycling process is used for thermoplastic polymer materials, should a similar solution not be considered in relation to biodegradable plastics [45]. During the production of biodegradable plastics, energy expenditures related to their creation are also incurred.
As shown, the carbon footprint of biodegradable polymers (in this case, PLA) is definitely smaller than that of their equivalents made of petroleum (Figure 10). Therefore, their retreatment and utilisation can also contribute even more to reducing their environmental impact (Figure 11 and Figure 12).
The analysis of the possibilities for retreatment biodegradable plastics and the feasibility of this type of solutions included measuring the consumption of electrical energy and other utilities necessary to process one kilogram of the abovementioned waste. The considerations were performed in relation to the following polymer materials (Table 1):
  • Polymer materials produced from petroleum: PE, PET, PA 6.6,
  • Biodegradable materials: polylactide (PLA IngeoBiopolymer 4043D), Bioplast 105 (a thermoplastic that contains a large amount of bio-based materials) and Bioplast 300 (a thermoplastic polymer containing natural potato starch and other bio-based polymers).
The materials for recycling originated from various sources. Polyolefins (two varieties of polyethylene differing in the value of the mass flow rate, marked as PE 0.2, for which the MFR (Melt Flow Rate) equaled 0.2 g/10 min, and PE 4, for which the MFR equalled 4.0 g/10 min, as well as polypropylene, for which the MFR equaled 6.0 g/10 min) originated from the automotive industry (they were delivered in the form of finished products or waste from their production); polyamide and polyethylene terephthalate constituted technological waste originating from the automotive industry (this waste originated from the production of airbags, in the form of scraps of materials used for their production), while the plastics PLA, Bioplast 105 and Bioplast 300 were purchased in the form of granules, processed using the KraussMaffei KM65/160/C4 hydraulic injection-moulding machine in order to produce standardised mouldings. The samples were created according to the ISO 294 quality standard.
Subsequently, these samples were ground using a high-speed SHINI SG-2417-CE mill. The pulp produced in this manner was subjected to the moisture removal process using a SHINI CD-60 shelf dryer, and subsequently subjected to the process of regranulation using the cascade extruder described below. The products of regranulation were tested for the mass flow rate in order to determine basic technological parameters and identify the changes that had taken place in the material.
The pattern of the retreatment biodegradable plastics is presented below. The wall thickness of the mould should be the main factor deciding the possibility of retreatment; in accordance with quality standards related to the process of biodegradation (ISO 14855), the thickness of composted samples should not exceed one millimetre (as of today). Therefore, it seems to be an interesting solution to generate injected or extruded elements with wall thickness exceeding one millimetre with the possibility of their reutilisation and use in a new product with no need for disposal right after the end of its life cycle (Figure 13).
Products made of biodegradable plastics with wall thickness of less than one millimetre (wrapping, packaging, etc.) can successfully undergo the process of composting, leading to their decomposition into simple substances with no negative impact on the natural environment.
As indicated below in the paper, it is possible to produce thick-walled details from biodegradable plastics (standardised mouldings of the paddle type are characterised by wall thickness of four millimetres), followed by their grinding and retreatment (granulation) with the possibility of retreatment (as indicated by the mass flow rate tests).
Retreatment of the abovementioned polymers was analysed using a single-screw cascade extruder from the STARLINGER company, with a screw diameter of 85 mm in each extruder. The treatment line consisted of the elements presented below, each of which was characterised by the following installed power (Table 2).

3.2. Research Results

The consumption of electrical energy was analysed in terms of the type of the processed material and its mass flow rate; the efficiency of the process (expressed in kg/h) was analysed in relation to these two factors.
The table below includes data related to determining the mass flow rate according to the ISO 1133-1 quality standard. The test was performed using a Dynisco D4003DE plastometer. Temperatures of measurement and the applied loads are listed in the table. The presented measurement results constitute an average value from five measurements. The viscosity index IV was determined for the fourth position in the table (PET).
As shown in the table (Table 3), both petroleum-based and bio-based reprocessed polymers are characterised by diverse values of the mass flow rate. The highest value was produced for two material groups: polyamide and polyethylene terephthalate; the lowest value of the mass flow rate was produced for one of the varieties of polyethylene. The remaining materials, both petroleum-based and bio-based, are characterised by similar values of the MFR (from 3 to 6 g/10 min). The MFR index is a parameter determining the ability to reuse a material for the given type of production or product [46].
Referring to the first question, Q1, it was demonstrated that, when performed for the first time, retreatment has no major impact on the properties of the resulting granules (regarding the preformed tests, this statement is only true for biodegradable plastics, whose properties were determined for the original granules, and subsequently for granules produced after retreatment using the extrusion technology, while for petroleum-based polymers it was not possible to determine the original mass flow rate due to the lack of granules—the created granules were derived from final products; it can be only presumed that, due to the resulting values of the mass flow rate, the initial values were similar).
Table 4 lists the applied treatment parameters (the temperature of the last heating zone and the extrusion die are used as the value presented in the table). The energy expenditure reflected the total use of energy by the line when processing the given material group (the lower the value, the higher the advantage from an economic and ecological point of view).
Table 4 also presents the efficiency of the extrusion line in kilograms per hour and the consumption of electrical energy used to reprocess one kilogram of plastic. From an economic and ecological point of view, it is a decisive factor qualifying the given material group for retreatment.
As it has been shown (Table 4), depending on the type of processed material, the processing parameters, represented in this case by the regranulate extrusion temperature, change significantly. Along with the change of the material group, the demand for electric energy required to effectively process one kilogram of plastic increases. The greatest amount of electricity is absorbed/required for processing by plastics from the group of polyesters and polyamides, despite the relatively low viscosity, as demonstrated by the melt flow index tests (the values obtained are 200 kWh and 0.8 and 0.571 kWh). However, due to its processing properties (e.g., processing temperature, screw rotational speed, which also translates into efficiency), its energy inputs are much higher. Slightly lower values are required for the processing of polypropylene. However, due to its rheological properties, energy inputs are compensated by the efficiency of recycling. An equally high efficiency of the recycling process was achieved for the processing of polyethylene and biodegradable plastics. The technological line for processing these materials requires a power supply of 100 kWh with the consumption of about 0.25 kWh needed to produce one kilogram of material.
The data presented in Table 5 supplement/extend the data presented in Table 4. Table 5 presents data relating to the correlation of the mass melt flow rate and the rotational speed of the extruder and the influence of these factors on the efficiency of the technological recycling process. The lowest value of the melt flow rate was obtained for polyethylene (it is 0.2 g/10 min). At a rotational speed of 100 RPM, the efficiency was 280 kg/h. As shown in Table 4, the energy expenditure for polyethylene processing was 0.43 kWh for one kilogram of material. Good processing results were achieved thanks to the relatively low processing temperature of this material. Similarly, it has been shown that with the increase in the value of the melt flow index and the screw rotational speed, the processing efficiency increases significantly (this applies to the processing of materials such as polypropylene, polylactide, polymers from the group of bioplasts). However, for polyamide and polyethylene terephthalate, despite the very low viscosity of the polymer melt (the melt flow index values for these materials are high and thus their fluidity is high) and the high rotational speeds of the screw (190 Rpm), the achieved efficiency in kilograms is 350 for the material PET and 250 for polyamide.
As indicated in Table 5, these relationships are not linear, and the efficiency of retreatment drops not just along with a drop in the value of the mass flow rate, but also with its considerable increase. Referring to questions 1 and 3 (Q1 and Q3), it should be concluded that the retreatment of biodegradable polymers is an efficient process. Their treatment occurs in lower temperatures compared to the treatment of petroleum-based polymers, at the same time providing higher efficiency expressed in kilograms per hour. Therefore, in a given time unit, it is possible to produce a larger amount of material with lower expenditures in terms of energy and economy.

4. Conclusions

The performed literature studies and an analysis of the retreatment process of waste originating from biodegradable plastics have unambiguously indicated the justifiability of their retreatment in terms of economy, technology and efficiency.
From a technological point of view, the performed analysis proved that both petroleum-based and biodegradable polymers undergo retreatment, and the products of regranulation are characterised by satisfactory and repetitive parameters. The mass flow rate established for all the tested materials was an index which determined this conclusion.
The performed tests were also aimed at determining the energy consumption during the retreatment of selected materials, including mass-processed plastics (polyolefins), technical plastics (PA, PET) and biodegradable plastics.
As demonstrated by the measurements, biodegradable plastics require the lowest energy expenditures associated with their retreatment, which is related to the temperatures of their processing. Significance is also attributed to their composition and chemical structure (the input biodegradable materials were characterised by average values of the mass flow rate of 6 g/10 min for PLA, 4.1 g/10 min for bioplast 105 and 2.57 g/10 min for bioplast 300; retreatment had no major impact on its value). The lack of significant changes in the value of the mass flow rate relative to the original granules demonstrates the negligible impact of treatment temperatures (technological parameters of plastic) and the phenomena accompanying the processing (fragmentation, feeding, homogenisation, rotational speed of the screw, etc.) on their retreatment and the properties of the resulting products. The efficiency of the retreatment of biodegradable plastics is also higher compared to the analysed thermoplastic polymers (even those that are characterised by MFI values higher by a factor of about a dozen). Moreover, it should be noted that the performed tests and the yielded results confirm the “zero waste” policy being introduced by the EU and other industrialised countries, since even biodegradable plastics can be given a second life and be reused with minor energy expenditures. The retreatment of biodegradable plastics before their ultimate composting is also justified from an ecological point of view. In the case of details or wrapping with wall thickness below one millimetre, the duration of composting and decomposition into simple substances is several months, while in the case of details with wall thickness exceeding one millimetre there is no unambiguous data (it depends on the type of material and the dynamics of the composting process). In the case of retreatment, this time is shortened to several hours, after which a fully functional product (regranulated polymer) is created and can be further utilised. The management of waste originating from the waste stream of biodegradable plastics is subject to the same rules as the management of petroleum-based waste, but the main difference between them is found in economic, ecological and technological aspects in favour of biodegradable waste.

Author Contributions

Conceptualization, T.S. and K.Ł.; methodology, T.S. and K.Ł.; formal analysis, T.S. and K.Ł.; investigation, T.S. and K.Ł.; resources, T.S. and K.Ł.; writing—original draft preparation, T.S. and K.Ł.; writing—review and editing, T.S. and K.Ł.; All authors have read and agreed to the published version of the manuscript.

Funding

This research received no external funding.

Institutional Review Board Statement

Not applicable.

Informed Consent Statement

Not applicable.

Data Availability Statement

The data of this study is available from the authors upon request.

Conflicts of Interest

The authors declare no conflict of interest.

References

  1. Hyman, M.; Turner, B.; Carpintero, A. Guidelines for National Waste Management Strategies. Moving from Challenges Opportunities. 2013. ISBN 978-92-807-3333-4. Available online: https://cwm.unitar.org/national-profiles/publications/cw/wm/UNEP_UNITAR_NWMS_English.pdf (accessed on 21 October 2020).
  2. Art. 11 and 191–193 Traktatu o Funkcjonowaniu Unii Europejskiej (The Treaty on the Functioning of the European Union). Version from EUR-Lex dated 01/03/2020, Lisbon, Portugal. Available online: https://eur-lex.europa.eu/legal-content/PL/TXT/?uri=CELEX%3A02016E%2FTXT-20200301 (accessed on 21 October 2020).
  3. Cusenza, M.A.; Longo, S.; Guarino, F.; Cellura, M. Energy and environmental assessment of residual bio-wastes management strategies. J. Clean. Prod. 2021, 285, 124815. [Google Scholar] [CrossRef]
  4. Hoornweg, D.; Bhada-Tata, P. What a Waste: A Global Review of Solid Waste Management. 2012. Available online: https://openknowledge.worldbank.org/handle/10986/17388 (accessed on 16 October 2020).
  5. Ferronato, N.; Torretta, V. Waste Mismanagement in Developing Countries: A Review of Global Issues. Int. J. Environ. Res. Public Health 2019, 16, 1060. [Google Scholar] [CrossRef] [Green Version]
  6. Koval, V.; Mikhno, I. Ecological sustainability preservation of national economy by waste management methods. Econ. Ecol. Socium 2019, 3, 30–40. [Google Scholar] [CrossRef]
  7. Buclet, N.; Godard, O. The evolution of municipal waste management in Europe: How different are national regimes? J. Environ. Policy Plan. 2001, 3, 303–317. [Google Scholar] [CrossRef] [Green Version]
  8. Faraca, G.; Astrup, T. Plastic waste from recycling centres: Characterisation and evaluation of plastic recyclability. Waste Manag. 2019, 95, 388–398. [Google Scholar] [CrossRef]
  9. Bodzay, B.; Bánhegyi, G. Polymer waste: Controlled breakdown or recycling? Int. J. Des. Sci. Technol. 2016, 22, 109–138. [Google Scholar]
  10. Agamuthu, P.; Khidzir, K.; Hamid, F.S. Drivers of sustainable waste management in Asia. Waste Manag. Res. 2009, 27, 625–633. [Google Scholar] [CrossRef]
  11. Contreras, F.; Ishii, S.; Aramaki, T.; Hanaki, K.; Connors, S. Drivers in current and future municipal solid waste management systems: Cases in Yokohama and Boston. Waste Manag. Res. 2009, 28, 76–93. [Google Scholar] [CrossRef] [PubMed]
  12. Marshall, R.E.; Farahbakhsh, K. Systems approaches to integrated solid waste management in developing countries. Waste Manag. 2013, 33, 988–1003. [Google Scholar] [CrossRef]
  13. Sotamenou, J.; De Jaeger, S.; Rousseau, S. Drivers of legal and illegal solid waste disposal in the Global South—The case of households in Yaoundé (Cameroon). J. Environ. Manag. 2019, 240, 321–330. [Google Scholar] [CrossRef]
  14. Wilson, D.C.; Velis, C.; Cheeseman, C. Role of informal sector recycling in waste management in developing countries. Habitat Int. 2006, 30, 797–808. [Google Scholar] [CrossRef]
  15. Dayana, S.; Sharuddin, A.; Abnisa, F.; Daud, W.; Aroua, M. Energy recovery from pyrolysis of plastic waste: Study on non-recycled plastics (NRP) data as the real measure of plastic waste. Energy. Convers. Manag. 2017, 148, 925–934. [Google Scholar] [CrossRef]
  16. Geyer, R.; Jambeck, J.R.; Law, K.L. Production, use, and fate of all plastics ever made. Sci. Adv. 2017, 3, e1700782. [Google Scholar] [CrossRef] [Green Version]
  17. Rydzkowski, T. Recykling odpadowych tworzyw polimerowych. Recykling 2009, 5, 25. [Google Scholar]
  18. Wróblewska-Krepsztul, J.; Rydzkowski, T. Pyrolysis and incineration in polymer waste management system. J. Mech. Energy Eng. 2020, 3, 337–342. [Google Scholar] [CrossRef] [Green Version]
  19. European Parliament. Available online: https://www.europarl.europa.eu/news/pl/headlines/society/20181212STO21610/odpady-z-tworzyw-sztucznych-i-recykling-w-ue-fakty-i-liczby (accessed on 15 October 2020).
  20. Tulashie, S.K.; Boadu, E.K.; Kotoka, F.; Mensah, D. Plastic wastes to pavement blocks: A significant alternative way to reducing plastic wastes generation and accumulation in Ghana. Constr. Build. Mater. 2020, 241, 118044. [Google Scholar] [CrossRef]
  21. Hermabessiere, L.; Dehaut, A.; Paul-Pont, I.; Lacroix, C.; Jezequel, R.; Soudant, P.; Duflos, G. Occurrence and effects of plastic additives on marine environments and organisms: A review. Chemosphere 2017, 182, 781–793. [Google Scholar] [CrossRef] [Green Version]
  22. UNEP. 2018b, Emissions Gap Report 2018. 27 November 2018. Available online: https://www.unenvironment.org/resources/emissions-gap-report (accessed on 11 November 2020).
  23. Wu, W.-M.; Yang, J.; Criddle, C.S. Microplastics pollution and reduction strategies. Front. Environ. Sci. Eng. 2017, 11, 6. [Google Scholar] [CrossRef]
  24. Ayeleru, O.O.; Dlova, S.; Akinribide, O.J.; Ntuli, F.; Kupolati, W.K.; Marina, P.F.; Blencowe, A.; Olubambi, P.A. Challenges of plastic waste generation and management in sub-Saharan Africa: A review. Waste Manag. 2020, 110, 24–42. [Google Scholar] [CrossRef]
  25. PlasticsEurope. Plastics—The Facts 2019. An Analysis of European Plastics Production, Demand and Waste Data. Brussels, Belgium. 2019. Available online: https://www.plasticseurope.org/application/files/9715/7129/9584/FINAL_web_version_Plastics_the_facts2019_14102019.pdf (accessed on 12 March 2021).
  26. European Commission, Environment. Available online: https://ec.europa.eu/environment/topics/waste-and-recycling_en (accessed on 16 October 2020).
  27. Biotworzywa—Ekologiczny kierunek rozwoju tworzyw sztucznych. Available online: https://www.kierunekchemia.pl/artykul,59603,biotworzywa-ekologiczny-kierunek-rozwoju-tworzyw-sztucznych.html (accessed on 21 October 2020).
  28. Francis, R. Recycling of Polymers: Methods, Characterization and Applications; John Wiley & Sons: Hoboken, NJ, USA, 2016; ISBN 978-3-527-33848-1. [Google Scholar]
  29. Banks, S.; Bridgwater, A. Catalytic fast pyrolysis for improved liquid quality. In Handbook of Biofuels Production; Luque, R., Lin, C.S.K., Wilson, K., Clark, J., Eds.; Woodhead Publishing: Cambridge, MA, USA, 2016; pp. 391–429. ISBN 978-0-08-00456-2. [Google Scholar]
  30. Dhawan, R.; Bisht, B.M.S.; Kumar, R.; Kumari, S.; Dhawan, S. Recycling of plastic waste into tiles with reduced flammability and improved tensile strength. Process. Saf. Environ. Prot. 2019, 124, 299–307. [Google Scholar] [CrossRef]
  31. European Commission, Energy, Climate Change, Environment. Available online: https://ec.europa.eu/info/energy-climate-change-environment/overall-targets/2030-targets_pl (accessed on 24 October 2020).
  32. Guerrero, L.A.; Maas, G.; Hogland, W. Solid waste management challenges for cities in developing countries. Waste Manag. 2013, 33, 220–232. [Google Scholar] [CrossRef]
  33. Eurostat. Available online: https://ec.europa.eu/eurostat/statistics-explained/index.php/Waste_statistics (accessed on 19 October 2020).
  34. Kabasci, S. Bio-Based Plastics Materials and Applications, Fraunhofer-Institute for Environmental, Safety, and Energy Technology UM-SICHT; John Wiley & Sons, Ltd.: West Sussex, UK, 2014; ISBN 9781119994008. [Google Scholar] [CrossRef]
  35. European Bioplastics. Available online: https://www.european-bioplastics.org/bioplastics/waste-management/ (accessed on 20 October 2020).
  36. Blanco, I.; Ingrao, C.; Siracusa, V. Life-Cycle Assessment in the Polymeric Sector: A Comprehensive Review of Application Experiences on the Italian Scale. Polymers 2020, 12, 1212. [Google Scholar] [CrossRef] [PubMed]
  37. Borghi, G.; Pantini, S.; Rigamonti, L. Life cycle assessment of non-hazardous Construction and Demolition Waste (CDW) management in Lombardy Region (Italy). J. Clean. Prod. 2018, 184, 815–825. [Google Scholar] [CrossRef]
  38. Ishigaki, T.; Sugano, W.; Nakanishi, A.; Tateda, M.; Ike, M.; Fujita, M. The degradability of biodegradable plastics in aerobic and anaerobic waste landfill model reactors. Chemosphere 2004, 54, 225–233. [Google Scholar] [CrossRef]
  39. Sudesh, K.; Iwata, T. Sustainability of Biobased and Biodegradable Plastics. CLEAN Soil Air Water 2008, 36, 433–442. [Google Scholar] [CrossRef]
  40. Ren, X. Biodegradable plastics: A solution or a challenge? J. Clean. Prod. 2003, 11, 27–40. [Google Scholar] [CrossRef]
  41. Pudełko, A.; Malińska, K.; Postawa, P.; Stachowiak, T.; Weisser, P. Mechanical, Thermal and Morphological Properties of Bio-char Added Biocomposites. In Proceedings of the 5th International Conference on Advances in Sustainable Sewage Sludge Management (ASSM 2016), Kraków, Polska, 18–21 September 2016. [Google Scholar]
  42. Stachowiak, T. Product Life Cycle in Relation to the Issue of Recycling and Reuse of Waste from the Manufacture of Airbags. In Proceedings of the International Business Information Management (IBIMA), Sewilla, Spain, 1–2 April 2020. [Google Scholar]
  43. Stachowiak, T. Properties of Recycled Natural Fiber Reinforced Composites Materials. Acta Phys. Pol. A 2019, 135, 103–106. [Google Scholar] [CrossRef]
  44. Biodegradable Polymer Market worth USD 5.18 Billion in 2020. Available online: https://www.newsmaker.com.au/news/103838/biodegradable-polymer-market-worth-usd-518-billion-in-2020#.X5QQcNAzaUk (accessed on 3 November 2020).
  45. Narayan, R. Carbon footprint of bioplastics using biocarbon content analysis and life-cycle assessment. MRS Bull. 2011, 36, 716–721. [Google Scholar] [CrossRef]
  46. Bremner, T.; Rudin, A.; Cook, D.G. Melt flow index values and molecular weight distributions of commercial thermoplastics. J. Appl. Polym. Sci. 1990, 41, 1617–1627. [Google Scholar] [CrossRef]
Figure 1. Methods for managing polymer and composite plastics.
Sustainability 13 03701 g001
Figure 2. The progress of waste treatment in the EU in a general aspect, as well as in terms of recovery and disposal (in the years 2004 to 2016) (source: Figure modified from [33]).
Sustainability 13 03701 g002
Figure 3. Plastic waste management in the EU in 2017 (source: Figure modified from [33]).
Sustainability 13 03701 g003
Figure 4. The amount of generated packaging waste, its recycling and recovery (in the years 2007 to 2017) (source: Figure modified from [33]).
Sustainability 13 03701 g004
Figure 5. Categories of polymer materials generated from petroleum and its derivatives (source: Figure modified from [34]).
Sustainability 13 03701 g005
Figure 6. Classification of bio-based and biodegradable polymers (source: Figure modified from [34]).
Sustainability 13 03701 g006
Figure 7. Diagram presenting the relationships between petroleum-based and bio-based plastics (source: Figure modified from [35]).
Sustainability 13 03701 g007
Figure 8. Diagram of a closed loop of polymer materials (source: Figure modified from [35]).
Sustainability 13 03701 g008
Figure 9. Mechanisms of biodegradation (the authors’ own research based on [44]).
Sustainability 13 03701 g009
Figure 10. Material flowchart for plastics made of petroleum.
Sustainability 13 03701 g010
Figure 11. Material flowchart for biodegradable plastics with wall thickness of less than one millimetre—wrapping, packaging, etc. (the authors’ own research).
Sustainability 13 03701 g011
Figure 12. Flowchart of the new method for utilising biodegradable plastics, taking into account their recycling process and wall thickness of above one millimetre (the authors’ own research).
Sustainability 13 03701 g012
Figure 13. Diagram of the authors’ own developed classification of biodegradable plastics depending on wall thickness (the authors’ own research).
Sustainability 13 03701 g013
Table 1. Petroleum-based and biodegradable polymers considered in the study.
Petroleum-Based and Biodegradable Polymers Considered in the Study
Common PlasticsTechnical PlasticsBiodegradable Plastics
PE 0.2PAPLA
PE 4PETBioplast 105
PP 6 Bioplast 300
Table 2. Elements of the cascade line used during the tests.
Elements of the Cascade Line Used during the Tests
No.Device NameRated Power [kW]
1.Compactor40
2.Extruder I75
3.Sieve exchanger5
4.Extruder II75
5.Shaker3
6.Vacuum pump and transport devices2
Combined power200
Table 3. Results of testing the mass flow rate of reprocessed plastics.
Results of Testing the Mass Flow Rate of Reprocessed Plastics
No.Material ProcessedMass Flow Rate [g/10 min]Mass Flow Rate [g/10 min]Temperature of Measurement [oC]Device Load
[kg]
1Polyethylene (PE)-0.21902.16
2Polyethylene (PE)-4.01902.16
3Polypropylene (PP)-6.02302.16
4Polyethylene terephthalate (PET)-IV-852805
5Polyamide (PA)-962805
6Polylactide (PLA)66.311902.16
7Bioplast 1054.14.361902.16
8Bioplast 3002.572.791902.16
Table 4. List of treatment parameters in relation to energy consumption and efficiency.
List of Treatment Parameters in Relation to Energy Consumption and Efficiency
No.PolymerTreatment Temperature [oC]Energy Expenditure [kWh]Efficiency
[kg/h]
Energy Consumption per 1 kg
1Polyethylene (PE)2101202800.43 kWh
2Polyethylene (PE)2101203500.342 kWh
3Polypropylene (PP)230–2401504000.375 kWh
4Polyethylene terephthalate (PET)280–2902003500.571 kWh
5Polyamide (PA)2752002500.80 kWh
6Polylactide (PLA)190–2001004000.25 kWh
7Bioplast 105190–2001004000.25 kWh
8Bioplast 300190–2001004000.25 kWh
Table 5. List of the acquired data in relation to the resulting mass flow rate, as well as the rotational speed of the extruder and its output.
List of the Acquired Data in Relation to the Resulting Mass Flow Rate, as Well as the Rotational Speed of the Extruder and Its Output
No.Material ProcessedMass Flow Rate [g/10 min]Rotational Speed of the Screw [RPM]Efficiency
[kg/h]
1Polyethylene (PE)0.2100280
2Polyethylene (PE)4.0190350
3Polypropylene (PP)6.0210400
4Polyethylene terephthalate (PET)85190350
5Polyamide (PA)96190250
6Polylactide (PLA)6.2180400
7Bioplast 1054.3180400
8Bioplast 3002.77180400
Publisher’s Note: MDPI stays neutral with regard to jurisdictional claims in published maps and institutional affiliations.

