Article

Mechanical Properties of Polypropylene Fiber Cement Mortar under Different Loading Speeds

1
Department of Architecture and Civil Engineering, Oujiang College, Wenzhou University, Wenzhou 325035, China
2
College of Architecture and Civil Engineering, Wenzhou University, Wenzhou 325035, China
3
College of Civil Engineering and Architecture, Zhejiang University of Technology, Hangzhou 310034, China
*
Author to whom correspondence should be addressed.
Sustainability 2021, 13(7), 3697; https://doi.org/10.3390/su13073697
Submission received: 1 March 2021 / Revised: 22 March 2021 / Accepted: 23 March 2021 / Published: 26 March 2021
(This article belongs to the Special Issue Sustainable Concrete Materials and Technologies)

Abstract

:
In this work, the relationships between the mechanical properties (i.e., compressive strength and flexural strength) and loading speed of polypropylene fiber (PPF)-incorporated cement mortar at different ages (before 28 days) were studied. A total of 162 cubic samples for compressive strength tests and 162 cuboid samples for flexural strength tests were casted and tested. Analytical relationships between the sample properties (i.e., sample age, PPF content, and loading speed) and compressive and flexural strength were proposed based on the experimental data, respectively. Of the predicted compressive and flexural strength results, 70.4% and 75.9% showed less than 15% relative error compared with the experimental results, respectively.

1. Introduction

Cement-based materials are the most widely used construction materials around the world. However, normal cement-based materials usually present some unfavorable properties (i.e., high porosity [1,2], high chloride diffusivity and oxygen diffusivity [3,4,5,6,7], limited tensile strength [8], fracture toughness [9], and early-age cracking [10,11]), which affect the durability of concrete structures.
Fiber reinforcement of cement-based materials has shown a good improvement in mechanical properties [12]. Polypropylene fiber (PPF) is a cheap [13] and popular material in the construction industry. The polypropylene fiber market reached $122.7 billion in 2019 [14]. Many studies have been conducted to investigate the improvement of PPF-incorporated cement-based materials’ performance [15,16,17,18], especially the improvement in mechanical properties [19,20,21,22]. The addition of PPF can significantly reduce the drying shrinkage while improving the compressive strength and freeze-thaw resistance of concrete [23]. PPF has also been used in light-weight concrete to improve the compressive strength and the crack-resistance performance [15]. The incorporation of PPF in prepacked aggregate concrete also shows an improved resistance against elevated temperatures [24,25]. Medina et al. [26] reported that the water permeability and CO2 diffusion are reduced due to the excellent cracking control of the PPF-incorporated concrete, which makes PPF-mixed concrete structures more resistant to CO2-induced durability deterioration (i.e., carbonation and corrosion), and results in more sustainable concrete structures.
The loading speed has a significant influence on the results of mechanical tests [27,28,29,30]. The first study of the loading speed influence on the mechanical properties of cement-based materials was performed by Abrams in 1917 [31]. Since then, a lot of research has been carried out to study the relationship between the loading speed and mechanical properties of cement-based materials [27,28,32,33]. Kaplan [34] studied the influence of loading rate on the compressive strength of concrete and found that the moisture content is one of the important variables affecting the relationship between strength and loading speed. Fu et al. [35] found that both compressive strength and stiffness increase with increasing loading rate, and that wet concrete is relatively more sensitive to a change in loading rate than dry concrete. Bischoff and Perry [32] reviewed the relationship between compressive strength and loading speed, and found that the ultimate strength is affected most significantly by the loading rate, and a linear relationship was found between compressive strength and loading speed. Quantitative relationships between the loading speed and mechanical properties of PPF-incorporated cement mortar are still lacking, despite a lot of qualitative relationships having been obtained in the existing literature.
To fill the aforementioned knowledge gaps, a total of 162 cubic PPF-incorporated cement mortar samples for compressive strength tests and 162 cuboid PPF-incorporated cement mortar samples for flexural strength tests were casted and tested before 28 days of age in this work, and the relationships between mechanical properties (i.e., compressive and flexural strength) and loading speed of PPF-incorporated cement mortar at different ages were studied. Analytical relationships between the sample properties (i.e., sample age, PPF content, and loading speed) and compressive and flexural strength are proposed, respectively, based on the experimental data.

2. Experimental Program

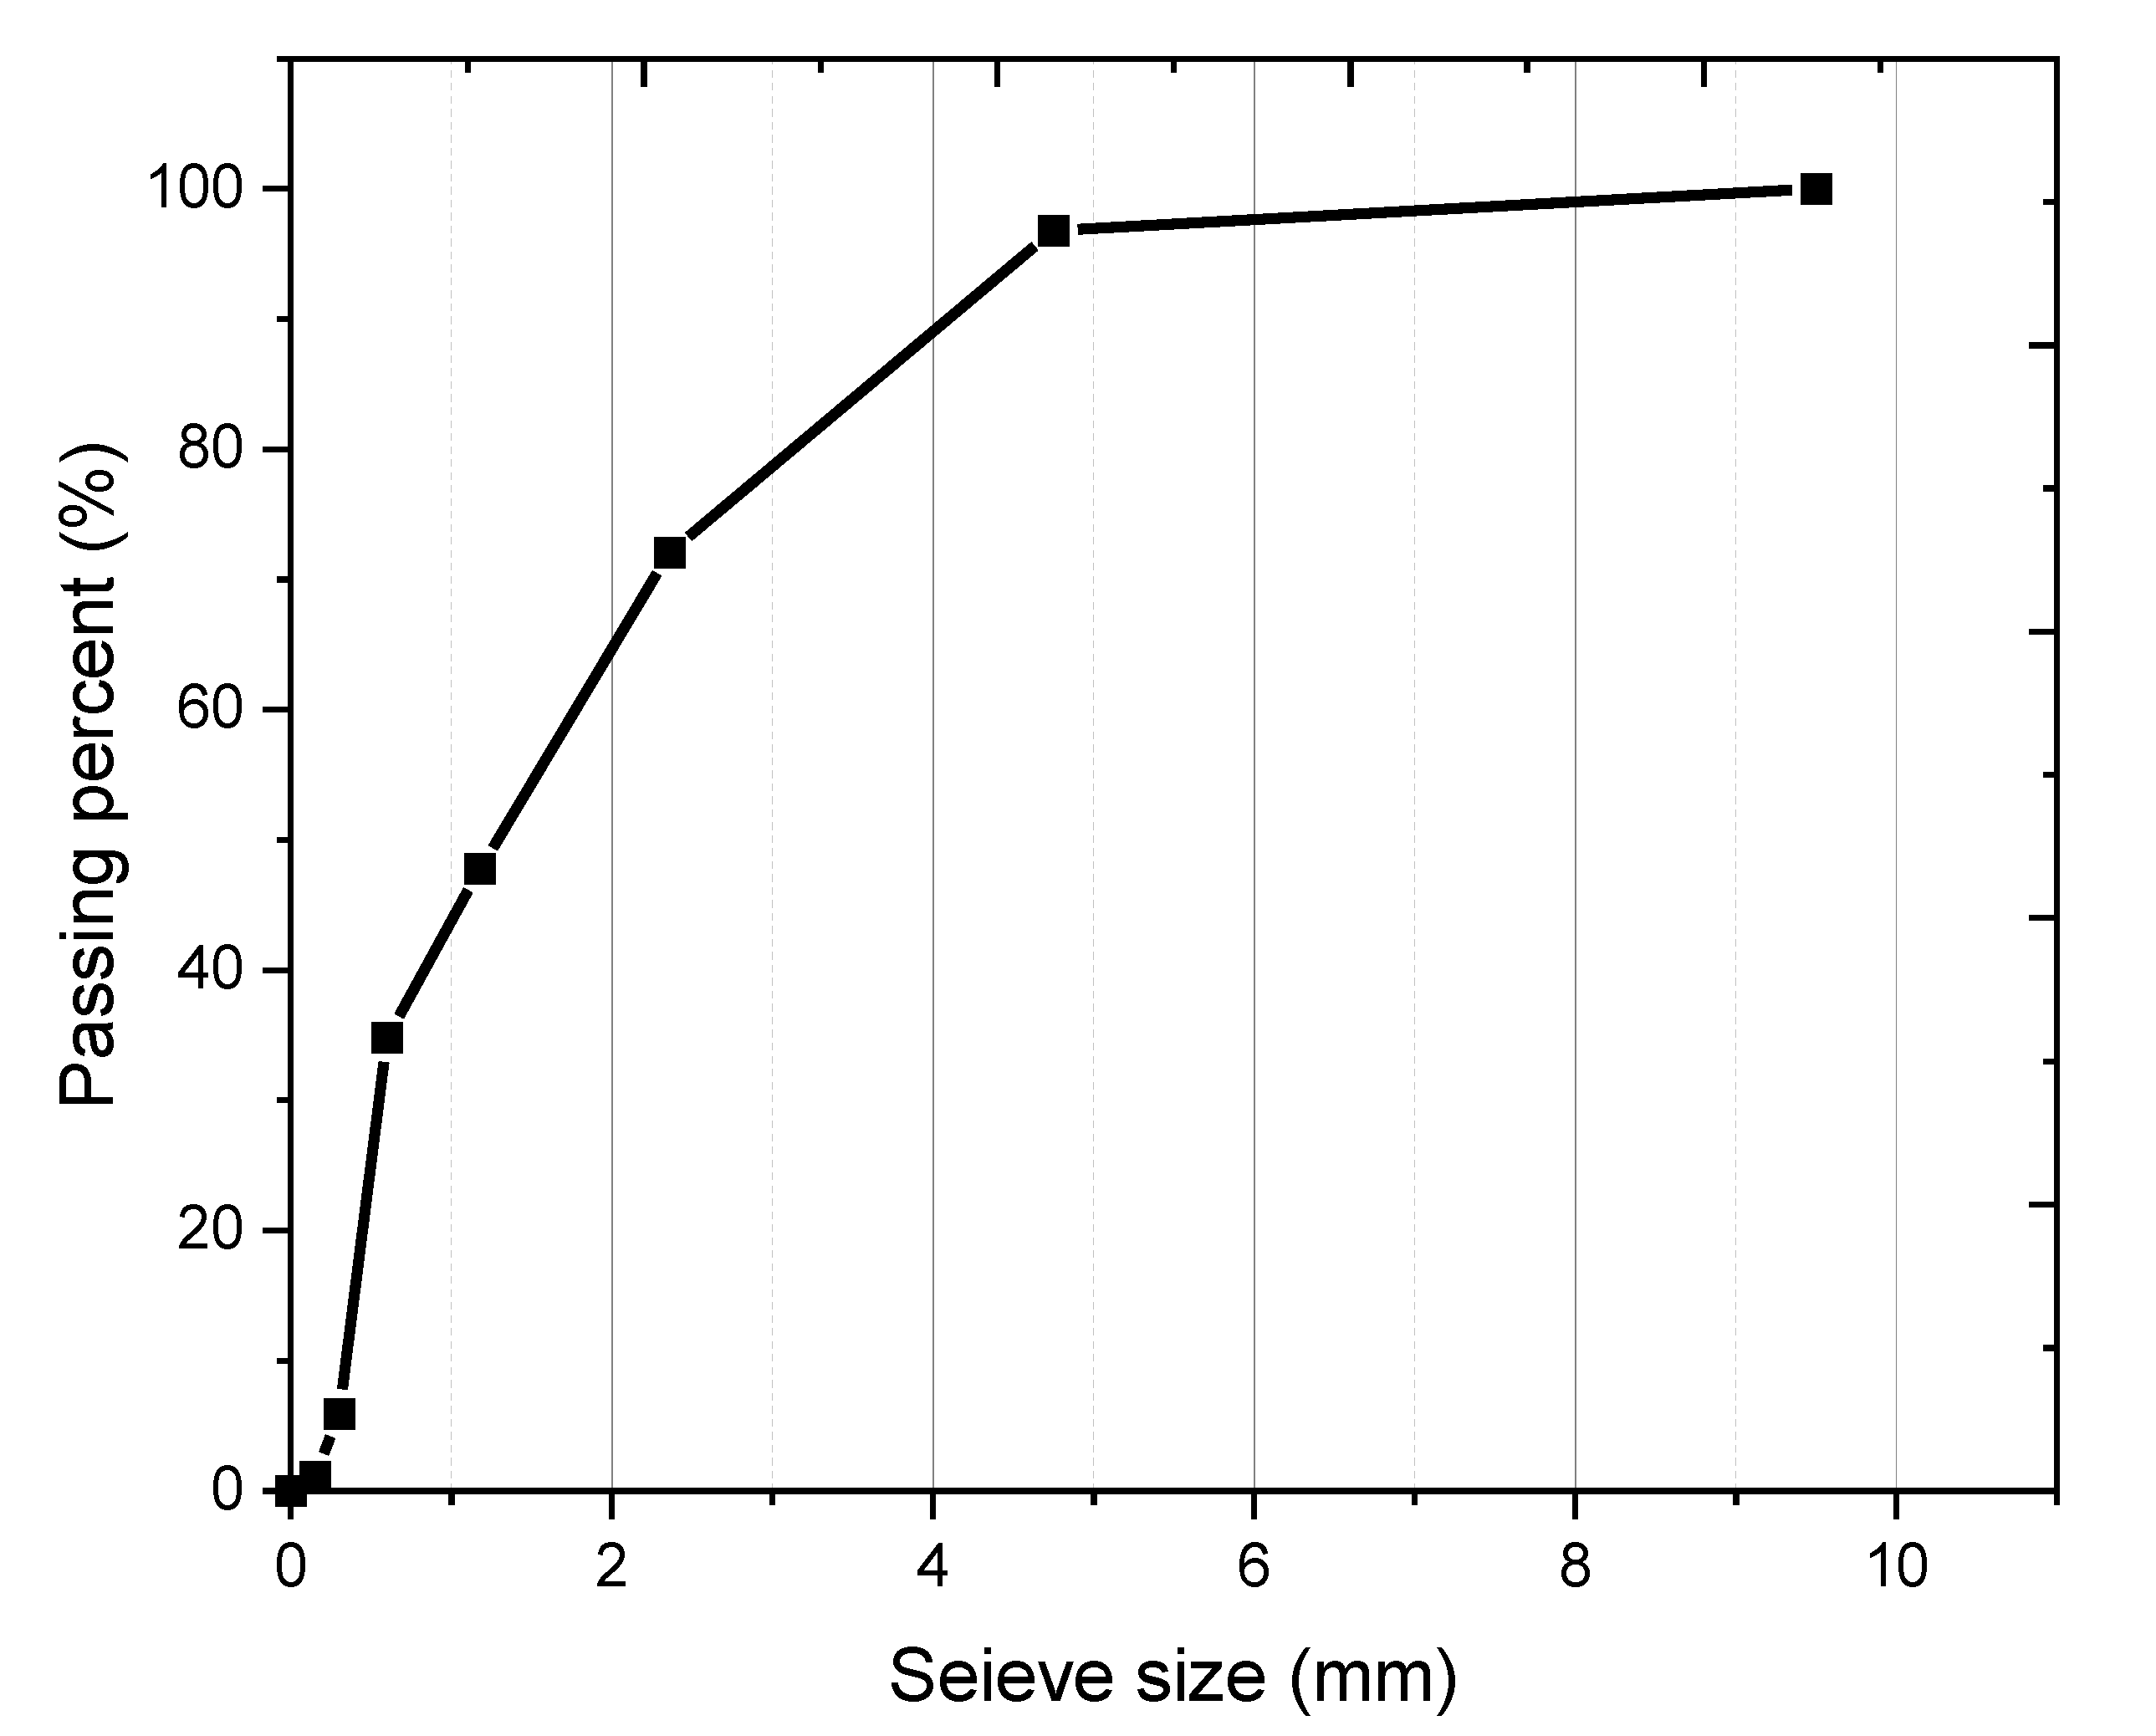
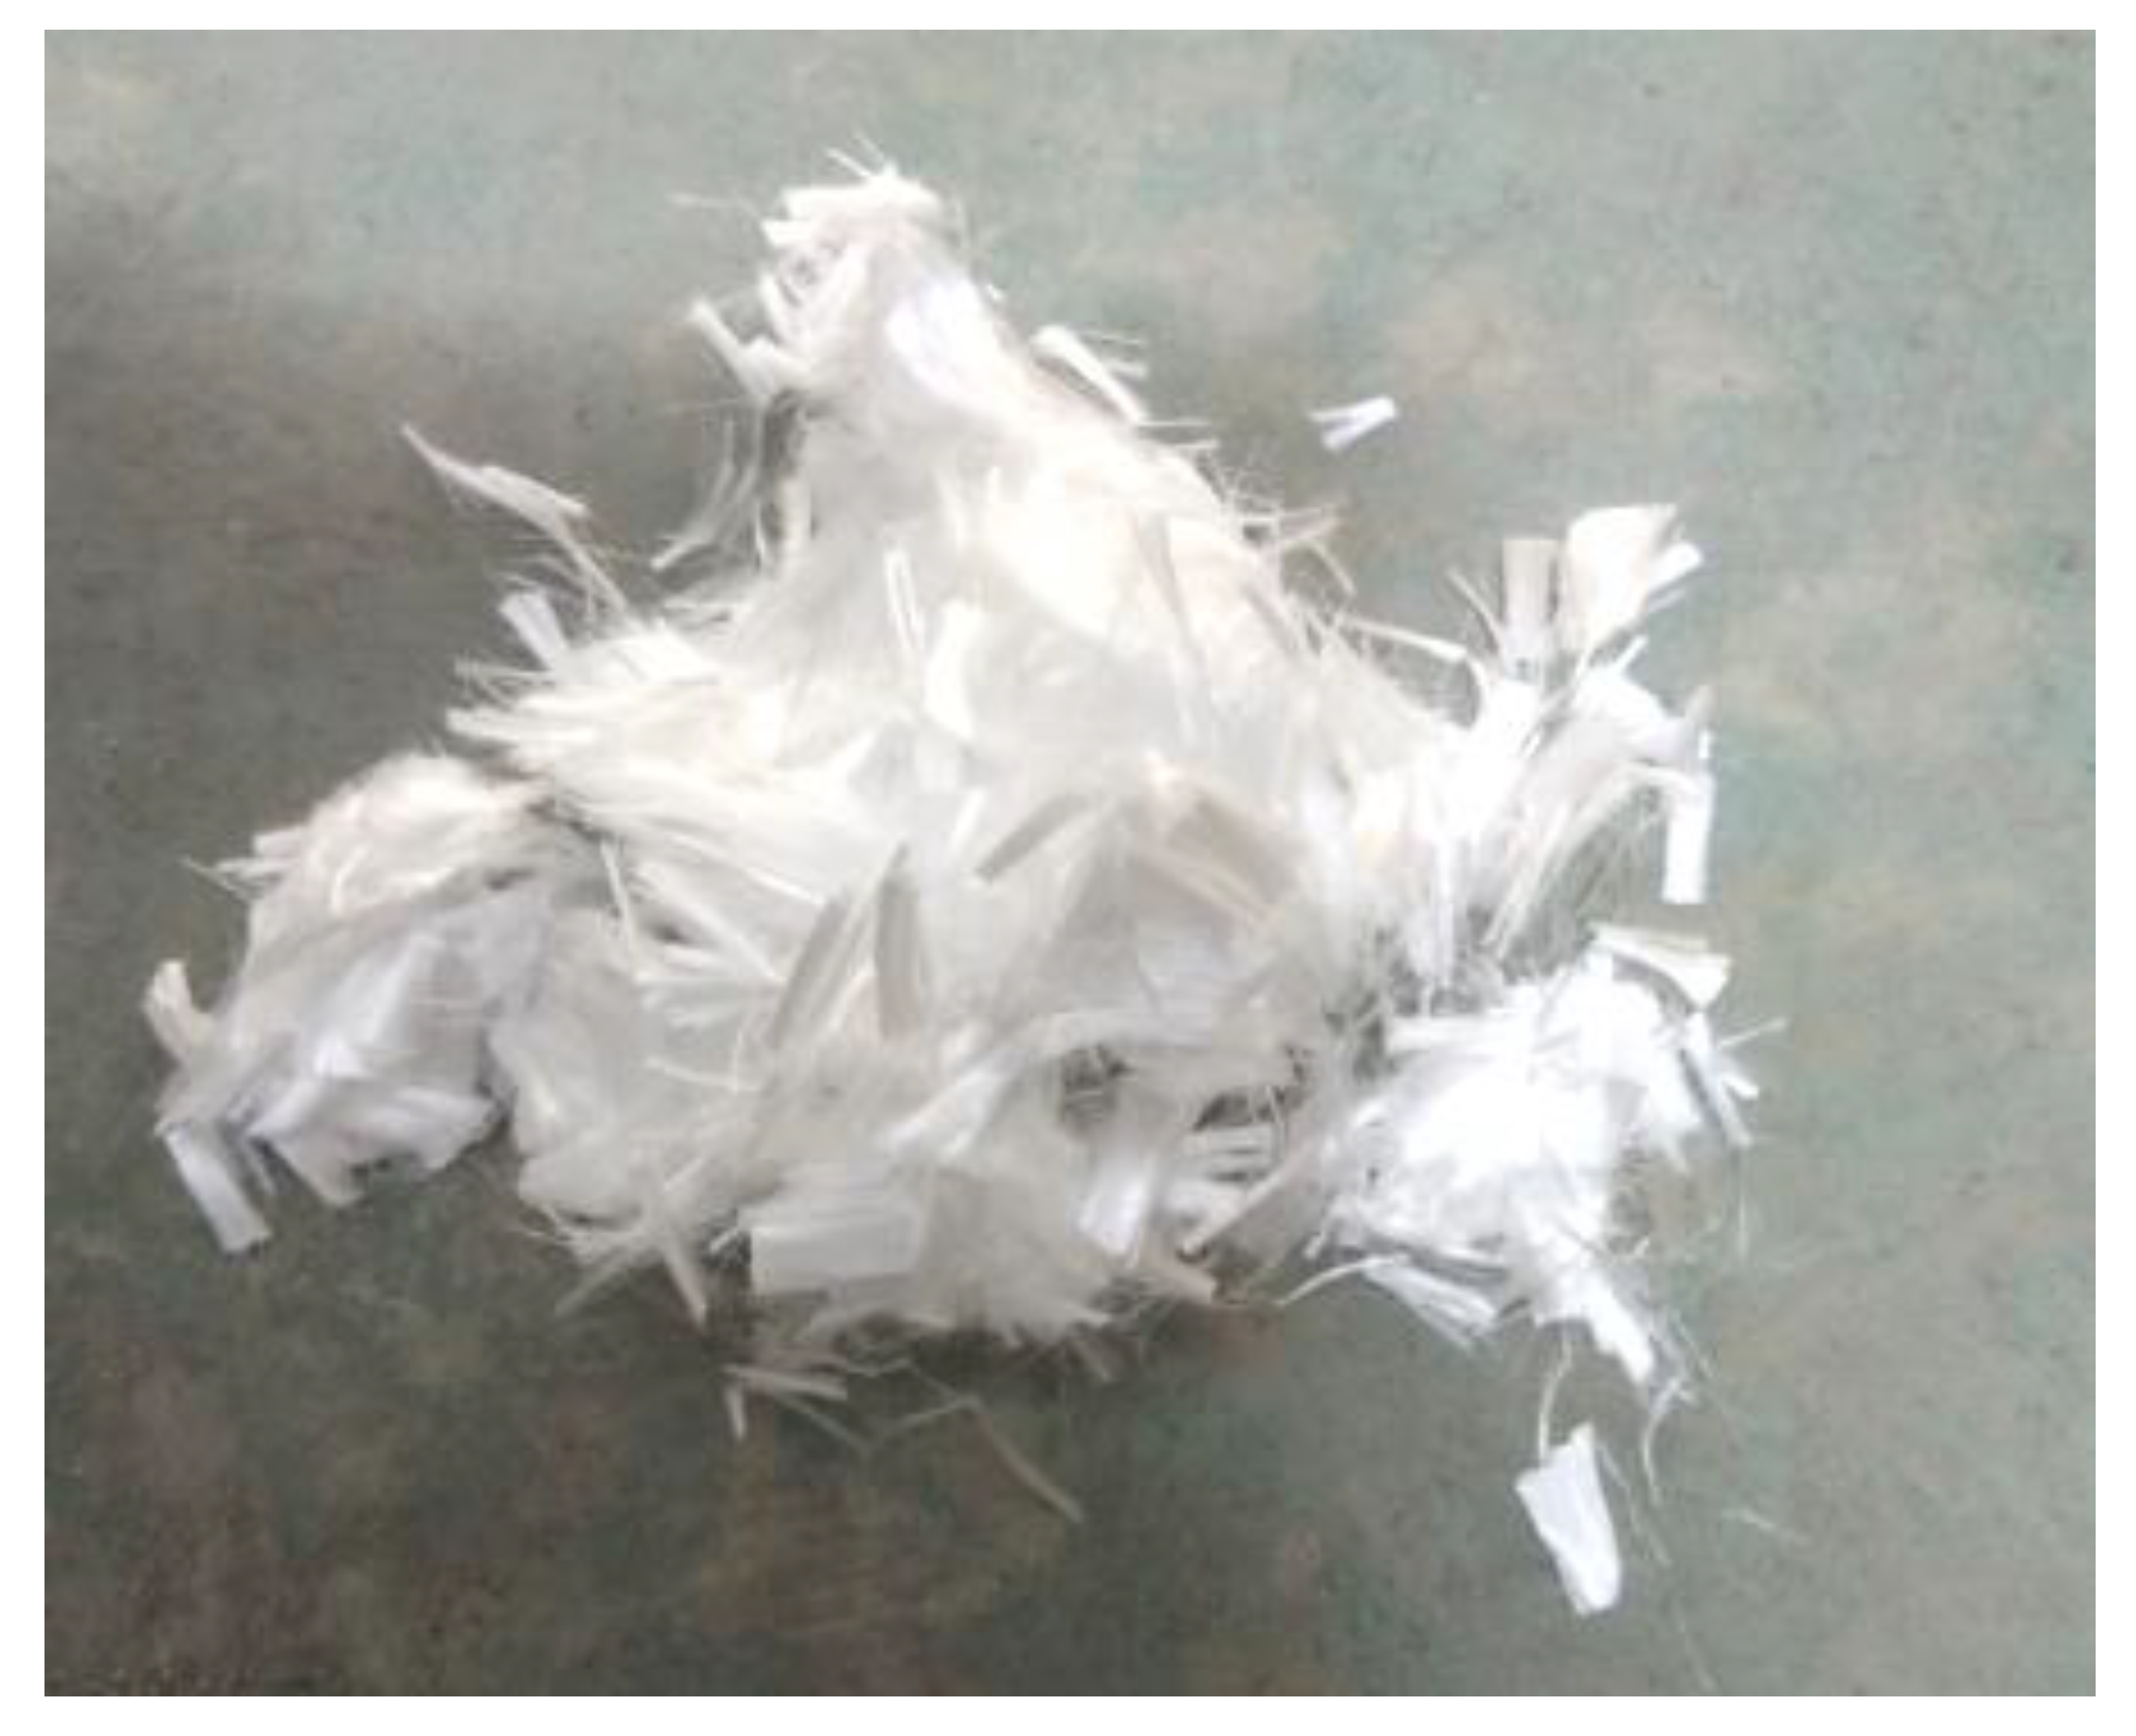
2.1. Raw Materials and Mixture Design

The mass ratio of the raw components for cement mortar was mcement/mwater/mfine aggregate = 1.0:0.5:1.5. The cement used in this work was P.C. 32.5 Portland cement, which meets the Chinese standard GB 175-2007 [36]. The chemical composition and physical properties of the cement are presented in Table 1. Natural river sand with a fineness modulus of 2.49 was used in this work as fine aggregate, and the absorption of the fine aggregate was 2.28%. The gradation information of the fine aggregate is shown in Figure 1. Distilled water was used as mixing water. The polypropylene fiber (PPF) used in this work was produced by Tianyi Engineering Fiber Co., Ltd. (Changzhou, China), and a photograph of the fibers is shown in Figure 2, while the chemical and mechanical properties of the fiber are summarized in Table 2. Three cement mortar mixtures were prepared with the fiber volume fractions (Vf) of 0%, 0.5%, and 1.0%. No chemical mixture was used in this research.

2.2. Sample Preparation
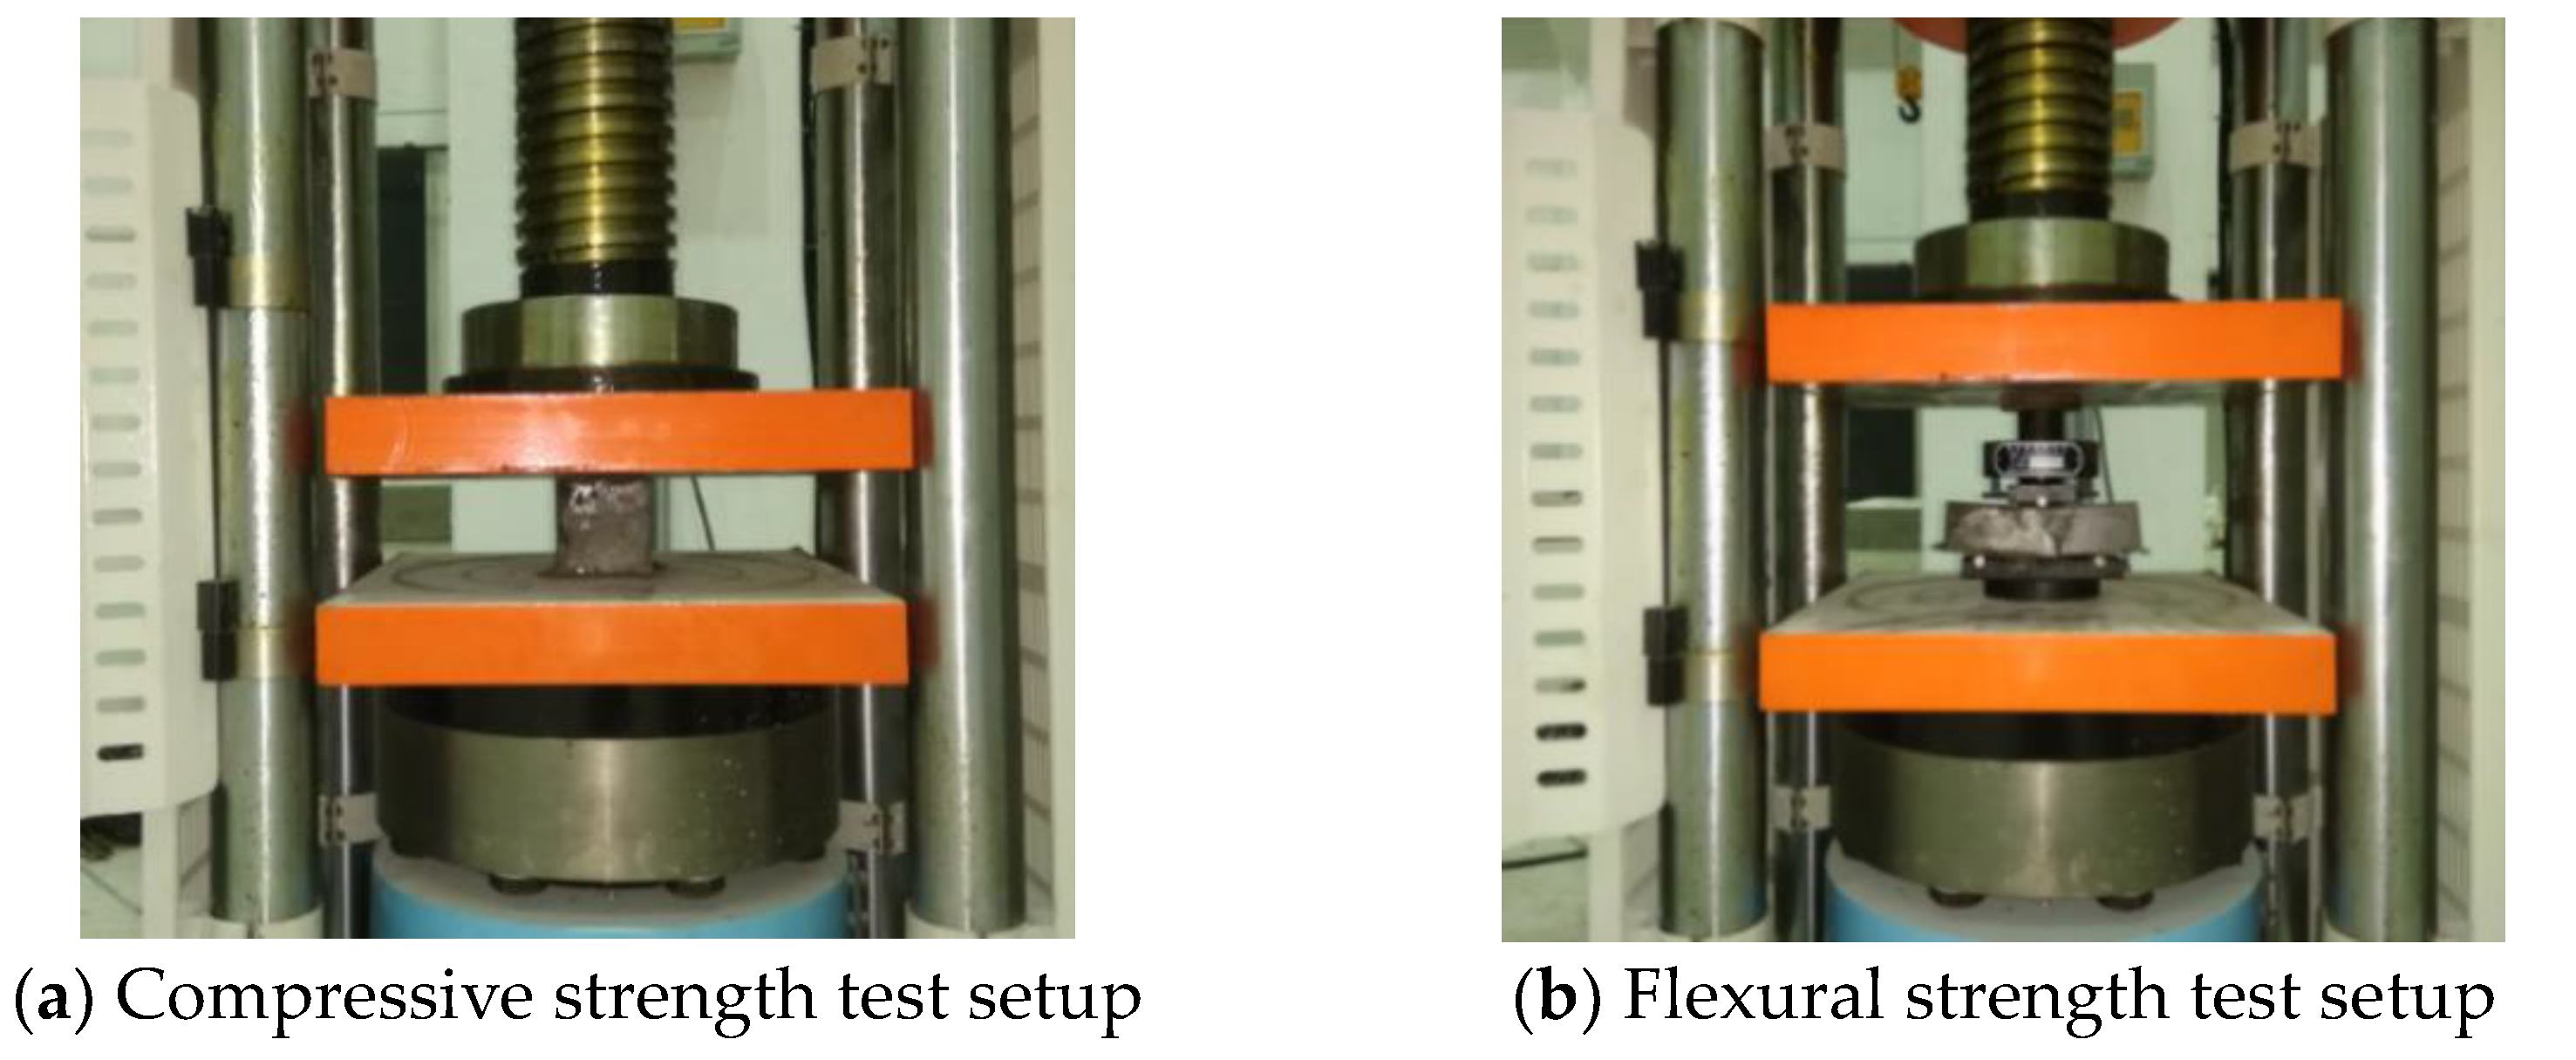
The cubic cement mortar samples used for the compressive strength tests were cast with the dimensions of 70.7 × 70.7 × 70.7 mm, while the cuboid samples for the flexural strength tests were cast with the dimensions of 40 × 40 × 160 mm. After mixing, all samples were placed under room temperature condition at ±23 °C. After 12 h, the samples were de-molded and immersed in water at 23 ± 1 °C. In this work, three fiber volume fractions of cement mortar were designed to study the influence of the fiber content on mechanical properties, and for each mixture, three different loading speeds were used to study the influence of loading speed on mechanical tests; three duplicates were used for the compressive and flexural strength tests of each mixture at the designated age. Thus, for each mixture, 162 cubic and cuboid samples were cast, respectively.

2.3. Test Setup

The compressive and flexural strength tests were carried by a YAW-2000D pressure testing machine produced by China Jinan Tianchen Testing Machine Manufacturing Co., Ltd. The test setup is presented in Figure 3. The three-point (i.e., center-point) loading flexural test was carried out with a span of 100 mm. In this work, three loading speeds (i.e., 0.3, 0.6, and 1.0 kN/s) were applied to study the influence on the mechanical test results. The average value of the test results of three duplicates was reported.

3. Results and Discussion

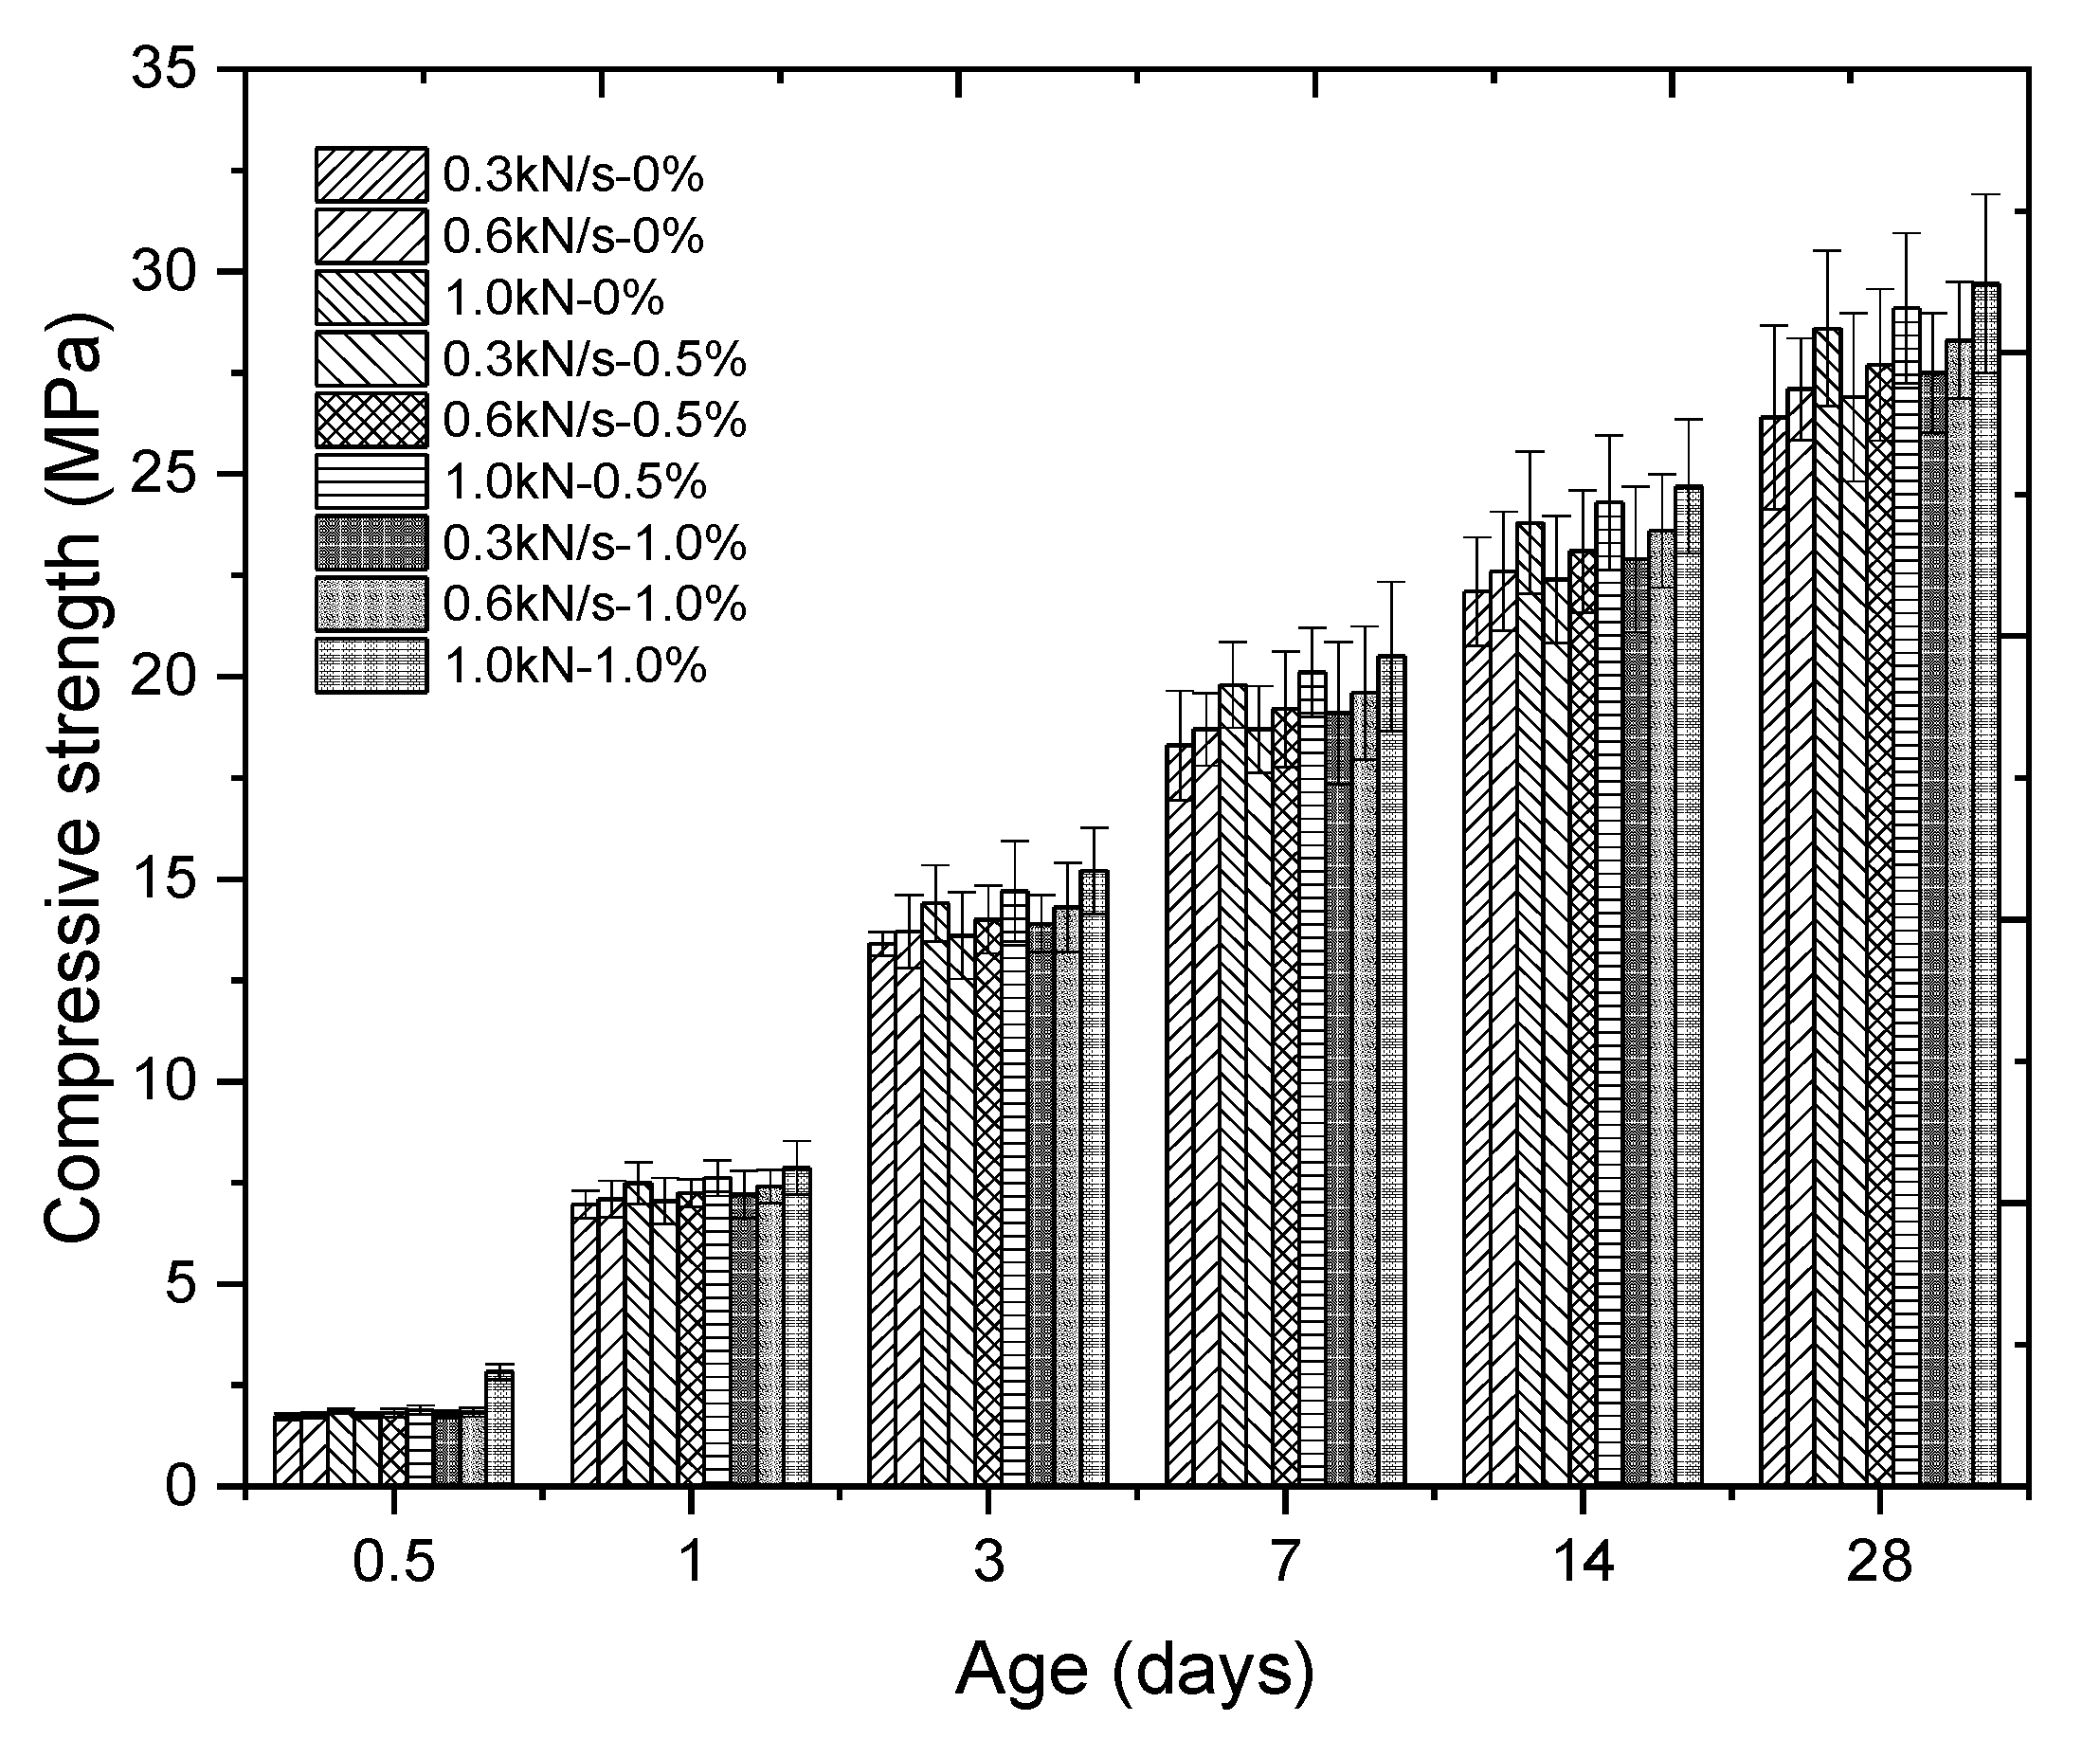
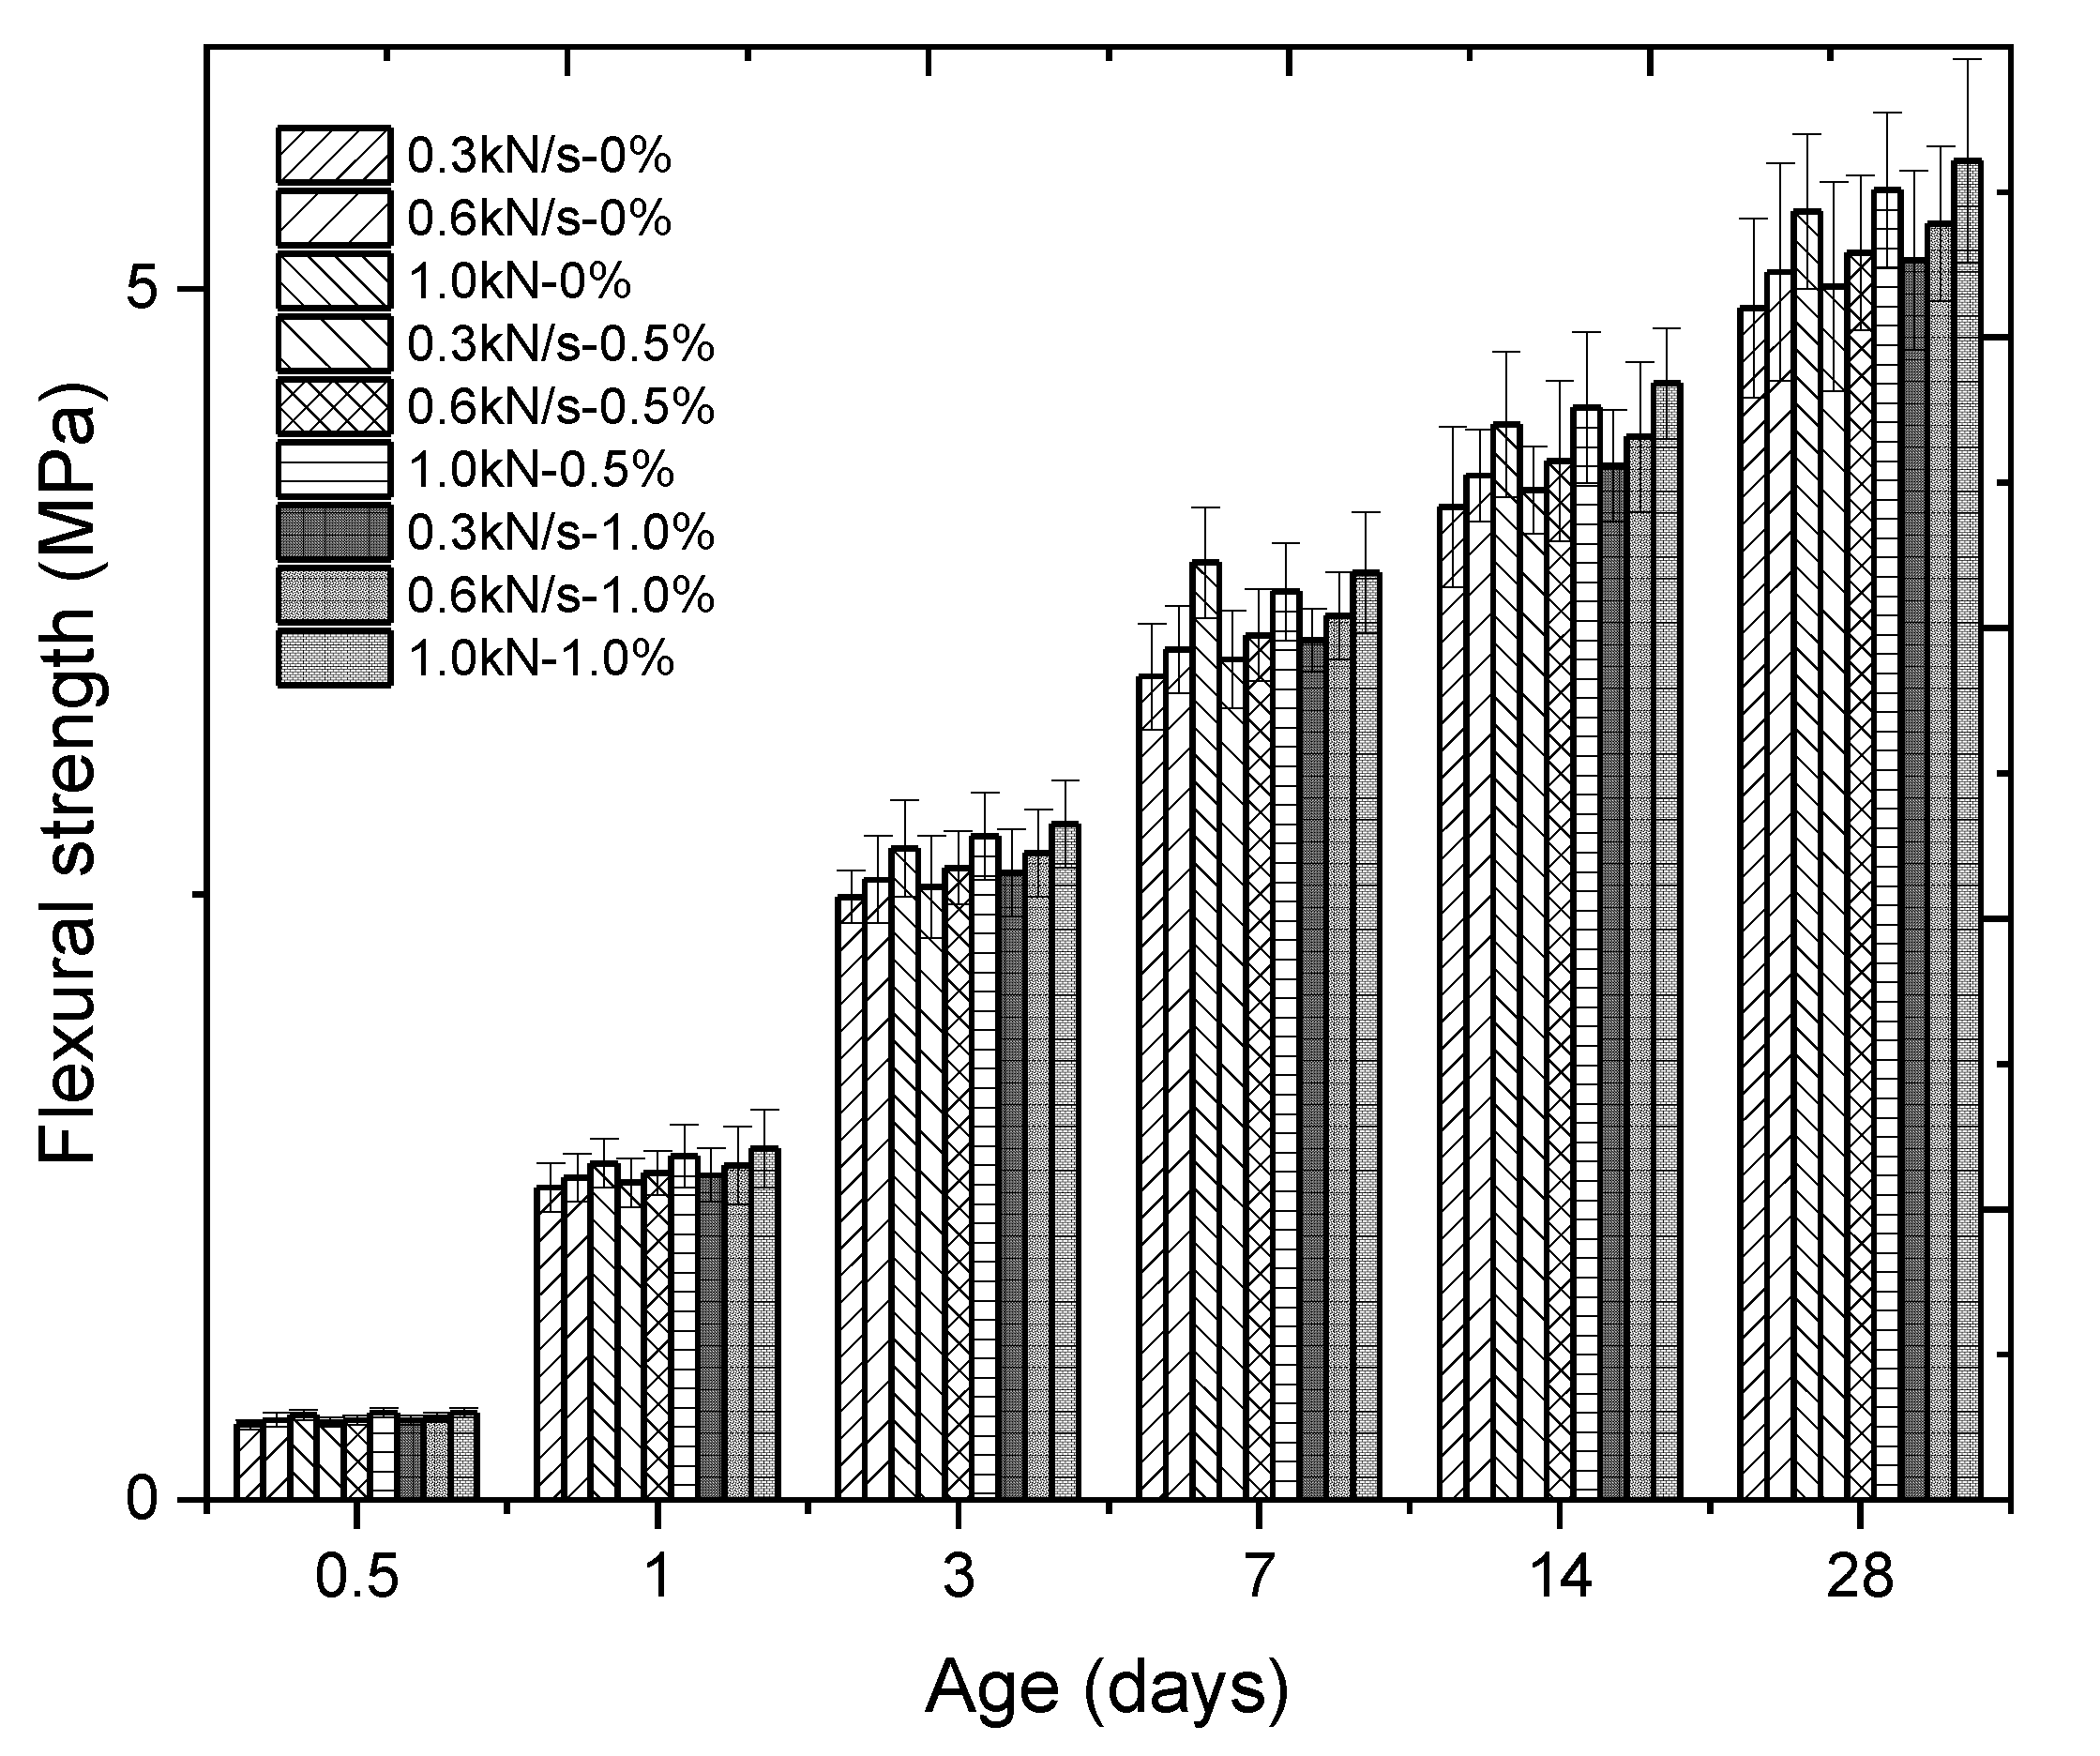
3.1. Compressive Strength and Flexural Strength Test Results

The results of the compressive and flexural strength test results of all mixtures are plotted in Figure 4 and Figure 5. It can be seen from Figure 4 and Figure 5 that the compressive and flexural strengths developed with curing age. The normalized compressive and flexural strengths are summarized in Table 3, and it can be seen that in the very early age, the absolute compressive and flexural strength values did not change under different loading speeds or with different PPF contents. This might be due to the weakness of cement mortar at a very early age (0.5 days). As the curing continued, the incorporation of PPF cement mortar’s mechanical properties (i.e., compressive and flexural strength) showed enhancement. The increasing of the loading speed also showed improvement in the mechanical performance of the cement mortar at a later age.

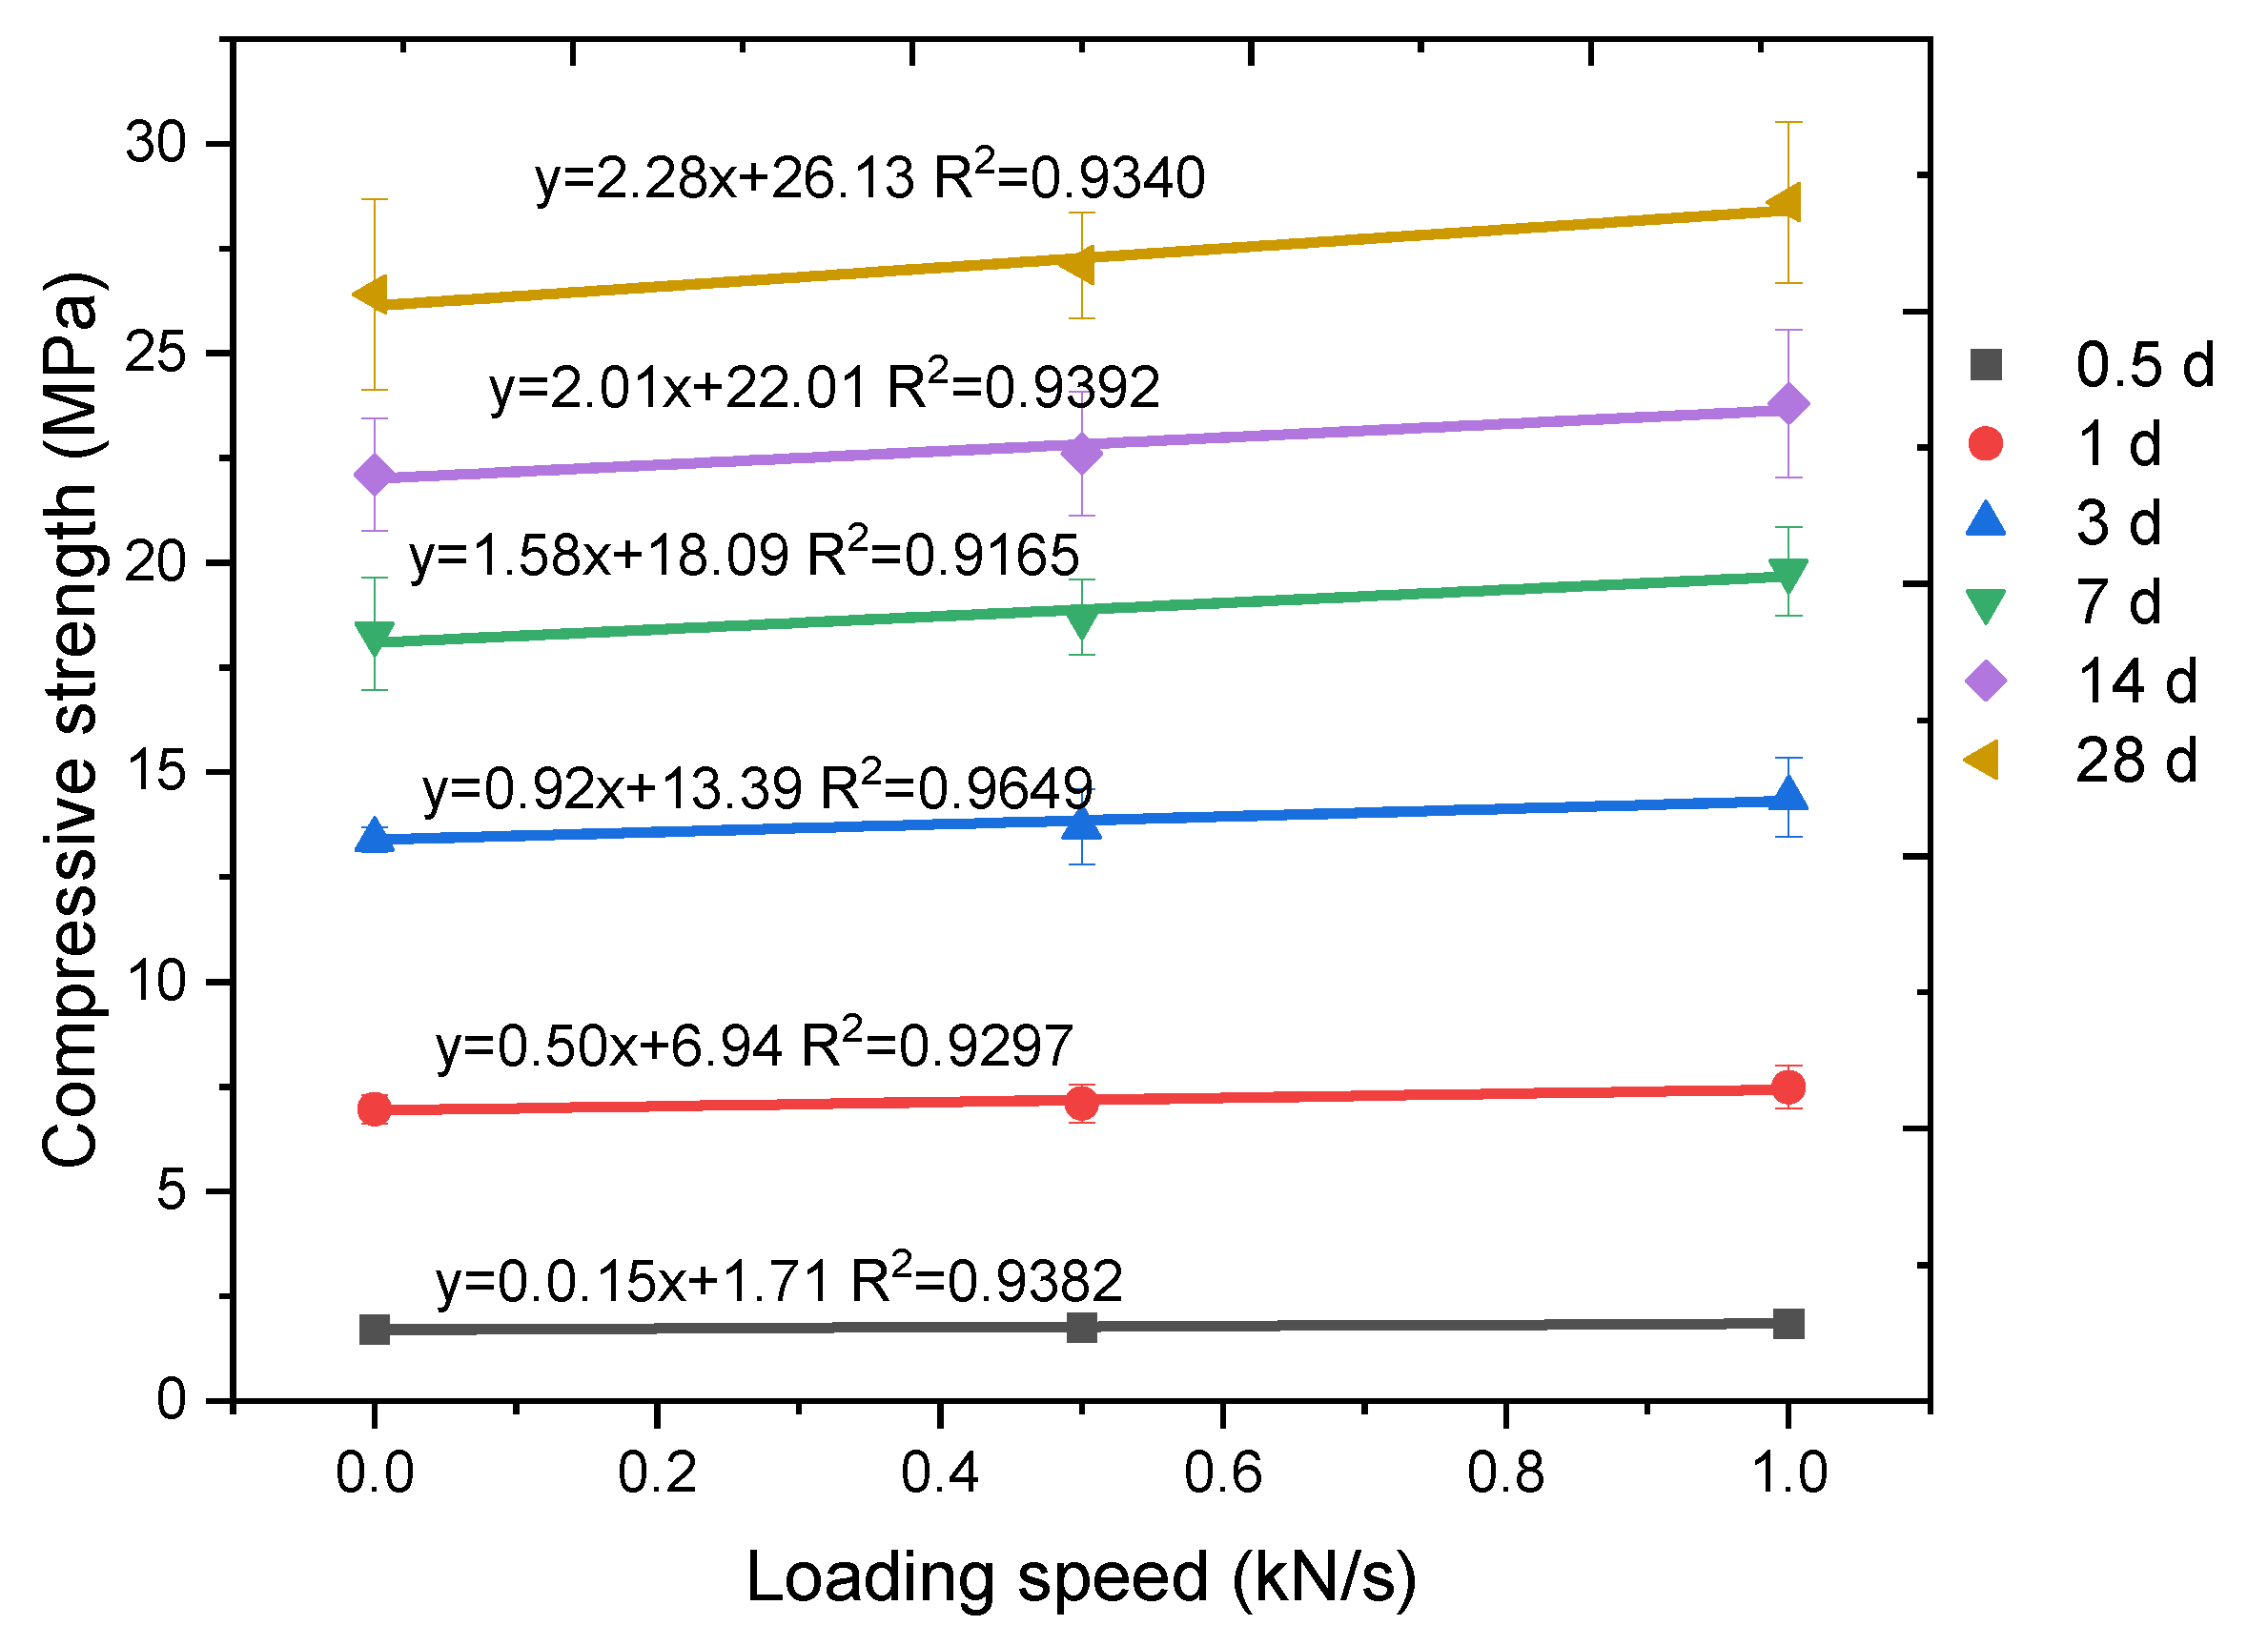
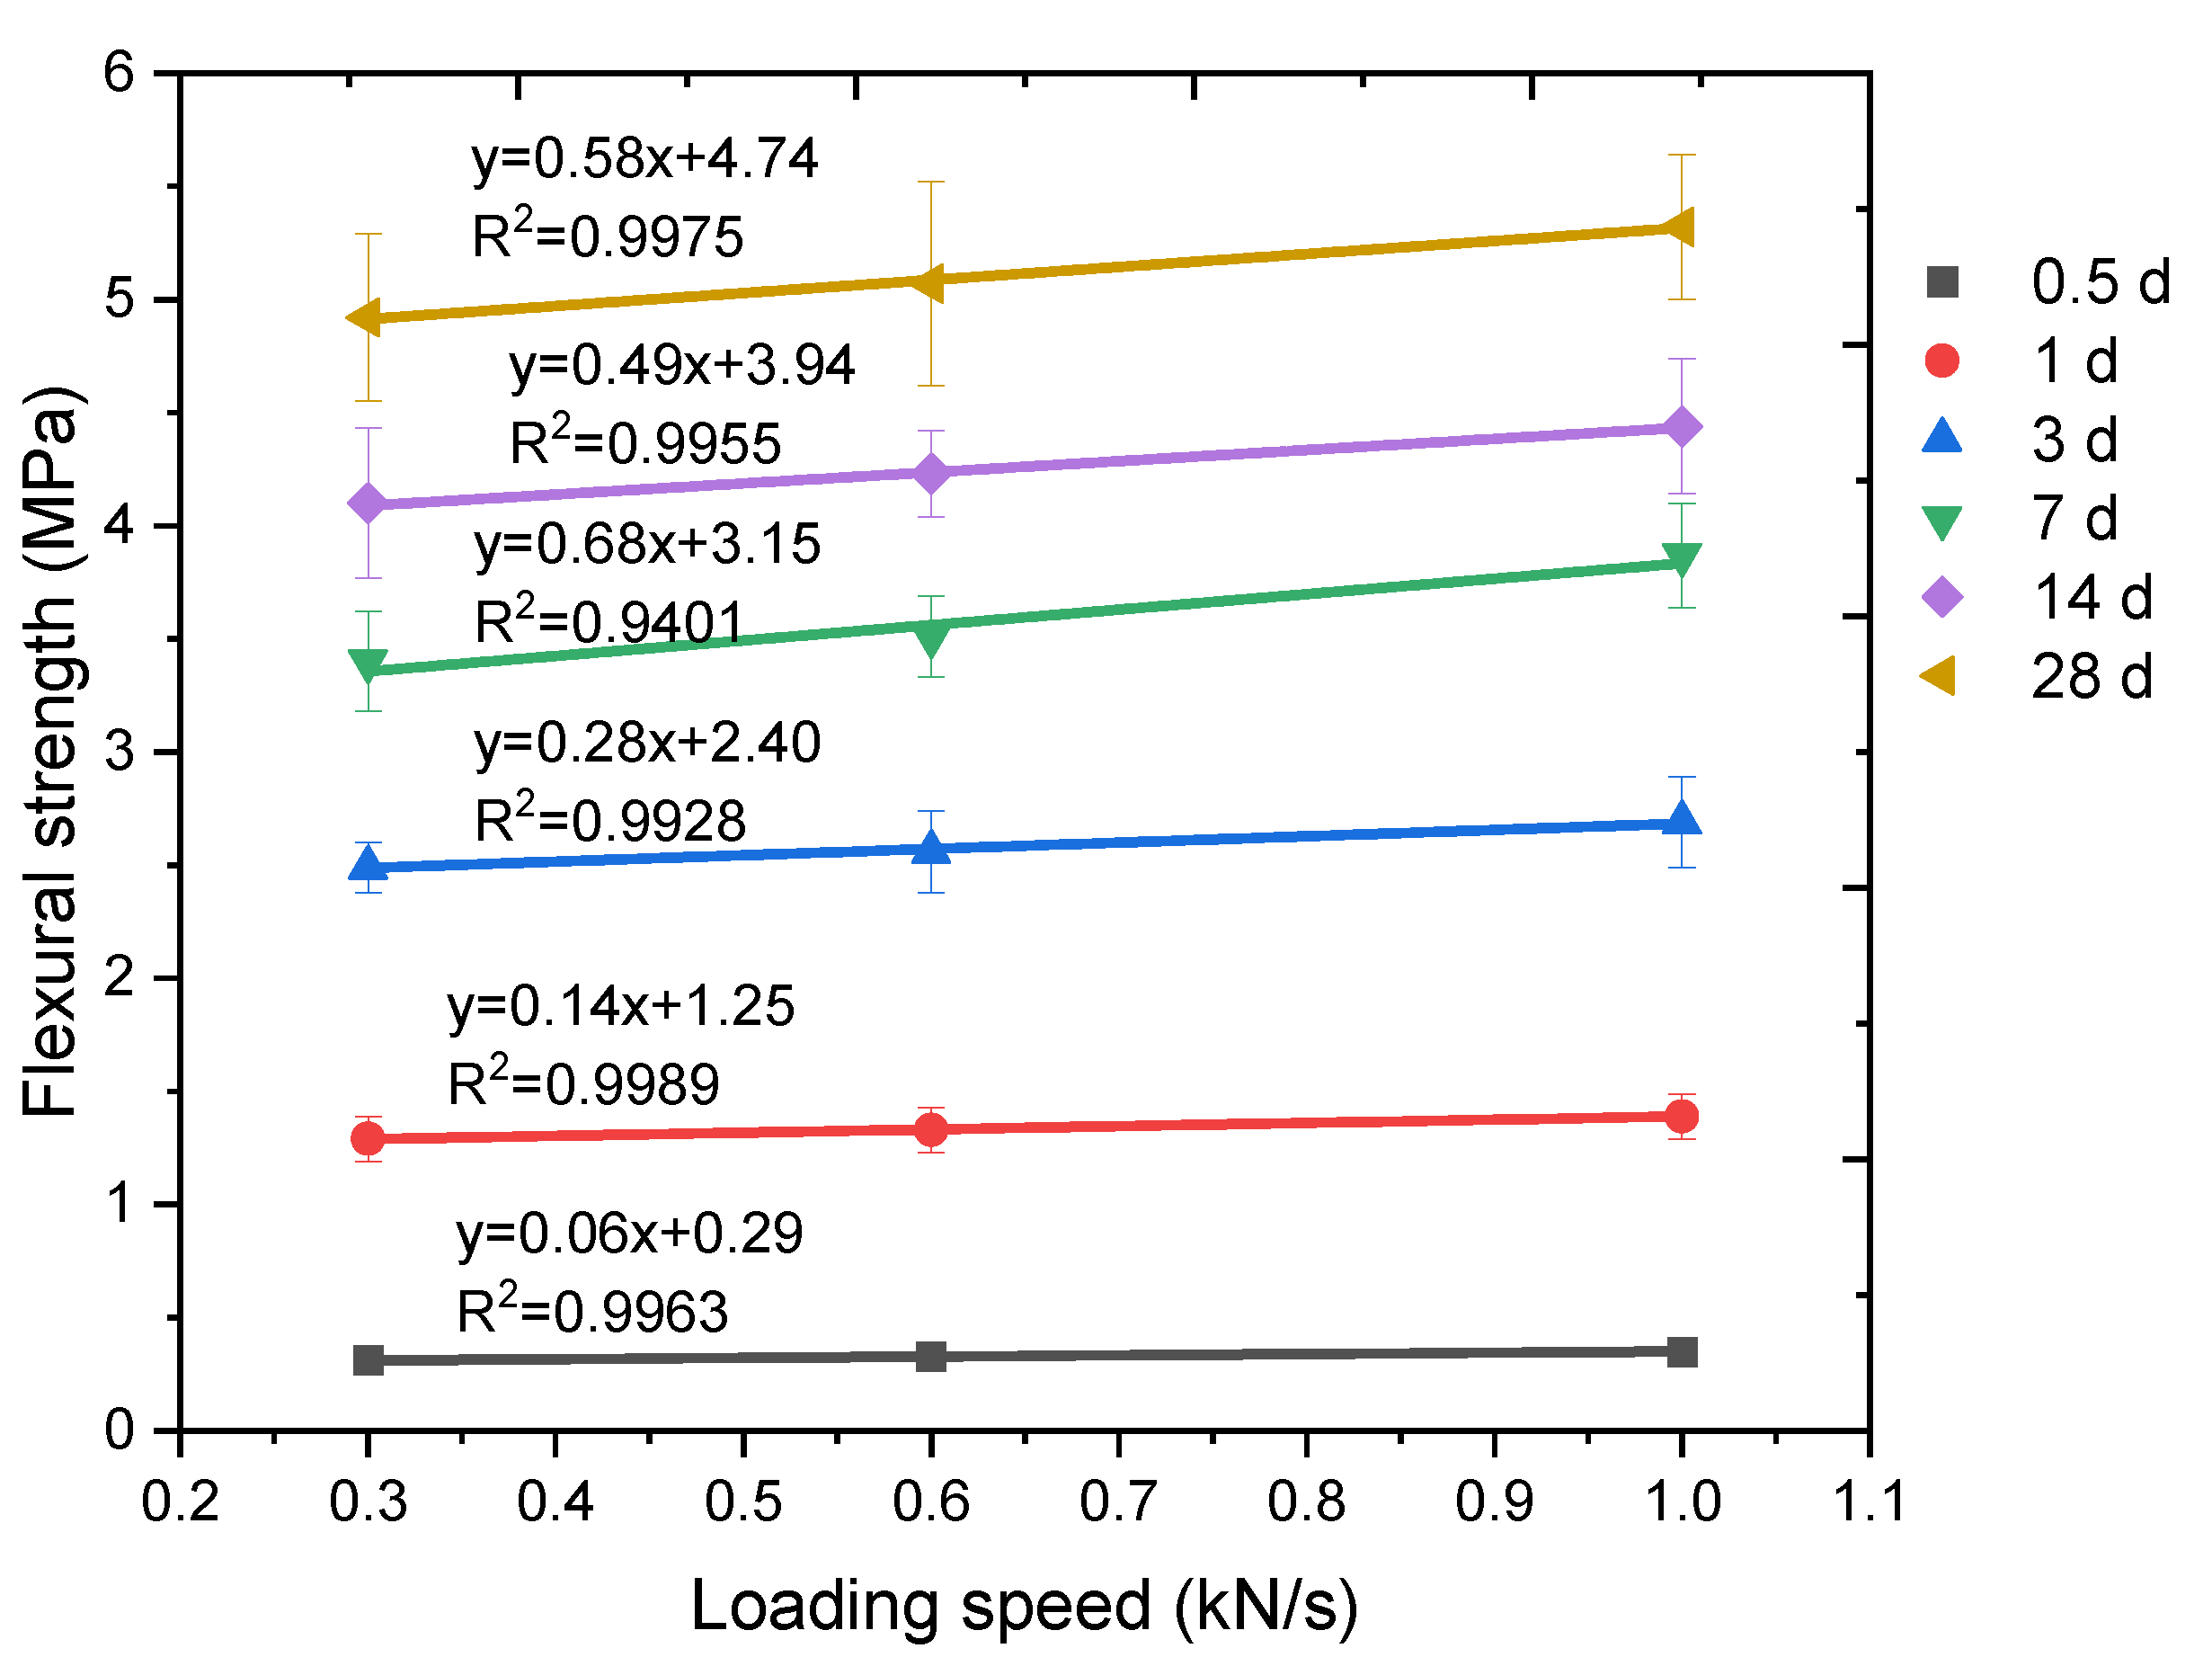
3.2. The Influence of Loading Speed on the Mechanical Tests Results

The compressive and flexural strength increases or decreases of 0.6 kN/s and 1.0 kN/s in terms of 0.3 kN/s are concluded in Table 4. A higher loading speed usually accompanied higher compressive and flexural strength results. Kaplan [34] studied the influence of loading rate on the compressive strength of concrete. The moisture content was found to be one of the important variables affecting the relationship between strength and loading speed. When compression loads are applied to a sample, the micropore network within the matrix tends to close, and then the pore solution is compressed. This process is usually accompanied by a pressure gradient in liquid phase. At a higher loading speed, the pressure gradient may give rise to hydrostatic pressure in the pores. This, in turn, delays the onset of excessive cracking within the solid phase and thereby gives rise to an increase in the compressive and flexural strength, since the flexural strength sample also has a compression section. Fu et al. [35] also found that the moisture content of concrete is an important factor influencing the strength under different loading speeds.

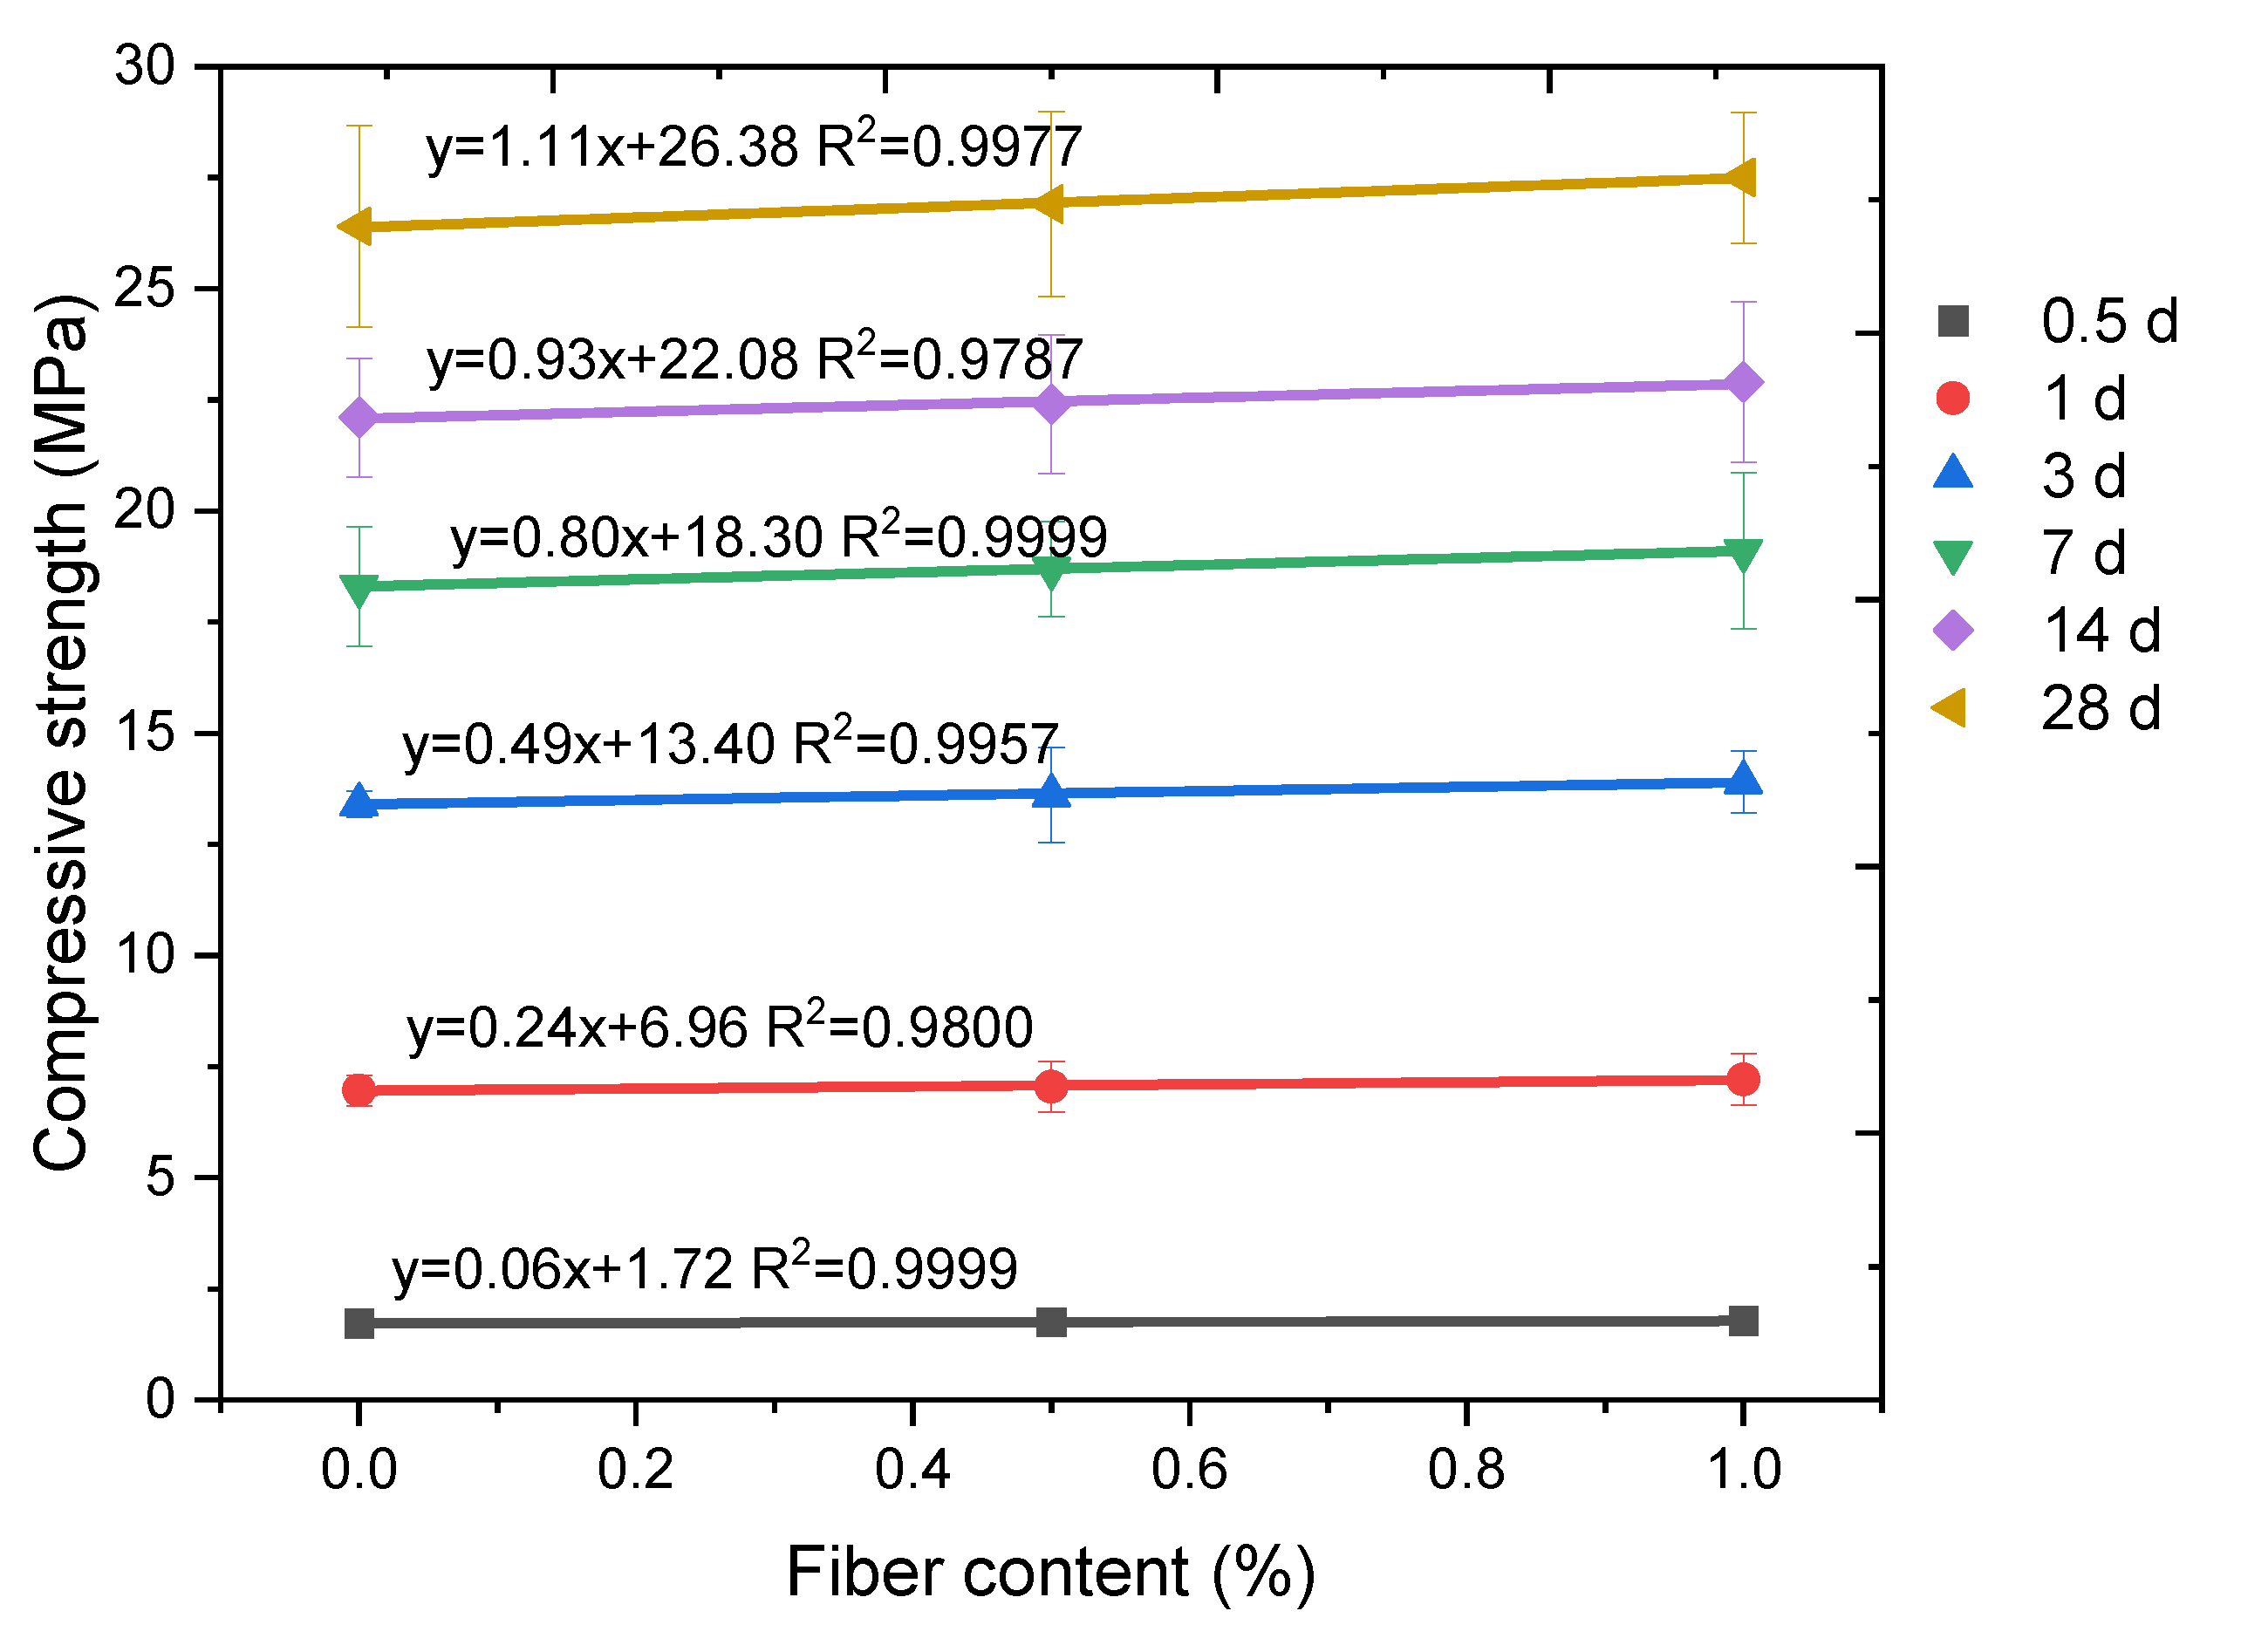
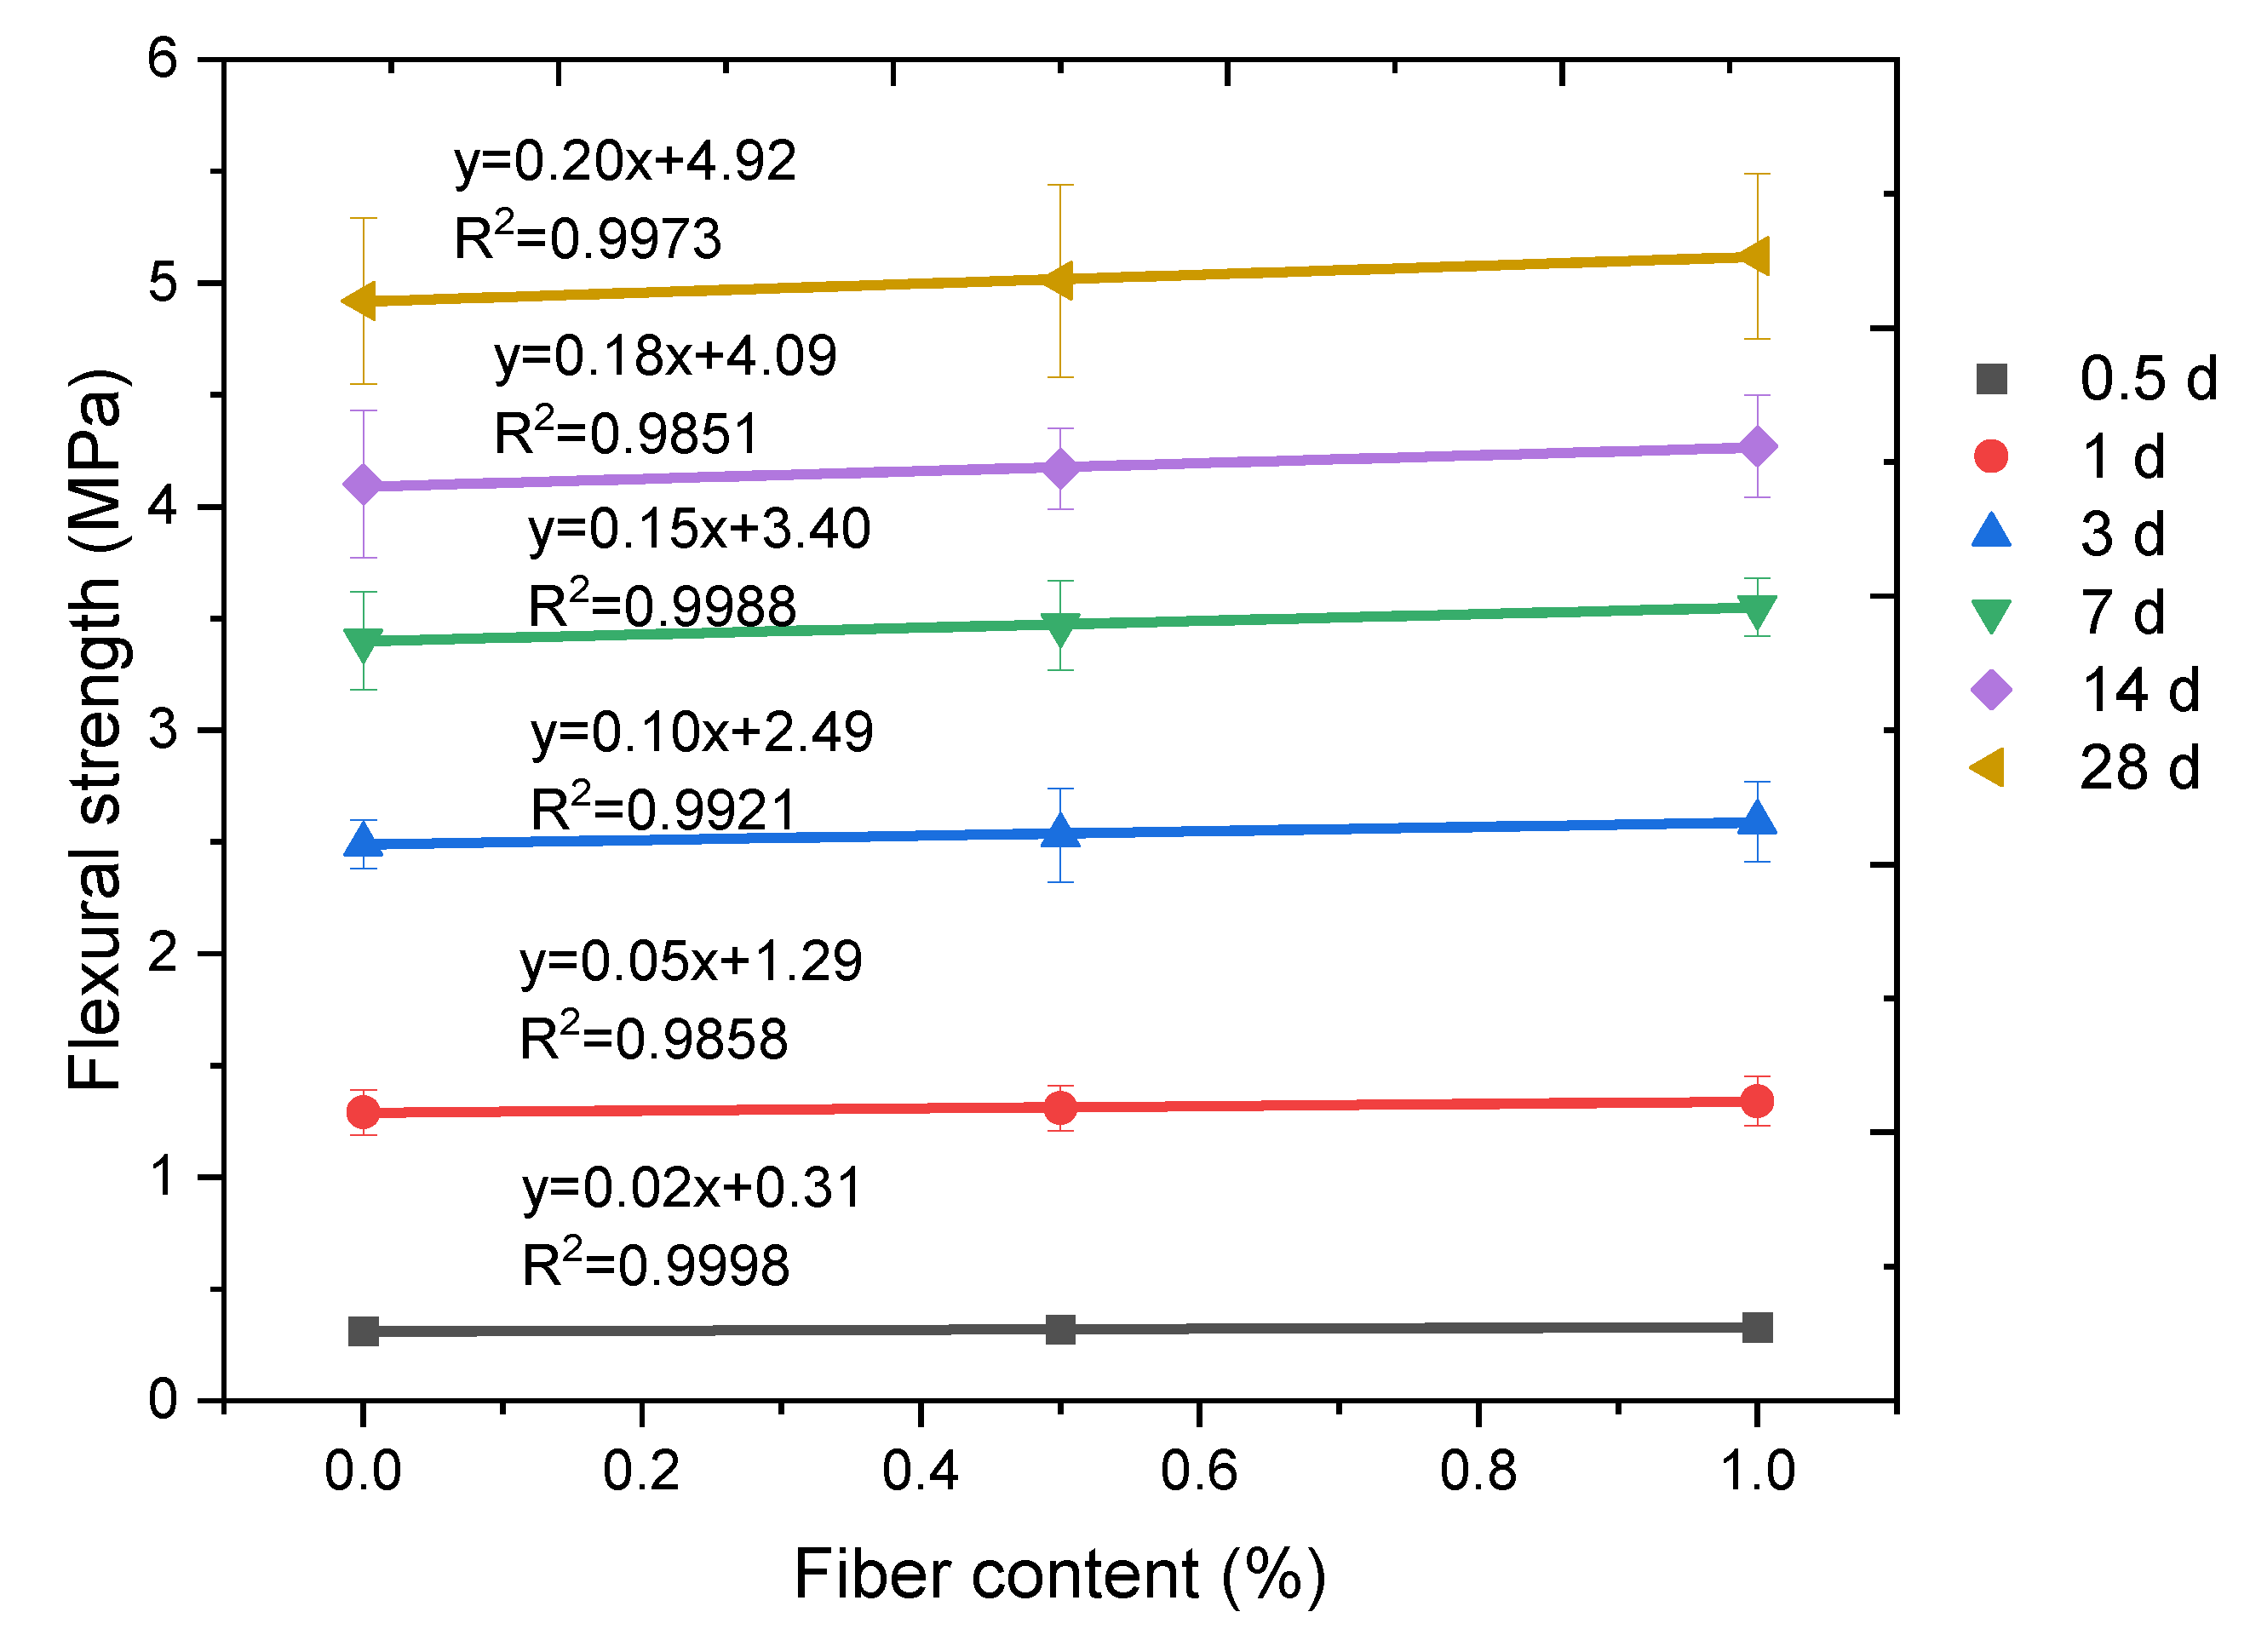
3.3. The Influence of PPF Content on the Mechanical Test Results

The compressive and flexural strength increases or decreases of PPF mortar in terms of plain mortar are concluded in Table 5. It can be seen from Table 5 that the compressive strength of the PPF mortar was higher than the plain mortar of the same age and loading speed. The improvement in compressive strength came principally from the fibers interacting with the advancing cracks [37]. When withstanding an increasing compression load, fibrous mortar samples might develop lateral tension, thus initiating microcracks, and then these microcracks could advance into macrocracks. As the advancing microcracks approached a fiber, debonding at the fiber–matrix interface began due to the tensile stresses perpendicular to the expected path of the advancing crack. When the advancing microcracks finally reached the fiber–matrix interface, the tip of the crack encountered a process of blunting because of the already presented debonding cracks. The blunting process reduced the crack-tip stress concentration, thus blocking the forward propagation of the crack and even diverting the path of the crack. The blunting, blocking, and even diverting of the crack allowed the fibrous mortar samples to withstand additional compressive load, thus upgrading its compressive strength over the plain mortar samples.

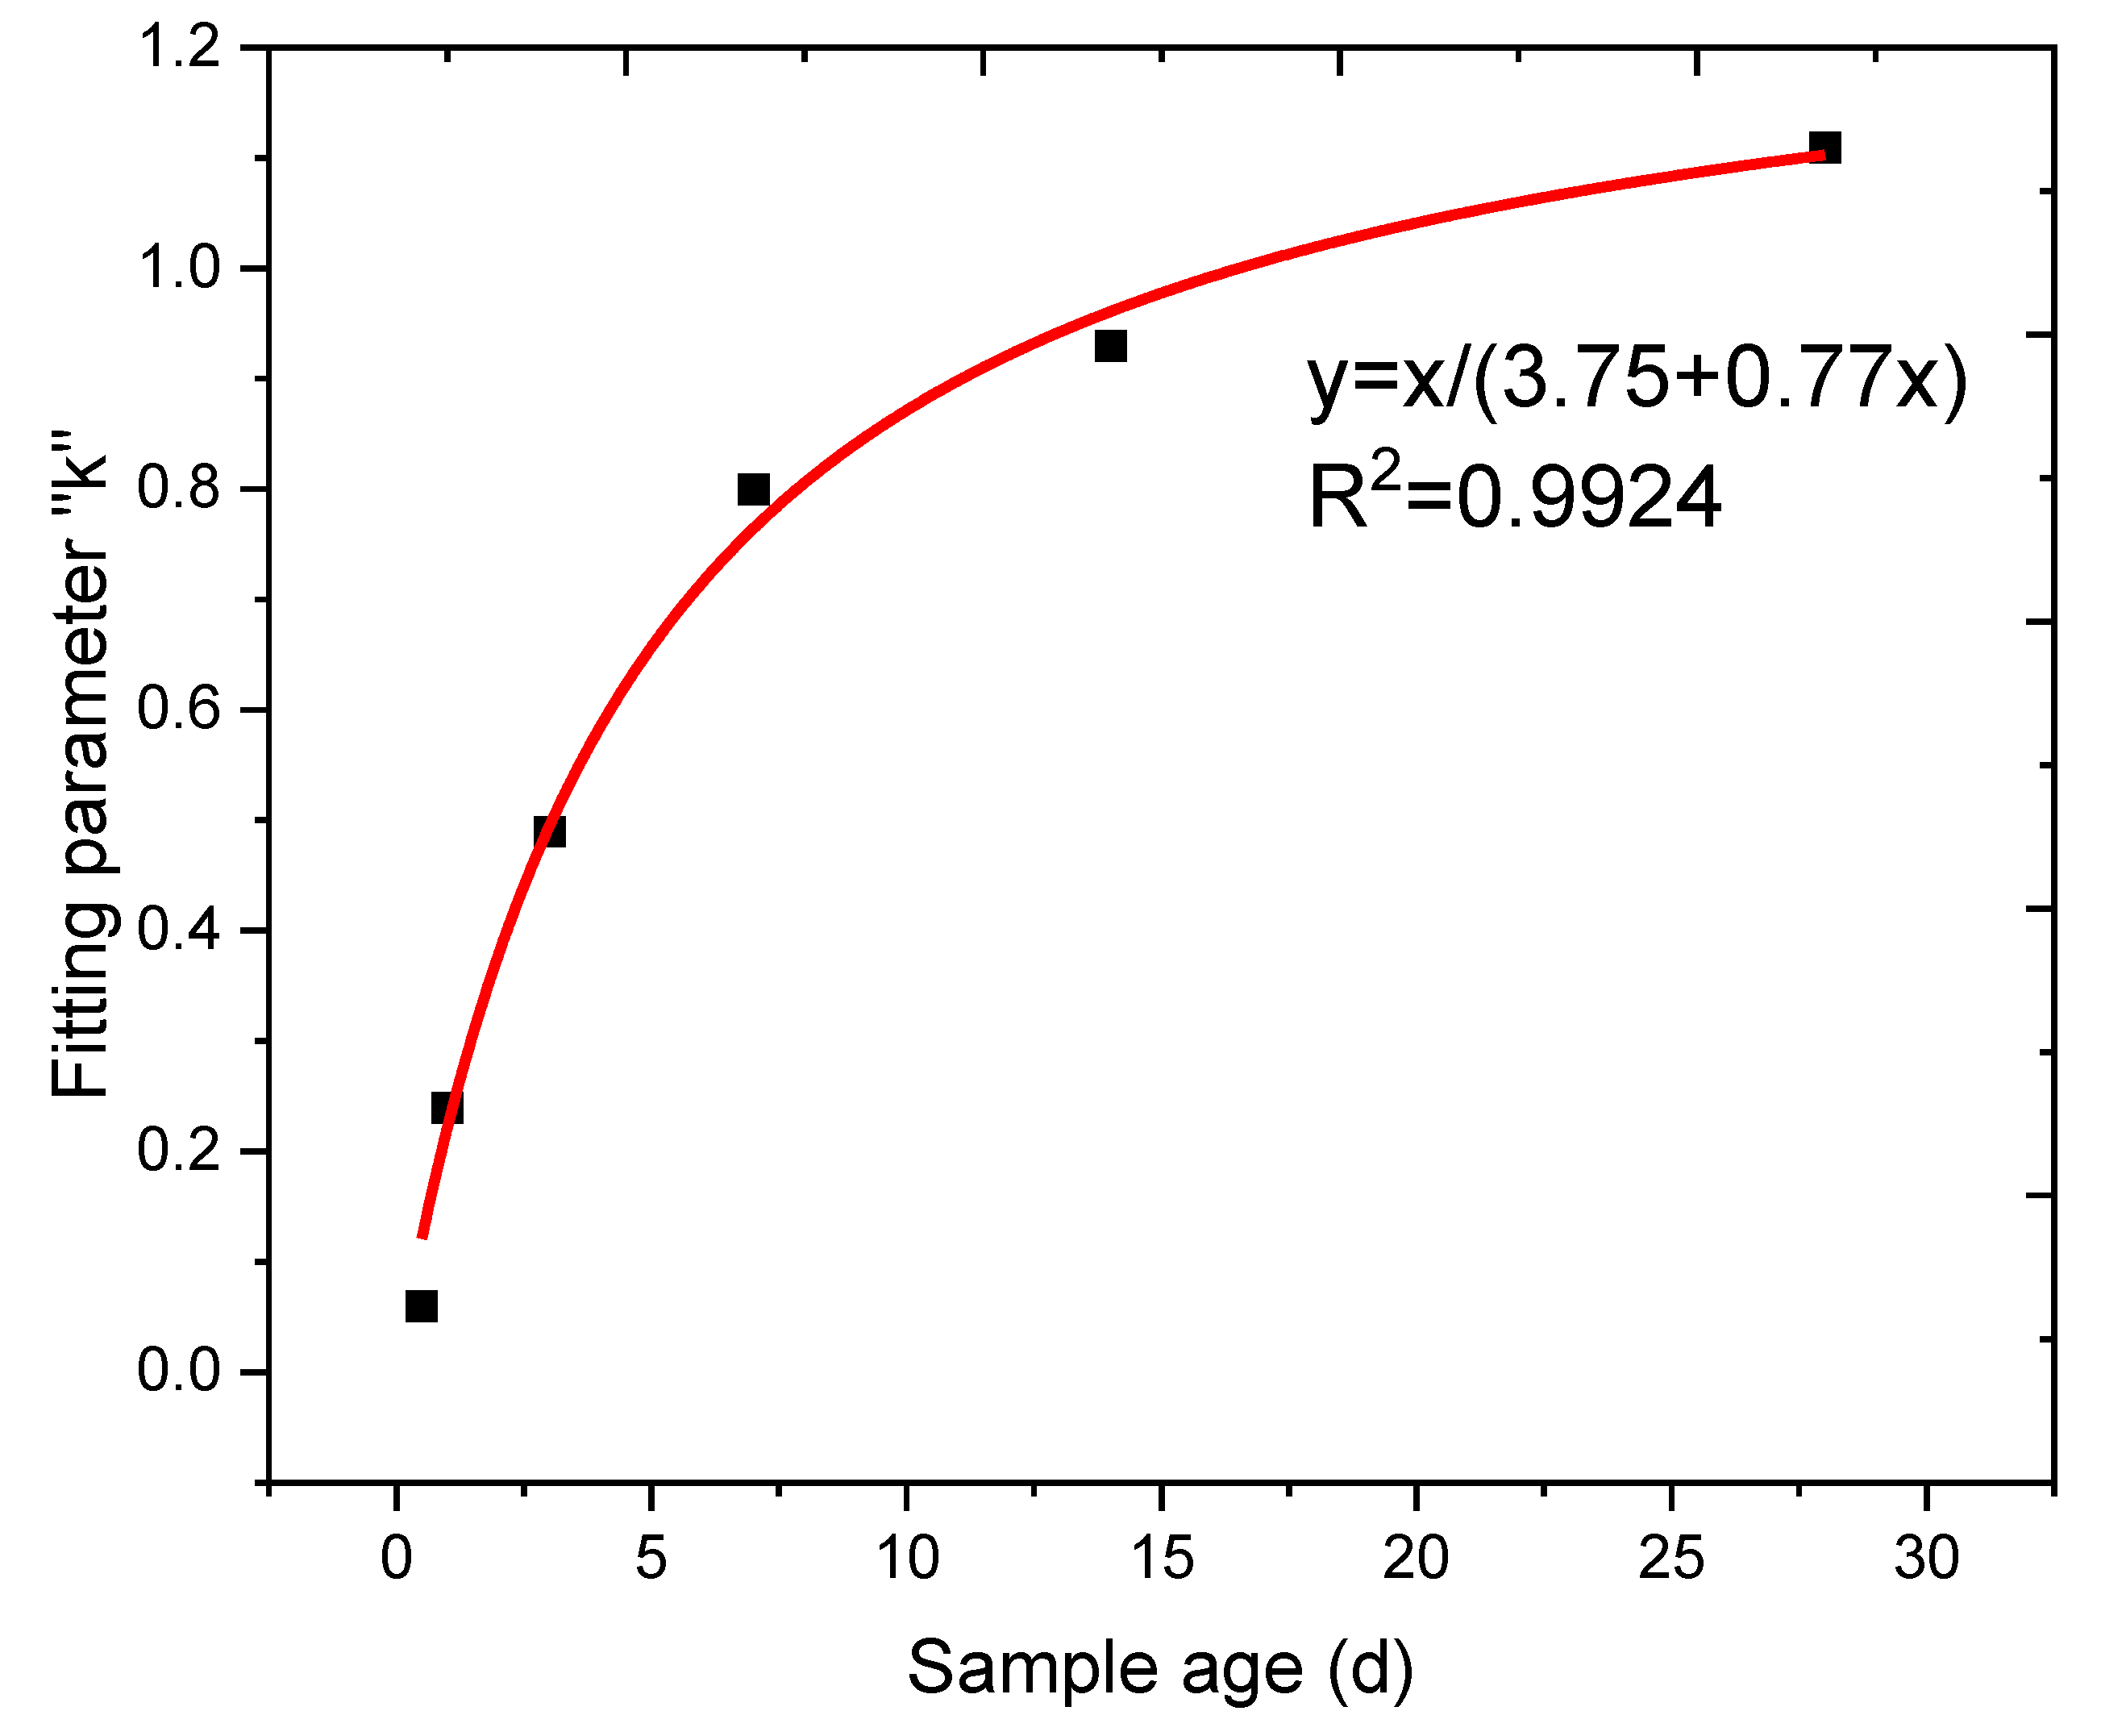
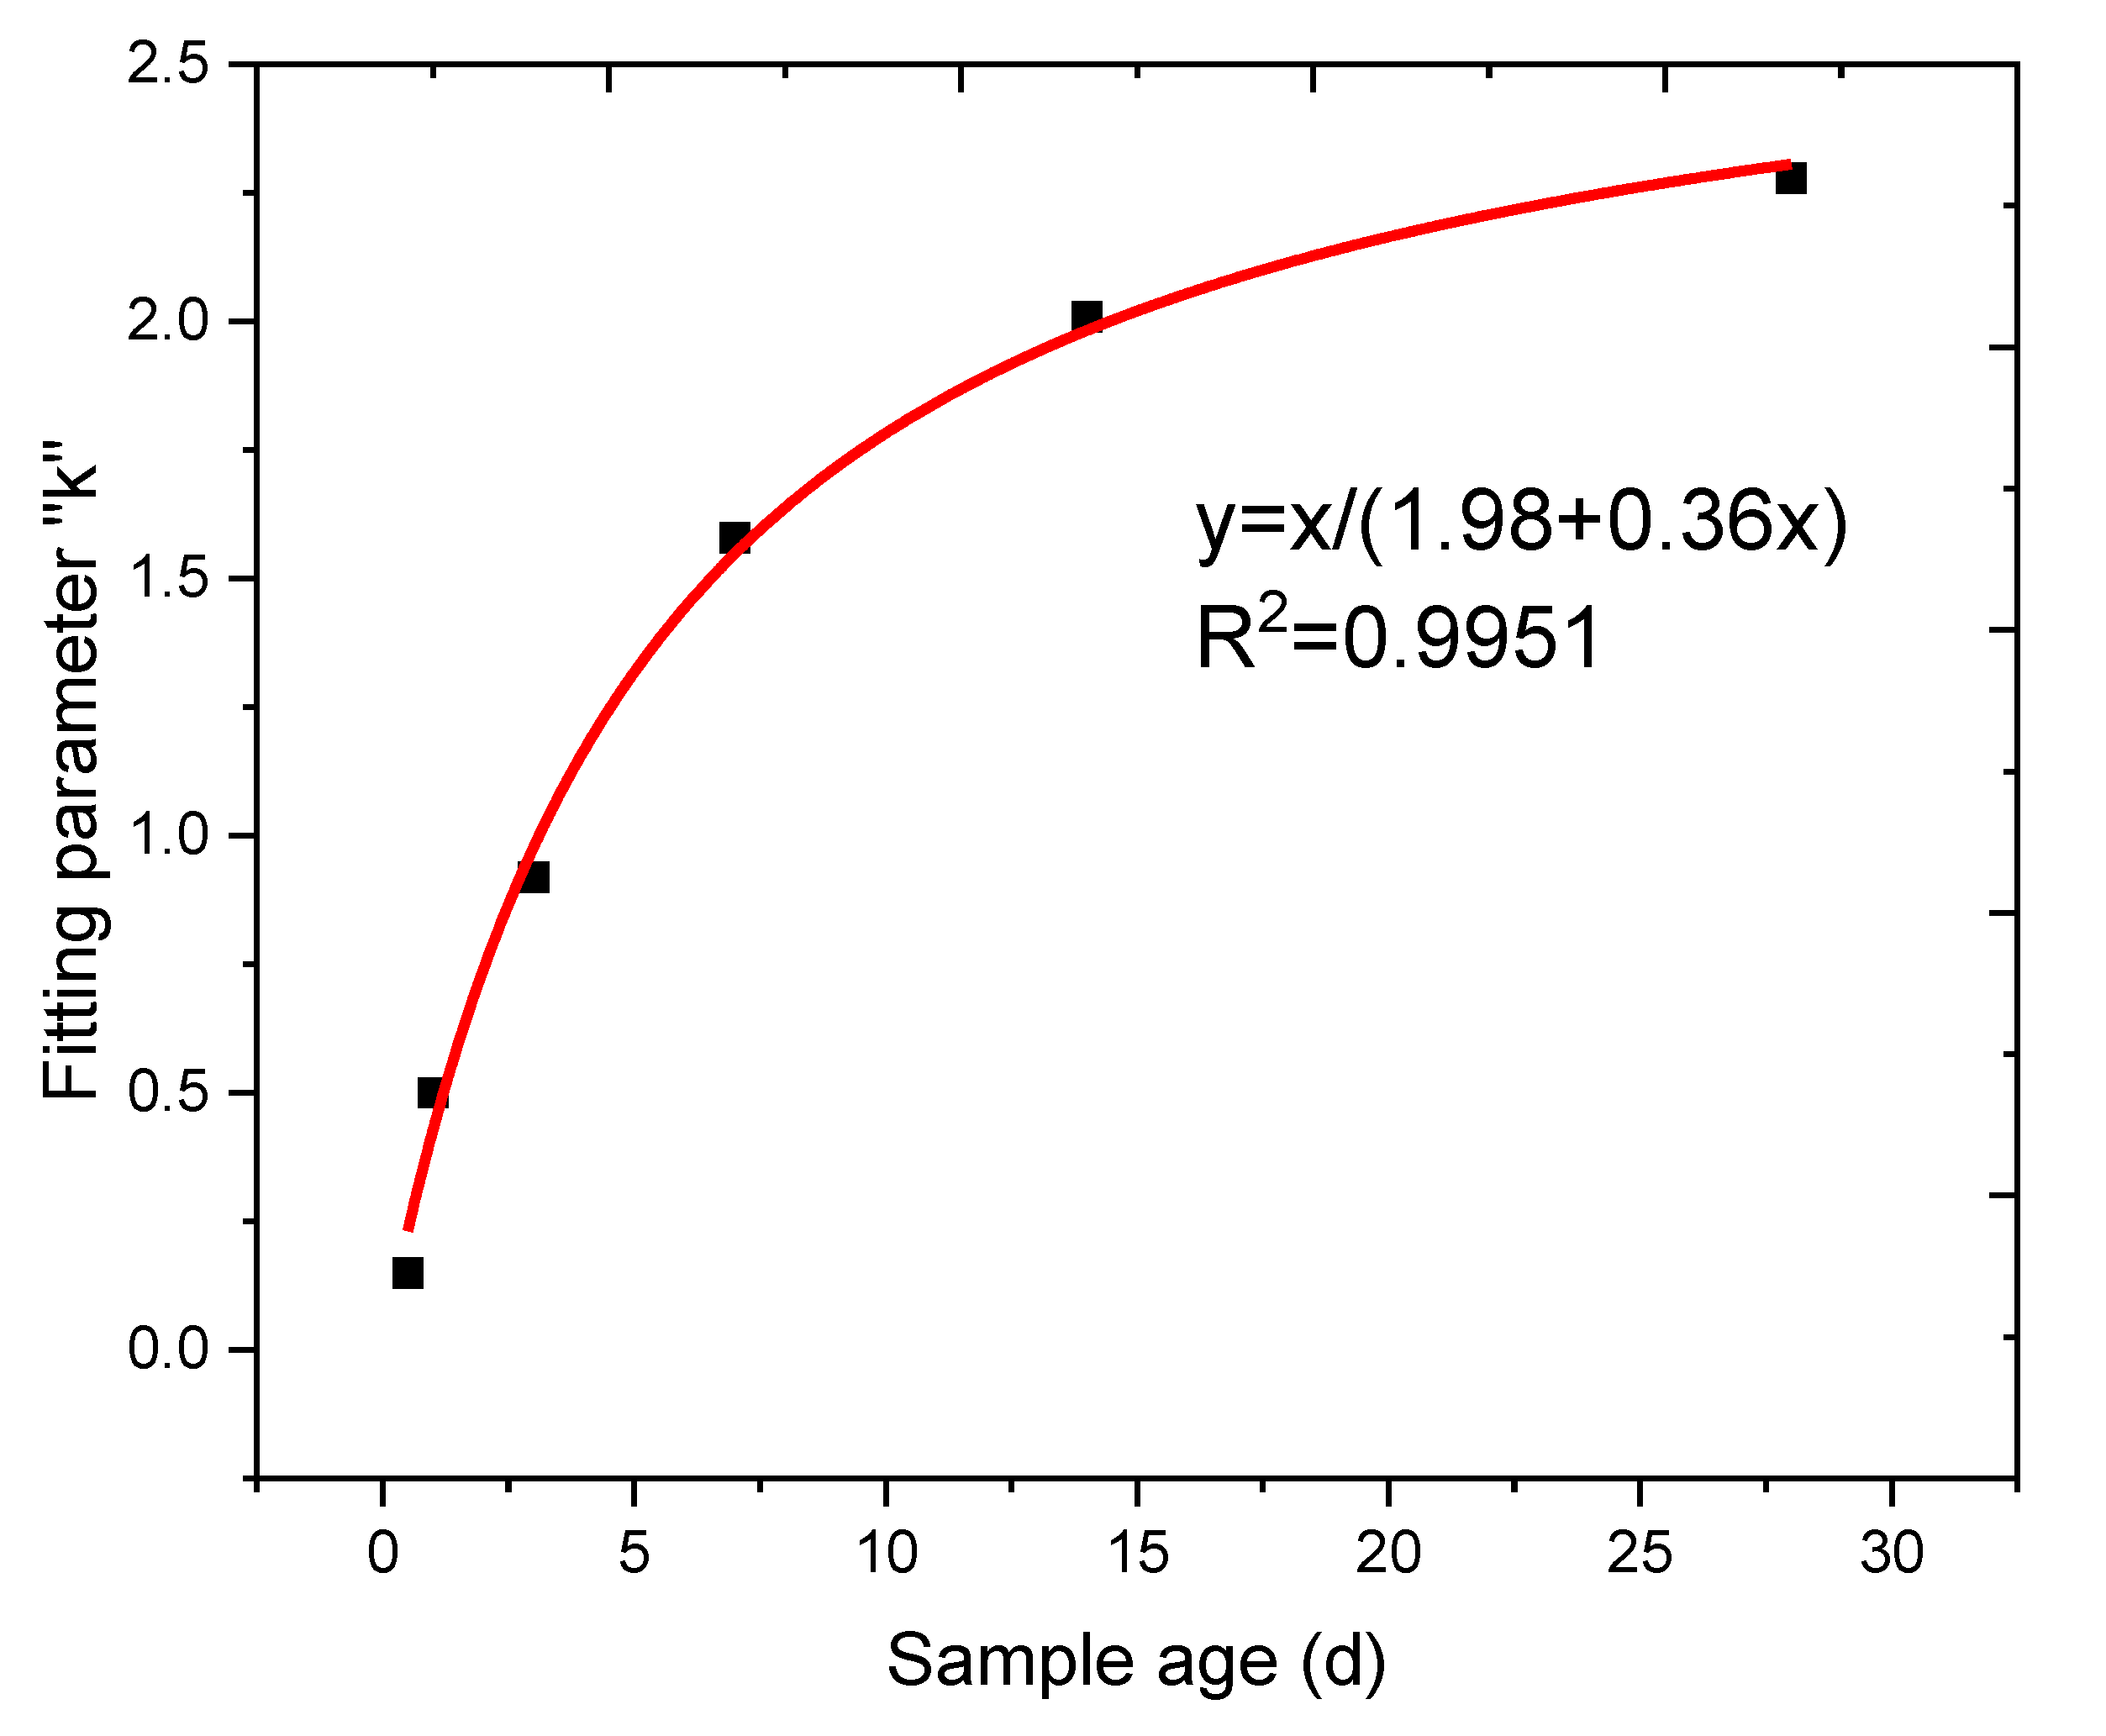
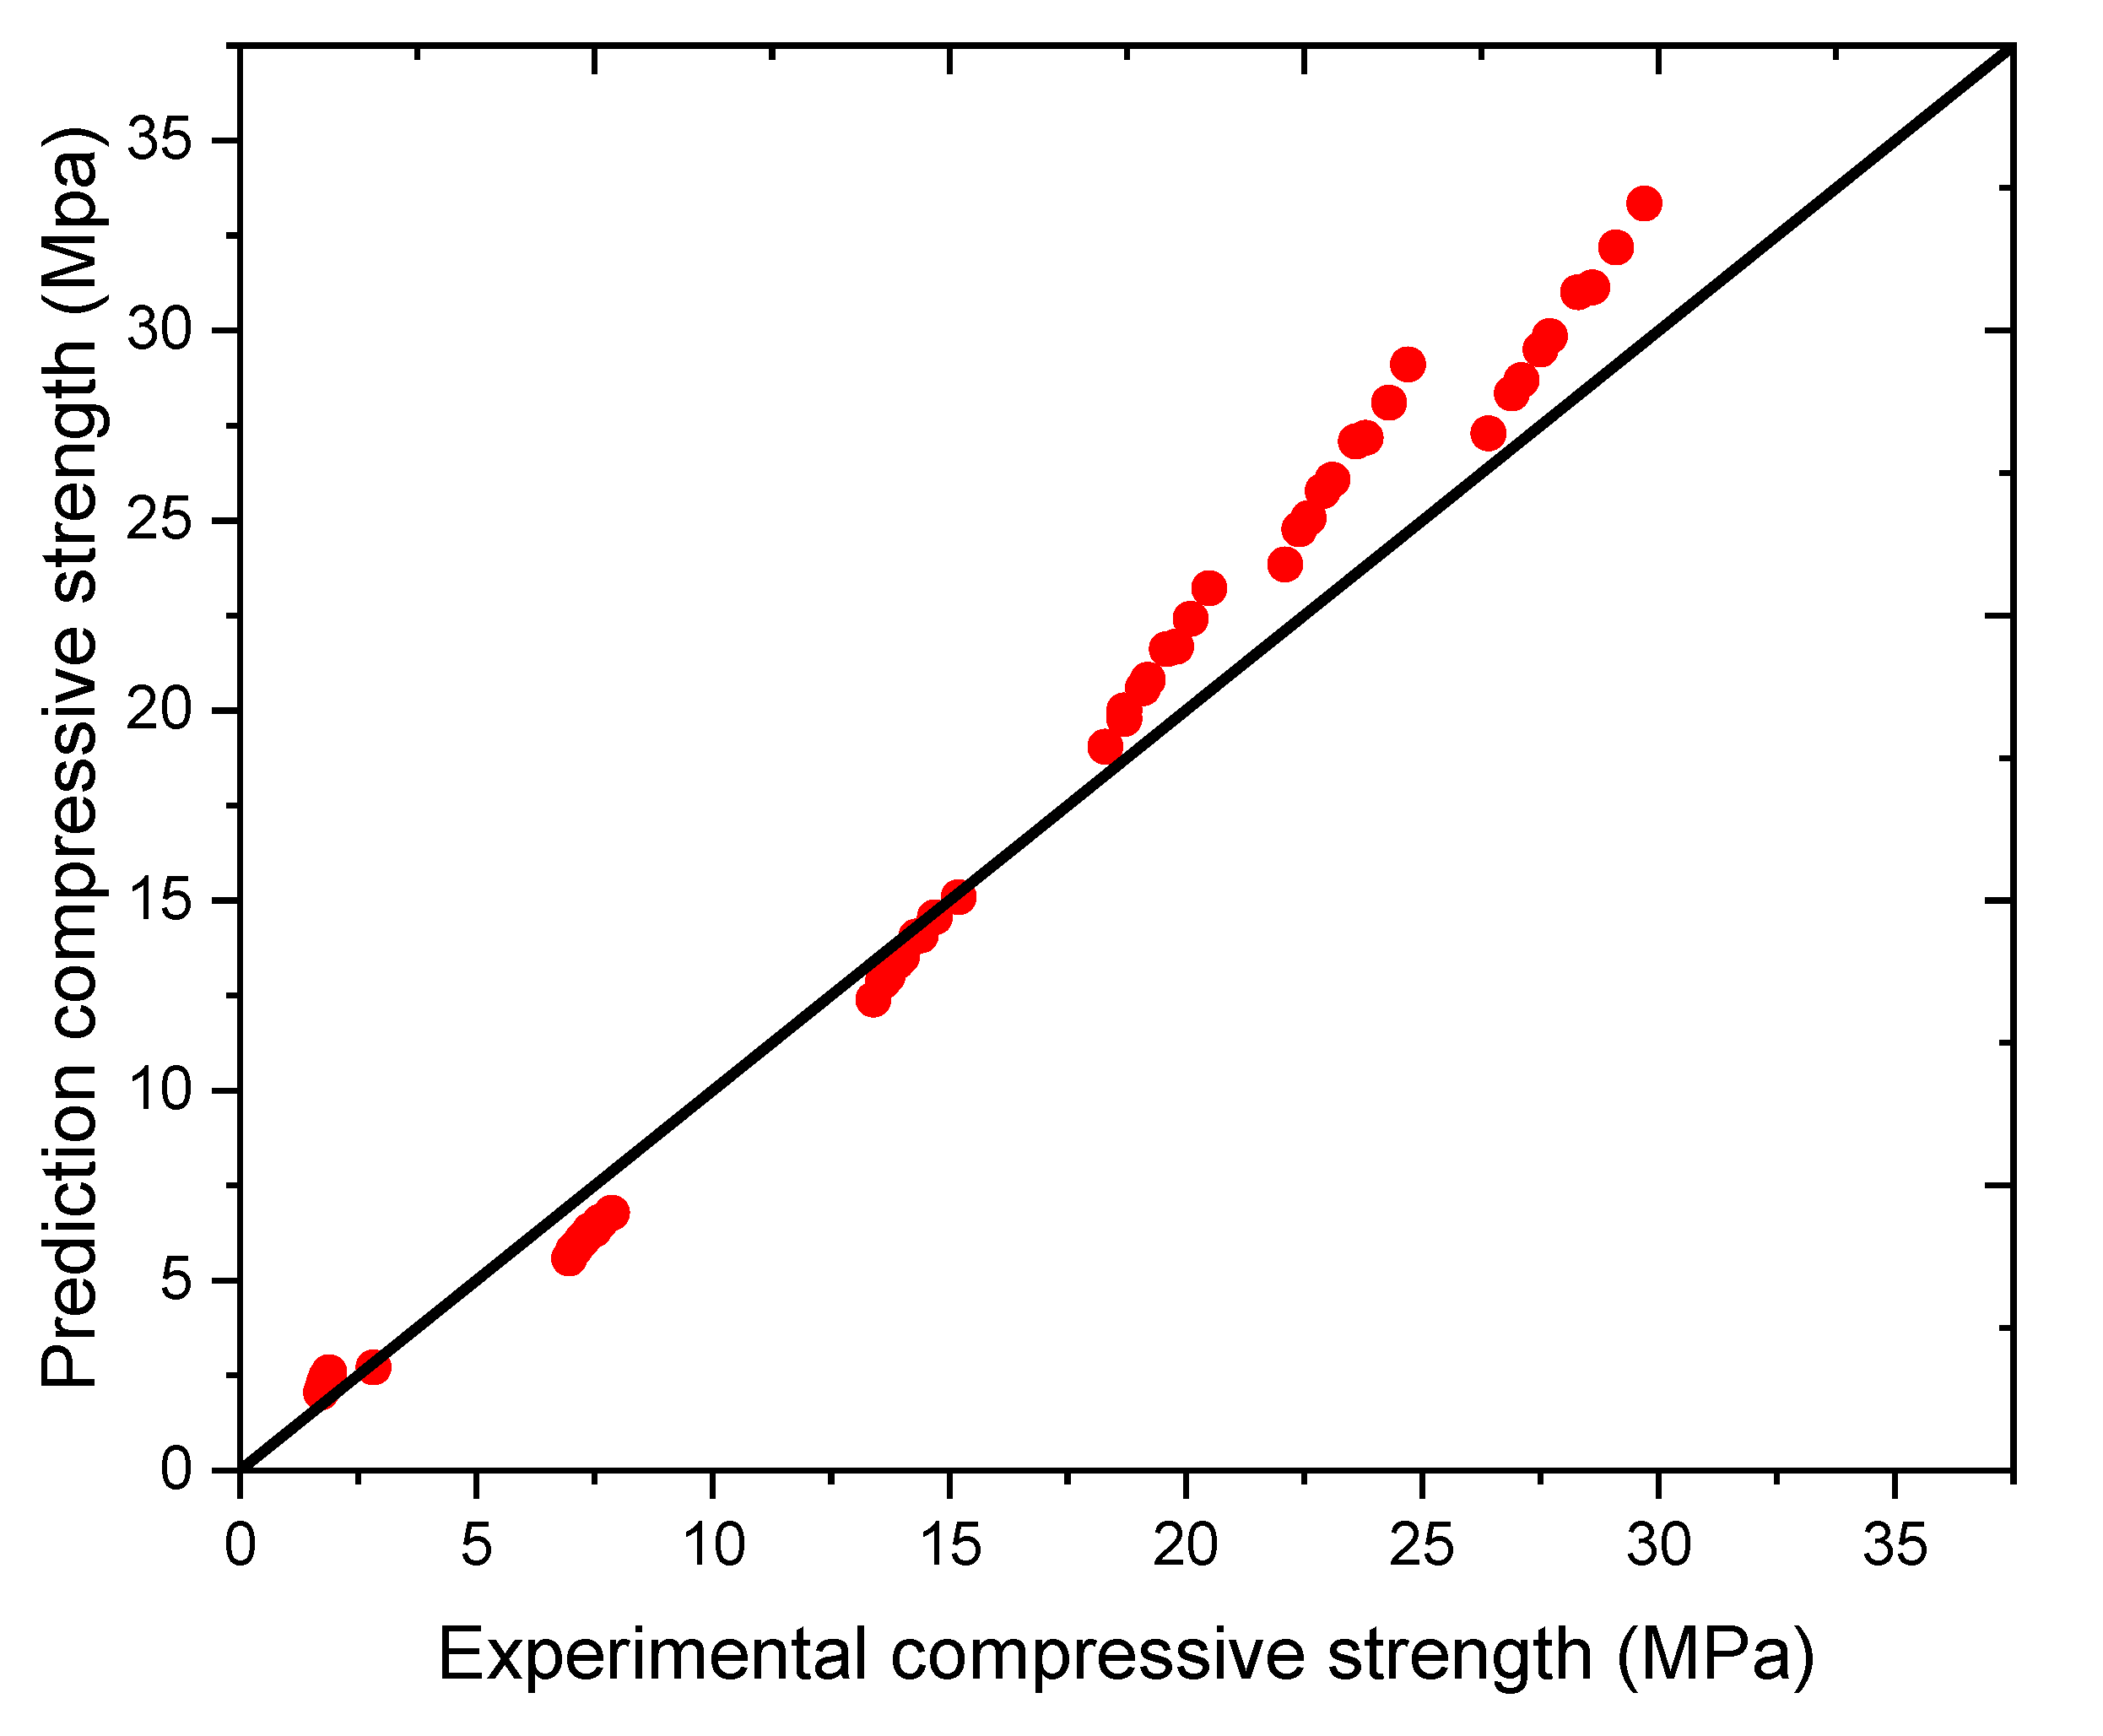
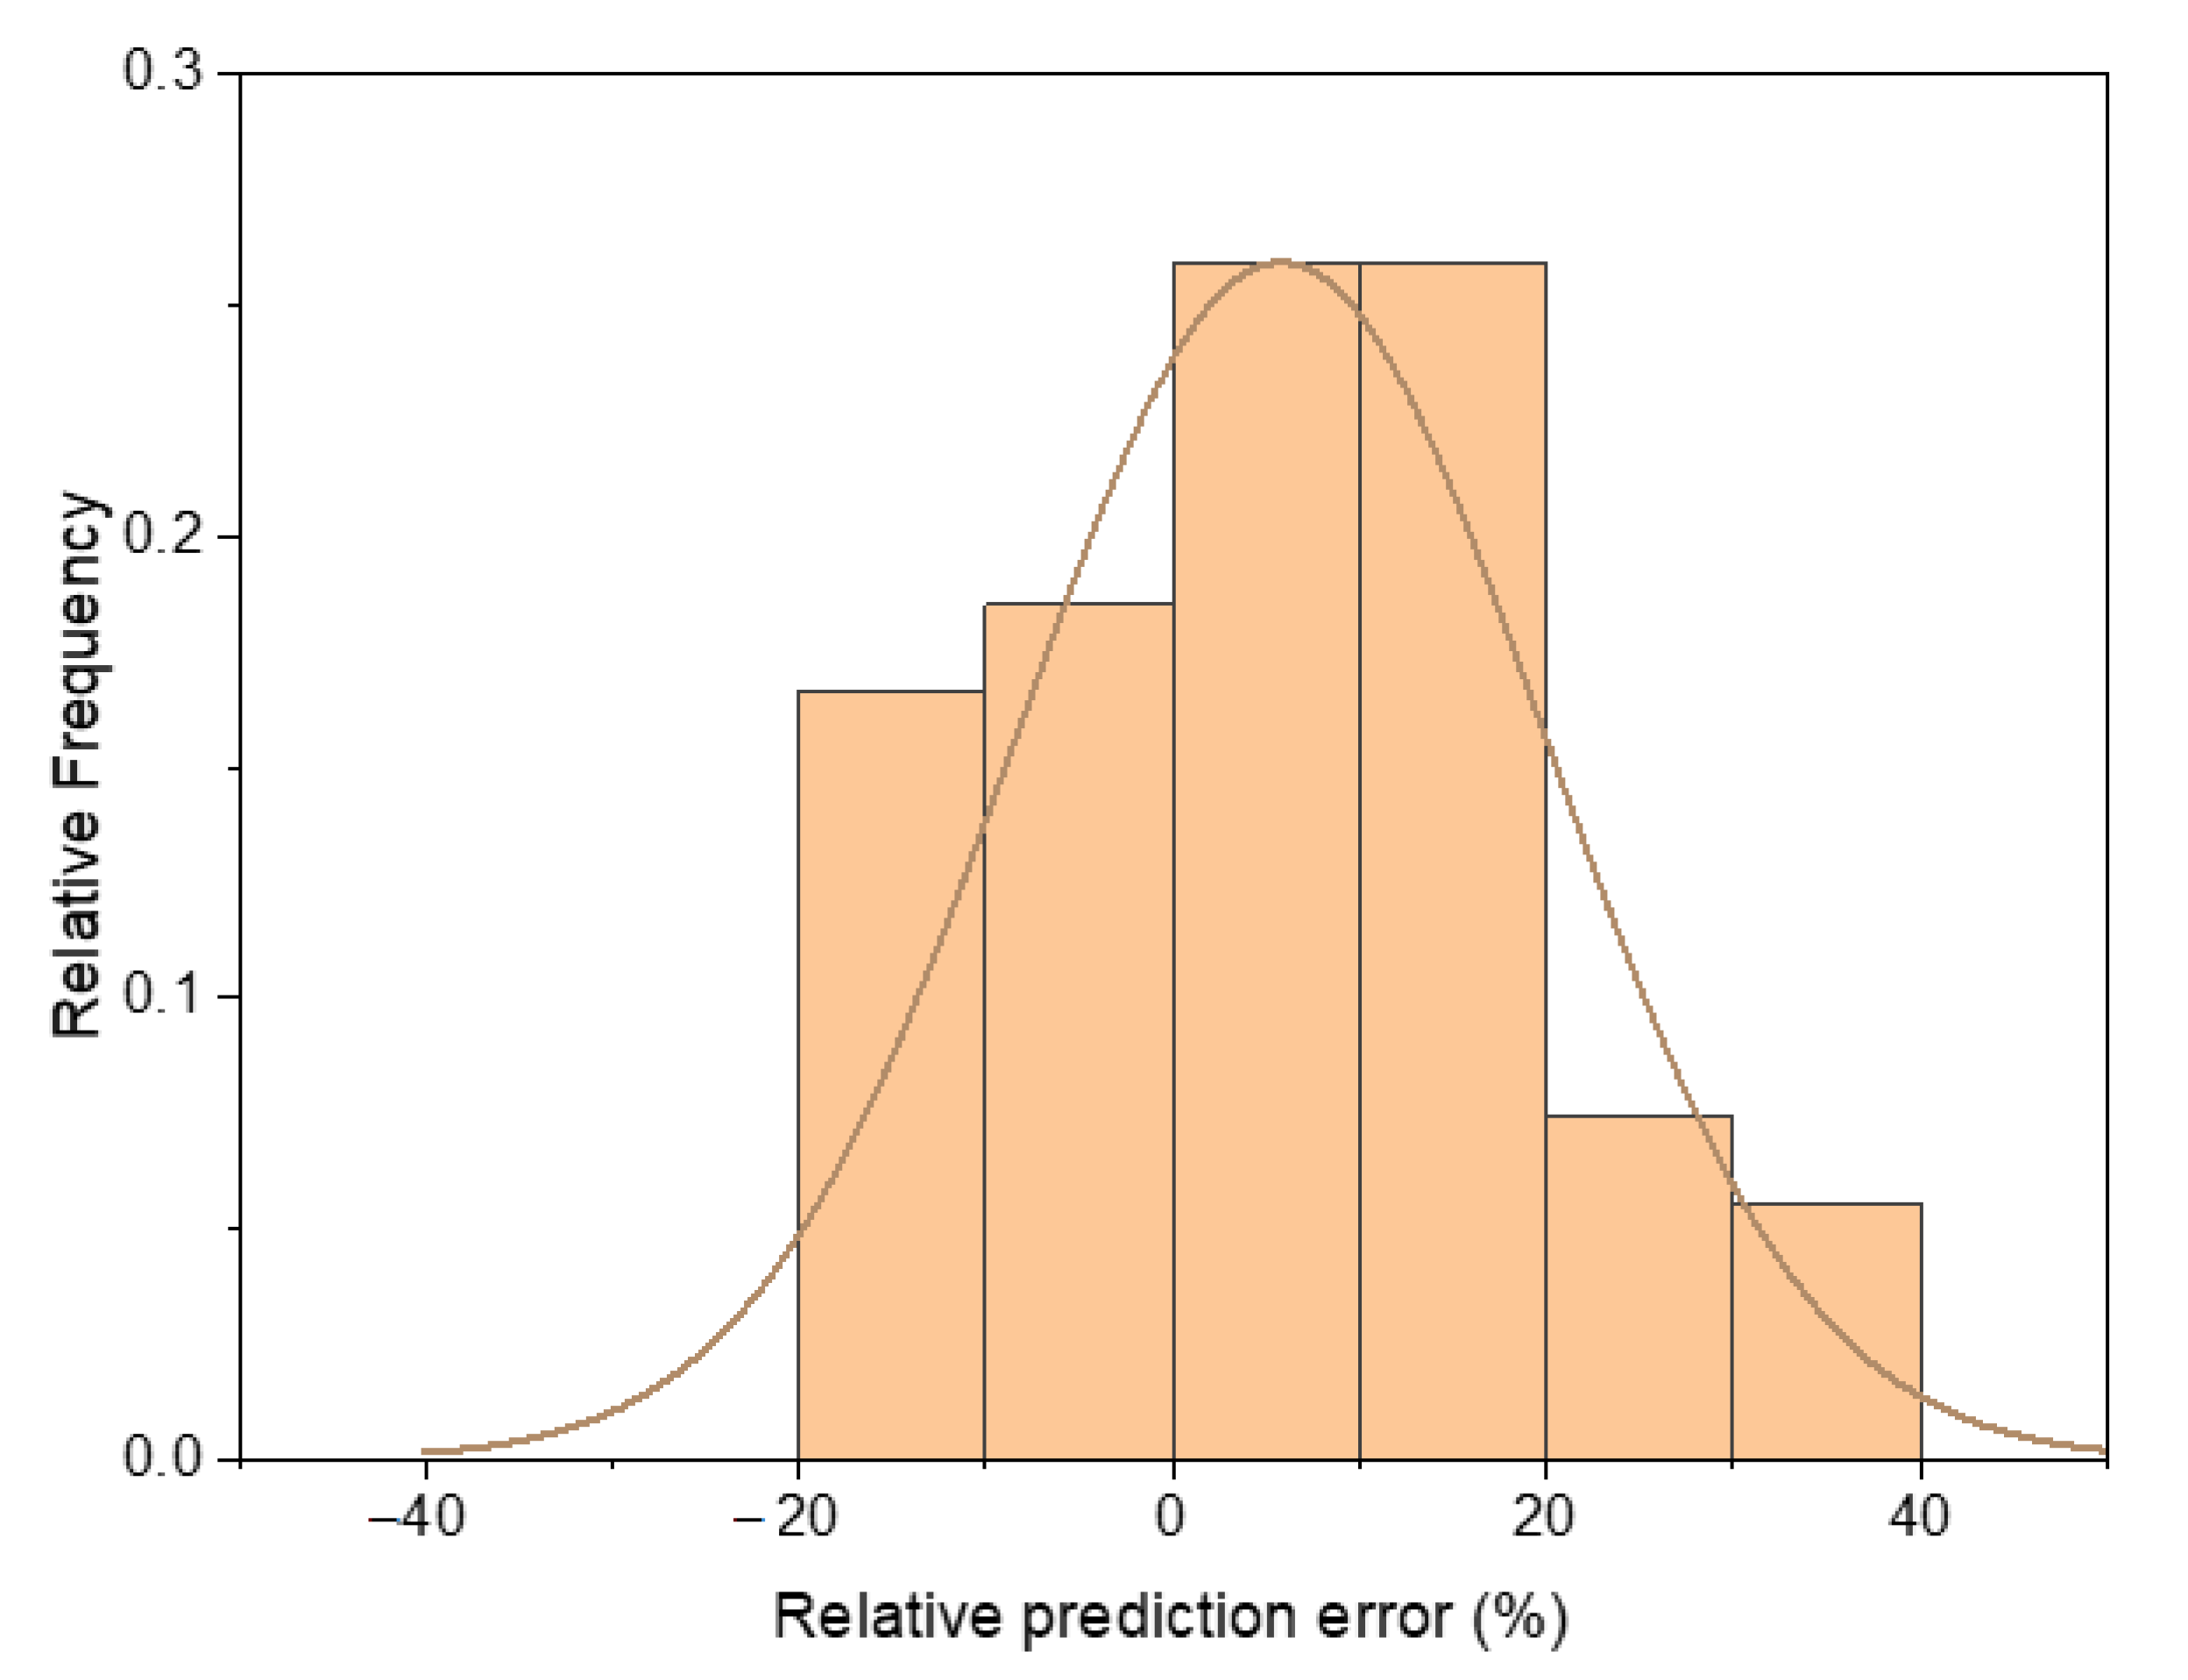
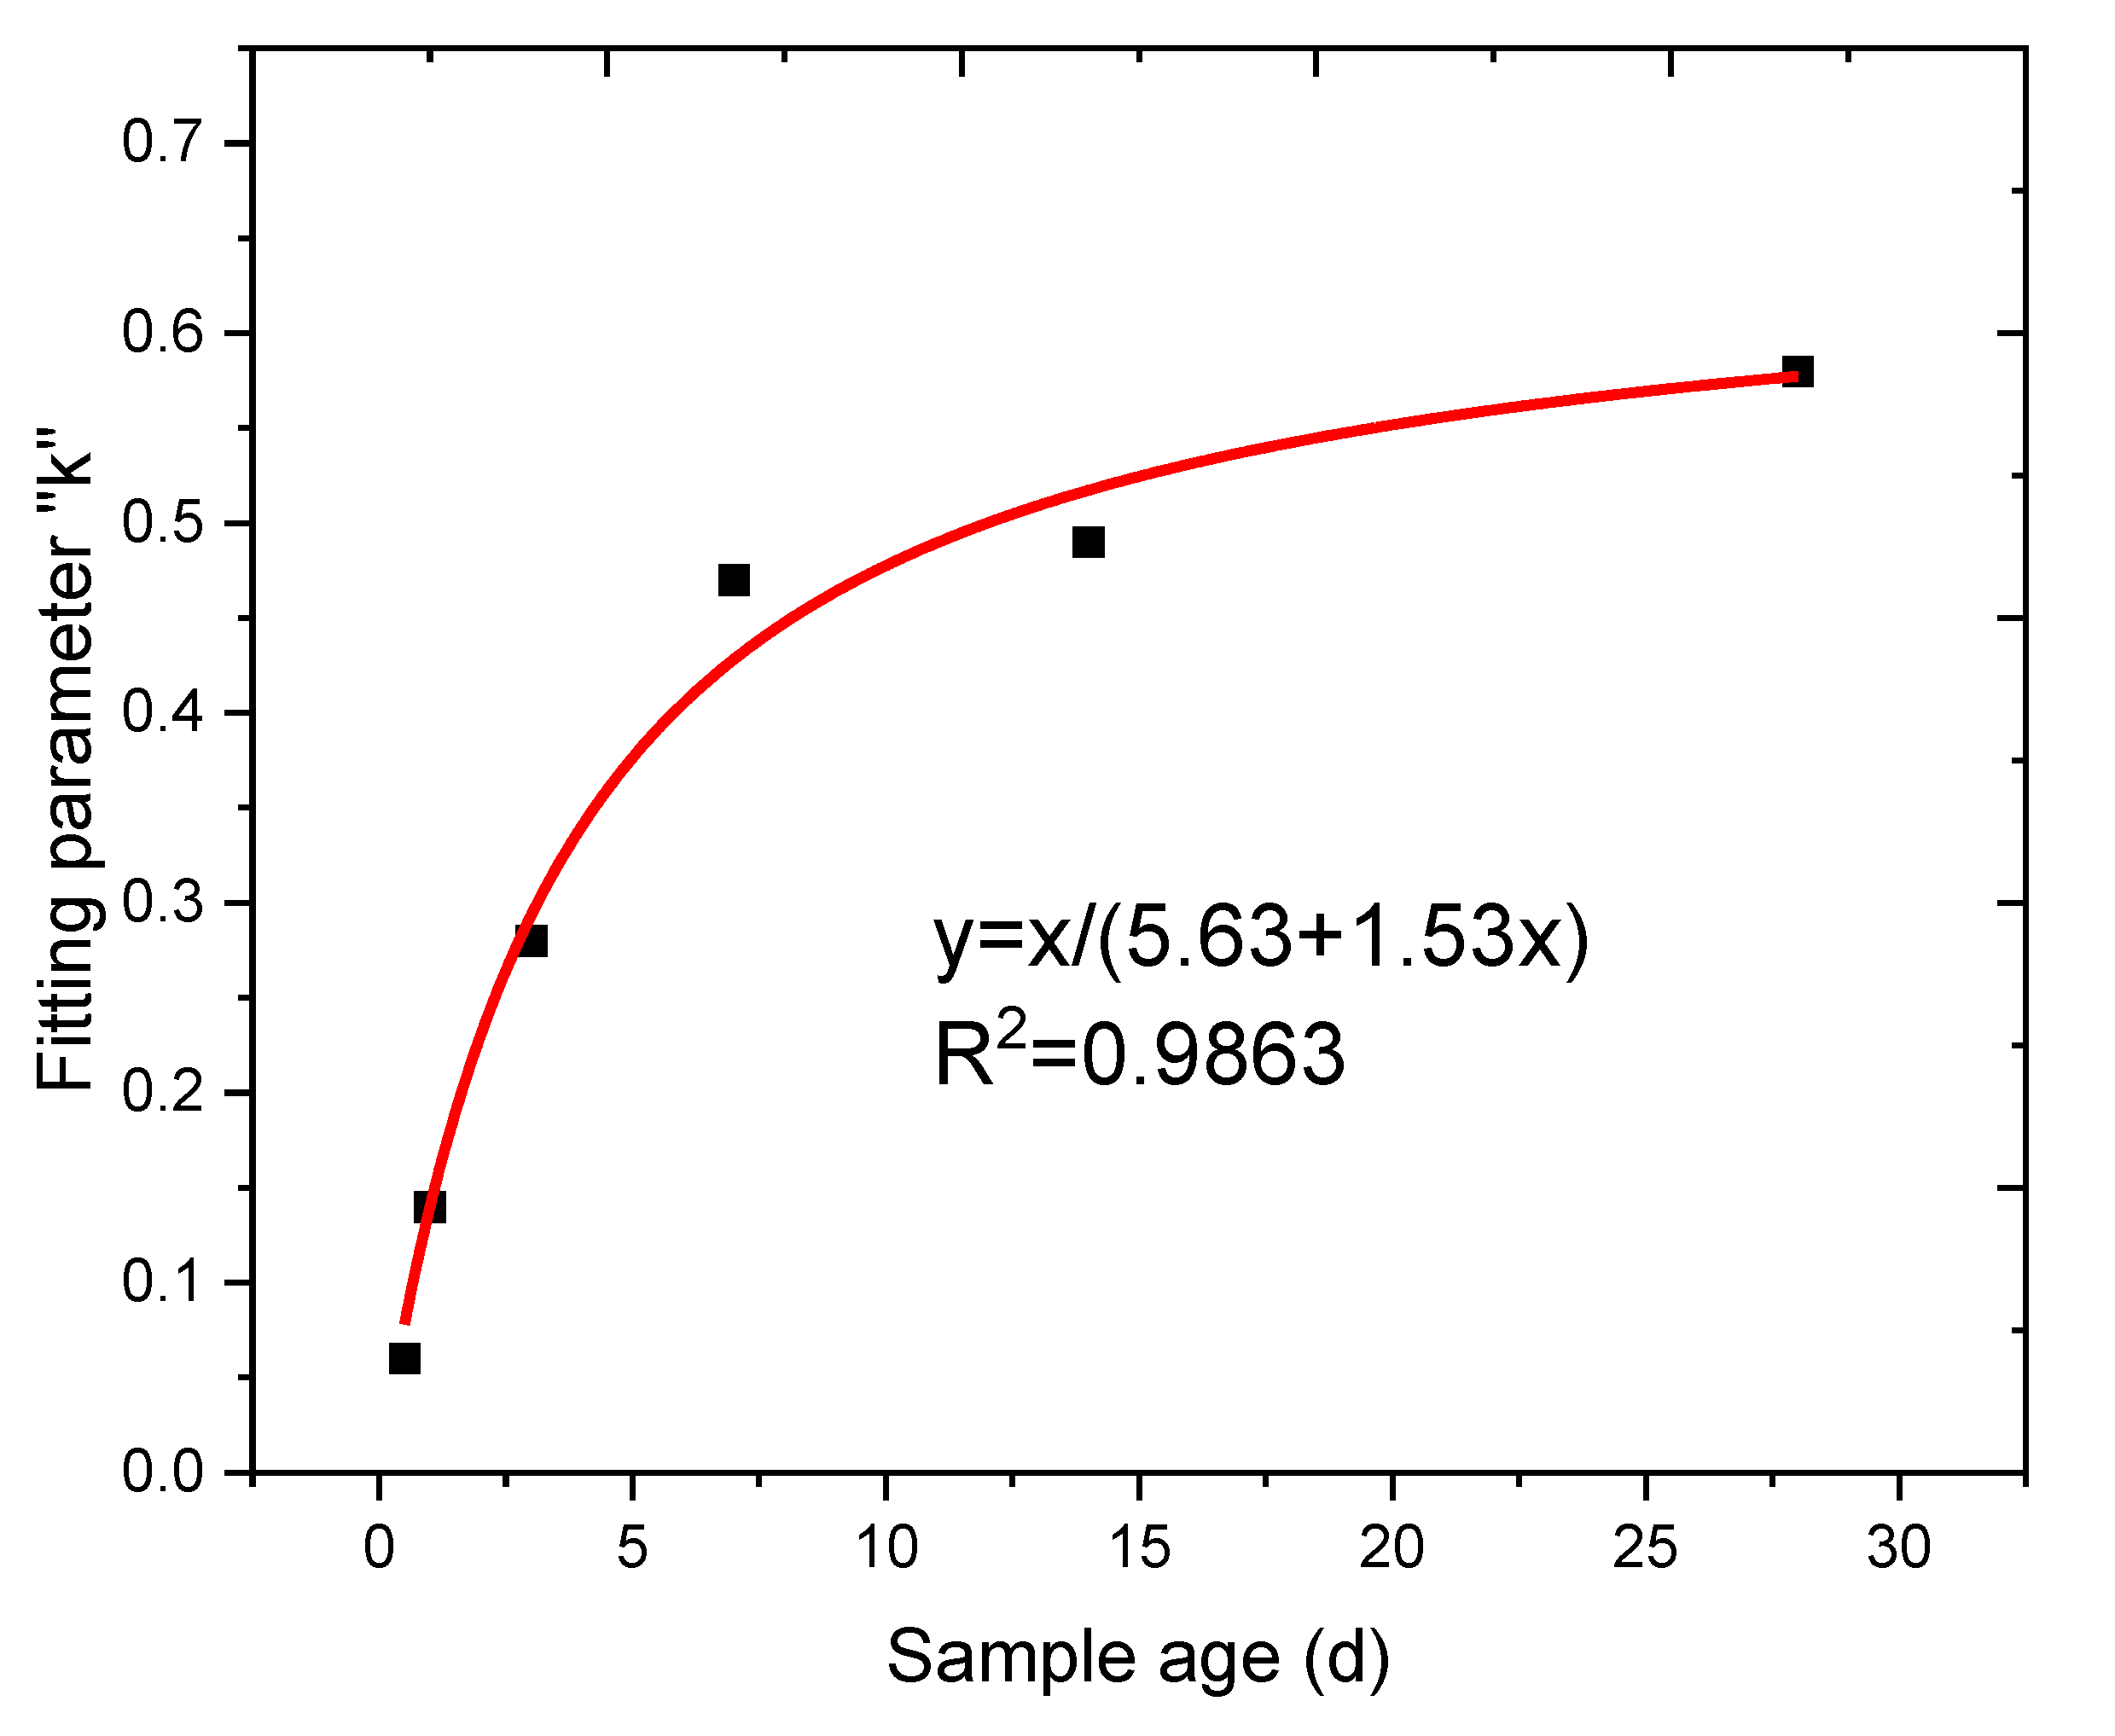
3.4. Analytical Model for the Compressive Strength Prediction of PPF Mortar under Different Loading Speeds

There are several available mathematical models that can be used to predict the compressive strength development of cementitious materials with age, as concluded in Table 6.
The prediction models presented in Table 6 are based on the plain cementitious materials without the addition of PPF. The error between the prediction models and the compressive strength test results of plain cement mortar under a 0.3 kN/s loading speed in this work is shown in Figure 6.
It can be seen from Figure 6 that the ACI 209 model provided the best prediction results for plain cement mortar compressive strength. Thus, in this work, the proposed prediction model for PPF mortar under different loading speeds was based on the ACI 209 model. A series of very good linear relationships between the fiber content and compressive strength under a 0.3 kN/s loading speed can be observed in Figure 7, with all fitting parameters (R2) being higher than 0.97. For the linear relationship between the fiber content and compressive strength, the basic relationship can be summarized as:
( f c ) % P P F = k 1 x + ( f c ) 0 % P P F
where (fc)%PPF denotes the compressive strength of different contents of PPF fiber, x denotes the PPF fiber content, k1 denotes the fitting parameter in terms of the fiber content’s influence on compressive strength, and (fc)0%PPF denotes the compressive strength of plain cement mortar.
In this work, the compressive strength of plain cement mortar under different ages was predicted using the ACI 209 model. The relationship between the fiber content’s fitting parameter k and the sample age is presented in Figure 8. Thus, the time-dependent model for the PPF cement mortar compressive strength prediction model can be expressed as:
( f c ) t , % P P F = t 3.75 + 0.77 t x + t 4 + 0.85 t ( f c ) 28 , 0 % P P F
where (fc)t,%PPF denotes the compressive strength (MPa) of cement mortar at age t (days) with x (%) content of PPF fiber, (fc)28,%PPF denotes the compressive strength (MPa) of cement mortar at age 28 (days) with 0 (%) content of PPF fiber.
The relationship between the loading speed and compressive strength of plain cement mortar is summarized in Figure 9. A series of linear relationships could be obtained, with all linear fitting parameters (R2) being higher than 0.91. Similar to the influence of fiber content, the time-dependent relationship of loading speed in terms of the compressive strength’s linear fitting parameter “k2” and sample age are presented in Figure 10.
Thus, the time-dependent model for PPF cement mortar compressive strength prediction model under different loading speeds can be expressed as:
( f c ) t , % P P F , k N / s = t 3.75 + 0.77 t x + t 1.98 + 0.36 t y + t 4 + 0.85 t ( f c ) 28 , 0 % P P F , 0.3 k N / s
where (fc)t,%PPF,kN/s denotes the compressive strength (MPa) of cement mortar at age t (days) with x (%) content of PPF fiber and a test loading speed of y (kN/s), (fc)28,%PPF,0.3kN/s denotes the compressive strength (MPa) of cement mortar at age 28 (days) with 0 (%) content of PPF fiber under a test loading speed of 0.3 (kN/s).
The predicted compressive strength in terms of experimental compressive strength is summarized in Figure 11, and the prediction errors are shown in Figure 12. It can be seen that the predicted compressive strength for all of the mixtures was close to the experimental data, which indicates that Equation (3) can be used to predict the compressive strength of PPF cement mortar under different loading speeds for various sample ages. A total of 44.4% of the predicted data showed less than 10% error compared with the experimental data; this value improved to 70.4% when the error acceptance increased to 15%. Only 13.0% of the predicted data showed an error higher than 20%.

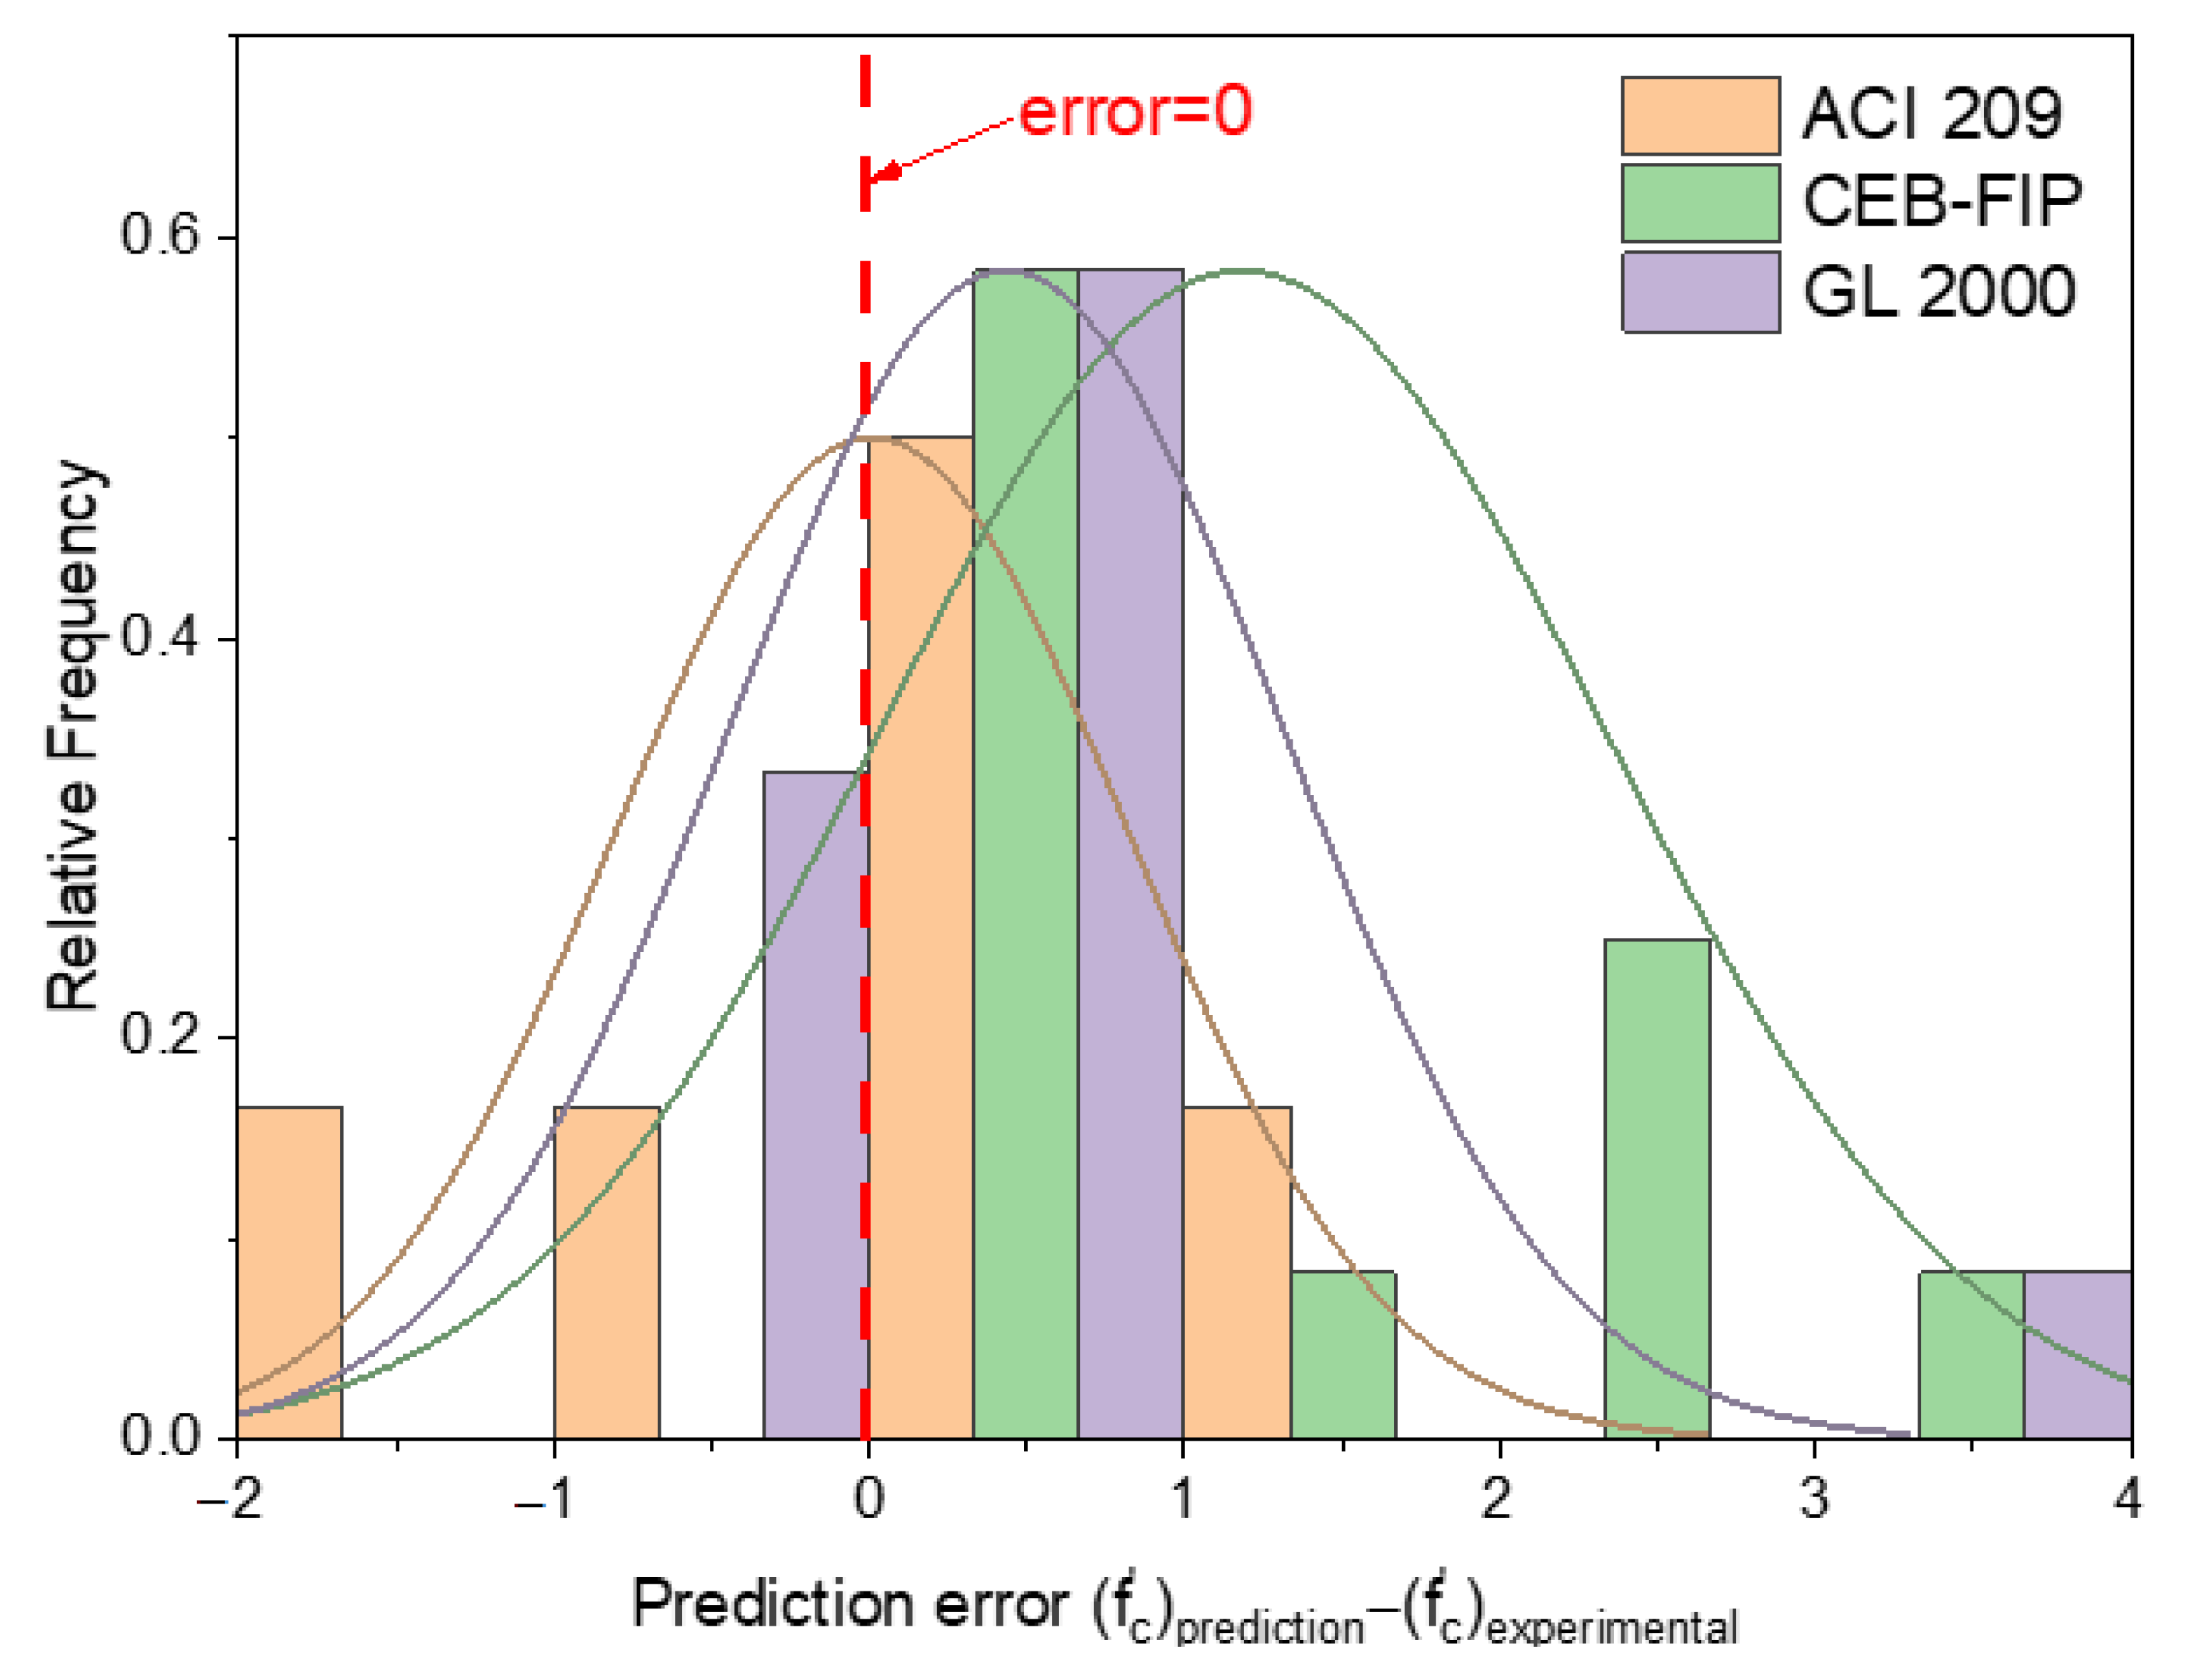
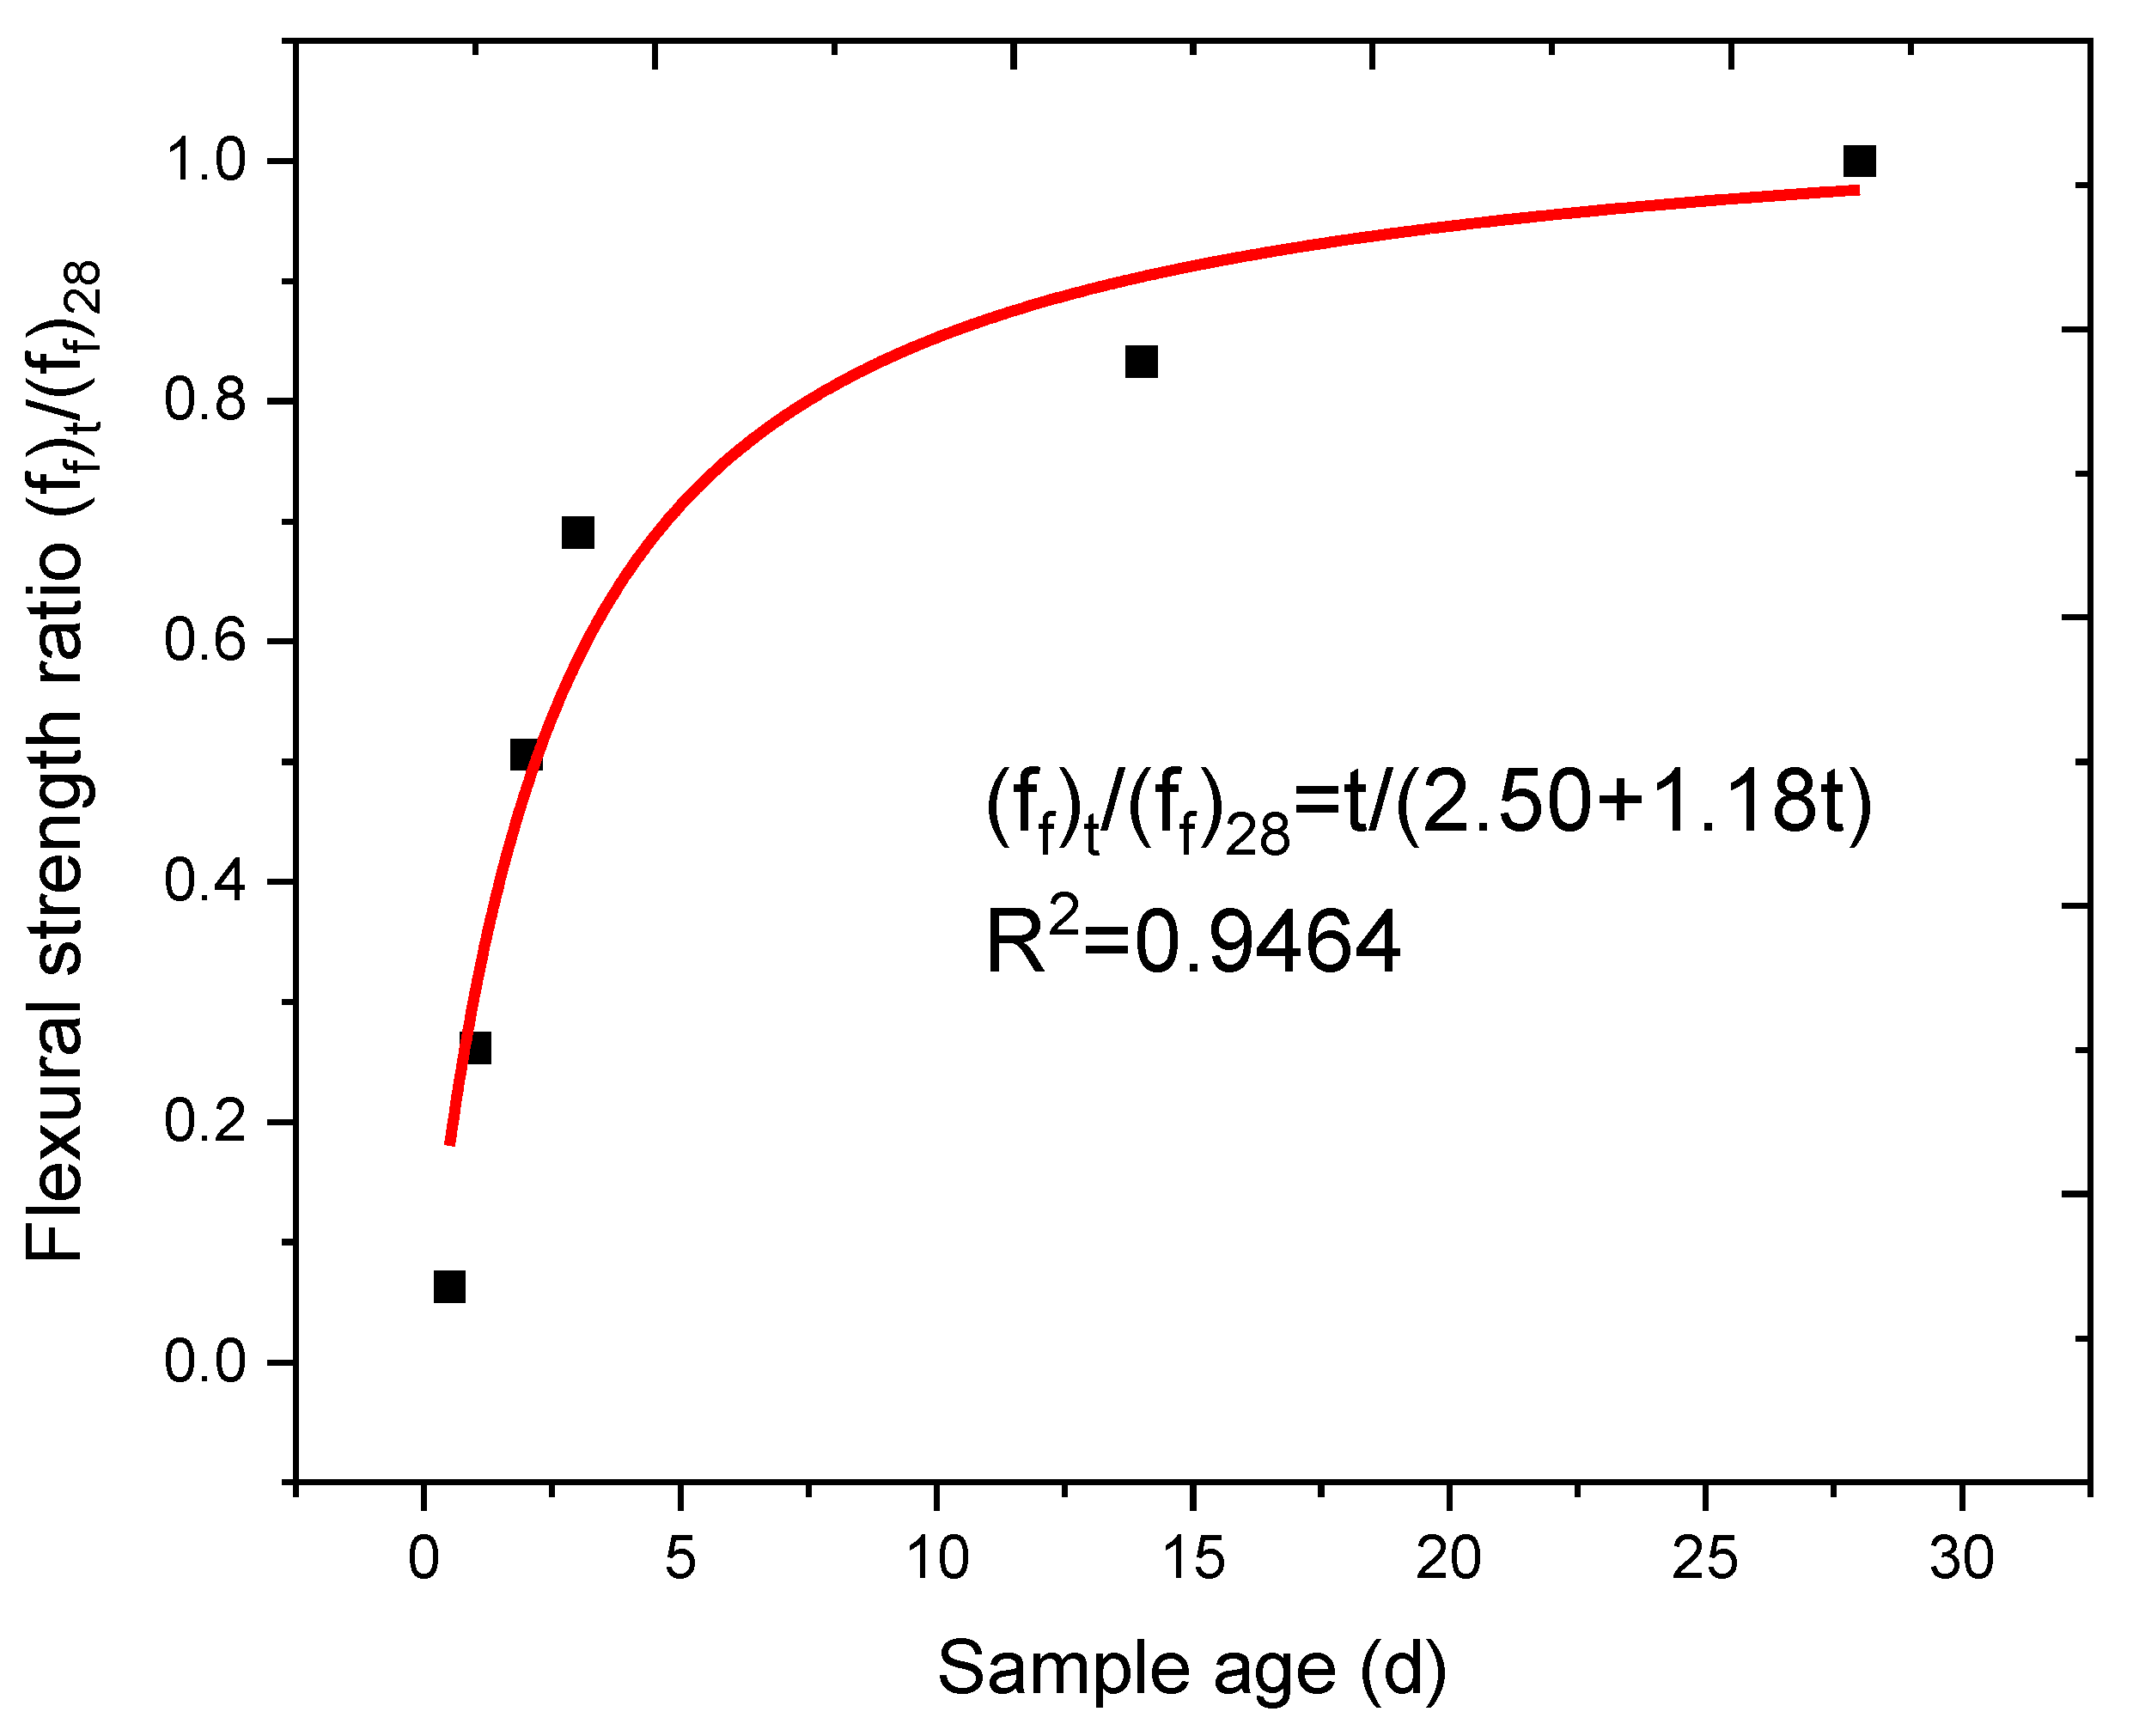
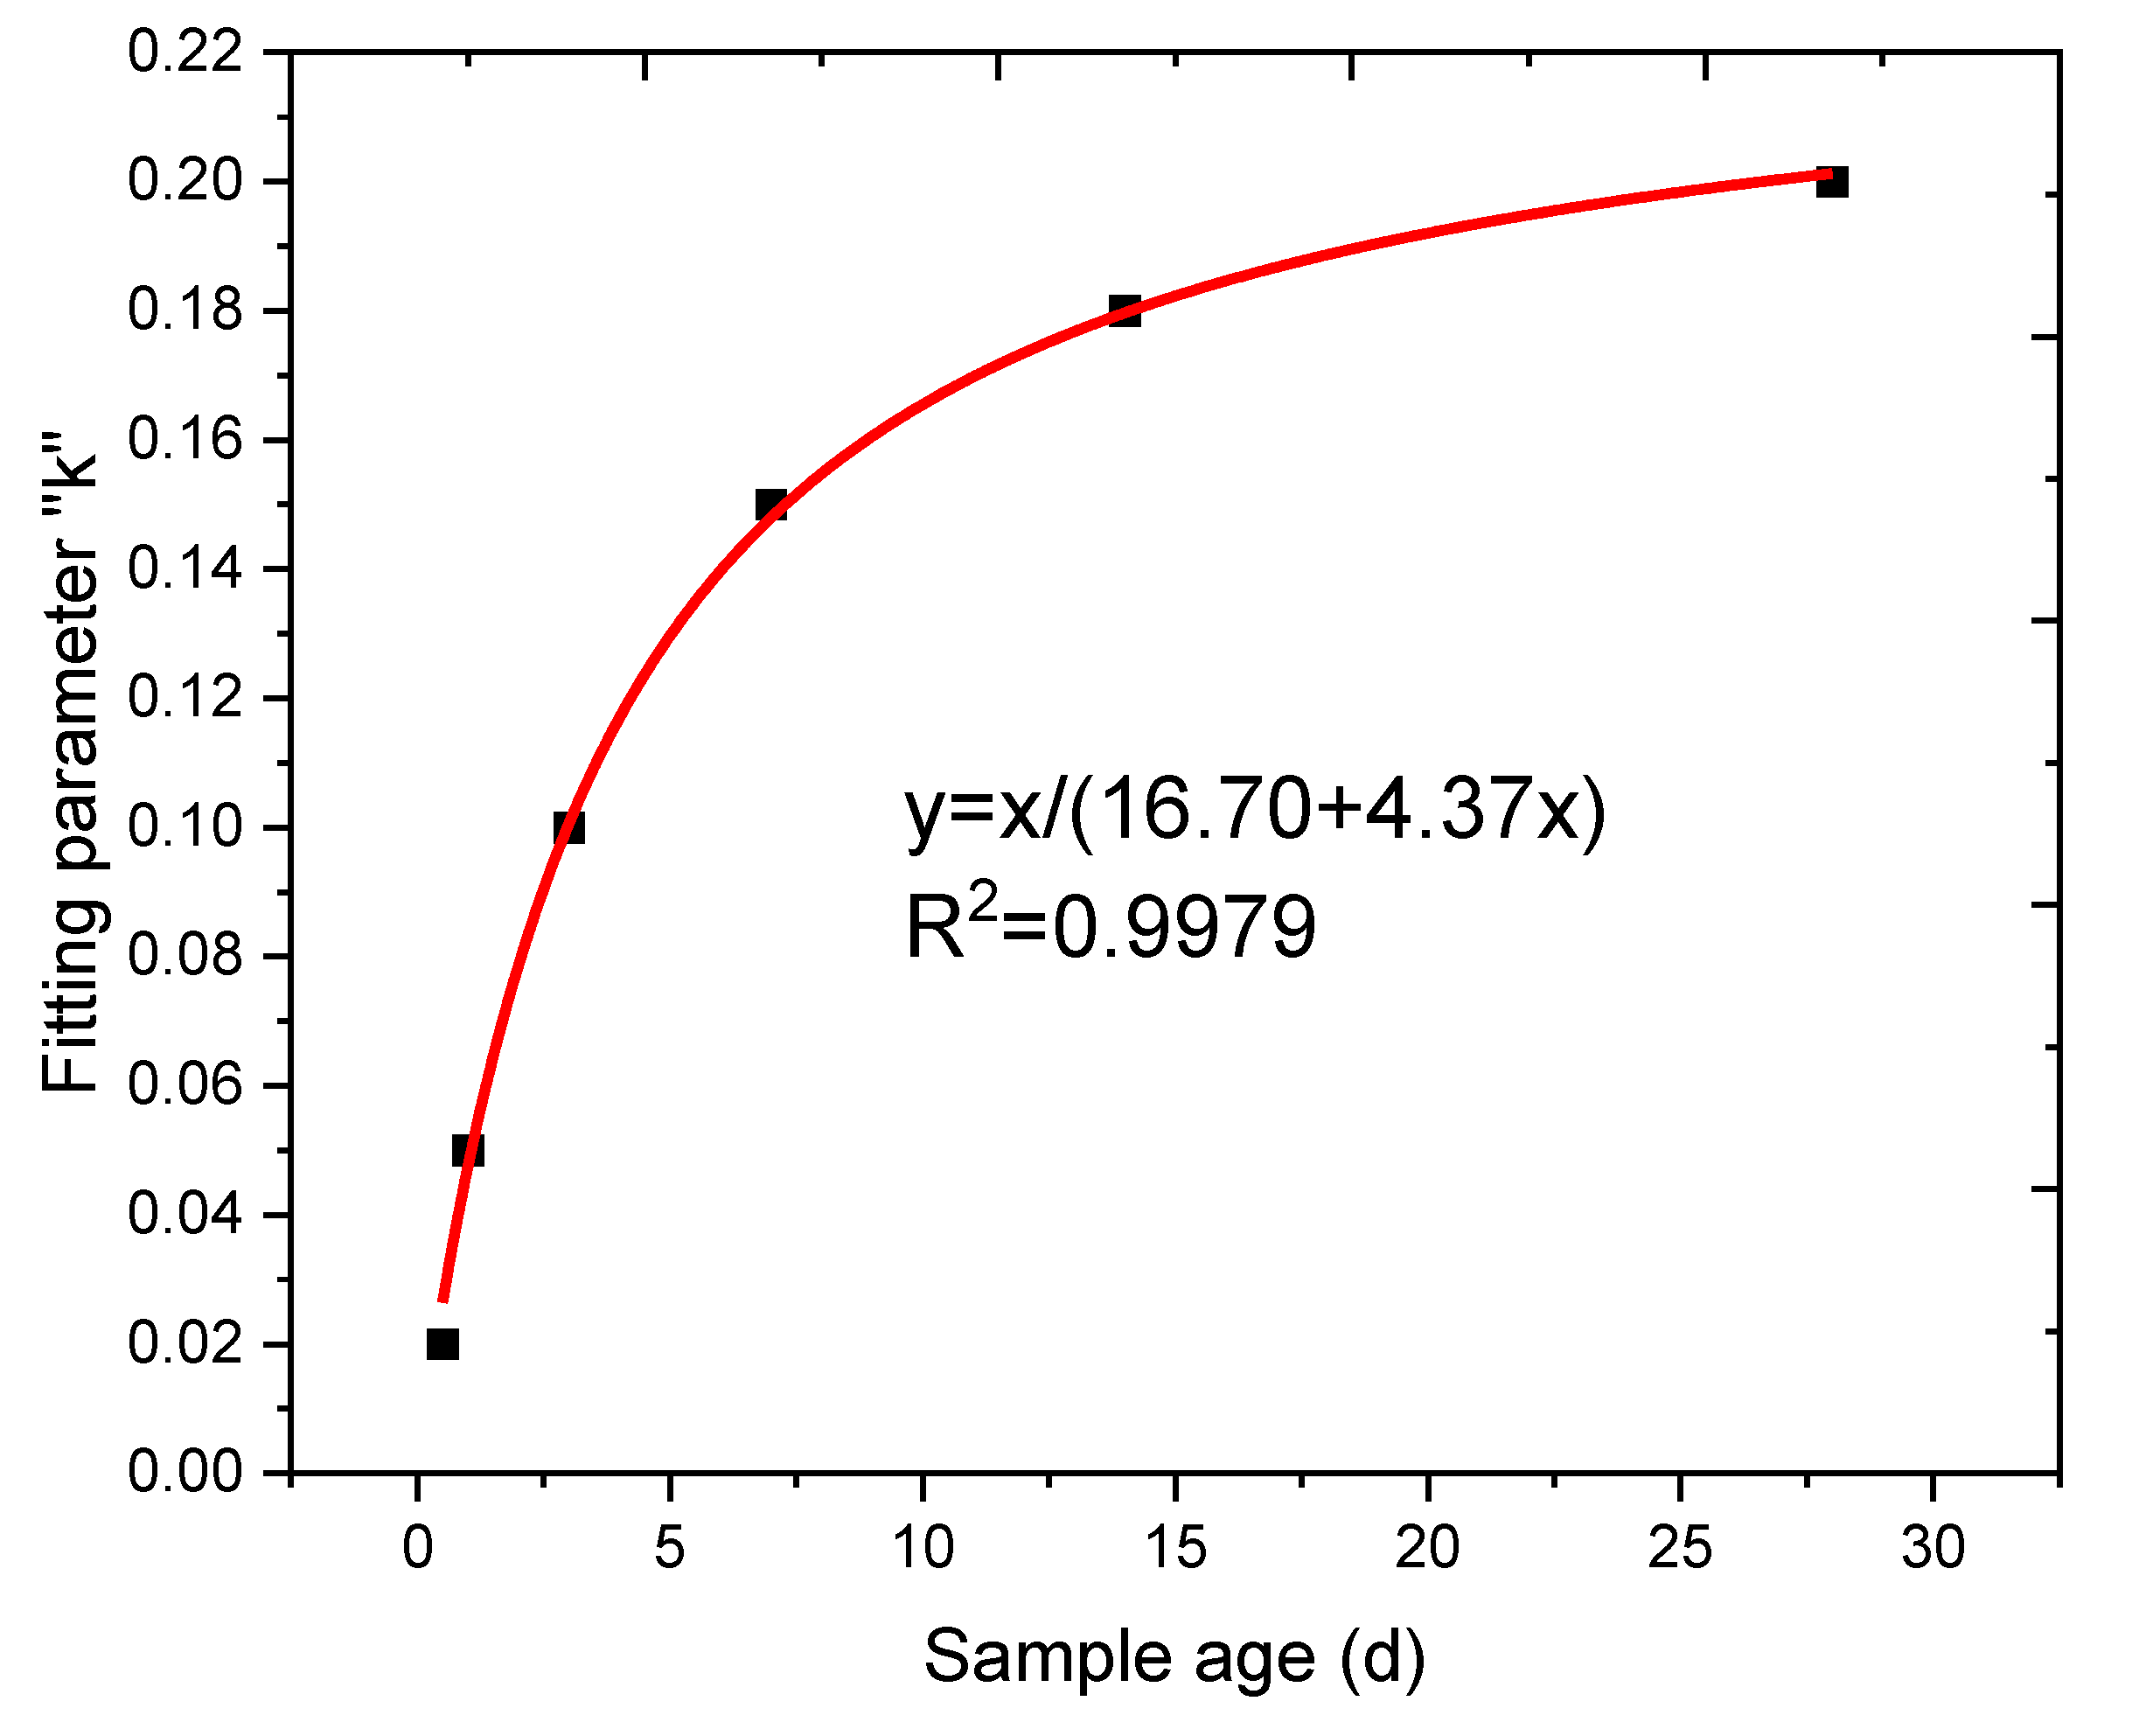
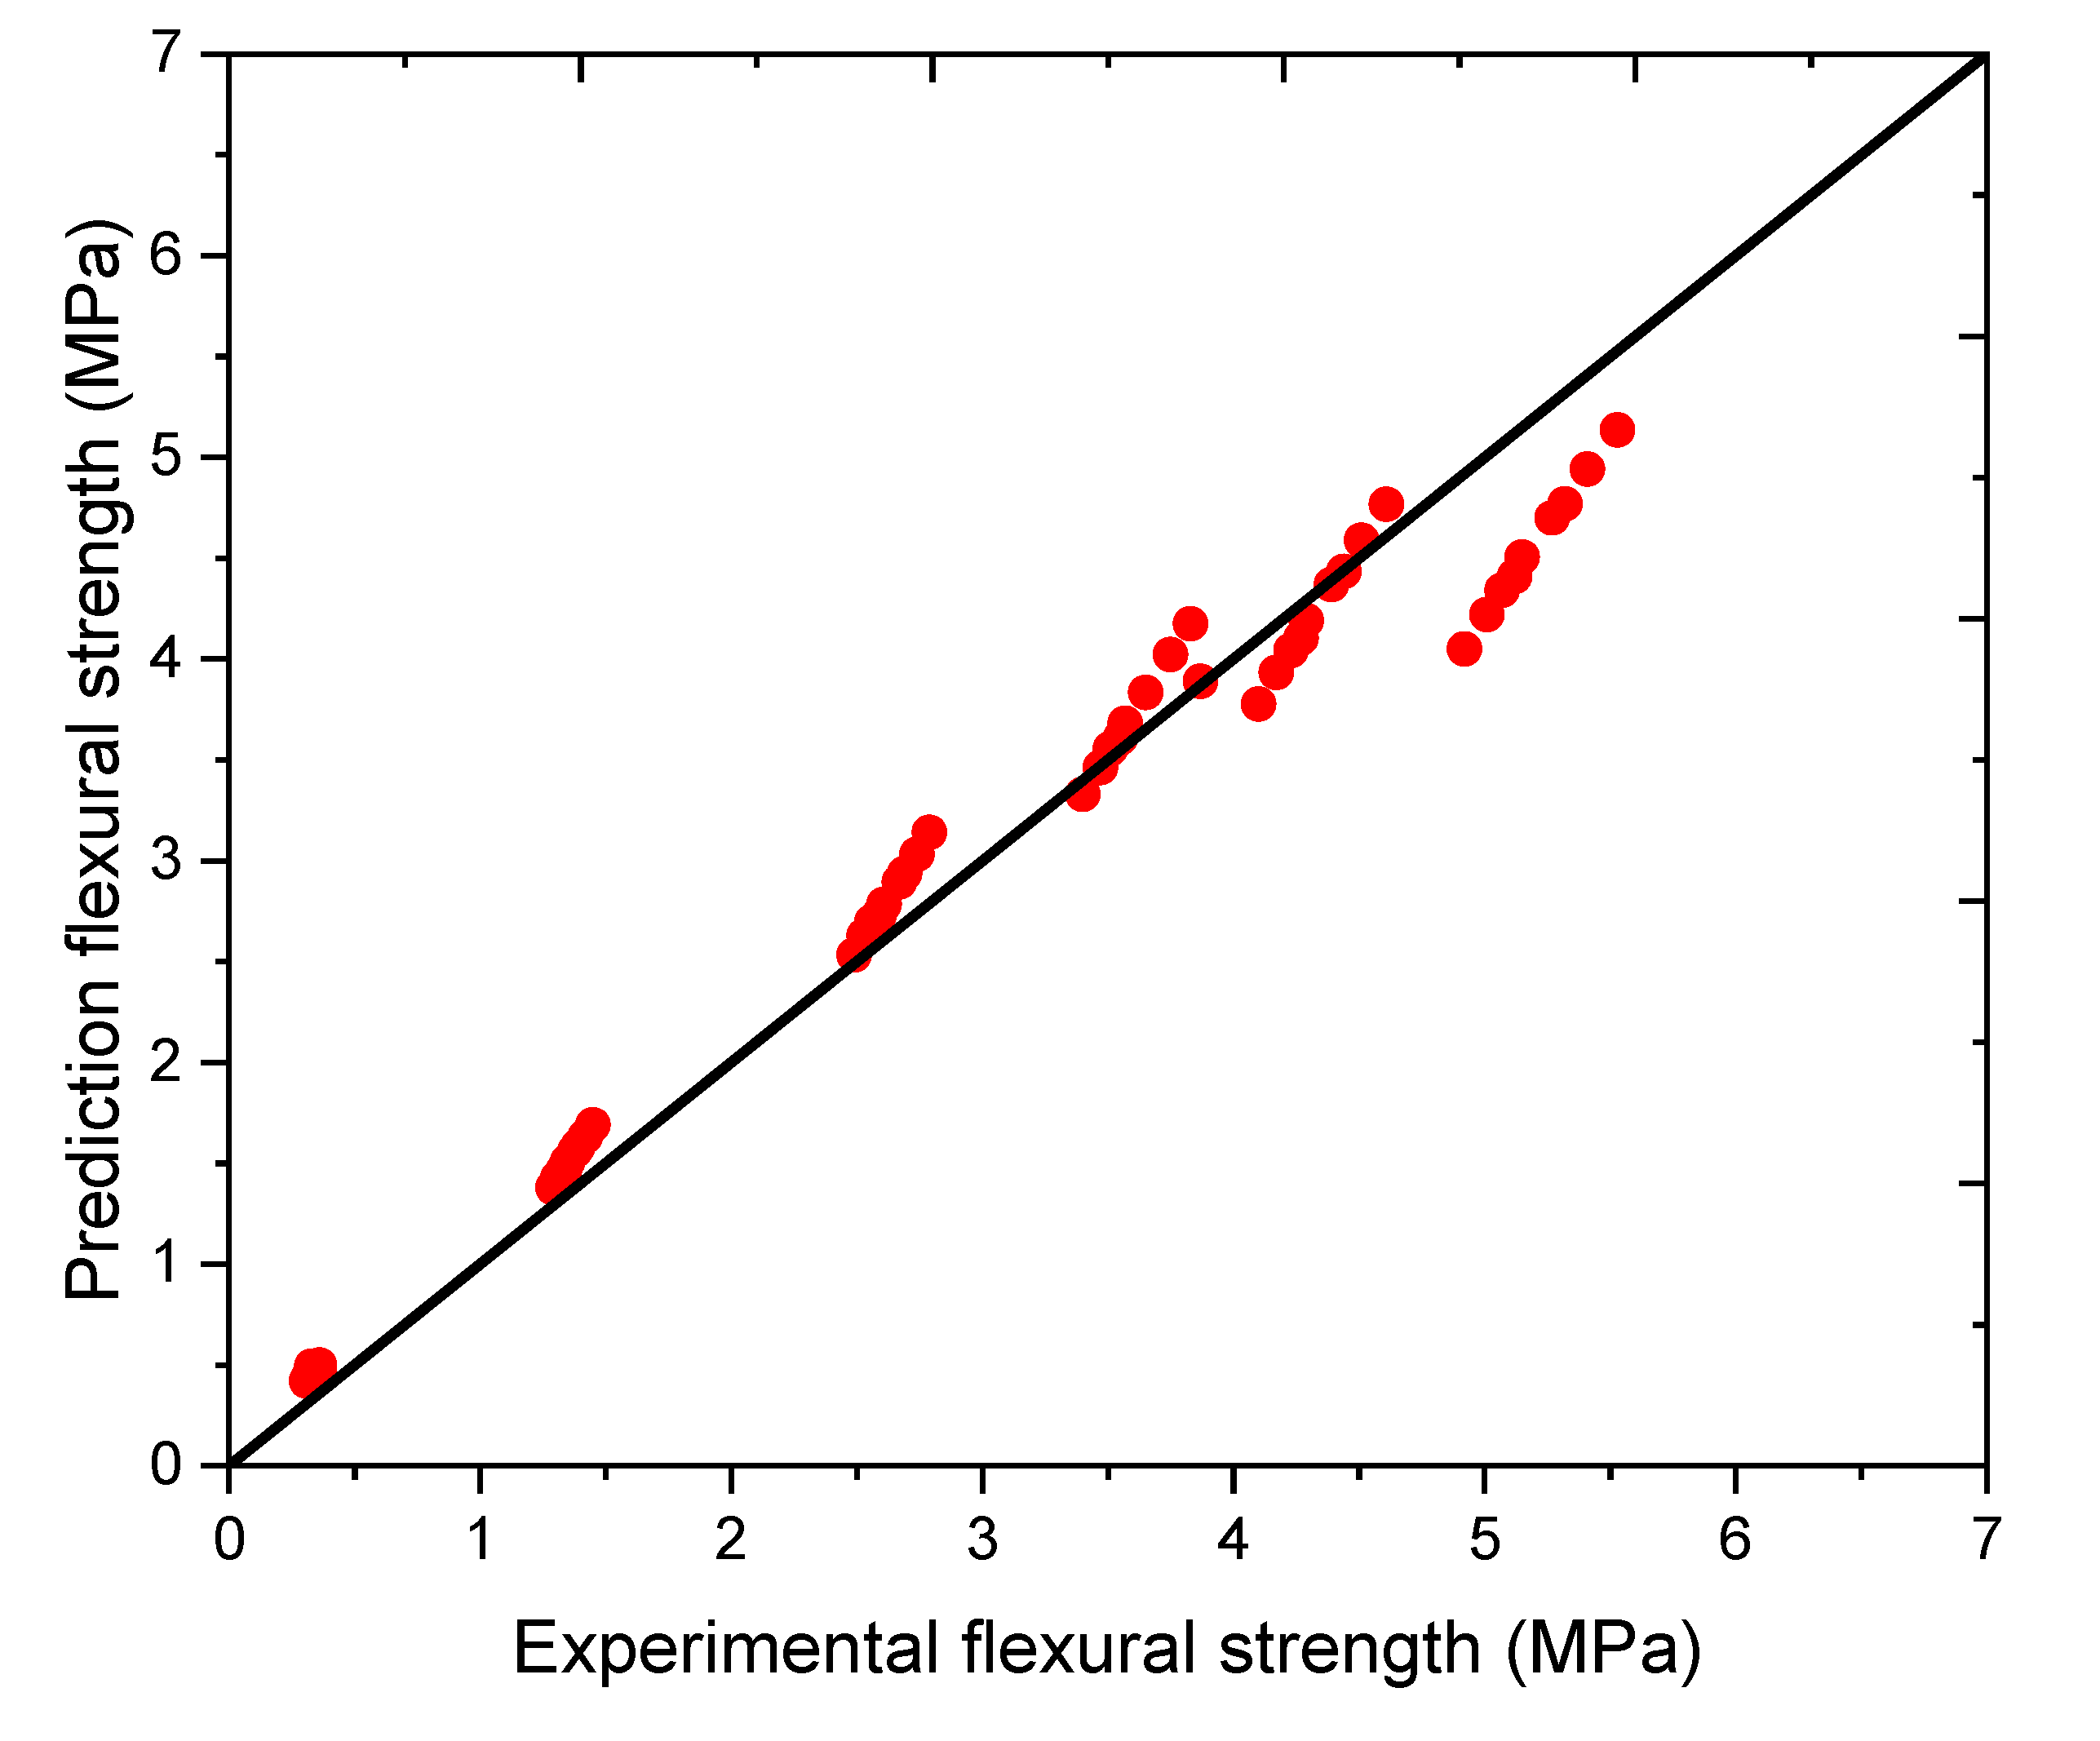
3.5. Analytical Model for Flexural Strength Prediction of PPF Mortar under Different Loading Speeds

Non-linear relationships between the cement mortar’s flexural strength and its independent variables (i.e., sample age, fiber content, and loading speed) can be performed by the Vipulanandan correlation model [41,42] as follows:
Y = X ( A + B X ) C
where Y stands for the flexural strength of cement mortar; A, B, and C represent the model parameters; X denotes the independent variables (i.e., sample age, fiber content, and loading speed).
In this work, for plain cement mortar without PPF admixture and under a 0.3 kN/s loading speed, the flexural strength in terms of sample age can be written as:
( f f ) t = t A + B t ( f f ) 28
where (ff)t stands for the flexural strength of plain mortar under 0.3 kN/s at different ages, and (ff)28 represents the flexural strength of plain mortar under 0.3 kN/s at 28 days of age.
The fitting results between the sample age and flexural strength of plain mortar are shown in Figure 13. The fitting parameter (R2) was as high as 0.9464.
A series of linear relationships between the fiber content and flexural strength under a 0.3 kN/s loading speed can be observed in Figure 14, with all fitting parameters (R2) being higher than 0.98. For the linear relationship between the fiber content and compressive strength, the basic relationship can be summarized as:
( f f ) % P P F = k 3 x + ( f f ) 0 % P P F
where (ff)%PPF denotes the flexural strength of different contents of PPF fiber, x denotes the PPF fiber content, k3 denotes the fitting parameter in terms of the PPF content’s influence on flexural strength, and (ff)0%PPF denotes the flexural strength of plain cement mortar.
In this work, the flexural strength of plain cement mortar of different ages can be described by the fitting relationship in Figure 13. The relationship between the fiber content’s fitting parameter k3 and sample age is presented in Figure 15. Thus, the time-dependent model for the PPF cement mortar compressive strength prediction model can be expressed as:
( f f ) t , % P P F = t 16.70 + 4.37 t x + t 2.50 + 1.18 t ( f f ) 28 , 0 % P P F
where (ff)t,%PPF denotes the flexural strength (MPa) of cement mortar at age t (days) with x (%) content of PPF fiber, and (ff)28,%PPF denotes the flexural strength (MPa) of cement mortar at age 28 (day) with 0 (%) content of PPF fiber.
The relationship between the loading speed and flexural strength of plain cement mortar is summarized in Figure 16, in which a series of linear relationships were obtained, with all linear fitting parameters (R2) being higher than 0.94. Similar to the influence of fiber content, the time-dependent relationship of the loading speed’s linear fitting parameter “k4” and sample age is presented in Figure 17.
Thus, the time-dependent model for the PPF cement mortar compressive strength prediction model under different loading speeds can be expressed as:
( f f ) t , % P P F , k N / s = t 16.70 + 4.37 t x + t 5.63 + 1.53 t y + t 2.50 + 1.18 t ( f f ) 28 , 0 % P P F , 0.3 k N / s
where (ff)t,%PPF,kN/s denotes the flexural strength (MPa) of cement mortar at age t (days) with x (%) content of PPF fiber and a test loading speed of y (kN/s), and (fc)28,%PPF,0.3kN/s denotes the flexural strength (MPa) of cement mortar at age 28 (days) with 0 (%) content of PPF fiber under a test loading speed of 0.3 (kN/s).
The predicted flexural strength in terms of experimental compressive strength is summarized in Figure 18, and the prediction errors are shown in Figure 19. It can be seen that the predicted flexural strength for all mixtures was close to the experimental data, which indicates that Equation (8) can be used to predict the flexural strength of PPF cement mortar under different loading speeds and various sample ages. Of the prediction results, 55.6% showed less than 10% error compared with the experimental data, 75.9% had a relative error less than 15%, and 16.7% had a relative error higher than 20%.

4. Conclusions

In this work, the effect of polypropylene fiber content and loading speed on the compressive and flexural strength of cement mortar at different ages was studied. Analytical equations for compressive and flexural strength development prediction for cement mortar with different polypropylene fiber contents under different loading speeds were proposed. The main conclusions can be drawn as follows:
  • The incorporation of PPF can improve the compressive and flexural strength of cement mortar at early ages, and the improvement can be attributed to the interaction between the fiber and cement mortar matrix.
  • A higher test loading speed results in higher compressive and flexural strength, and linear relationships can be observed between the loading speed and the strength test results.
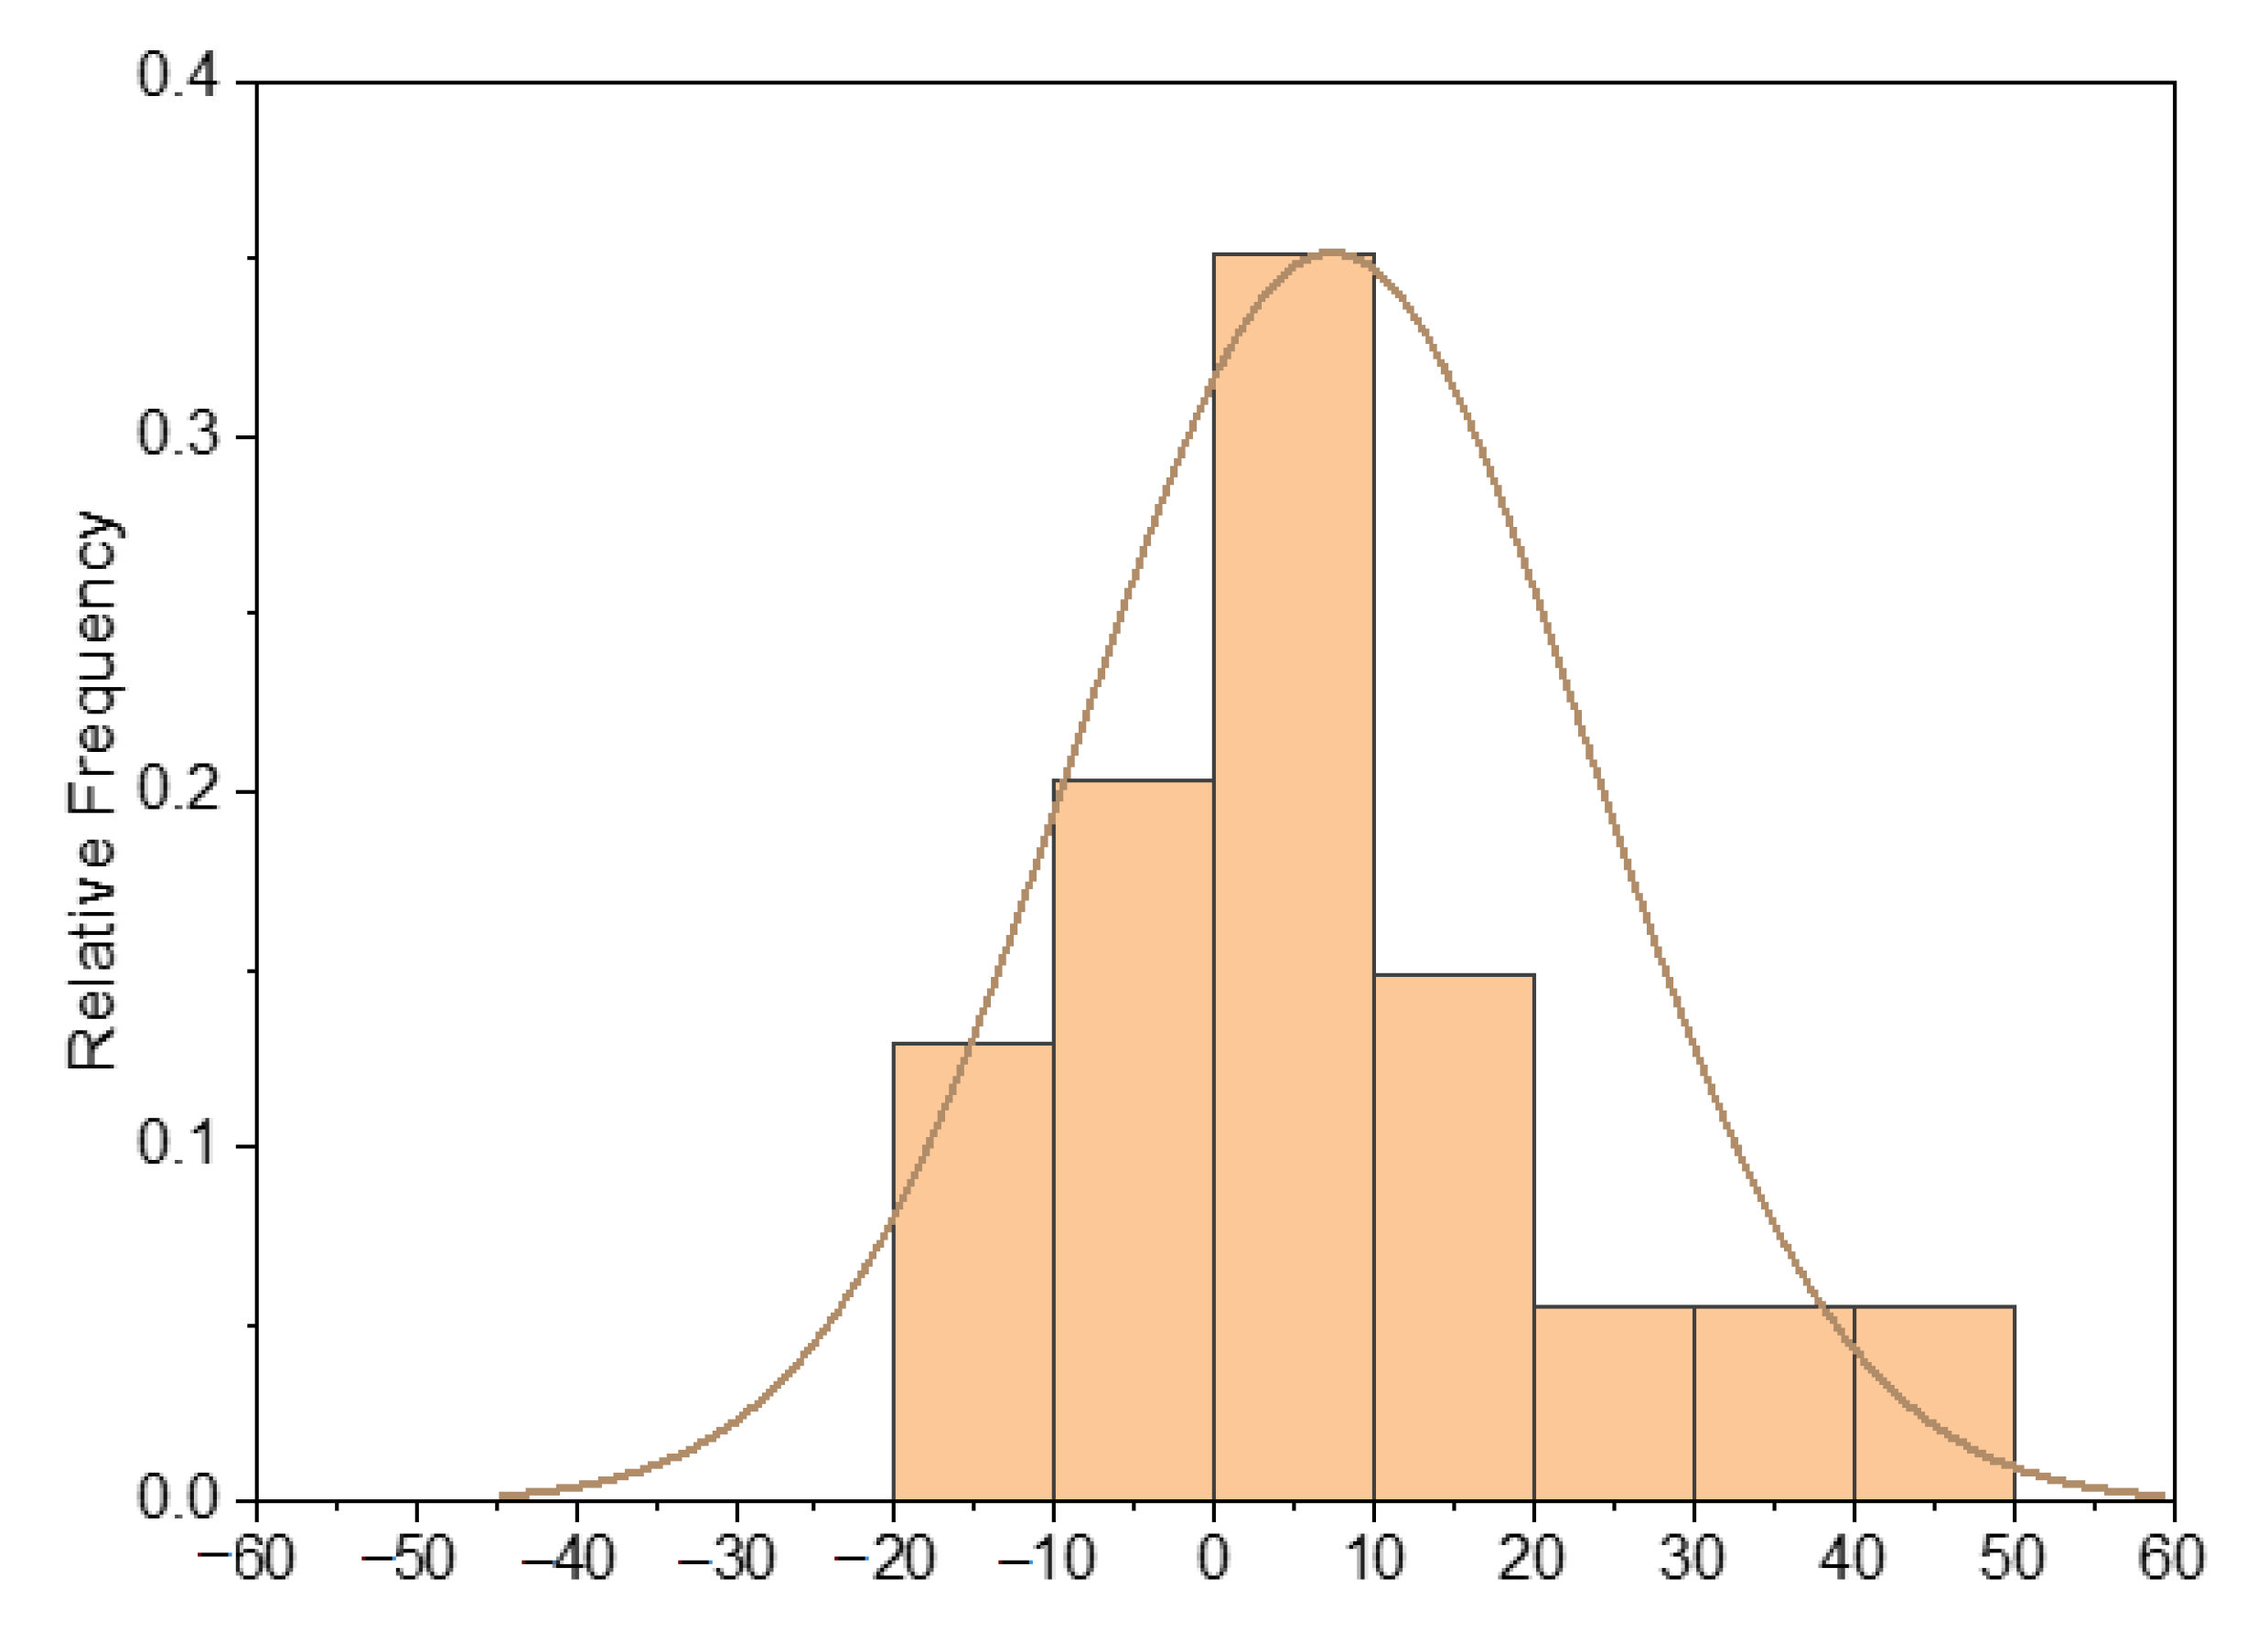
  • The proposed models can be used to predict the compressive and flexural strength of PPF-incorporated cement mortar under different loading speeds. Of the predicted compressive strength results, 70.4% showed less than a 15% relative error compared with the experimental results, while for the predicted flexural strength results, it was 75.9%.

Author Contributions

Conceptualization, H.C. and R.H.; investigation, J.W. and X.H.; data curation, H.C., R.H., X.H. and Z.Z.; methodology, C.F.; visualization, C.F.; formal analysis, R.H.; writing—original draft, C.F. and R.H.; writing—review and editing, H.C., X.H., R.H. and Z.Z.; project administration, C.F.; funding acquisition, H.C.; validation, H.C., R.H. and Z.Z.; resources, C.F. All authors have read and agreed to the published version of the manuscript.

Funding

This study was financially supported by the Natural Science Foundation of Zhejiang province in China (LY21E080002), the National Natural Science Foundation of China (51608393), and the Wenzhou Technological Planning Program of the Wenzhou Science and Technology Bureau (S20180003).

Institutional Review Board Statement

Not applicable.

Informed Consent Statement

Not applicable.

Data Availability Statement

The data presented in this study are available on request from the corresponding author.

Conflicts of Interest

The authors declare no conflict of interest.

References

  1. He, R.; Ma, H.; Hafiz, R.B.; Fu, C.; Jin, X.; He, J. Determining porosity and pore network connectivity of cement-based materials by a modified non-contact electrical resistivity measurement: Experiment and theory. Mater. Des. 2018, 156, 82–92. [Google Scholar] [CrossRef]
  2. Ramezanianpour, A.M.; Hooton, R.D. A study on hydration, compressive strength, and porosity of Portland-limestone cement mixes containing SCMs. Cem. Concr. Compos. 2014, 51, 1–13. [Google Scholar] [CrossRef]
  3. He, R.; Ye, H.; Ma, H.; Fu, C.; Jin, X.; Li, Z. Correlating the Chloride Diffusion Coefficient and Pore Structure of Cement-Based Materials Using Modified Noncontact Electrical Resistivity Measurement. J. Mater. Civ. Eng. 2019, 31, 04019006. [Google Scholar] [CrossRef]
  4. Ye, H.; Jin, N.; Jin, X.; Fu, C.; Chen, W. Chloride ingress profiles and binding capacity of mortar in cyclic drying-wetting salt fog environments. Constr. Build. Mater. 2016, 127, 733–742. [Google Scholar] [CrossRef]
  5. He, R.; Fu, C.; Ma, H.; Ye, H.; Jin, X. Prediction of Effective Chloride Diffusivity of Cement Paste and Mortar from Microstructural Features. J. Mater. Civ. Eng. 2020, 32, 04020211. [Google Scholar] [CrossRef]
  6. Chen, J.; Wang, J.; He, R.; Shu, H.; Fu, C. Experimental Study on Effective Chloride Diffusion Coefficient of Cement Mortar by Different Electrical Accelerated Measurements. Crystals 2021, 11, 240. [Google Scholar] [CrossRef]
  7. Fu, C.; Ling, Y.; Wang, K. An innovation study on chloride and oxygen diffusions in simulated interfacial transition zone of cementitious material. Cem. Concr. Compos. 2020, 110, 103585. [Google Scholar] [CrossRef]
  8. Mohammadhosseini, H.; Alyousef, R.; Tahir, M.M. Towards Sustainable Concrete Composites through Waste Valorisation of Plastic Food Trays as Low-Cost Fibrous Materials. Sustainability 2021, 13, 2073. [Google Scholar] [CrossRef]
  9. Merta, I.; Tschegg, E. Fracture energy of natural fibre reinforced concrete. Constr. Build. Mater. 2013, 40, 991–997. [Google Scholar] [CrossRef]
  10. Shen, D.; Jiao, Y.; Gao, Y.; Zhu, S.; Jiang, G. Influence of ground granulated blast furnace slag on cracking potential of high performance concrete at early age. Constr. Build. Mater. 2020, 241, 117839. [Google Scholar] [CrossRef]
  11. Shen, D.; Liu, C.; Feng, Z.; Zhu, S.; Liang, C. Influence of ground granulated blast furnace slag on the early-age anti-cracking property of internally cured concrete. Constr. Build. Mater. 2019, 223, 233–243. [Google Scholar] [CrossRef]
  12. Lehner, P.; Konečný, P.; Ponikiewski, T. Comparison of Material Properties of SCC Concrete with Steel Fibres Related to Ingress of Chlorides. Crystals 2020, 10, 220. [Google Scholar] [CrossRef] [Green Version]
  13. Yew, M.K.; Bin Mahmud, H.; Shafigh, P.; Ang, B.C. Effects of polypropylene twisted bundle fibers on the mechanical properties of high-strength oil palm shell lightweight concrete. Mater. Struct. 2015, 49, 1221–1233. [Google Scholar] [CrossRef]
  14. Prescient & Strategic Intelligence, Polypropylene Market Research Report: By Type, Application, End Use—Global Industry Analysis and Demand Forecast to 2030, Global. 2020. Available online: https://www.researchandmarkets.com/reports/5184632/polypropylene-market-research-report-by-type?utm_source=CI&utm_medium=PressRelease&utm_code=6lvqdn&utm_campaign=1491061+-+Global+Polypropylene+Markets%2C+2019-2020+%26+2030+-+Increasing+Use+in+Packaging+Industry+%26+Growing+Nonwoven+Polypropylene+Fiber+Industry&utm_exec=chdo54prd (accessed on 24 March 2021).
  15. Badogiannis, E.; Christidis, K.; Tzanetatos, G. Evaluation of the mechanical behavior of pumice lightweight concrete reinforced with steel and polypropylene fibers. Constr. Build. Mater. 2019, 196, 443–456. [Google Scholar] [CrossRef]
  16. Wang, D.; Ju, Y.; Shen, H.; Xu, L. Mechanical properties of high performance concrete reinforced with basalt fiber and polypropylene fiber. Constr. Build. Mater. 2019, 197, 464–473. [Google Scholar] [CrossRef]
  17. Mohseni, E.; Khotbehsara, M.M.; Naseri, F.; Monazami, M.; Sarker, P. Polypropylene fiber reinforced cement mortars containing rice husk ash and nano-alumina. Constr. Build. Mater. 2016, 111, 429–439. [Google Scholar] [CrossRef]
  18. Turba, Y.; Solodkyy, S. Crack Resistance of Concretes Reinforced with Polypropylene Fiber. In Proceedings of the Lecture Notes in Civil Engineering; Metzler, J.B., Ed.; Springer: Cham, Switzerland, 2020; pp. 474–481. [Google Scholar]
  19. Shen, D.; Liu, X.; Zeng, X.; Zhao, X.; Jiang, G. Effect of polypropylene plastic fibers length on cracking resistance of high performance concrete at early age. Constr. Build. Mater. 2020, 244, 117874. [Google Scholar] [CrossRef]
  20. Shen, D.; Liu, C.; Li, C.; Zhao, X.; Jiang, G. Influence of Barchip fiber length on early-age behavior and cracking resistance of concrete internally cured with super absorbent polymers. Constr. Build. Mater. 2019, 214, 219–231. [Google Scholar] [CrossRef]
  21. Sachet, W.H.; Salman, W.D. Compressive Strength Development of Slag-Based Geopolymer Paste Reinforced with Fibers Cured at Ambient Condition. In Proceedings of IOP Conference Series: Materials Science and Engineering, Thi-Qar, Iraq, 15–16 July 2020; 16 July 2020. [Google Scholar]
  22. Guo, X.; Xiong, G. Resistance of fiber-reinforced fly ash-steel slag based geopolymer mortar to sulfate attack and drying-wetting cycles. Constr. Build. Mater. 2021, 269, 121326. [Google Scholar] [CrossRef]
  23. Karahan, O.; Atiş, C.D. The durability properties of polypropylene fiber reinforced fly ash concrete. Mater. Des. 2011, 32, 1044–1049. [Google Scholar] [CrossRef]
  24. Mohammadhosseini, H.; Alrshoudi, F.; Tahir, M.M.; Alyousef, R.; Alghamdi, H.; Alharbi, Y.R.; Alsaif, A. Performance evaluation of novel prepacked aggregate concrete reinforced with waste polypropylene fibers at elevated temperatures. Constr. Build. Mater. 2020, 259, 120418. [Google Scholar] [CrossRef]
  25. Nuaklong, P.; Boonchoo, N.; Jongvivatsakul, P.; Charinpanitkul, T.; Sukontasukkul, P. Hybrid effect of carbon nanotubes and polypropylene fibers on mechanical properties and fire resistance of cement mortar. Constr. Build. Mater. 2021, 275, 122189. [Google Scholar] [CrossRef]
  26. Medina, N.F.; Barluenga, G.; Hernández-Olivares, F. Enhancement of durability of concrete composites containing natural pozzolans blended cement through the use of Polypropylene fibers. Compos. Part B Eng. 2014, 61, 214–221. [Google Scholar] [CrossRef]
  27. Grote, D.; Park, S.; Zhou, M. Dynamic behavior of concrete at high strain rates and pressures: I. experimental characterization. Int. J. Impact Eng. 2001, 25, 869–886. [Google Scholar] [CrossRef]
  28. Xu, Z.; Hao, H.; Li, H. Experimental study of dynamic compressive properties of fibre reinforced concrete material with different fibres. Mater. Des. 2012, 33, 42–55. [Google Scholar] [CrossRef]
  29. Zhang, M.; Wu, H.; Li, Q.; Huang, F. Further investigation on the dynamic compressive strength enhancement of concrete-like materials based on split Hopkinson pressure bar tests. Part I: Experiments. Int. J. Impact Eng. 2009, 36, 1327–1334. [Google Scholar] [CrossRef] [Green Version]
  30. Fischer, I.; Pichler, B.; Lach, E.; Terner, C.; Barraud, E.; Britz, F. Compressive strength of cement paste as a function of loading rate: Experiments and engineering mechanics analysis. Cem. Concr. Res. 2014, 58, 186–200. [Google Scholar] [CrossRef]
  31. Abrams, D.A. Effect of rate of application of load on the compressive strength of concrete. Proceeding ASTM 1917, 17, 364–377. [Google Scholar]
  32. Bischoff, P.H.; Perry, S.H. Compressive behaviour of concrete at high strain rates. Mater. Struct. 1991, 24, 425–450. [Google Scholar] [CrossRef]
  33. Gary, G.; Bailly, P. Behaviour of quasi-brittle material at high strain rate. Experiment and modelling. Eur. J. Mech. A Solids 1998, 17, 403–420. [Google Scholar] [CrossRef] [Green Version]
  34. Kaplan, S.A. Factors affecting the relationship between rate of loading and measured compressive strength of concrete. Mag. Concr. Res. 1980, 32, 79–88. [Google Scholar] [CrossRef]
  35. Fu, H.C.; Erki, M.A.; Seckin, M. Review of Effects of Loading Rate on Concrete in Compression. J. Struct. Eng. 1991, 117, 3645–3659. [Google Scholar] [CrossRef]
  36. GB 175-2007. Common Portland Cements, Chinese Natl. Stand. 2019. Available online: https://www.codeofchina.com/standard/GB175-2007.html (accessed on 24 March 2021).
  37. Song, P.; Hwang, S.; Sheu, B. Strength properties of nylon- and polypropylene-fiber-reinforced concretes. Cem. Concr. Res. 2005, 35, 1546–1550. [Google Scholar] [CrossRef]
  38. ACI Committee 209, Prediction of Creep, Shrinkage, and Temperature Effects in Concrete Structures (Reapproved 2008). 2002. Available online: https://www.concrete.org/store/productdetail.aspx?ItemID=20992&Format=DOWNLOAD&Language=English&Units=US_AND_METRIC (accessed on 24 March 2021).
  39. Ceb-Fip Model Code 1990, 1993: Design Code; Telford: London, UK, 1993. [CrossRef]
  40. Design Provisions for Drying Shrinkage and Creep of Normal-Strength Concrete. ACI Mater. J. 2001, 98. [CrossRef]
  41. Vipulanandan, C.; Mohammed, A.S. Smart cement modified with iron oxide nanoparticles to enhance the piezoresistive behavior and compressive strength for oil well applications. Smart Mater. Struct. 2015, 24, 125020. [Google Scholar] [CrossRef]
  42. Vipulanandan, C.; Mohammed, A. New Vipulanandan Failure Model and Property Correlations for Sandstone. Shale Limest. Rocks 2018. [Google Scholar] [CrossRef]
Figure 1. Fine aggregate gradation.
Sustainability 13 03697 g001
Figure 2. Photograph of the polypropylene fibers.
Sustainability 13 03697 g002
Figure 3. Mechanical test setup.
Sustainability 13 03697 g003
Figure 4. Compressive strength results of all mixtures.
Sustainability 13 03697 g004
Figure 5. Flexural strength results of all mixtures.
Sustainability 13 03697 g005
Figure 6. Prediction errors of the three existing models.
Sustainability 13 03697 g006
Figure 7. Linear fitting of the fiber content’s influence on compressive strength.
Sustainability 13 03697 g007
Figure 8. The relationship between the fiber content’s fitting parameter “k1” and sample age.
Sustainability 13 03697 g008
Figure 9. Linear fitting of the loading speed’s influence on compressive strength.
Sustainability 13 03697 g009
Figure 10. The relationship between the loading speed’s fitting parameter “k2” and sample age.
Sustainability 13 03697 g010
Figure 11. Prediction of the compressive strength in terms of experimental compressive strength.
Sustainability 13 03697 g011
Figure 12. Prediction error of compressive strength.
Sustainability 13 03697 g012
Figure 13. Flexural strength of plain cement mortar in terms of sample age.
Sustainability 13 03697 g013
Figure 14. Linear fitting of the fiber content’s influence on flexural strength.
Sustainability 13 03697 g014
Figure 15. The relationship between the fiber content’s fitting parameter “k3” and sample age.
Sustainability 13 03697 g015
Figure 16. Linear fitting of the loading speed’s influence on flexural strength.
Sustainability 13 03697 g016
Figure 17. The relationship between the loading speed’s fitting parameter “k4” and sample age.
Sustainability 13 03697 g017
Figure 18. Prediction flexural strength in terms of experimental flexural strength.
Sustainability 13 03697 g018
Figure 19. Prediction error of the flexural strength.
Sustainability 13 03697 g019
Table 1. Chemical composition (% by mass) and fineness of the cement.
CaOSiO2Al2O3Fe2O3MgOSO3K2ONa2OLoIFineness (m2/kg)
64.4720.874.873.692.132.520.650.110.77368.9
Table 2. Properties of polypropylene fibers (PPFs).
Length (mm)6Diameter (μm)18~48
Tensile strength (MPa)≥450Elongation at break (%)1
Young’s modulus (GPa)≥3.5Burning point (°C)590
Density (g/cm3)0.91Melting point (°C)165~175
Table 3. Normalized compressive strength and flexural strength (%).
Fiber Content (%)Loading Speed (kN/s)Sample Age (Days)
0.51371428
fc,aveff,avefc,aveff,avefc,aveff,avefc,aveff,avefc,aveff,avefc,aveff,ave
00.36.526.3026.3626.2250.7650.6169.3269.1183.7183.33100.00100.00
0.66.496.5126.2026.2350.5550.4969.0069.2383.3983.43100.00100.00
1.06.506.5826.1926.1350.3550.5669.2372.7483.2283.46100.00100.00
0.50.36.516.3926.2126.1550.5650.5069.5269.2683.2783.23100.00100.00
0.66.536.4126.1726.2150.5450.6869.3169.3283.3983.30100.00100.00
1.06.496.6526.1926.2550.5250.6569.0769.3283.5183.36100.00100.00
1.00.36.476.4526.2226.1750.5550.5969.4569.3483.2783.40100.00100.00
0.66.476.4526.1826.1950.5350.6669.2669.2683.3983.30100.00100.00
1.09.536.5126.5026.2251.1850.4569.0269.2683.1683.36100.00100.00
Note: All strength values were normalized by 28-day test results.
Table 4. Compressive and flexural strength % increase or % decrease in terms of loading speed.
Fiber Content (%)Loading Speed (kN/s)Sample Age (Days)
0.51371428
fcfffcfffcfffcfffcfffcff
00.62.33 6.45 2.01 3.10 2.24 2.81 2.19 3.24 2.26 3.17 2.65 3.05
1.08.14 12.90 7.61 7.75 7.46 8.03 8.20 13.82 7.69 8.29 8.33 8.13
0.50.63.43 3.13 2.84 3.05 2.94 3.16 2.67 2.88 3.13 2.88 2.97 2.79
1.08.00 12.50 8.09 8.40 8.09 8.30 7.49 8.07 8.48 8.15 8.18 7.98
1.00.62.81 3.03 2.77 2.99 2.88 3.09 2.62 2.82 3.06 2.81 2.91 2.93
1.058.99 9.09 9.15 8.21 9.35 7.72 7.33 7.89 7.86 7.96 8.00 8.01
Table 5. Compressive and flexural strength % increase or % decrease in terms of fiber content.
Loading Speed (kN/s)Fiber Content (%)Sample Age (Days)
0.51371428
fcfffcfffcfffcfffcfffcff
0.30.51.74 3.23 1.29 1.55 1.49 1.61 2.19 2.06 1.36 1.71 1.89 1.83
1.03.49 6.45 3.59 3.88 3.73 4.02 4.37 4.41 3.62 4.15 4.17 4.07
0.60.52.84 0.00 2.11 1.50 2.19 1.95 2.67 1.71 2.21 1.42 2.21 1.58
1.03.98 3.03 4.37 3.76 4.38 4.30 4.81 3.99 4.42 3.78 4.43 3.94
1.00.51.61 2.86 1.74 2.16 2.08 1.86 1.52 −3.10 2.10 1.58 1.75 1.69
1.052.15 2.86 5.07 4.32 5.56 3.72 3.54 −1.03 3.78 3.83 3.85 3.95
Table 6. Available time-dependent compressive strength prediction models.
SourceModel
ACI 209 [38] ( f c ) t ( f c ) 28 = t 4 + 0.85 t
CEB-FIP [39] ( f c ) t ( f c ) 28 = exp ( 0.25 ( 1 28 t ) )
GL 2000 [40] ( f c ) t ( f c ) 28 = t 0.75 2.8 + 0.77 t 0.77
Note: In the models, (fc)t denotes the compressive strength under different ages, (fc)28 denotes the compressive strength at 28 days of age, and t represents the sample age (days).
Publisher’s Note: MDPI stays neutral with regard to jurisdictional claims in published maps and institutional affiliations.

