Examining the Relationship between Social Inefficiency and Financial Performance. Evidence from Wisconsin Dairy Farms


Abstract
1. Introduction
2. Methods
2.1. Dynamic Inefficiency Model
2.2. Panel Data Regression Analysis of the Effect of Social Inefficiency on Farm Financial Performance
3. Data and Empirical Issues
4. Results and Discussion
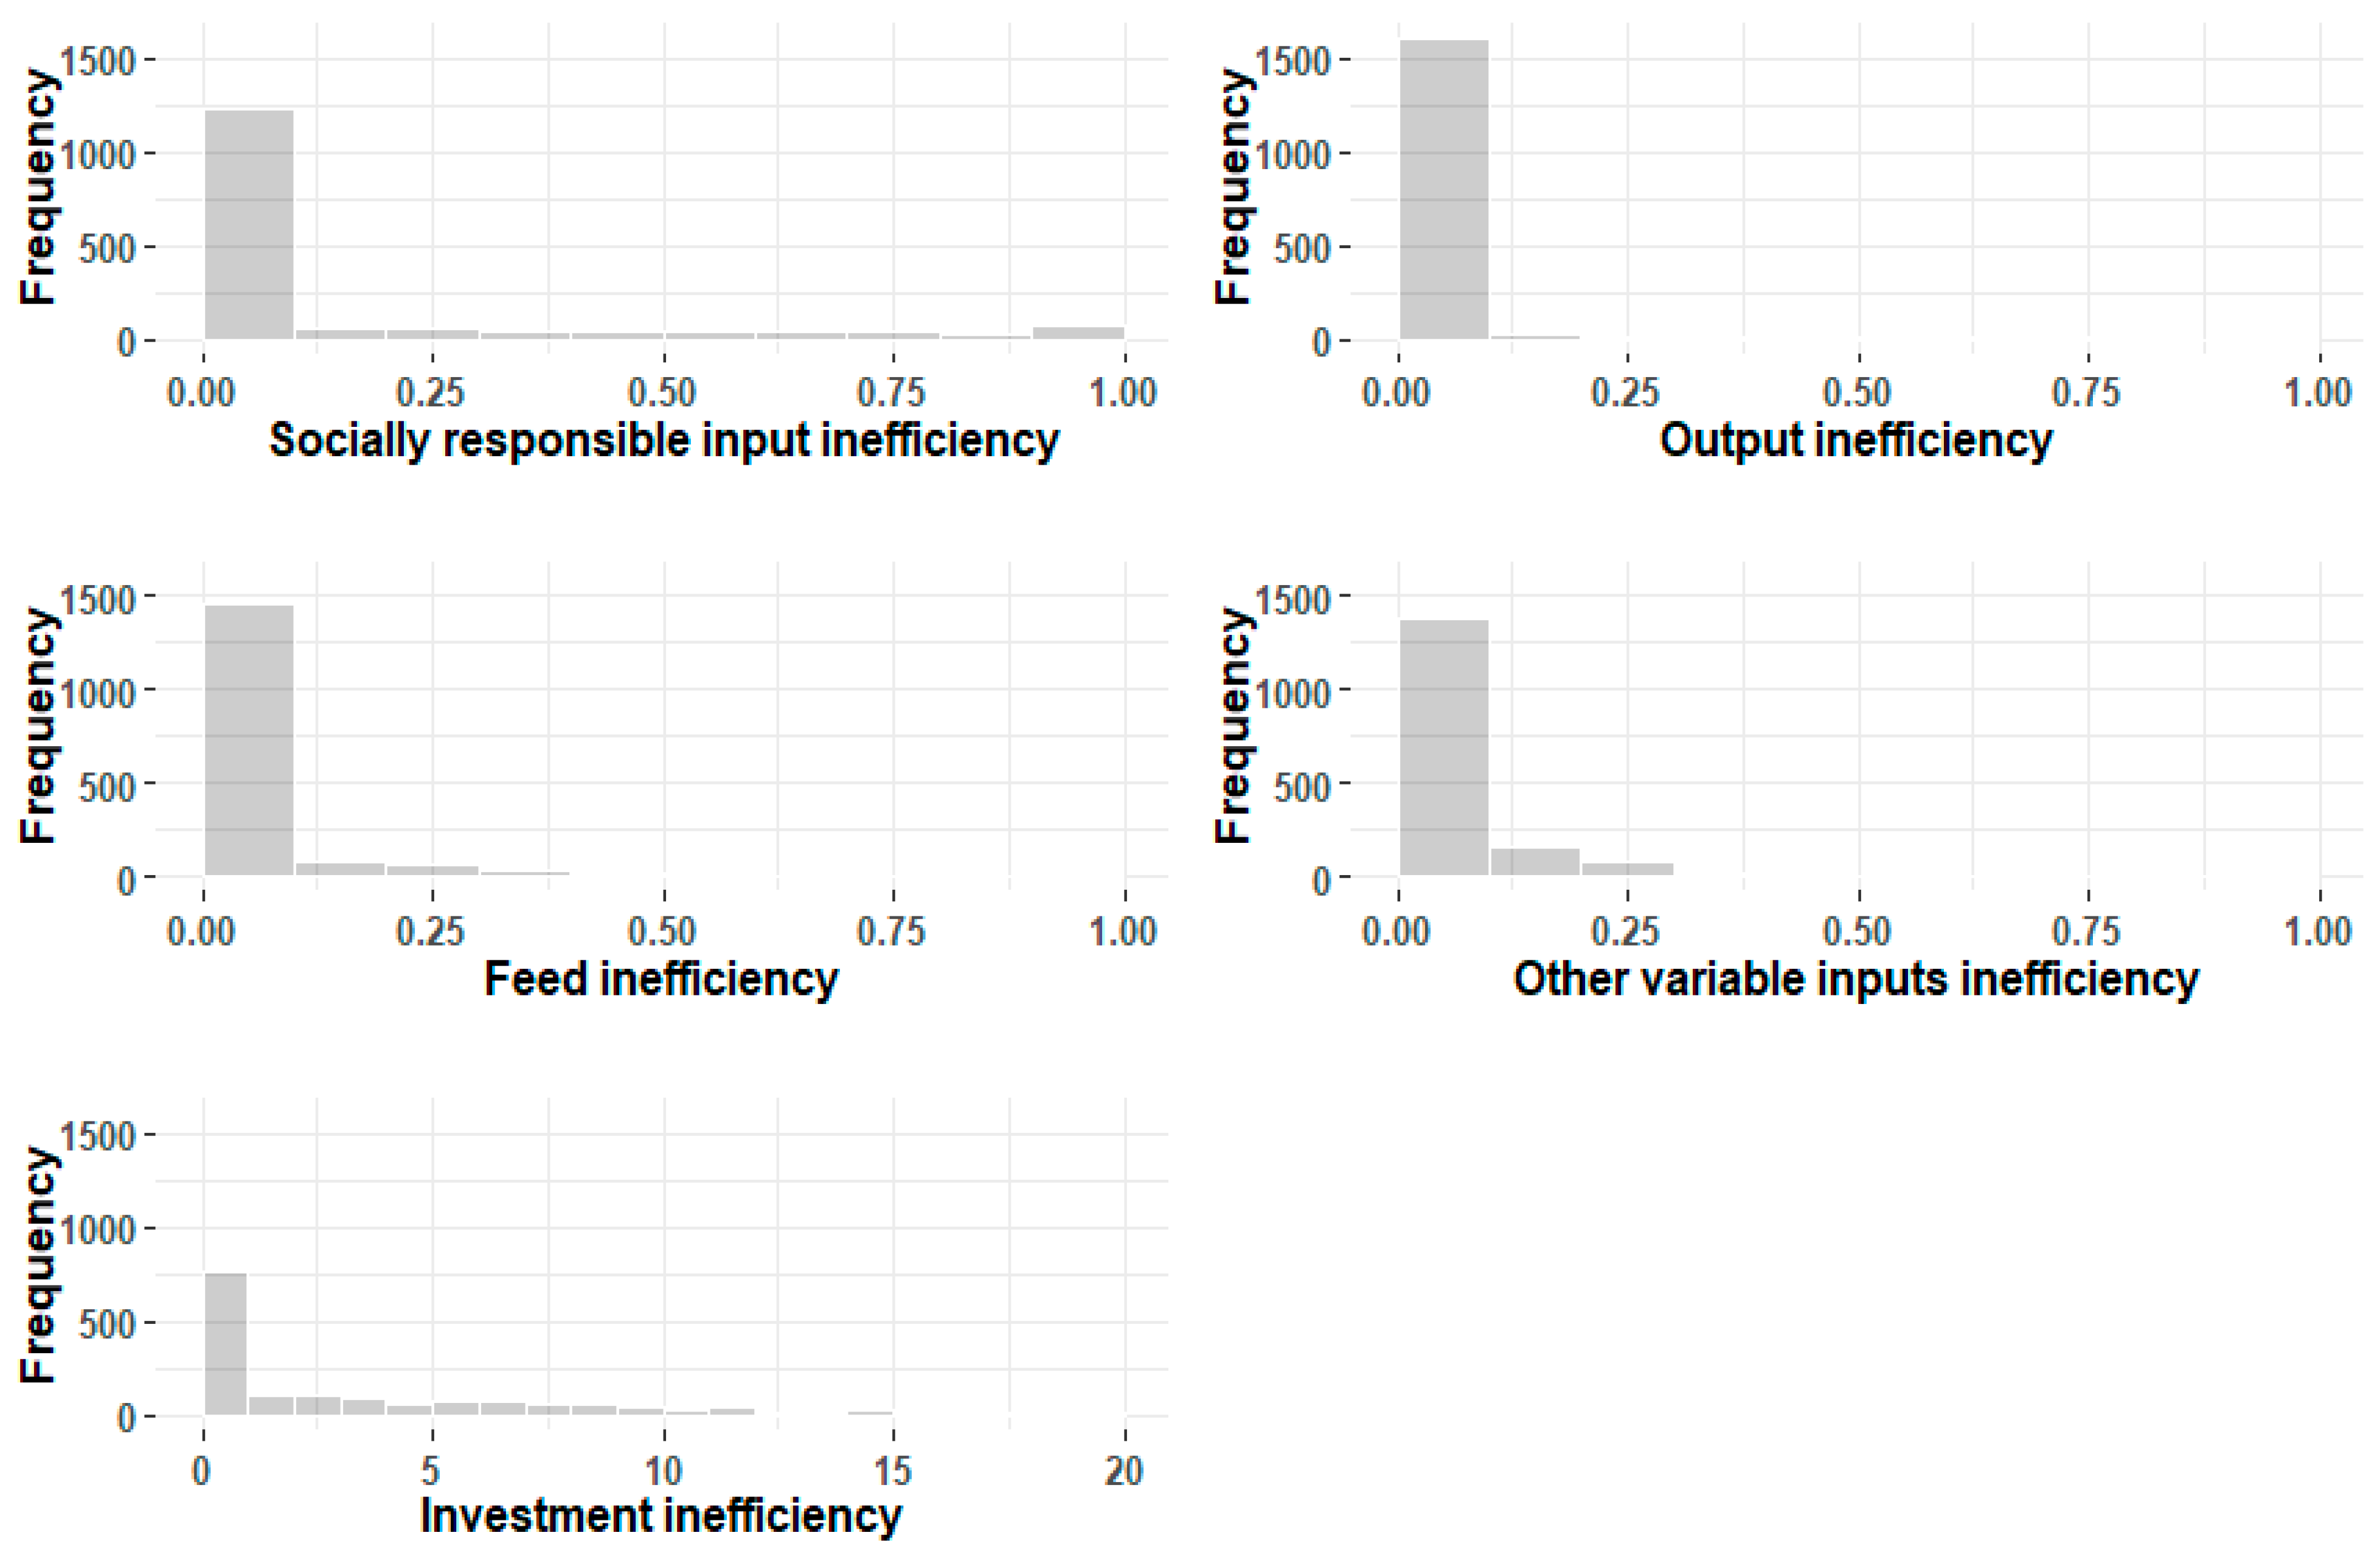
4.1. Dynamic Inefficiency Estimates
4.2. The Effect of Social Inefficiency and Control Factors on Farm Profitability
5. Conclusions
Author Contributions
Funding
Institutional Review Board Statement
Informed Consent Statement
Data Availability Statement
Acknowledgments
Conflicts of Interest
Appendix A

| Estimate | Standard Error | |
|---|---|---|
| Social efficiency | 153.407 ** | 66.186 |
| Number of head | −0.043 | 0.075 |
| Debt-to-asset ratio | −898.576 *** | 97.925 |
| Non-farm income | −0.764 *** | 0.285 |
| Government payments | −4.289 *** | 0.72 |
| South | −256.583 ** | 124.378 |
| North | −267.106 ** | 114.61 |
| t | −15.184 ** | 6.069 |
| t2 | −11.409 *** | 2.065 |
| _cons | 1204.369 *** | 133.62 |
| Wald | 203.03 *** |
References
- European Commission. Sustainable Agriculture in the CAP. 2020. Available online: https://ec.europa.eu/info/food-farming-fisheries/sustainability/sustainable-cap_en (accessed on 17 December 2020).
- USDA. Sustainable Agriculture. 2020. Available online: https://nifa.usda.gov/topic/sustainable-agriculture (accessed on 17 December 2020).
- Mulder, M.; Zomer, S. Dutch consumers’ willingness to pay for broiler welfare. J. Appl. Anim. Welf. Sci. 2017, 20, 137–154. [Google Scholar] [CrossRef]
- Reinhard, S.; Lovell, C.K.; Thijssen, G. Econometric estimation of technical and environmental efficiency: An application to Dutch dairy farms. Am. J. Agric. Econ. 1999, 81, 44–60. [Google Scholar] [CrossRef]
- Serra, T.; Chambers, R.G.; Oude Lansink, A. Measuring technical and environmental efficiency in a state-contingent technology. Eur. J. Oper. Res. 2014, 236, 706–717. [Google Scholar] [CrossRef]
- Skevas, T.; Lansink, A.O.; Stefanou, S.E. Measuring technical efficiency in the presence of pesticide spillovers and production uncertainty: The case of Dutch arable farms. Eur. J. Oper. Res. 2012, 223, 550–559. [Google Scholar] [CrossRef]
- Ait Sidhoum, A. Valuing social sustainability in agriculture: An approach based on social outputs’ shadow prices. J. Clean. Prod. 2018, 203, 273–286. [Google Scholar] [CrossRef]
- Ait Sidhoum, A.; Serra, T.; Latruffe, L. Measuring sustainability efficiency at farm level: A data envelopment analysis approach. Eur. Rev. Agric. Econ. 2020, 47, 200–225. [Google Scholar] [CrossRef]
- Chen, C.M.; Delmas, M. Measuring corporate social performance: An efficiency perspective. Prod. Oper. Manag. 2011, 20, 789–804. [Google Scholar] [CrossRef]
- Wang, X.; Lai, W.; Song, X.; Lu, C. Implementation Efficiency of Corporate Social Responsibility in the Construction Industry: A China Study. Int. J. Environ. Res. Public Health 2018, 15, 2008. [Google Scholar] [CrossRef] [PubMed]
- Engida, T.G.; Rao, X.; Oude Lansink, A.G.J.M. A dynamic by-production framework for analyzing inefficiency associated with corporate social responsibility. Eur. J. Oper. Res. 2020, 287, 1170–1179. [Google Scholar] [CrossRef]
- Latruffe, L.; Diazabakana, A.; Bockstaller, C.; Desjeux, Y.; Finn, J.; Kelly, E.; Ryan, M.; Uthes, S. Measurement of sustainability in agriculture: A review of indicators. Stud. Agric. Econ. 2016, 118, 123–130. [Google Scholar] [CrossRef]
- Lebacq, T.; Baret, P.V.; Stilmant, D. Sustainability indicators for livestock farming. A review. Agron. Sustain. Dev. 2013, 33, 311–327. [Google Scholar] [CrossRef]
- Di Iacovo, F.; O’Connor, D. Supporting Policies for Social Farming in Europe: Progressing Multifunctionality in Responsive Rural Areas; SoFar Project: Supporting EU Agricultural Policies; ARSIA, Agenzia Regionale per lo Sviluppo e l’Innovazione nel settore Agricolo-forestale: Firenze, Italy, 2009. [Google Scholar]
- García-Llorente, M.; Rossignoli, C.M.; Di Iacovo, F.; Moruzzo, R. Social farming in the promotion of social-ecological sustainability in rural and periurban areas. Sustainability 2016, 8, 1238. [Google Scholar] [CrossRef]
- Di Iacovo, F.; Moruzzo, R.; Rossignoli, C.M. Collaboration, knowledge and innovation toward a welfare society: The case of the Board of Social Farming in Valdera (Tuscany), Italy. J. Agric. Educ. Ext. 2017, 23, 289–311. [Google Scholar] [CrossRef]
- Musolino, D.; Marcianò, C.; Distaso, A. The role of social farming in the socio-economic development of highly marginal regions: An investigation in Calabria. Sustainability 2020, 12, 5285. [Google Scholar] [CrossRef]
- Ioannou, I.; Serafeim, G. What drives corporate social performance? The role of nation-level institutions. J. Int. Bus. Stud. 2012, 43, 834–864. [Google Scholar] [CrossRef]
- Schmidt, I.; Meurer, M.; Saling, P.; Kicherer, A.; Reuter, W.; Gensch, C.-O. SEEbalance®: Managing Sustainability of Products and Processes with the Socio-Eco-Efficiency Analysis by BASF. Greener Manag. Int. 2004, 45, 79–94. [Google Scholar]
- Myers, J.R.; Layne, L.A.; Marsh, S.M. Injuries and fatalities to US farmers and farm workers 55 years and older. Am. J. Ind. Med. 2009, 52, 185–194. [Google Scholar] [CrossRef] [PubMed]
- Notarnicola, B.; Hayashi, K.; Curran, M.A.; Huisingh, D. Progress in working towards a more sustainable agri-food industry. J. Clean. Prod. 2012, 28, 1–8. [Google Scholar] [CrossRef]
- Friedman, M. The social responsibility of business is to increase its profits. In Corporate Ethics and Corporate Governance; Zimmerli, W.C., Holzinger, M., Richter, K., Eds.; Springer: Berlin/Heidelberg, Germany, 2007; pp. 173–178. [Google Scholar] [CrossRef]
- Greening, D.W.; Turban, D.B. Corporate Social Performance as a Competitive Advantage in Attracting a Quality Workforce. Bus. Soc. 2000, 39, 254–280. [Google Scholar] [CrossRef]
- Lin, C.-H.; Yang, H.-L.; Liou, D.-Y. The impact of corporate social responsibility on financial performance: Evidence from business in Taiwan. Technol. Soc. 2009, 31, 56–63. [Google Scholar] [CrossRef]
- Rolfe, J.; Harvey, S. Heterogeneity in practice adoption to reduce water quality impacts from sugarcane production in Queensland. J. Rural Stud. 2017, 54, 276–287. [Google Scholar] [CrossRef]
- Ripoll-Bosch, R.; Díez-Unquera, B.; Ruiz, R.; Villalba, D.; Molina, E.; Joy, M.; Bernués, A. An integrated sustainability assessment of mediterranean sheep farms with different degrees of intensification. Agric. Syst. 2012, 105, 46–56. [Google Scholar] [CrossRef]
- Sulewski, P.; Kłoczko-Gajewska, A.; Sroka, W. Relations between agri-environmental, economic and social dimensions of farms’ sustainability. Sustainability 2018, 10, 4629. [Google Scholar] [CrossRef]
- Ryan, M.; Hennessy, T.; Buckley, C.; Dillon, E.J.; Donnellan, T.; Hanrahan, K.; Moran, B. Developing farm-level sustainability indicators for Ireland using the Teagasc National Farm Survey. Ir. J. Agric. Food Res. 2016, 55, 112–125. [Google Scholar] [CrossRef]
- Piedra-Muñoz, L.; Galdeano-Gómez, E.; Pérez-Mesa, J.C. Is sustainability compatible with profitability? An empirical analysis on family farming activity. Sustainability 2016, 8, 893. [Google Scholar] [CrossRef]
- Busch, T.; Friede, G. The robustness of the corporate social and financial performance relation: A second-order meta-analysis. Corp. Soc. Responsib. Environ. Manag. 2018, 25, 583–608. [Google Scholar] [CrossRef]
- Sickles, R.C.; Zelenyuk, V. Measurement of Productivity and Efficiency; Cambridge University Press: Cambridge, UK, 2019. [Google Scholar]
- Jagow, J. Dairy Farms and H-2A Harms: How Present Immigration Policy Is Hurting Wisconsin and Immigrant Workers. Wis. L. Rev. 2019, 2019, 1269. [Google Scholar]
- Jette Nantel, S. Farm Employment in Wisconsin. 2018. Available online: https://farms.extension.wisc.edu/articles/farm-employment-in-wisconsin/ (accessed on 23 January 2021).
- Blau, P. Exchange and Power in Social Life; Routledge: London, UK, 2017. [Google Scholar]
- Haar, J.M.; Spell, C.S. Programme knowledge and value of work-family practices and organizational commitment. Int. J. Hum. Resour. Manag. 2004, 15, 1040–1055. [Google Scholar] [CrossRef]
- Chung, Y.H.; Färe, R.; Grosskopf, S. Productivity and Undesirable Outputs: A Directional Distance Function Approach. J. Environ. Manag. 1997, 51, 229–240. [Google Scholar] [CrossRef]
- Guillamon-Saorin, E.; Kapelko, M.; Stefanou, S.E. Corporate Social Responsibility and Operational Inefficiency: A Dynamic Approach. Sustainability 2018, 10, 2277. [Google Scholar] [CrossRef]
- Dakpo, K.H.; Lansink, A.O. Dynamic pollution-adjusted inefficiency under the by-production of bad outputs. Eur. J. Oper. Res. 2019, 276, 202–211. [Google Scholar] [CrossRef]
- Tauer, L.W.; Knoblauch, W.A. The empirical impact of bovine somatotropin on New York dairy farms. J. Dairy Sci. 1997, 80, 1092–1097. [Google Scholar] [CrossRef]
- Foltz, J.D.; Chang, H.H. The adoption and profitability of rbST on Connecticut dairy farms. Am. J. Agric. Econ. 2002, 84, 1021–1032. [Google Scholar] [CrossRef]
- Hennessy, T.; Heanue, K. Quantifying the effect of discussion group membership on technology adoption and farm profit on dairy farms. J. Agric. Educ. Ext. 2012, 18, 41–54. [Google Scholar] [CrossRef]
- Armstrong, R. Basic Wisconsin Employment Laws for Farms. 2014. Available online: https://farmcommons.org/sites/default/files/resources/WI%20Employment%20Law%20Guide.pdf (accessed on 23 November 2020).
- Simar, L.; Wilson, P.W. Estimation and inference in two-stage, semi-parametric models of production processes. J. Econom. 2007, 136, 31–64. [Google Scholar] [CrossRef]
- Kapelko, M.; Oude Lansink, A.; Guillamon-Saorin, E. Corporate social responsibility and dynamic productivity change in the US food and beverage manufacturing industry. Agribusiness 2020. [Google Scholar] [CrossRef]
- USDA. Dairy Data. 2019. Available online: https://www.ers.usda.gov/data-products/dairy-data.aspx (accessed on 26 February 2021).
- Banker, R.D.; Chang, H. The super-efficiency procedure for outlier identification, not for ranking efficient units. Eur. J. Oper. Res. 2006, 175, 1311–1320. [Google Scholar] [CrossRef]
- Ang, F.; Oude Lansink, A. Decomposing dynamic profit inefficiency of Belgian dairy farms. Eur. Rev. Agric. Econ. 2018, 45, 81–99. [Google Scholar] [CrossRef]
- Skevas, I.; Oude Lansink, A. Dynamic Inefficiency and Spatial Spillovers in Dutch Dairy Farming. J. Agric. Econ. 2020. [Google Scholar] [CrossRef]
- Skevas, T.; Cabrera, V.E. Measuring farmers’ dynamic technical and udder health management inefficiencies: The case of Wisconsin dairy farms. J. Dairy Sci. 2020, 103, 12117–12127. [Google Scholar] [CrossRef]
- NASS. Prices Paid Surveys and Indexes. 2020. Available online: https://www.nass.usda.gov/Surveys/Guide_to_NASS_Surveys/Prices_Paid_and_Prices_Paid_Indexes/ (accessed on 9 April 2020).
- NASS. Census of Agriculture, Wisconsin. 2020. Available online: https://www.nass.usda.gov/Publications/AgCensus/2017/Full_Report/Volume_1,_Chapter_1_State_Level/Wisconsin/ (accessed on 27 November 2020).
- Cabrera, V.E.; Solis, D.; Del Corral, J. Determinants of technical efficiency among dairy farms in wisconsin. J. Dairy Sci. 2010, 93, 387–393. [Google Scholar] [CrossRef]
- Chidmi, B.; Solís, D.; Cabrera, V.E. Analyzing the sources of technical efficiency among heterogeneous dairy farms: A quantile regression approach. Anim. Prod. 2011, 13, 99–107. [Google Scholar]
- Njuki, E.; Bravo-Ureta, B.E.; Cabrera, V.E. Climatic effects and total factor productivity: Econometric evidence for wisconsin dairy farms. Eur. Rev. Agric. Econ. 2020, 1–26. [Google Scholar] [CrossRef]
- Skevas, I.; Skevas, T. A generalized true random-effects model with spatially autocorrelated persistent and transient inefficiency. Eur. J. Oper. Res. 2021. [Google Scholar] [CrossRef]
- Langton, S. Debt and farm performance. In Proceedings of the Presented at the 89th Annual Conference of the Agricultural Economics Society, Coventry, UK, 13–15 April 2015. [Google Scholar]
- Skevas, T.; Wu, F.; Guan, Z. Farm Capital Investment and Deviations from the Optimal Path. J. Agric. Econ. 2018, 69, 561–577. [Google Scholar] [CrossRef]
- Mugisha, J.; Ajer, B.; Elepu, G. Contribution of Uganda Cooperative Alliance to Farmers’ Adoption of Improved Agricultural Technologies. J. Agric. Soc. Sci. 2012, 8, 1–9. [Google Scholar]


| Variable. | Unit | Mean | Std. Dev. |
|---|---|---|---|
| Output | $1000 | 1790.174 | 2184.813 |
| Feed | $1000 | 488.276 | 731.102 |
| Other variable inputs | $1000 | 771.084 | 925.611 |
| Land | acres | 709.654 | 554.098 |
| Labor | $1000 | 174.499 | 224.095 |
| Capital | $1000 | 800.061 | 1284.790 |
| Net investment | $1000 | 50.470 | 343.664 |
| Depreciation | $1000 | 191.327 | 253.864 |
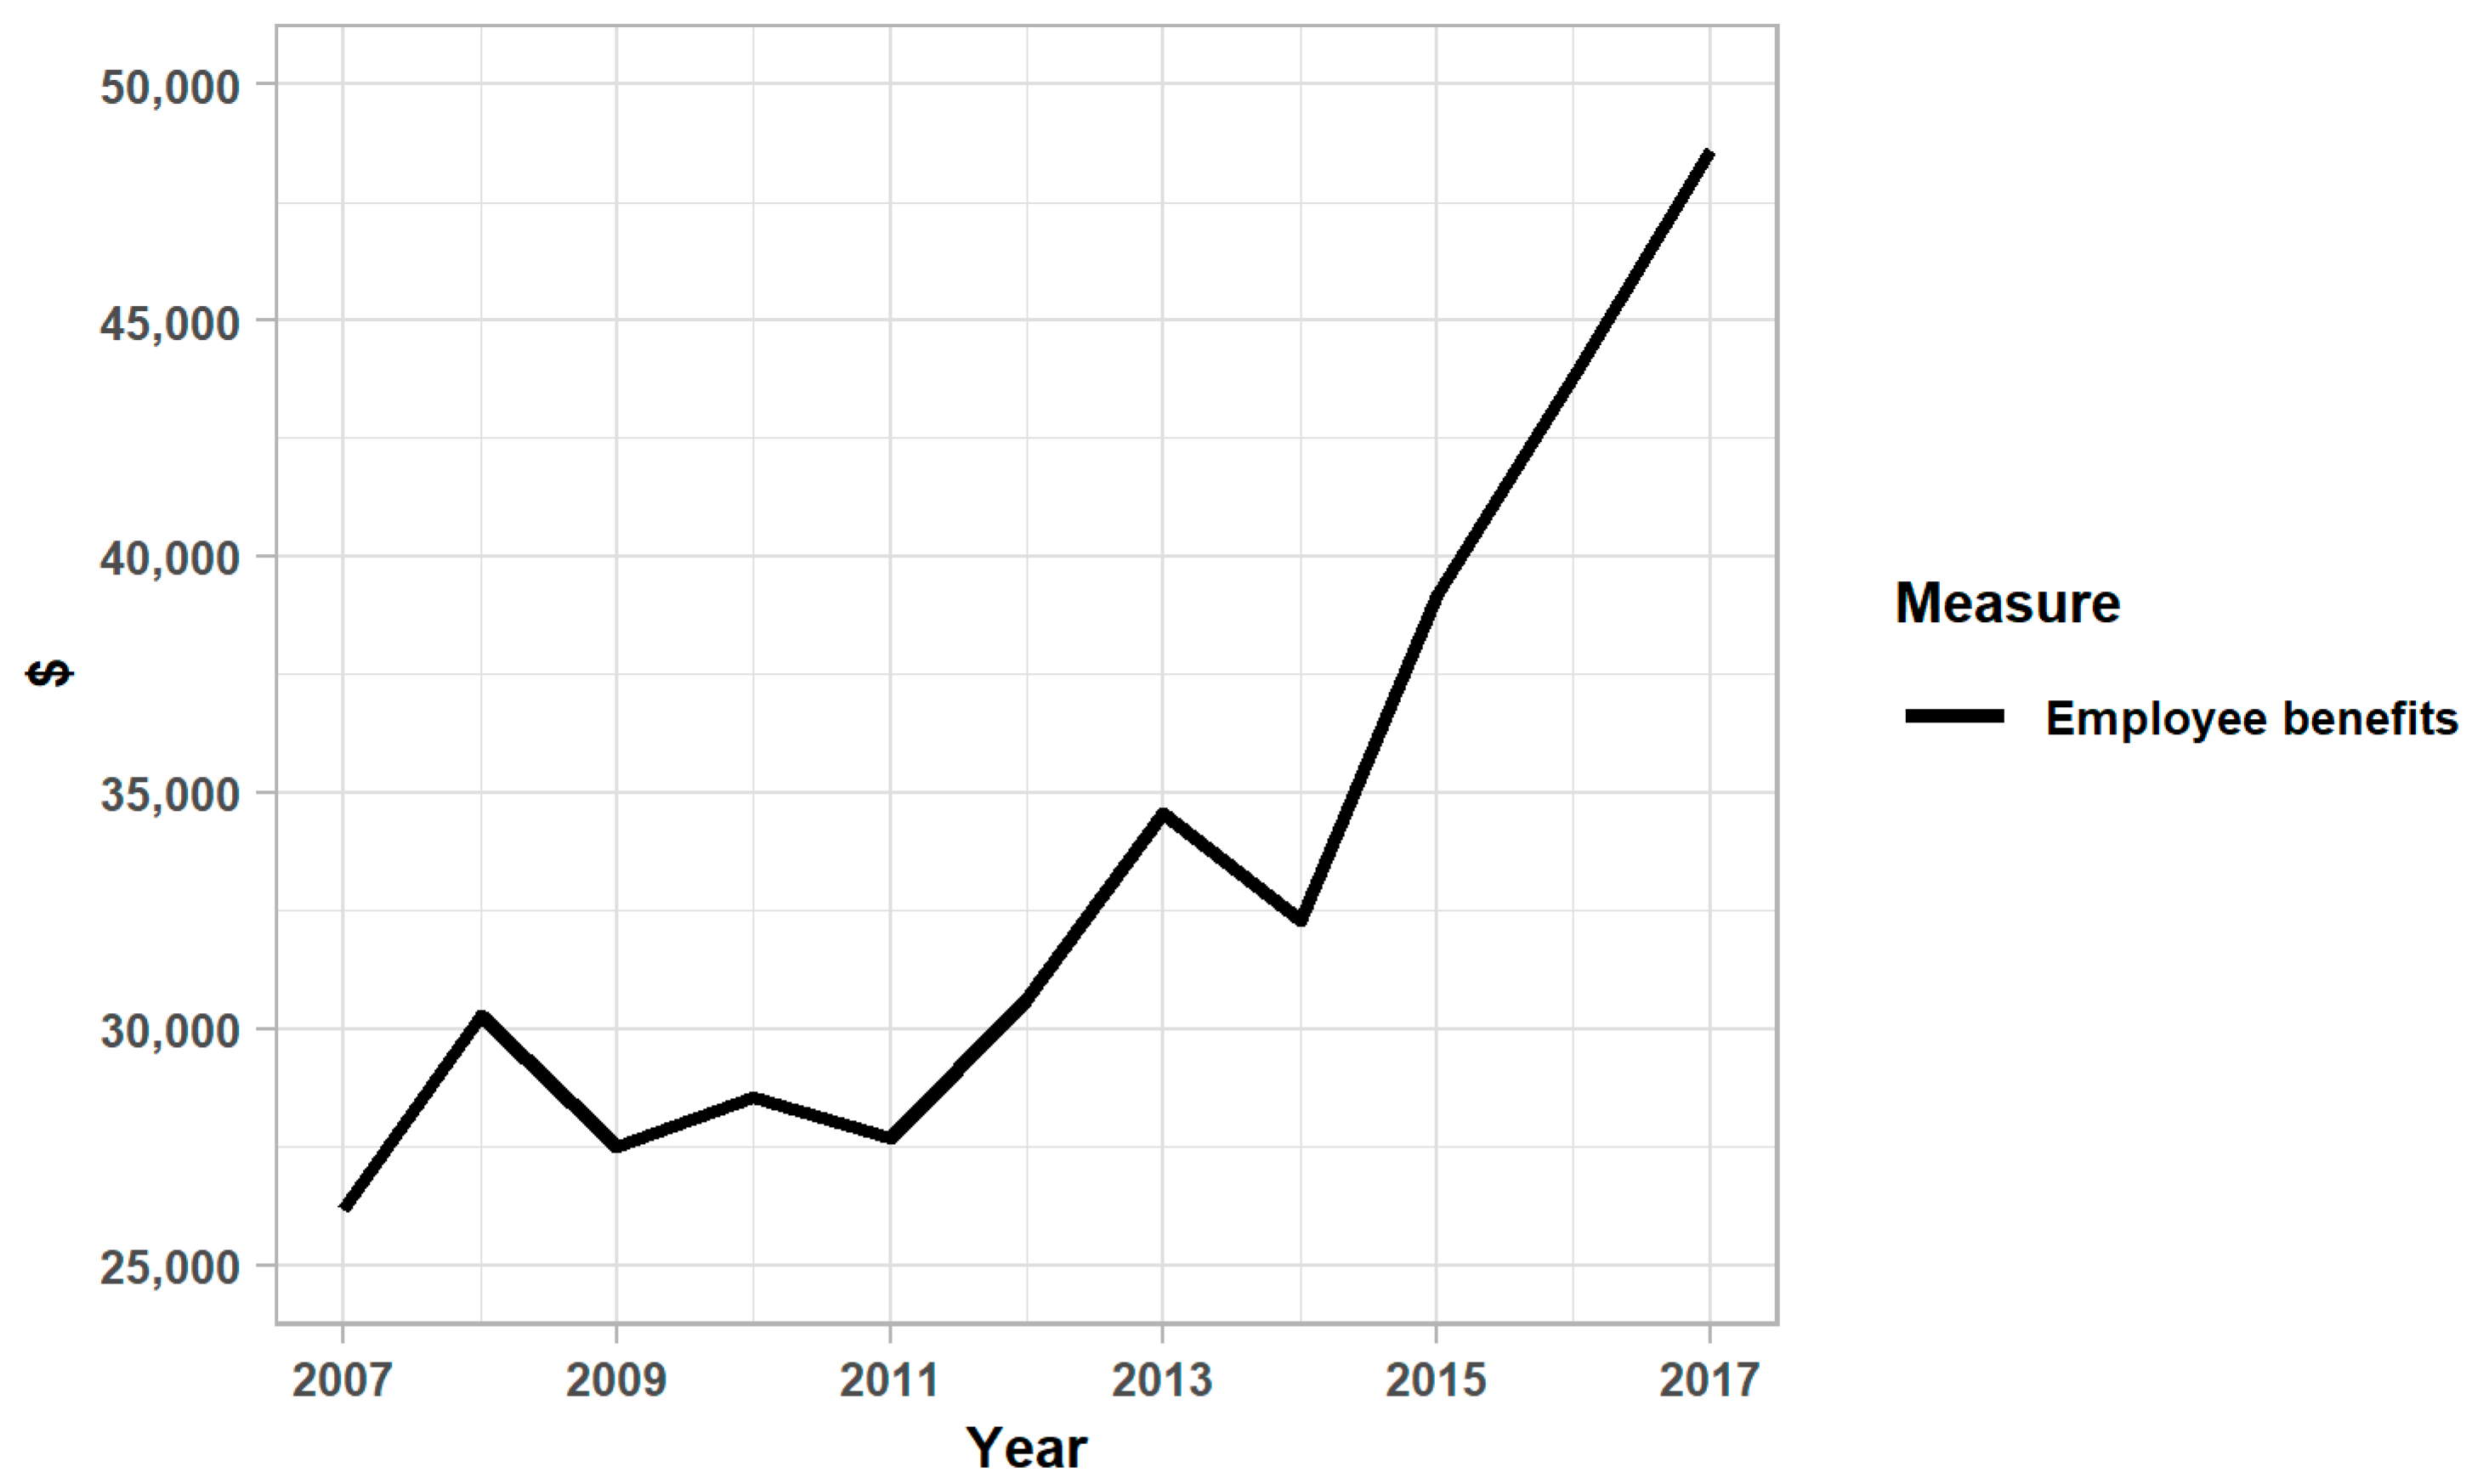
| Employee benefits | $1000 | 33.252 | 39.040 |
| Farm profit | $/cow | 583.161 | 808.525 |
| Number of head | count | 330.040 | 400.151 |
| Debt-to-asset ratio | ratio | 0.333 | 0.254 |
| Non-farm income | $1000 | 18.109 | 63.165 |
| Government payments | $1000 | 20.316 | 26.629 |
| South | (0/1) | 0.207 | 0.405 |
| North | (0/1) | 0.748 | 0.434 |
| Central | (0/1) | 0.041 | 0.197 |
| Year | Output | Feed | Other Variable Inputs | Investments | Socially Responsible Input |
|---|---|---|---|---|---|
| 2007 | 0.008 | 0.032 | 0.008 | 2.490 | 0.121 |
| 2008 | 0.003 | 0.040 | 0.022 | 4.644 | 0.153 |
| 2009 | 0.017 | 0.067 | 0.038 | 4.088 | 0.205 |
| 2010 | 0.003 | 0.018 | 0.052 | 3.438 | 0.107 |
| 2011 | 0.003 | 0.030 | 0.029 | 1.825 | 0.189 |
| 2012 | 0.004 | 0.018 | 0.049 | 4.147 | 0.107 |
| 2013 | 0.005 | 0.010 | 0.032 | 4.071 | 0.092 |
| 2014 | 0.018 | 0.010 | 0.037 | 2.472 | 0.094 |
| 2015 | 0.062 | 0.051 | 0.079 | 3.555 | 0.147 |
| 2016 | 0.000 | 0.020 | 0.029 | 5.011 | 0.122 |
| 2017 | 0.002 | 0.030 | 0.022 | 4.521 | 0.197 |
| 2007–2017 | 0.011 | 0.030 | 0.036 | 3.660 | 0.139 |
| Inefficient Farms | Efficient Farms | |||
|---|---|---|---|---|
| Count | % | Count | % | |
| Output | 123 | 7 | 1528 | 93 |
| Feed | 307 | 19 | 1344 | 81 |
| Other variable inputs | 438 | 27 | 1213 | 73 |
| Investments | 965 | 58 | 686 | 42 |
| Socially responsible input | 481 | 29 | 1170 | 71 |
| Output and all inputs | 976 | 59 | 675 | 41 |
| Coefficient | Standard Error | |
|---|---|---|
| Social inefficiency | −153.407 ** | 66.186 |
| Number of head | −0.043 | 0.075 |
| Debt-to-asset ratio | −898.576 *** | 97.925 |
| Non-farm income | −0.764 *** | 0.285 |
| Government payments | −4.289 *** | 0.720 |
| South | −256.583 ** | 124.378 |
| North | −267.106 ** | 114.61 |
| t | −15.184 ** | 6.069 |
| t2 | −11.409 *** | 2.065 |
| _cons | 1357.776 *** | 119.327 |
| Wald | 203.030 *** | - |
Publisher’s Note: MDPI stays neutral with regard to jurisdictional claims in published maps and institutional affiliations. |
© 2021 by the authors. Licensee MDPI, Basel, Switzerland. This article is an open access article distributed under the terms and conditions of the Creative Commons Attribution (CC BY) license (http://creativecommons.org/licenses/by/4.0/).
Share and Cite
Skevas, T.; Skevas, I.; Cabrera, V.E. Examining the Relationship between Social Inefficiency and Financial Performance. Evidence from Wisconsin Dairy Farms. Sustainability 2021, 13, 3635. https://doi.org/10.3390/su13073635
Skevas T, Skevas I, Cabrera VE. Examining the Relationship between Social Inefficiency and Financial Performance. Evidence from Wisconsin Dairy Farms. Sustainability. 2021; 13(7):3635. https://doi.org/10.3390/su13073635
Chicago/Turabian StyleSkevas, Theodoros, Ioannis Skevas, and Victor E. Cabrera. 2021. "Examining the Relationship between Social Inefficiency and Financial Performance. Evidence from Wisconsin Dairy Farms" Sustainability 13, no. 7: 3635. https://doi.org/10.3390/su13073635
APA StyleSkevas, T., Skevas, I., & Cabrera, V. E. (2021). Examining the Relationship between Social Inefficiency and Financial Performance. Evidence from Wisconsin Dairy Farms. Sustainability, 13(7), 3635. https://doi.org/10.3390/su13073635