Abstract
As the “Third Pole” of the Earth, the Tibetan Plateau (TP) has been warming significantly, and the instability of extreme events related to climate and weather has enhanced exceptionally in recent decades. These changes have posed increasingly severe impacts on the population over the TP. So far, however, the impacts on the population have not been assessed systematically and comprehensively from the perspective of risk. In this paper, the hazard of climate change was assessed from a fresh look, not only considering extreme changes of air temperature, precipitation, and wind speed, but also their changes in mean and fluctuation, using daily meteorological data from 1961–2015. The population exposure and vulnerability to climate change were then evaluated using demographic data and considering population scale and structure. Finally, the population risk over the TP to climate change was quantitatively assessed within the framework of the Intergovernmental Panel on Climate Change (IPCC). The results showed that the climate change hazard was mainly at medium and heavy levels, in areas accounting for 64.60% of the total. The population exposure was relatively low; the land area at slight and light levels accounted for 83.94%, but high in the eastern edge area of the TP. The population vulnerability was mostly at medium and heavy levels, and the non-agricultural population rate was the key factor affecting the population vulnerability. Generally, the overall population risk over the TP was not very high: the number of counties with heavy and very heavy risk only accounted for 24.29%, and land area was less than 5%. However, more than 40% of the population was in high-risk areas, located in the eastern edge area of the TP. Population exposure was the decisive factor of the population risk to climate change, and high population exposure might lead to high risk. These findings were potentially valuable to improve cognition of risk, develop proactive risk mitigation strategies, and ensure sustainable development.
1. Introduction
In the past few decades, most regions have experienced obvious warming, with a global average combined land and ocean surface temperature increase of 0.85 °C (0.65–1.06 °C) during 1880–2012 [1]. The persistent rise of temperature also altered the global hydrological cycle and weakened its stability [2,3], resulting in extreme events occurring more frequently, while the global trend of precipitation was unstable [4]. In China, the temperature of the land area increased by 0.90–1.52 °C from 1913 to 2012 [5], which was obviously higher than the global increase rate, and the overall tendency of precipitation showed no significant increase or decrease [6,7]. How much impact these climate factors have affected humans and what adaptation measures should be taken have been hotspots of global climate change research [8,9,10,11,12,13,14].
Growing evidence reveals that the impact of climate change on human security is multifaceted. Firstly, extreme events such as droughts and floods provoked by climate change can directly cause casualties [15]. Secondly, climate change could harm health by increasing infectious and non-communicable diseases [16,17]. At the same time, climate change indirectly affects human security by economic losses [10], population migration [18,19], war, and conflict [20]. To sum up, climate change has posed a serious challenge to human beings, and the challenge in most regions of the world will become more and more intense in the middle and latter period of this century.
In this wide context, the risk posed by climate change is highly concerning and has become a fast-growing field in climate change research [21,22,23]. This covers a wide range of contents, and different organizations or institutions have different understandings [24,25]. In the AR5 of IPCC, it was pointed out that the risk caused by climate change is the result of the interaction of hazards and the vulnerabilities of exposed elements, and would signify the severe interruption of the normal functioning of the affected society [26]. The population risk refers to the combination of the possibility, degree, and consequence of the adverse impacts of climate system change on a population. At present, the studies concerning the impact of climate change on human beings do not specifically target population risk, but only involve it in the overall picture. Existing studies mainly focus on the disaster risk of specific extreme events. Taking floods as an example, Agrawal et al. [27], Jadot et al. [28], and Assis et al. [29] studied the flood disaster risks in Uganda, France, and Brazil, respectively. All the study contents involved population, an important risk-bearing body, and the factors considered included population density, residential area, public perception of risk, and so on. Taking heat waves as another example, Harlan et al. [30], Tan et al. [31], and Tomlinson et al. [32] studied the impact and risk of heat waves on populations from different angles, and found that the age structure, population density, education level, and exposure location can influence the risk to a certain extent. Throughout the existing studies, whilst the impact of climate change on populations and population risk to climate change have been of wide concern in the research community, disaster risk is still the mainstream paradigm. While the importance of sudden-onset risk cannot be overemphasized, and recent research insights provide that slow-onset risk cannot be ignored [33], very few studies have been done to assess the slow-onset risk to climate change, especially for the slow-onset risk on populations.
The Tibetan Plateau (TP) is located in the core area of the Earth’s “Third Pole”, known as the “roof of the world” and the “Asian water tower” [34]. In the past few decades, the climate over the TP has undergone significant changes. The annual temperature rise rate of the TP was 0.30 °C · (10a)−1, the annual precipitation increased by 6.59 mm · (10a)−1, and extreme weather and climate events have accelerated and enhanced [35,36,37]. These variations have a serious negative impact on the health and safety of the population [34,38,39]. To make populations more resilient to the risks posed by climate change, local governments should urgently and realistically consider measures and strategies needed to help populations adapt to the adverse effects, and at the same time, consolidate the achievements of “targeted poverty alleviation”. Based on the review of the literature to date, the study of climate mean variation over the TP has advanced. The research objectives included the spatial-temporal distribution and dynamic change of the mean value [40,41], and the study area involved the Three-River Headwaters Region [42], Qaidam Basin [43], and other typical areas. As a response to the concern created by extreme weather and climate events, the research objects have included extreme temperature and extreme precipitation, and the study areas involved the western, eastern, and central TP, and other regions [44,45,46,47,48,49]. The current research on climate variations still lacks the combinations of trends, fluctuation characteristics, and extreme events. Some researchers have also discussed the risk of droughts, snow disasters, and other events over the TP [50,51], but only extreme or disaster was employed to represent the risk, while the risk-bearing body is not considered. Other researchers tended to build risk evaluation models, also for specific disasters, and the risk-bearing body was mostly concerned with the animal husbandry system [52,53,54,55]. Due to the different research directions and focuses, they pay more attention to grassland and livestock when considering exposure and vulnerability factors, while we would focus more on the population-related indicators. In addition to this targeted research, global- and national-scale risk studies have also involved the TP. However, due to the identical criteria and vast study area, the risk on the TP was always in a single level, which is different from the actual situation, and makes it difficult to show internal spatial differences [56,57]. What’s more, the lacking and missing regional socioeconomic data has made it “No data” in some studies, and missed the comparison with other areas.
Taking the above situation into consideration, this research attempted to (1) systematically assess the hazard from new perspectives of the combinations of trends, fluctuation characteristics, and extreme events; (2) reasonably evaluate the population exposure and vulnerability from the aspects of population scale and structure; and (3) comprehensively quantify the population risk to climate change, display the spatial pattern of the risk, and reveal the key influencing factors. The findings are of vital benefit for enhancing the understanding of population risk over the TP to climate change, improving the ability of risk prevention and mitigation, and providing scientific support to guarantee sustainable development.
2. Materials and Methods
2.1. Study Area
The TP is located in southwestern China, within a geographic range of 26°00′12″ N~39°46′50″ N and 73°18′52″ E~104°46′59″ E (Figure 1). The area of the TP is about 257.24 × 10⁴ km2, accounting for 26.8% of the total land area of China [58]. Due to its average elevation of 4500 m, the TP is well known as “the roof of the world” and has a major impact on the natural environment and human activities in East Asia, the Northern Hemisphere, and indeed, even the world. Due to the poor natural environment and low-level production, the TP areas encountered stagnation of population growth in historical times. Over the last 70 years, the population has continued to grow, and the level of living standards generally has increased with social-economic development and the provision of better medical care [59].
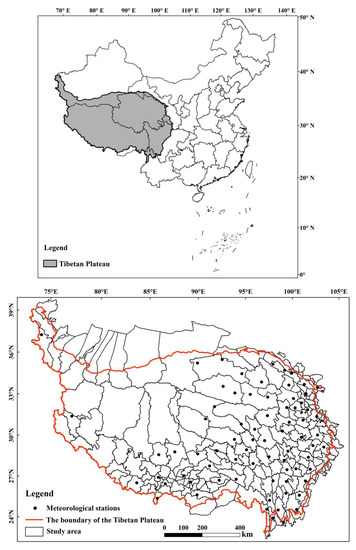
Figure 1.
Location map of the TP, study area, and meteorological stations [58].
There are 6 provinces and autonomous regions distributed in the TP—namely Qinghai Province, Tibet Autonomous Region, Sichuan Province, Yunnan Province, Xinjiang Uygur Autonomous Region, and Gansu Province—involving 215 counties, of which 143 are located inside the plateau, and 72 on the edge of the plateau [60]. Since 4 counties have a small proportion of their area inside the plateau and lack data, they are not included in the study area, so the study area included 211 counties.
2.2. Key Concepts and Definitions
The key concepts and definitions involved in our research are as follows:
Risk is defined as the likelihood and result of severe alterations in a community or a society due to climate change interacting with social conditions, leading to widespread adverse human, material, economic, or environmental effects, which derives from a combination of physical hazards and the vulnerabilities of exposed elements [26,61]. Here, we focus on the population risk to climate change.
The hazard of climate change refers to the loss and harm to population, economy, society, and environment caused by climate slow-onset variations of trend and fluctuation, and sudden-onset variations of extremes [33,61,62,63].
Exposure is employed to refer to the presence (location) of people, livelihoods, environmental resources and infrastructure that could be adversely affected by climate change, which, thereby, are subject to potential current and future harm, loss, or damage [61].
Vulnerability is defined as the propensity or predisposition to be adversely affected [61]. Such a predisposition constitutes an internal characteristic of the affected element. Specifically, population vulnerability is the degree to which the population system is susceptible to adverse effects of climate change, that is, the ability of the population to withstand the interference and damage of climate change.
2.3. Data and Its Sources
2.3.1. Administrative Division Data
The administrative division data used is a 1:4,000,000 county-level administrative division vector dataset and comes from the National Catalogue Service For Geographic Information. The geographical coordinate system used is GCS-Klasovaky1940, and the projection system is Albers projection.
2.3.2. Meteorological Data
The meteorological data comes from the China National Meteorological Science Data Center, including daily mean, maximum, minimum temperature, daily precipitation, and daily mean and maximum wind speed. Most of the meteorological stations on the TP were established in the late 1950s, and the data from some stations was very poor. In order to strictly control the data quality and ensure integrity, we selected the data of 73 stations from 1961 to 2015 (Figure 1), according to the principles of the most complete data and the longest period.
2.3.3. Population Data
The population data used were derived from the statistical yearbooks from 1990–2015 collected in the field and the county-level data of the fifth and sixth censuses, including total population, the scales of the agricultural population and non-agricultural population, the scales of the population aged 0–14 years and over 65 years, and population average schooling years. The reasons for choosing 1990 as the starting point of time are as follows: firstly, there is a strong temporal lag in the impact of climate change on human beings in various ways [64,65]; secondly, the administrative division of the study area has been stable since 1990, ensuring the authenticity and reliability of the research.
2.4. Methods
2.4.1. Data Processing Methods
Processing of Meteorological Data
The time series in 1961–2015 of annual temperature, precipitation, and wind speed over the TP are established in Equation (1), and the regression coefficient b was obtained by the least square method, as shown in Equations (2) and (3), which is called the “linear tendency value” and can represent the linear change rates of variables [66].
The Zi was the absolute residuals series of yi, and the linear regression equation between yi and corresponding time ti can be written as follows:
where regression coefficient d > 0 and d < 0 indicates the linear trend of Zi was increased or decreased, that is, the variables showed strengthening or weakening fluctuations in the period. The regression coefficient d is called the “fluctuation characteristic value” [66]. Different from the variance reflecting the dispersion of variables around the mean value in the study period, the fluctuation characteristic value was employed to quantify the fluctuation of variables in the linear increasing or decreasing trend, which was an important part of the hazard.
The appropriate criteria for the classification of extreme events on the TP is very crucial, because its climate characteristics are strongly different from those of other regions because of the high topography, complex landform pattern, and special atmospheric environment. For example, in China, a high temperature day is usually defined as a day with a maximum temperature ≥35 °C (monitoring indices of high temperature extremes, QX/T 280-2015), while a heavy precipitation day and a very heavy precipitation day are defined as a day when precipitation ≥50 mm and ≥100 mm, respectively (grade of precipitation, GB/T 28592-2012). However, it is found that these definitions are not applicable on the TP, through previous preliminary analyses of data [35,36], and if these definitions were adopted, extreme events on the TP would be seriously underestimated. The World Meteorological Organization’s Commission for Climatology (WMO-CCI), the World Climate Research Programme (WCRP), and the Climate Variability and Predictability (CLIVAR) have proposed the “Expert Team on Climate Change Detection and Indices” (ETCCDMI), which have been widely used in the weather and climate extremes research [44,45,67,68], to understand the characteristics of global extremes change and strengthen the comparative analysis of different regions. In this paper, the indices were selected to diagnose extremes changes from the aspects of intensity and frequency variations, based on the ETCCDMI and the actual conditions of the TP. These selected indices will be presented in Section 3.1.
Processing of Demographic Data
Population data were obtained through censuses and statistics. For counties distributed on the edge of the TP, it was necessary to suppose the spatial distribution of the population is equal-density, so we converted population size according to the area proportions on the TP. The calculation model was
where TXed is the total population of the TP, Ri is the proportion of area on the plateau to the total area of the counties, and TXi is the population scale of each county.
Note that the population density of areas on the TP should be lower than that of areas outside the TP, therefore, the population scale of the TP may be overestimated to some extent. However, the result of this equal-density edge theoretical model was the closest to the actual situation compared with other methods [60].
The population structure mainly includes age structure, employment structure, and educational structure. We quantify the population vulnerability from these three aspects later. The age structure is characterized by the coefficient of the children and the coefficient of the elderly, which reflect the proportions of children (<15 years old) and the elderly (≥65 years old), respectively, in the total population. The formulas is as follows:
where Mc and Mo represent the coefficient of the children and the coefficient of the elderly, respectively; Pt is the scale of the total population; and Pc and Po are the scale of the children and the elderly, respectively.
The employment structure is described by the agricultural population rate and non-agricultural population rate, which can be computed using Equations (9) and (10):
where Ma and Mna represent the agricultural population rate and non-agricultural population rate, respectively; Pt is the scale of the total population; and Pa is the scale of the agricultural population.
The educational structure is described by the population average schooling years, and the data sources from the population census.
2.4.2. Risk Assessing Methods
Risk Assessment Conceptual Model
In this paper, we mainly assess the population risk to climate change over the TP, and it is caused by three components: the hazard of climate variations, the exposure, and the vulnerability of the population affected [61], which can be expressed as follows:
where H represents the hazard, E represents the population exposure, and V represents the population vulnerability. R is a comprehensive index of population risk, integrating the hazard caused by climate change, the population exposure, and vulnerability to climate change into a complex system. The larger the value of R, the higher the risk to climate change.
There are very considerable differences between counties on the values of H, E, and V. Therefore, variables cannot be used to assess the risk directly, and values must be standardized to reflect a uniform evaluation system using the following equation:
where xij is the original value of H, E, and V in each county, and xmin,j and xmax,j are the minimum and maximum values of factor j, respectively. Yij is the processed value, between 0 and 100.
Factor Analysis and Entropy Weight Method
The advantage of factor analysis is that it can reduce many complex variables into some comprehensive factors without the loss of information, and calculate the scores and comprehensive scores of each common factor simply. In this paper, the factor analysis method is used to quantitatively evaluate the hazard of climate change and the vulnerability of the population. The formula for factor analysis is as follows [8]:
where Y is a certain evaluation index, Yi is the ith component, and αi is its corresponding contribution.
In the hazard evaluation, it is also necessary to use the entropy weight method to determine the objective weight of temperature variations, precipitation variations, and wind speed variations to the integrated hazard. The process is not elaborated in the paper, and the result is as follows:
where H is the integrated hazard index, Hi is the hazards of sub-system variations, and wi is the corresponding weight [69].
Cluster Analysis
Cluster analysis is a multivariate statistical analysis method that can classify indicators or samples without any prior knowledge. After assessing the population risk, we used Q-type cluster analysis to classify the counties and determine the characteristics of risk over the TP. In the process of clustering, the system continues to merge two types of counties with similar attributes into a new class and calculate the similarity between the new class and other categories until all counties are merged into a specified number of categories [70]. The process is not described in detail. The purpose of which is to provide a basis for summarizing the rules among risk factors.
3. Results
3.1. Hazard Assessment
According to the definition of climate change hazard, the temperature, precipitation, and wind speed were selected as the factors to characterize the variations of the climate system, because it is impossible to include all the factors into the climate change hazard assessment, and it is necessary to take into account the patterns and degrees of disturbance and harm caused by different factors to the population. From the three dimensions of trend change, fluctuation change, and extreme change, 14 indicators were selected to build an index system for a comprehensive evaluation of the climate change hazard (Table 1) [61,62,63]. Each indicator is a single value during the study period, but it represents the variations within the study period, so the underlying meaning is not static. The trend change reflects the continuous variation tendency and direction of climate factors, and the fluctuation change characterizes the volatility and stability in the tendency of climate factors, which together constitute the slow-onset hazard. The extreme change represents the sudden-onset hazard, which directly causes disasters, and was comprehensively quantified in terms of frequency and intensity of occurrence.

Table 1.
The index system of climate change hazard assessment over the TP [61,62,63].
Firstly, the hazards of three sub-systems were evaluated by factor analysis. On this basis, the entropy weight method was used to determine the weight of each subsystem. Finally, the hazard of climate change over the TP was quantified comprehensively. The evaluation models were as follows:
where A, B, and C were the hazard indexes of temperature, precipitation, and wind speed variations, respectively, and Xn was the normalized value of the variables. HI was the climate change hazard index, which comprehensively represents the likelihood and degree of the population loss and damage caused by climate change. It is a relative value—the greater the value, the greater the hazard probability—rather than directly telling us the number of times that hazards have occurred or would occur. The HI of each county was graded into 5 levels: slight, light, medium, heavy, and very heavy.
The largest number of counties had medium hazard, accounting for 32.23% of the total counties, and the countries with heavy hazard accounted for 30.81% (Table 2). Counties with light, slight, and very heavy hazard were relatively few. In terms of land area, 43.75% of the total area were in the heavy hazard level, while 20.85% and 21.95% area were in the medium and very heavy hazard level, respectively. The land area of slight and light hazard level was small. Overall, the climate change hazard was predominantly in the medium and heavy levels, accounting for 63.04% of the counties and 64.60% of the land area over the TP.
Table 2.
Classification and percentage of climate change hazard over the TP.
There were obvious spatial differences in the climate change hazard over the TP (Figure 2). On the whole, the hazard in the west of the TP was higher than that in the east, and the hazard in the north was higher than that in the south. Specifically, the very heavy hazard areas were mainly distributed in the northern part of the TP and the central part of the Himalayas. The area of heavy-level counties was wide, mainly distributed in the Ngari and Nagqu regions of Tibet, southern Xinjiang, and the Three-River Headwaters Region. The counties with medium hazard were relatively scattered, mainly in the central and northeast of Qinghai, the southwest of Xinjiang, Northwest Yunnan, and parts of Northwestern Sichuan. The distribution of slight and light hazard counties was concentrated, located in the west of Sichuan and the eastern part of Tibet.
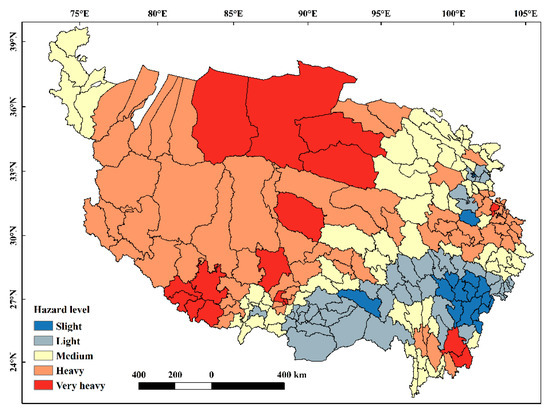
Figure 2.
The spatial distribution of the climate change hazard over the TP.
The contribution weights of air temperature, precipitation, and wind speed changes to the comprehensive hazard were obtained using the entropy weight method. The contribution of temperature change to the hazard was the largest, reaching 48.54%. The contributions of precipitation change and wind speed change were 30.22% and 21.24%, respectively. It can be seen that temperature change was the most important factor of climate change hazard over the TP.
3.2. Population Exposure Assessment
Population exposure refers to the presence of people in places that could be adversely affected by climate change [8,61,71], which is a necessary condition for the existence of risk. Referring to the previous research, the population density was selected as the evaluation index of population exposure [8,51,71,72]. To prevent data fluctuation, the average values of 1990–2015 were taken and standardized, and the population exposure index (EI) in each county was obtained and was also divided into 5 levels. The higher the level, the greater the magnitude of the population exposed to the adverse impact and the greater the potential loss.
The land area of the slight exposure level was the largest, accounting for more than half of the total area, while the land areas of light, medium, heavy, and very heavy levels decreased in turn. In terms of counties, the counties with light exposure were the most, followed by medium-level counties, and their proportions were much higher than other levels, while the number of counties with very heavy exposure was the least (Table 3). On the whole, the population over the TP was less exposed to climate change. The number of counties with slight- and light-level exposure accounted for 49.74%, and they accounted for 83.94% of the land area. The number of counties with very-heavy- and heavy-level exposure accounted for 17.99%, and the proportion of land area was only 2.61%. The number of counties with low-level exposure and the proportion of land area was large, while the number of counties with high-level exposure and the proportion of land area was small.
Table 3.
Classification and percentage of population exposure over the TP.
As shown in Figure 3, the population exposure to climate change generally showed a relatively high level in the eastern margin and low inside the TP. Specifically, the slight exposure areas were mainly distributed in the northwest of the TP, involving the Ngari and Nagqu regions of Tibet, Haixi and Yushu Prefecture of Qinghai, and the Hotan region of Xinjiang. The natural environment in these areas is relatively adverse, and the population is sparse. The light exposure areas were to the east and south of the slight exposure areas, which including most of southern and eastern Tibet, the central and southern areas of Qinghai, and some areas of Western Sichuan. Compared with the slight exposure areas, the natural environment and socio-economic conditions of the light exposure areas are better, and the population density is also relatively higher. The medium exposure areas included Hainan and Huangnan Prefecture of Qinghai, Gannan Prefecture of Gansu, Aba and Ganzi Prefecture of Sichuan, and Lijiang City and Diqing Prefecture of Yunnan, all of which were located in the eastern part of the TP. There were also medium exposure areas distributed in the YSL River Region (the Yarlung Zangbo River, Nyangqu River, and Lhasa River Region) of Tibet. The heavy and very heavy exposure areas were identified between the banded areas in the northeast and east of the TP. These areas were the transition of the TP and other geomorphic units, with low altitude, suitable ecological environment for human survival, and socioeconomic development, involving Zhangye city and Linxia Prefecture of Gansu, Xining and Haidong city of Qinghai, and Chengdu city and Deyang city of Sichuan.
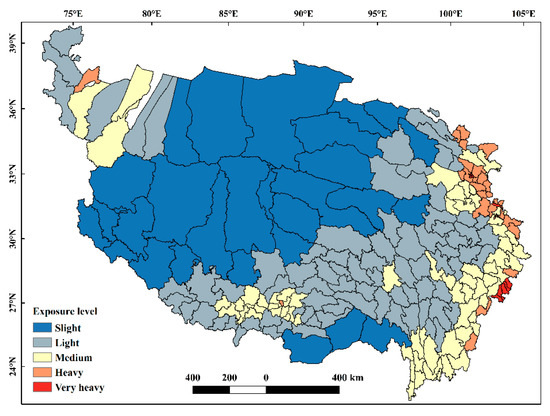
Figure 3.
The spatial distribution of population exposure to climate change over the TP.
3.3. Population Vulnerability Assessment
Population vulnerability, which is an indispensable component of climate change risk assessment, represents the ability of the population system to withstand the interference and damage of climate change. On the basis of reference to the existing relevant research [30,73,74,75,76], considering the population age structure, educational background, employment, and livelihood, four indicators—including the coefficient of the children and the elderly, average schooling years, and non-agricultural population rate—were selected to compute vulnerability index (VI) (Table 4). The higher the coefficient of the children and the elderly, the weaker the population’s physiological resistance to attack and the higher the vulnerability, while the higher the average schooling years and the non-agricultural population rate, the stronger the ability to cope with the interference of climate change and the lower vulnerability.
Table 4.
The index system of population vulnerability assessment over the TP.
The comprehensive assessment model of population vulnerability was obtained by factor analysis as follows:
The population vulnerability index (VI) of each county was calculated and divided into five levels. Under the same hazard and exposure, the higher the level of vulnerability, the more severe the impacts of climate change on the population.
Counties with medium vulnerability accounted for the largest proportion of the total area, followed by counties with light and heavy levels, while counties with slight and very heavy vulnerability had less land area (Table 5). For the number of counties, those of medium- and heavy-level vulnerability were predominant, while counties with other levels were fewer. In general, the population vulnerability to climate change over the TP was dominated by the medium level; however, the number of counties with heavy and very heavy vulnerability also accounted for 46.67%, and the proportion of land area was 28.81%, indicating that some counties with high vulnerability existed locally on the TP, but were contained within small land areas. If the medium level was also included, the number of counties and the land area of relatively high vulnerability levels over the TP accounted for 80.96% and 60.22%, respectively.
Table 5.
Classification and percentage of population vulnerability over the TP.
Spatially, the population vulnerability was high in the eastern margin and northwest of the TP, and lower in the middle and northern regions (Figure 4). Slight-vulnerability areas were located in western and northern Qinghai, and other counties, such as Chengguan District of Lhasa, Sangzhuzi District of Shigatse, and Hezuo City of Gannan, were also in the slight level, and were patchily scattered in different regions of the TP. The light-vulnerability counties were mainly distributed in the contiguous areas of northern Tibet and southern Xinjiang, and a small number were distributed in middle and eastern Qinghai, and also in the western and southeast of Tibet. The counties with medium vulnerability were distributed in the central and western regions of Tibet, eastern Tibet, western Sichuan, and northwestern Yunnan. The heavy and very heavy vulnerability areas were mainly distributed in southwest Xinjiang, the YSL River Region in Tibet, a contiguous area of Northwest Sichuan, Southeast Qinghai, and southern Gansu, as well as a few counties in the west of Sichuan and Northwest Yunnan.
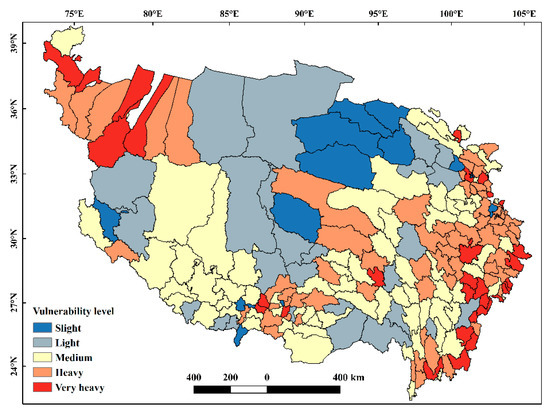
Figure 4.
The spatial distribution of population vulnerability over the TP.
The weight analysis of the four indicators showed that the proportion of the non-agricultural population had the greatest impact on population vulnerability, accounting for 33.82%, followed by the population average schooling years, accounting for 28.42%. The contributions of the coefficient of the children and the elderly were relatively low, accounting for 21.05% and 16.71%, respectively. Therefore, the non-agricultural population rate was the key factor affecting the population vulnerability to climate change over the TP.
3.4. Assessment on Population Risk to Climate Change
3.4.1. Classification of Population Risk
Based on the assessment results of hazard, population exposure, and vulnerability, the population risk index (RI) to climate change was calculated using the conceptual model (Equation (11)). This was also classified into five degrees: slight, light, medium, heavy, and very heavy. The number and percentage of counties, land areas, and population in each risk level are presented in Table 6 and Table 7.
Table 6.
Classification and percentage of population risk over the TP.
Table 7.
The percentage of population in different risk levels over the TP in different periods.
The land areas among risk levels varied considerably. The slight-risk areas accounted for more than half of the total area over the TP, and the land area decreased with the increment of the risk level (Table 6). In quantity, the number of medium-risk counties was the largest, accounting for a third of the total counties. The light-risk counties took second place, accounting for 29.52%, while the counties with other risk levels accounted for less. In terms of population scale, the proportions of the population in slight and light risk accounted for 5.82% and 18.62%, respectively, and the proportions of the heavy and very heavy-risk population accounted for 36.69% and 4.72%, respectively.
The comprehensive analysis revealed that the population risk to climate change was generally low, with the number of counties and area of lands with slight and light risk accounting for 42.38% and 74.52%, respectively, over the TP (Table 7). The number of counties with heavy and very heavy risk only accounted for 24.29%, and the proportion of land area was less than 5%. However, 41.41% of the population was concentrated in less than 5% of the land area, which indicated that although the overall population risk over the TP was relatively low, there was high risk in some areas due to the population concentration, with a disharmony of land and population distribution.
3.4.2. Spatial Pattern of Population Risk
Figure 5 displays the distribution of population risk, clearly indicating that spatial differentiation of risk was obviously significant over the TP. In general, the population risk represented the pattern of a high degree in the eastern edge of the TP and a low degree in the inner region. Specifically, slight-risk areas were concentrated in the central and western part of the TP, involving the counties of the Ngari and Nagqu region in Tibet, the Haixi and Yushu Prefecture in Qinghai, and Hotan region in Southern Xinjiang, with vast land and sparse population. Light-risk areas were mainly located in the periphery of slight-risk areas, involving counties in southern and eastern Tibet, central and southern Qinghai, and western Sichuan, as well as sporadically located in Xinjiang and Gansu. The medium-risk areas were distributed among all six provinces (or autonomous regions) of the TP, which were mostly situated between the light- and heavy-risk areas in the eastern and southern parts of the Plateau, while the rest were contiguously located in the northwest of the Plateau. Counties with heavy and very heavy risk were identified on the eastern edge of the Plateau, and distributed in a strip from north to south, covering eastern Qinghai, southern Gansu, central and western Sichuan, and northwestern Yunnan. There were also the heavy-risk counties of Lhasa in Tibet and Kashgar in Xinjiang.
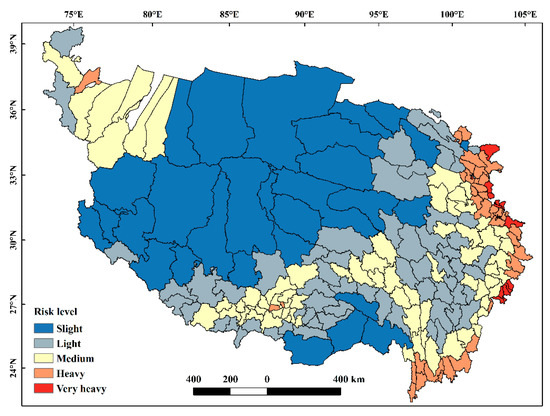
Figure 5.
The spatial distribution of population risk to climate change over the TP.
Given the time scale, it should be noted that the risk level and spatial pattern was not just the current status. Although the spatiotemporal evolution of the risk cannot be presented, since the analysis of the hazard, population exposure, and vulnerability implied long-term changes rather than interdecadal changes, the stable risk pattern still has potential applicability in the future. This is one of the reasons why this integrated risk is beneficial to the development of risk mitigation strategies.
3.4.3. Key Controlling Factors of Population Risk
Pearson correlation analysis was used to reveal the relationship between population risk and its influencing factors, and the results showed that the hazard, population exposure, and vulnerability were negatively correlated (Table 8). The correlation coefficient between hazard and exposure was −0.383, which indicated that the hazard was reversely correlated with the population exposure. In counties with high hazard, the population exposure was generally low, and vice versa. There was also a negative correlation between population exposure and vulnerability. In most cases over the TP, counties with poor natural conditions and weak socio-economic development had high population vulnerability, but low population density and low exposure. Population risk had a significant positive correlation with population exposure and vulnerability, and the correlation coefficients were 0.355 and 0.244, respectively, indicating that the ability of hazard to influence population risk was weak. The level of population risk mainly hinged on the degree of population exposure and vulnerability to climate change.
Table 8.
Correlations among hazard, exposure, vulnerability, and risk over the TP.
In order to further analyze the impact of factors on population risk, Q-type cluster analysis was used to classify counties. Binary variables were used to express the factors. The hazard, exposure, vulnerability, and risk of slight and light levels were assigned to 0 and defined as low level, while medium, heavy, and very heavy levels were assigned to 1 and defined as high level. After comparing the different results and combining them with the actual situation, the counties were finally divided into four types. The characteristics and number of counties of each type are shown in Table 9. The most common of the type-1 counties was “high-exposure”, and 81.08% of the counties were of high risk level, which indicated that high population exposure often accompanied high population risk. The type-2 counties were characterized by a “high-hazard, high-exposure, high-vulnerability” combination, all of which were of high risk level. The type-3 and type-4 counties were presented as “high-hazard” and “high-vulnerability”, respectively, and the proportion of high-risk counties was only 28.92% and 7.69%, respectively. We can see that high hazard or high vulnerability alone does not necessarily lead to high population risk, while high exposure might be the key controlling factor of high population risk to climate change over the TP. Several studies have found that the factors that played a controlling role in determining the risk to climate change were different. Our study found that the spatial variation of the population exposure over the TP was much significant than the spatial variation of the hazard and vulnerability, and the population exposure has a greater impact on risk, which agrees with some existing studies on the TP or other areas [52,71]. Nevertheless, this may not be a universal rule, and the key factor of specific risk in different regions requires analysis on a case-by-case basis.
Table 9.
The results of cluster analysis of population risk to climate change over the TP.
4. Conclusions and Discussion
There emerged a significant climate change over the TP during the past decades. More and more serious impacts induced by the changes were threatening the safety and health of the population on the TP. A study on population risk to climate change would be helpful to improve the cognition of risk and provide a basis and support for local risk prevention. This research first evaluated the climate change hazards including trend, fluctuation, and extreme changes of air temperature, precipitation, and wind speed, then the population exposure and population vulnerability over the TP. Finally, the population risk to climate change was quantitatively assessed by using the risk conceptual model. The spatial pattern of population risk was demonstrated, and the key controlling factor of population risk was found. The following conclusions can be drawn from the results.
The hazard of climate change over the TP was mainly at medium and heavy levels, and the area of counties with medium and heavy hazards accounted for 64.60% of the total area. Spatially, the hazard was higher in the western than in the eastern TP, and higher in the northern than in the southern regions. The change in temperature was the major factor influencing climate change hazard, and its contribution reached 48.54%.
Over the TP, the population exposure to climate change was generally low, and the land area at slight and light exposure levels accounted for 83.94%. The population exposure showed a relatively high level in the eastern margin and low levels inside the TP, for which the counties in Xining city and Western Sichuan were the highest.
The population vulnerability over the TP was mostly in the medium and heavy levels. Spatially, the vulnerability of the eastern margin and northwest of the TP was relatively high, and in the central and northern parts it was low. The non-agricultural population rate was the key factor affecting the population vulnerability over the Plateau, and its contribution reached 33.82%.
The population risk over the TP was the combination of the above-mentioned climate change hazard, population exposure, and vulnerability, and was generally low over the past decades. However, only 24.44% of the population was distributed in the low-risk areas, with 74.52% of the total area. On the contrary, 41.41% of the population was concentrated in the very-heavy- and heavy-risk areas, with less than 5% of the land area. The population risk to climate change was high in the eastern edge area and low in the inner region of the TP. The population risk was the slightest in the contiguous regions of Western Tibet and southern Xinjiang, and the heaviest risk was in counties of Linxia Prefecture in Gansu and western counties of Chengdu and Deyang in Sichuan. Among the three elements of hazard, population exposure, and vulnerability, population exposure was the decisive factor of the population risk to climate change.
The assessment on population risk to climate change is still in the exploratory stage, the theoretical basis and methods are still not perfect, and many deficiencies must be further studied. For example, the meteorological station data in this research has better time continuity, but the reanalysis dataset has stronger spatial continuity. The combination method of observation and simulation in future research is a powerful approach to solve the sparsity of stations on the TP and reduce the uncertainty of hazard assessment. The population data was obtained by on-site collecting, which improved the availability of data in Tibet and other data shortage areas and ensured the credibility of the results. However, the slow development of statistical work and the scarcity of statistical item settings affected the population vulnerability assessment to a great extent, which led to the connotation of vulnerability not being fully demonstrated. In future studies, we need to speed up the construction of the socioeconomic database and supplement other factors that determine the population vulnerability. In addition, this research comprehensively analyzed the current risk, which has laid a solid foundation for risk prejudgment, but far from enough. Using RCPs (representative concentration pathways) and SSPs (shared socioeconomic pathways) scenarios to project and evaluate the spatiotemporal pattern and evolution of risk in the medium- and long-term of this century is the important direction in climate change research.
The ultimate goal of the risk assessment is to develop appropriate mitigation strategies. From the results in this paper, three policy suggestions that may be useful in risk management and adaptation over the TP can be presented. (1) Strengthen meteorological observation, establish a satellite-aerial-ground-based dynamic observation system, broaden the scope of meteorological services, and enhance the cognition level and predicting ability of climate change over the TP. (2) Establish a disaster prevention and mitigation warning system for special environmental areas with the consideration of extreme events, and improve the existing emergency management system. (3) Intensify education of risk, increase the diversity of residents’ livelihood, amplify the social service network, and improve risk-coping ability.
Author Contributions
Conceptualization and methodology, J.Y. and Q.J.; data resources and curation, Q.J., H.C. and Q.H.; analysis, J.Y., Q.J. and Z.S.; visualization, Q.J., Q.D. and Y.L.; writing—original draft preparation, Q.J.; writing—review and editing, J.Y. and C.W.; funding acquisition, J.Y. and C.W. All authors have read and agreed to the published version of the manuscript.
Funding
This research was funded by the National Key Research and Development Program of China (No. 2016YFA0602404, No. 2017YFA0603602).
Institutional Review Board Statement
Not applicable.
Informed Consent Statement
Not applicable.
Data Availability Statement
The data presented in this study are available on request from the corresponding author.
Conflicts of Interest
The authors declare no conflict of interest.
References
- The Intergovernmental Panel on Climate Change. Climate Change 2013: The Physical Science Basis; Contribution of Working Group I to the Fifth Assessment Report of the Intergovernmental Panel on Climate Change; Cambridge University Press: Cambridge, UK, 2013. [Google Scholar]
- Allen, M.R.; Ingram, W.J. Constraints on future changes in climate and the hydrologic cycle. Nat. Cell Biol. 2002, 419, 228–232. [Google Scholar] [CrossRef] [PubMed]
- Myhre, G.; Samset, B.H.; Hodnebrog, Ø.; Andrews, T.; Boucher, O.; Faluvegi, G.; Fläschner, D.; Forster, P.M.; Kasoar, M.; Kharin, V.; et al. Sensible heat has significantly affected the global hydrological cycle over the historical period. Nat. Commun. 2018, 9, 1922. [Google Scholar] [CrossRef] [PubMed]
- The Intergovernmental Panel on Climate Change. Climate Change 2007: Impacts, Adaptation, and Vulnerability; Summary for Policymakers; Report of Working Group II of the Intergovernmental Panel on Climate Change; Cambridge University Press: Cambridge, UK, 2007. [Google Scholar]
- Editing Commission of the Third National Report on Climate Change of China. The Third National Report on Climate Change; Science Press: Beijing, China, 2015. [Google Scholar]
- Zhao, R.; Wang, H.; Zhan, C.; Hu, S.; Ma, M.; Dong, Y. Comparative analysis of probability distributions for the Standardized Precipitation Index and drought evolution in China during 1961–2015. Theor. Appl. Clim. 2019, 139, 1363–1377. [Google Scholar] [CrossRef]
- Huang, J.; Liu, F.; Xue, Y.; Sun, S. The spatial and temporal analysis of precipitation concentration and dry spell in Qinghai, northwest China. Stoch. Environ. Res. Risk Assess. 2015, 29, 1403–1411. [Google Scholar] [CrossRef]
- Yang, J.; Li, M.; Tan, C.; Chen, H.; Ji, Q. Vulnerability and adaptation of an oasis social-ecological system affected by glacier change in an arid region of northwestern China. Sci. Cold Arid Regions 2019, 11, 29–40. [Google Scholar] [CrossRef]
- Burke, M.; Hsiang, S.M.; Miguel, E. Global non-linear effect of temperature on economic production. Nat. Cell Biol. 2015, 527, 235–239. [Google Scholar] [CrossRef]
- Hsiang, S.; Kopp, R.; Jina, A.; Rising, J.; Delgado, M.; Mohan, S.; Rasmussen, D.J.; Muir-Wood, R.; Wilson, P.; Oppenheimer, M.; et al. Estimating economic damage from climate change in the United States. Science 2017, 356, 1362–1369. [Google Scholar] [CrossRef] [PubMed]
- Van Valkengoed, A.M.; Steg, L. Meta-analyses of factors motivating climate change adaptation behaviour. Nat. Clim. Chang. 2019, 9, 158–163. [Google Scholar] [CrossRef]
- Adamson, G.C.; Hannaford, M.J.; Rohland, E.J. Re-thinking the present: The role of a historical focus in climate change adaptation research. Glob. Environ. Chang. 2018, 48, 195–205. [Google Scholar] [CrossRef]
- Wen, J.H.; Huang, H.; Chen, K.; Ye, X.L.; Hu, H.Z.; Hua, Z.Y. Probabilistic Community-based Typhoon Disaster Risk Assessment: A case of Fululi Community, Shanghai. Sci. Geogr. Sin. 2012, 32, 348–355. (In Chinese) [Google Scholar]
- Moser, S.C.; Ekstrom, J.A. A framework to diagnose barriers to climate change adaptation. Proc. Natl. Acad. Sci. USA 2010, 107, 22026–22031. [Google Scholar] [CrossRef] [PubMed]
- Tajima, Y.; Yasuda, T.; Pacheco, B.M.; Cruz, E.C.; Kawasaki, K.; Nobuoka, H.; Miyamoto, M.; Asano, Y.; Arikawa, T.; Ortigas, N.M.; et al. Initial Report of JSCE-PICE Joint Survey on the Storm Surge Disaster Caused by Typhoon Haiyan. Coast. Eng. J. 2014, 56, 1450006. [Google Scholar] [CrossRef]
- Rodó, X.; Pascual, M.; Fuchs, G.; Faruque, A.S.G. ENSO and cholera: A nonstationary link related to climate change? Proc. Natl. Acad. Sci. USA 2002, 99, 12901–12906. [Google Scholar] [CrossRef] [PubMed]
- Watts, N.; Adger, W.N.; Agnolucci, P.; Blackstock, J.; Byass, P.; Cai, W.; Chaytor, S.; Colbourn, T.; Collins, M.; Cooper, A.; et al. Health and climate change: Policy responses to protect public health. Lancet 2015, 386, 1861–1914. [Google Scholar] [CrossRef]
- Cameron, M.P. Climate change, internal migration, and the future spatial distribution of population: A case study of New Zealand. Popul. Environ. 2017, 39, 239–260. [Google Scholar] [CrossRef]
- Chindarkar, N. Gender and climate change-induced migration: Proposing a framework for analysis. Environ. Res. Lett. 2012, 7, 025601. [Google Scholar] [CrossRef]
- Sakaguchi, K.; Varughese, A.; Auld, G. Climate Wars? A Systematic Review of Empirical Analyses on the Links between Climate Change and Violent Conflict. Int. Stud. Rev. 2017, 19, 622–645. [Google Scholar] [CrossRef]
- Jäger, J.; Ferguson, H.L. Climate Change: Science, Impacts and Policy; Cambridge University Press: Cambridge, UK, 1991. [Google Scholar]
- Hirabayashi, Y.; Mahendran, R.; Koirala, S.; Konoshima, L.; Yamazaki, D.; Watanabe, S.; Kim, H.; Kanae, S. Global flood risk under climate change. Nat. Clim. Chang. 2013, 3, 816–821. [Google Scholar] [CrossRef]
- Urban, M.C. Accelerating extinction risk from climate change. Science 2015, 348, 571–573. [Google Scholar] [CrossRef]
- The World Bank. Managing Climate Risk: Integrating Adaptation into World Bank Group Operations; The World Bank: Washington, DC, USA, 2006. [Google Scholar]
- Food and Agriculture Organization of the United Nations. Climate Change and Food Security: Risks and Responses; FAO: Rome, Italy, 2016. [Google Scholar]
- The Intergovernmental Panel on Climate Change. Climate Change 2014; Working Group II Contribution to the Fifth Assessment Report of the Intergovernmental Panel on Climate Change; Cambridge University Press: Cambridge, UK, 2014. [Google Scholar]
- Agrawal, S.; Gopalakrishnan, T.; Gorokhovich, Y.; Doocy, S. Risk Factors for Injuries in Landslide- and Flood-Affected Populations in Uganda. Prehosp. Disaster Med. 2013, 28, 314–321. [Google Scholar] [CrossRef]
- Jadot, J.; Gemon, C.; Richard, I.; Bauduceau, N. Does flood risk information held within at risk population always have a positive impact? An evaluation of the effects of French regulatory tools in Orleans. In Proceedings of the 3rd European Conference on Flood Risk Management (FLOODrisk 2016), E3S Web of Conferences, Lyon, France, 17–21 October 2016; Volume 7, p. 15002. [Google Scholar]
- Dias, M.C.D.A.; Saito, S.M.; Alvalá, R.C.D.S.; Stenner, C.; Pinho, G.; Nobre, C.A.; Fonseca, M.R.D.S.; Santos, C.; Amadeu, P.; Silva, D.; et al. Estimation of exposed population to landslides and floods risk areas in Brazil, on an intra-urban scale. Int. J. Disaster Risk Reduct. 2018, 31, 449–459. [Google Scholar] [CrossRef]
- Harlan, S.L.; Brazel, A.J.; Prashad, L.; Stefanov, W.L.; Larsen, L. Neighborhood microclimates and vulnerability to heat stress. Soc. Sci. Med. 2006, 63, 2847–2863. [Google Scholar] [CrossRef] [PubMed]
- Tan, J.; Zheng, Y.; Song, G.; Kalkstein, L.S.; Kalkstein, A.J.; Tang, X. Heat wave impacts on mortality in Shanghai, 1998 and 2003. Int. J. Biometeorol. 2006, 51, 193–200. [Google Scholar] [CrossRef]
- Tomlinson, C.J.; Chapman, L.; E Thornes, J.; Baker, C.J. Including the urban heat island in spatial heat health risk assessment strategies: A case study for Birmingham, UK. Int. J. Health Geogr. 2011, 10, 42. [Google Scholar] [CrossRef] [PubMed]
- Wu, S.; Jiangbo, G.; HaoYu, D.; Lulu, L.; Tao, P. Climate change risk and methodology for its quantitative assessment. Progress Geogr. 2018, 37, 28–35. [Google Scholar] [CrossRef]
- Immerzeel, W.W.; Van Beek, L.P.H.; Bierkens, M.F.P. Climate change will affect the Asian Water Towers. Science 2010, 328, 1382–1385. [Google Scholar] [CrossRef] [PubMed]
- Liu, Z.; Yang, M.; Wan, G.; Wang, X. The Spatial and Temporal Variation of Temperature in the Qinghai-Xizang (Tibetan) Plateau during 1971–2015. Atmosphere 2017, 8, 214. [Google Scholar] [CrossRef]
- Qin, J.; Jianping, Y.; Hongju, C. Comprehensive analysis of the precipitation changes over the Tibetan Plateau during 1961–2015. J. Glaciol. Geocryol. 2018, 40, 1090–1099. (In Chinese) [Google Scholar] [CrossRef]
- Cuo, L.; Zhang, Y.; Wang, Q.; Zhang, L.; Zhou, B.; Hao, Z.; Su, F. Climate Change on the Northern Tibetan Plateau during 1957–2009: Spatial Patterns and Possible Mechanisms. J. Clim. 2013, 26, 85–109. [Google Scholar] [CrossRef]
- Yao, T.; Wu, F.; Ding, L.; Sun, J.; Zhu, L.; Piao, S.; Deng, T.; Ni, X.; Zheng, H.; Ouyang, H. Multispherical interactions and their effects on the Tibetan Plateau’s earth system: A review of the recent researches. Natl. Sci. Rev. 2015, 2, 468–488. [Google Scholar] [CrossRef]
- Yao, T.; Thompson, L.; Yang, W.; Yu, W.; Gao, Y.; Guo, X.; Yang, X.; Duan, K.; Zhao, H.; Xu, B.; et al. Different glacier status with atmospheric circulations in Tibetan Plateau and surroundings. Nat. Clim. Chang. 2012, 2, 663–667. [Google Scholar] [CrossRef]
- Yang, J.; Tan, C.; Zhang, T. Spatial and temporal variations in air temperature and precipitation in the Chinese Himalayas during the 1971–2007. Int. J. Clim. 2013, 33, 2622–2632. [Google Scholar] [CrossRef]
- Ying, C.; Dongliang, L.; Maocang, T. Decadal temperature changes over Qinghai-Xizang Plateau in recent 50 years. Plateau Meteorol. 2003, 22, 464–471. (In Chinese) [Google Scholar]
- Yi, X.; Li, G.; Yin, Y. Temperature variation and abrupt change analysis in the Three-River Headwaters Region during 1961–2010. J. Geogr. Sci. 2012, 22, 451–469. [Google Scholar] [CrossRef]
- Chongyi, E.; Guangliang, H.; Chengyong, W. The analysis on air temperature variation characteristic in Qaidamu basin (1961–2011) under the background of global warming. J. Arid Land Resour. Environ. 2013, 27, 94–99. (In Chinese) [Google Scholar] [CrossRef]
- Ding, J.; Cuo, L.; Zhang, Y.; Zhu, F. Monthly and annual temperature extremes and their changes on the Tibetan Plateau and its surroundings during 1963–2015. Sci. Rep. 2018, 8, 1–23. [Google Scholar] [CrossRef]
- Wang, S.; Zhang, M.; Wang, B.; Sun, M.; Li, X. Recent changes in daily extremes of temperature and precipitation over the western Tibetan Plateau, 1973–2011. Quat. Int. 2013, 313–314, 110–117. [Google Scholar] [CrossRef]
- You, Q.; Kang, S.; Pepin, N.; Yan, Y. Relationship between trends in temperature extremes and elevation in the eastern and central Tibetan Plateau, 1961–2005. Geophys. Res. Lett. 2008, 35. [Google Scholar] [CrossRef]
- Yin, H.; Sun, Y.; Donat, M.G. Changes in temperature extremes on the Tibetan Plateau and their attribution. Environ. Res. Lett. 2019, 14, 124015. [Google Scholar] [CrossRef]
- Ding, Z.; Wang, Y.; Lu, R. An analysis of changes in temperature extremes in the Three River Headwaters region of the Tibetan Plateau during 1961–2016. Atmos. Res. 2018, 209, 103–114. [Google Scholar] [CrossRef]
- He, S.; Richards, K.; Zhao, Z. Climate extremes in the Kobresia meadow area of the Qinghai-Tibetan Plateau, 1961–2008. Environ. Earth Sci. 2016, 75, 1–15. [Google Scholar] [CrossRef]
- Hongmei, L.; Bingrong, Z.; Hongyan, S. Research on Temporal and Spatial Differentiation and Occurrence Risks of Drought in Qinghai, China. Mt. Res. 2019, 37, 230–239. (In Chinese) [Google Scholar] [CrossRef]
- Ye, T.; Liu, W.; Wu, J.; Li, Y.; Shi, P.; Zhang, Q. Event-based probabilistic risk assessment of livestock snow disasters in the Qinghai–Tibetan Plateau. Nat. Hazards Earth Syst. Sci. 2019, 19, 697–713. [Google Scholar] [CrossRef]
- Chen, Q.; Liu, F.; Chen, R.; Zhao, Z.; Zhang, Y.; Cui, P.; Zheng, D. Trends and risk evolution of drought disasters in Tibet Region, China. J. Geogr. Sci. 2019, 29, 1859–1875. [Google Scholar] [CrossRef]
- Liu, F.; Mao, X.; Zhang, Y. Risk analysis of snow disaster in the pastoral areas of the Qinghai-Tibet Plateau. J. Geogr. Sci. 2014, 24, 411–426. [Google Scholar] [CrossRef]
- Shijin, W.; Lanyue, Z.; Yanqiang, W. Integrated risk assessment of snow disaster over the Qinghai-Tibet Plateau. Geomat. Nat. Hazards Risk 2019, 10, 740–757. [Google Scholar] [CrossRef]
- Ye, T.; Liu, W.; Mu, Q.; Zong, S.; Li, Y.; Shi, P. Quantifying livestock vulnerability to snow disasters in the Tibetan Plateau: Comparing different modeling techniques for prediction. Int. J. Disaster Risk Reduct. 2020, 48, 101578. [Google Scholar] [CrossRef]
- Chou, J.; Xian, T.; Zhao, R.; Xu, Y.; Yang, F.; Sun, M. Drought Risk Assessment and Estimation in Vulnerable Eco-Regions of China: Under the Background of Climate Change. Sustainability 2019, 11, 4463. [Google Scholar] [CrossRef]
- Li, X.; Zhou, W.; Chen, Y.D. Assessment of Regional Drought Trend and Risk over China: A Drought Climate Division Perspective. J. Clim. 2015, 28, 7025–7037. [Google Scholar] [CrossRef]
- Zhang, Y.; Li, B.; Zheng, D. A discussion on the boundary and area of the Tibetan Plateau in China. Geogr. Res. 2002, 1, 1–8. (In Chinese) [Google Scholar]
- Qi, W.; Liu, S.; Zhou, L. Regional differentiation of population in Tibetan Plateau: Insight from the “Hu Line”. Acta Geogr. Sin. 2019, 75, 255–267. (In Chinese) [Google Scholar] [CrossRef]
- Zhang, Y.; Zhang, W.; Bai, W.; Li, S.; Zheng, D. An Analysis of Statistical Data about Tibetan Plateau in China—A Case Study on Population. Progr. Geogr. 2005, 24, 11–20. (In Chinese) [Google Scholar]
- The Intergovernmental Panel on Climate Change. Climate Change 2012: Managing the Risks of Extreme Events and Disasters to Advance Climate Change Adaptation (SREX); Cambridge University Press: Cambridge, UK, 2012. [Google Scholar]
- Shi, P.; Wang, A.; Sun, F.; Li, N.; Ye, T.; Xu, W.; Wang, J. A study of global change population and economic system risk forming mechanism and assessment. Adv. Earth Sci. 2016, 31, 775–781. (In Chinese) [Google Scholar] [CrossRef]
- Shi, P.; Ye, T.; Wang, Y. Disaster risk science: A geographical perspective and a research framework. Int. J. Disaster Risk Sci. 2020, 11, 426–440. [Google Scholar] [CrossRef]
- Hongjun, Z. Did Climate change Affect the social Stability of Chinese Agrarian Economy in the Past 2000 Years? A Positive Analysis Based on Paleo-climatic Reconstruction Data and Historic Data. China Econ. Q. 2012, 11, 691–722. (In Chinese) [Google Scholar] [CrossRef]
- Fang, X.; Sheng, J. Human adaptation to climate change: A case study of changes in paddy planting area in Heilongjiang Province. J. Nat. Res. 2000, 15, 213–217. (In Chinese) [Google Scholar]
- Shi, P.; Sun, S.; Gong, D.; Zhou, T. World Regionalization of Climate Change (1961–2010). Int. J. Disaster Risk Sci. 2016, 7, 216–226. [Google Scholar] [CrossRef]
- Donat, M.G.; Peterson, T.C.; Brunet, M.; King, A.D.; Almazroui, M.; Kolli, R.K.; Boucherf, D.; Al-Mulla, A.Y.; Nour, A.Y.; Aly, A.A.; et al. Changes in extreme temperature and precipitation in the Arab region: Long-Term trends and variability related to ENSO and NAO. Int. J. Climatol. 2014, 34, 581–592. [Google Scholar] [CrossRef]
- Skansi, M.D.L.M.; Brunet, M.; Sigró, J.; Aguilar, E.; Groening, J.A.A.; Bentancur, O.J.; Geier, Y.R.C.; Amaya, R.L.C.; Jácome, H.; Ramos, A.M.; et al. Warming and wetting signals emerging from analysis of changes in climate extreme indices over South America. Glob. Planet. Chang. 2013, 100, 295–307. [Google Scholar] [CrossRef]
- Delgado, A.; Romero, I. Environmental conflict analysis using an integrated grey clustering and entropy-weight method: A case study of a mining project in Peru. Environ. Model. Softw. 2016, 77, 108–121. [Google Scholar] [CrossRef]
- Ahlqvist, E.; Storm, P.; Käräjämäki, A.; Martinell, M.; Dorkhan, M.; Carlsson, A.; Vikman, P.; Prasad, R.B.; Aly, D.M.; Almgren, P.; et al. Novel subgroups of adult-onset diabetes and their association with outcomes: A data-driven cluster analysis of six variables. Lancet Diabetes Endocrinol. 2018, 6, 361–369. [Google Scholar] [CrossRef]
- Liao, X.; Xu, W.; Zhang, J.; Li, Y.; Tian, Y. Global exposure to rainstorms and the contribution rates of climate change and population change. Sci. Total. Environ. 2019, 663, 644–653. [Google Scholar] [CrossRef] [PubMed]
- Zhang, W.; Zhou, T.; Zou, L.; Zhang, L.; Chen, X. Reduced exposure to extreme precipitation from 0.5 °C less warming in global land monsoon regions. Nat. Commun. 2018, 9, 1–8. [Google Scholar] [CrossRef] [PubMed]
- Peduzzi, P.; Dao, Q.-H.; Herold, C.; Mouton, F. Assessing global exposure and vulnerability towards natural hazards: The Disaster Risk Index. Nat. Hazards Earth Syst. Sci. 2009, 9, 1149–1159. [Google Scholar] [CrossRef]
- Schmidtlein, M.C.; Deutsch, R.C.; Piegorsch, W.W.; Cutter, S.L. A Sensitivity Analysis of the Social Vulnerability Index. Risk Anal. 2008, 28, 1099–1114. [Google Scholar] [CrossRef]
- Thornton, P.K.; Ericksen, P.J.; Herrero, M.; Challinor, A.J. Climate variability and vulnerability to climate change: A review. Glob. Chang. Biol. 2014, 20, 3313–3328. [Google Scholar] [CrossRef] [PubMed]
- Wang, W.; Zhou, L.; Yang, G.; Sun, Y.; Chen, Y. Prohibited Grazing Policy Satisfaction and Life Satisfaction in Rural Northwest China—A Case Study in Yanchi County, Ningxia Hui Autonomous Region. Int. J. Environ. Res. Public Health 2019, 16, 4374. [Google Scholar] [CrossRef]
Publisher’s Note: MDPI stays neutral with regard to jurisdictional claims in published maps and institutional affiliations. |
© 2021 by the authors. Licensee MDPI, Basel, Switzerland. This article is an open access article distributed under the terms and conditions of the Creative Commons Attribution (CC BY) license (http://creativecommons.org/licenses/by/4.0/).