Article

Successful Application of Eucalyptus Camdulensis Biochar in the Batch Adsorption of Crystal Violet and Methylene Blue Dyes from Aqueous Solution

by
Muhammad Tahir Amin
1,2,*,
Abdulrahman Ali Alazba
1,3 and
Muhammad Shafiq
1
1
Alamoudi Water Research Chair, King Saud University, P. O. Box 2460, Riyadh 11451, Saudi Arabia
2
Department of Environmental Sciences, Abbottabad Campus, COMSATS University Islamabad, Abbottabad 22060, Pakistan
3
Agricultural Engineering Department, King Saud University, P. O. Box 2460, Riyadh 11451, Saudi Arabia
*
Author to whom correspondence should be addressed.
Sustainability 2021, 13(7), 3600; https://doi.org/10.3390/su13073600
Submission received: 18 February 2021 / Revised: 18 March 2021 / Accepted: 19 March 2021 / Published: 24 March 2021

Abstract

:
Eucalyptus camdulensis biochar (Ec-bio) was used to adsorb crystal violet (CV) and methylene blue (MB) dyes, which was optimized and further evaluated using different isotherm and kinetic models. Microscopy and spectroscopy techniques showed the interactions of the dyes with the surface functional groups of the Ec-bio, resulting in the removal of the dyes from aqueous solution. Both dyes were immediately uptaken, with equilibrium reached in 60 min, with a higher sorption efficiency of CV compared to MB. Thermodynamic parameters showed endothermic adsorption and the nonspontaneous adsorption of both dyes onto the Ec-bio. Both the adsorption capacity and percentage removal increased with the increasing solution pH from 2.0 to 4.0 and to 10 for CV and MB. An increase in adsorption capacity was observed upon increasing the initial concentrations, with a corresponding decrease in the percentage removal. The pseudo-second-order (PSO) and Elovich kinetic models (nonlinear approach) were a good fit to the data of both dyes, confirming a chemisorptive adsorption process. The Langmuir isotherm fitted well to the CV data, supporting its monolayer adsorption onto the Ec-bio, while the Freundlich isotherm was a good fit to the MB dye data, suggesting the surface heterogeneity of the Ec-bio. The Dubinin–Radushkevich isotherm was a good fit to the adsorption CV data compared with the MB dye, suggesting the physisorption of both dyes onto the Ec-bio due to its mean free energy of adsorption of <8 kJ mol−1.

1. Introduction

The exponential growth of the world population as well as the elevated living standards of people have increased global freshwater requirements, subsequently depleting the available global freshwater resources. Due to the limited availability of freshwater, currently 1.1 billion people around the world have no safe drinking water, and this number could rise to multiple times that by 2050 when the world population is estimated to increase to 10 billion [1]. In addition to this issue, huge amounts of organic and inorganic contaminants produced from various industries such as textiles, paint, paper, medical, food, plastic, and leather are being disposed of into bodies of water, subsequently further decreasing the volumes of clean water available worldwide [2]. Dyes constitute the major proportion of these organic and inorganic contaminants in industrial effluents, thus their removal is of critical importance. According to estimates, >280,000 tons of synthetic dyes are being released into bodies of water worldwide, posing a serious threat to the ecosystem [3]. As these are bright colors, they are easily visible to the naked eye, even at low concentrations in water. The presence of dyes and pigments in wastewater poses various environmental concerns owing to the difficulty in their removal [4]. The occurrence of dyes in water not only detracts from the aesthetic nature of freshwater bodies, but also reduces the penetration of sunlight into the water, which in turn affects the process of photosynthesis, consequently leading to the deterioration of aquatic ecosystems [5,6]. Moreover, the chemicals used to manufacture dyes are also harmful, carcinogenic, or even explosive in nature. Thus, the removal of these dyes from industrial effluent streams is of critical importance toward sustainable human and environmental health.
The synthetic and cationic dyes crystal violet (CV) and methylene blue (MB) are among the most abundantly used in the textiles and medical industries worldwide. It has been established that cationic dyes are more toxic and harmful to human beings than ionic dyes [7,8]. Furthermore, it is hard to remove these synthetic dyes (both cationic and anionic) from wastewater effluents due to their complex aromatic structure and synthetic origin. A variety of engineering treatment methods, such as membrane separation [9], coagulation and flocculation [10], electrochemical methods [11], chemical oxidation [12], and adsorption [13] have been exploited to treat colored wastewater of a complex nature. The majority of these wastewater treatment technologies are ineffective for CV and MB removal on a large scale, owing to their higher costs, inefficiency, complexity in operation, and problems in the disposal of the loaded adsorbents in the large quantities of sludge that are produced at the end of the processes. Therefore, among these treatment processes, adsorption is considered as a potential candidate for dye removal due to its effectiveness in terms of ease of operation, comparable lower costs of application compared with the other methods, and environmental safety [14,15,16,17]. Adsorption processes are widely used in the treatment of industrial wastewater to remove various organic and inorganic pollutants, and therefore, they have attracted a great amount of attention from researchers worldwide [18]. A variety of low cost and ecofriendly agricultural-based adsorbent materials have been used in adsorption processes to attract dye molecules and eventually contribute to their removal from wastewater via the creation of chemical and physical linkages. However, the choice of a specific adsorbent for a particular contaminant is a crucial factor to consider.
Over the past few years, researchers have investigated the use of biochar in the treatment of wastewater. Biochar is a highly porous, stable, solid, and carbon-rich material [19] that is produced via the pyrolysis of waste biomass rich in cellulose, hemicellulose, and lignin, under limited/absence of oxygen supply [20,21]. The properties of biochar vary according to the feedstock type, resident time, and pyrolysis temperature used to produce it. Researchers have prepared biochar from various types of biomass waste materials and employed them for the adsorption of a range of organic and inorganic pollutants from industrial wastewater. For instance, biochar produced from husks, cow dung [22], corn cob [23], wheat straw [24], palm kernel fiber [7], and many more materials, have been used for the removal of contaminants from wastewater. The scientific community is now exploring the potential of timber waste-based biochar for the removal of various contaminants from water, owing to its abundant availability and cheapness. For instance, Eucalyptus camdulensis (Ec) tree wood is used abundantly in the preparation of furniture and other products, meaning huge quantities of sawdust waste are produced. Recycling this sawdust to prepare low-cost adsorbents would not only reduce surface pollution, but may also result in the preparation of a material that can be used to remove CV and MB dyes from wastewater streams.
Therefore, the aim in this study was to explore the potential of using EC sawdust-derived biochar (Ec-bio), prepared on a laboratory scale under inert atmosphere at around 800 °C, to remove cationic dyes (CV and MB) from synthetic textile wastewater. The different characteristics of the Ec-bio were studied in terms of the adsorption of CV and MB dyes under different adsorption batch conditions in addition to the characterization of their thermodynamics and adsorption efficiency, which were estimated using different isotherm and kinetic models.

2. Materials and Methods

Ec sawdust, collected from a local area in Riyadh, Saudi Arabia, was washed with tap water in the laboratory and dried out in the open air under sunlight for around a week at an average daily temperature of 35–45 °C. The dried sawdust was then cut into small pieces and crushed to obtain an average particle size of less than 0.5 mm, before the material was further dried in an oven at 70 °C for 3–5 h. The pyrolysis of the oven-dried biomass of the Ec sawdust was performed using a box furnace (Nabertherm, B-150, Lilienthal, Germany) set at a calcination temperature at 800 °C for 3 h and the produced biochar, Ec-bio, was measured as having an average particle size in the range of 50–75 µm. Characterization of the Ec-bio was carried out to gain insight into the surface morphology of the material and to investigate the different chemical groups present on its surface using scanning electron microscopy (SEM), and energy-dispersive X-ray (EDX) and Fourier-transform infrared (FTIR) spectroscopies.
Both cationic dyes, MB (Empirical Formula: C16H18ClN3S.xH2O, Molecular Weight (Mw): 319.85 g mol−1, analytical grade, Merck, Saudi Arabia) and CV (linear Formula: C25H30N3Cl, Mw: 407.98 g mol−1, analytical grade, Merck, Saudi Arabia) were used as model contaminants (adsorbates) in this study. Diluted hydrochloric acid (0.1 M HCl) or sodium hydroxide (0.1 M NaOH) solutions were used to maintain the initial or constant pH of the dye solutions as required, depending upon the conditions of the batch testing.
Deionized distilled water was used to prepare standard stock solutions (1 g L−1) of each dye, which were further diluted to obtain the required suspensions with different initial concentrations of the model dyes. For each batch test, 100 cm3 glass bottles were used for the homogeneous mixing of the Ec-bio and dye solution. These test bottles were kept in a shaker for a predetermined contact time and the mixture, after filtration, was subjected to UV-vis spectroscopy to measure the residual dye concentration. Equations (1) and (2) were used to measure the amount of adsorbed dye on the adsorbent and the percentage removal (R, %), respectively.
q t = ( C o C t )   V / M
R ,   % = ( C o C t ) C o 100
Here, the adsorption capacity, qt (mg g−1) corresponds to the residual dye concentration at any given time, Ct (mg L−1), and the initial dye concentration, Co (mg L−1), in a solution with volume, V (L), containing a known amount of the Ec-bio, M (g). Thus, the equilibrium adsorption capacity, qe (mg g−1), could be calculated corresponding to the dye concentration at equilibrium, Ce (mg L−1), using Equation (1). To avoid any experimental error, all measurements were made at least three times and the average values were taken as the results while error bars were used to show the minimum and maximum measured values (Figures 3–5). The different parameters of the batch experiments were optimized by selecting a suitable contact time in the range of 1–300 min, solution temperature in the range of 30–60 °C, solution pH in the range of 2–10, dose of Ec-bio in the range of 0.1–0.9 g), and initial concentration of the dye in the range of 20–100 mg L−1. To elucidate the adsorption mechanism, the adsorption data was further evaluated using conventional kinetic (pseudo-first-order (PFO), pseudo-second-order (PSO), Elovich, and Weber and Morris intraparticle diffusion (ID–WM)) and two-parameter isotherm (Langmuir, Freundlich, Dubinin–Radushkevich (D–R), Halsey, Temkin, Harkins–Jura (H–J), and Jovanovic) models, as listed in Table 1.

3. Results and Discussion

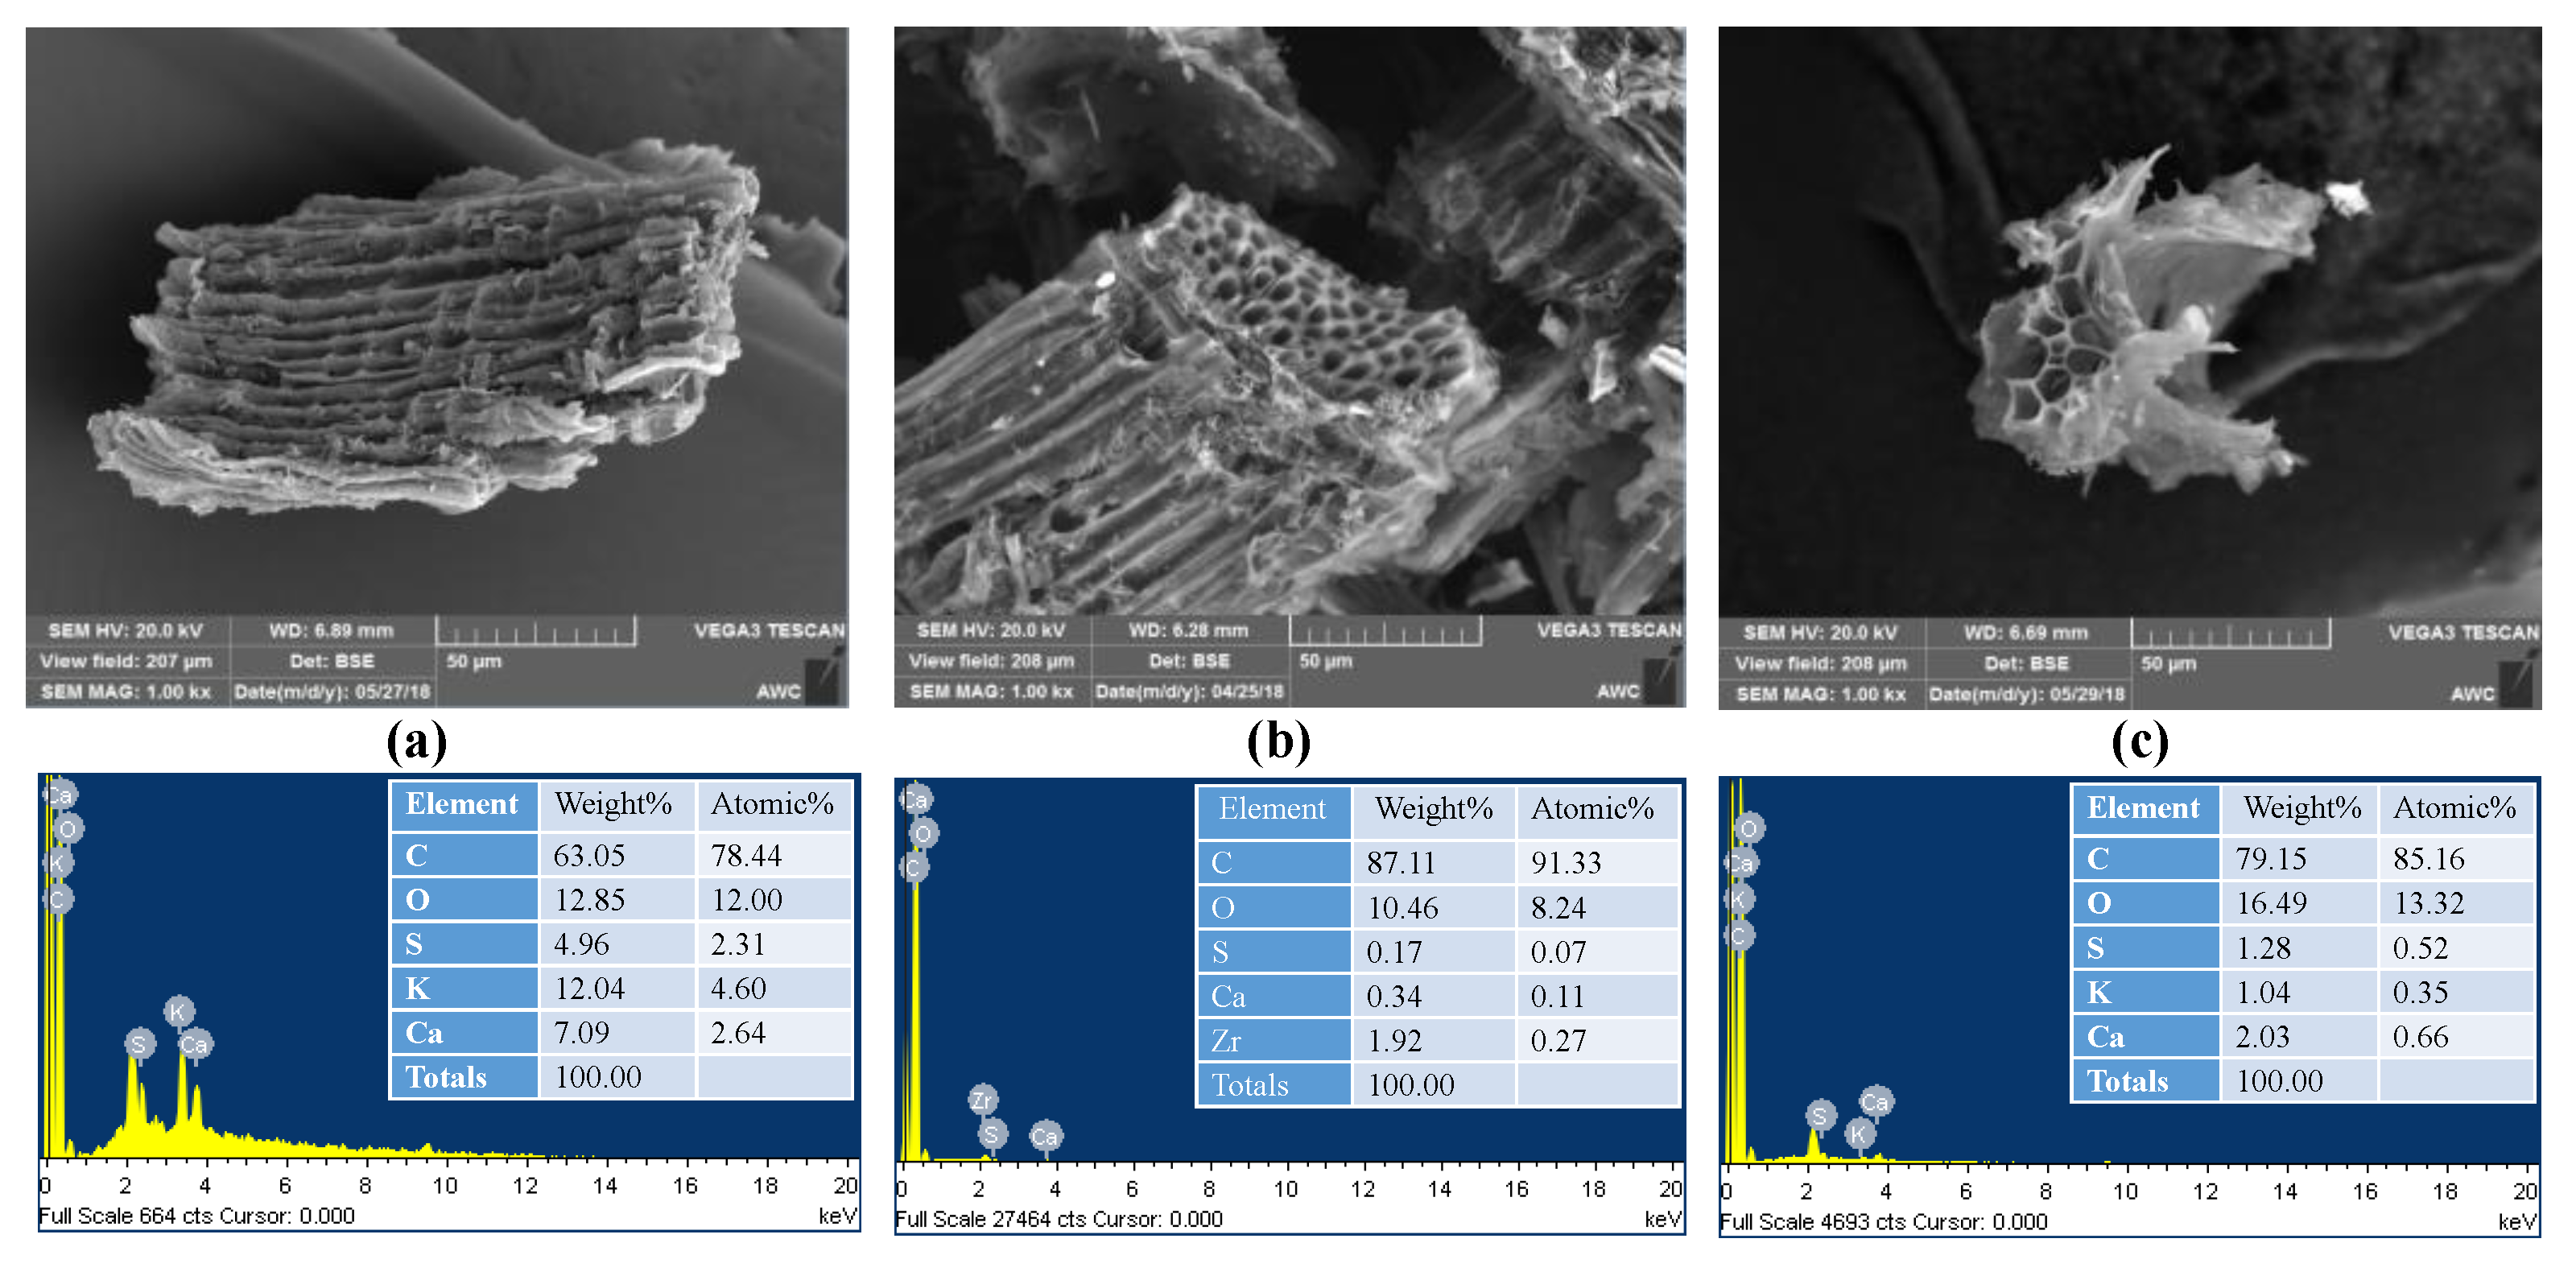
3.1. Characteristics of the Ec-Bio

  • EDX spectroscopy and SEM analyses
The surface morphology of Ec-bio pyrolyzed at 800 °C before and after the adsorption of CV and MB dyes was studied using SEM (VEGA3 TESCAN) equipped with an EDX probe, with which various images were captured at different magnifications at 20 kV. The acquired SEM images along with EDX spectra of the tested adsorbents are presented in Figure 1a–c. Well-organized channels and pores can be seen in pristine biochar (Figure 1a) before the adsorption of either of the dyes. However, the adsorption of CV and MB dyes onto the adsorbent resulted in the appearance of very small aggregations of white particles on the surface, which might be owing to the dye molecules adsorbing into the pores as well as on the porous surface of the adsorbents (Figure 1b,c). The variations in the elemental compositions of the adsorbents are shown in the EDX spectra in Figure 1.
The C content of the pristine Ec-bio material increased from 63.05% to 87.11% and 79.15% after the adsorption of the CV and MB dyes, respectively. This substantial increase in the C content of the adsorbent after dye adsorption is due to the presence of C atoms in both of the dyes. The adsorption of the MB dye resulted in an increase in the O content of the adsorbent to 16.49%, whereas the adsorption of the CV dye resulted in a decrease in the O content to 10.46% compared with that of the pristine Ec-bio material, with a content of 12.85%. The S content decreased from the 4.96% in the pristine Ec-bio to 1.28% upon MB adsorption and 0.17% upon CV adsorption. Therefore, the changes in morphology, as well as the elemental composition of the Ec-bio upon CV and MB dye adsorption suggest physiochemical interactions of the adsorbent with the adsorbates, consequently resulting in the removal of the dyes from contaminated aqueous solutions.
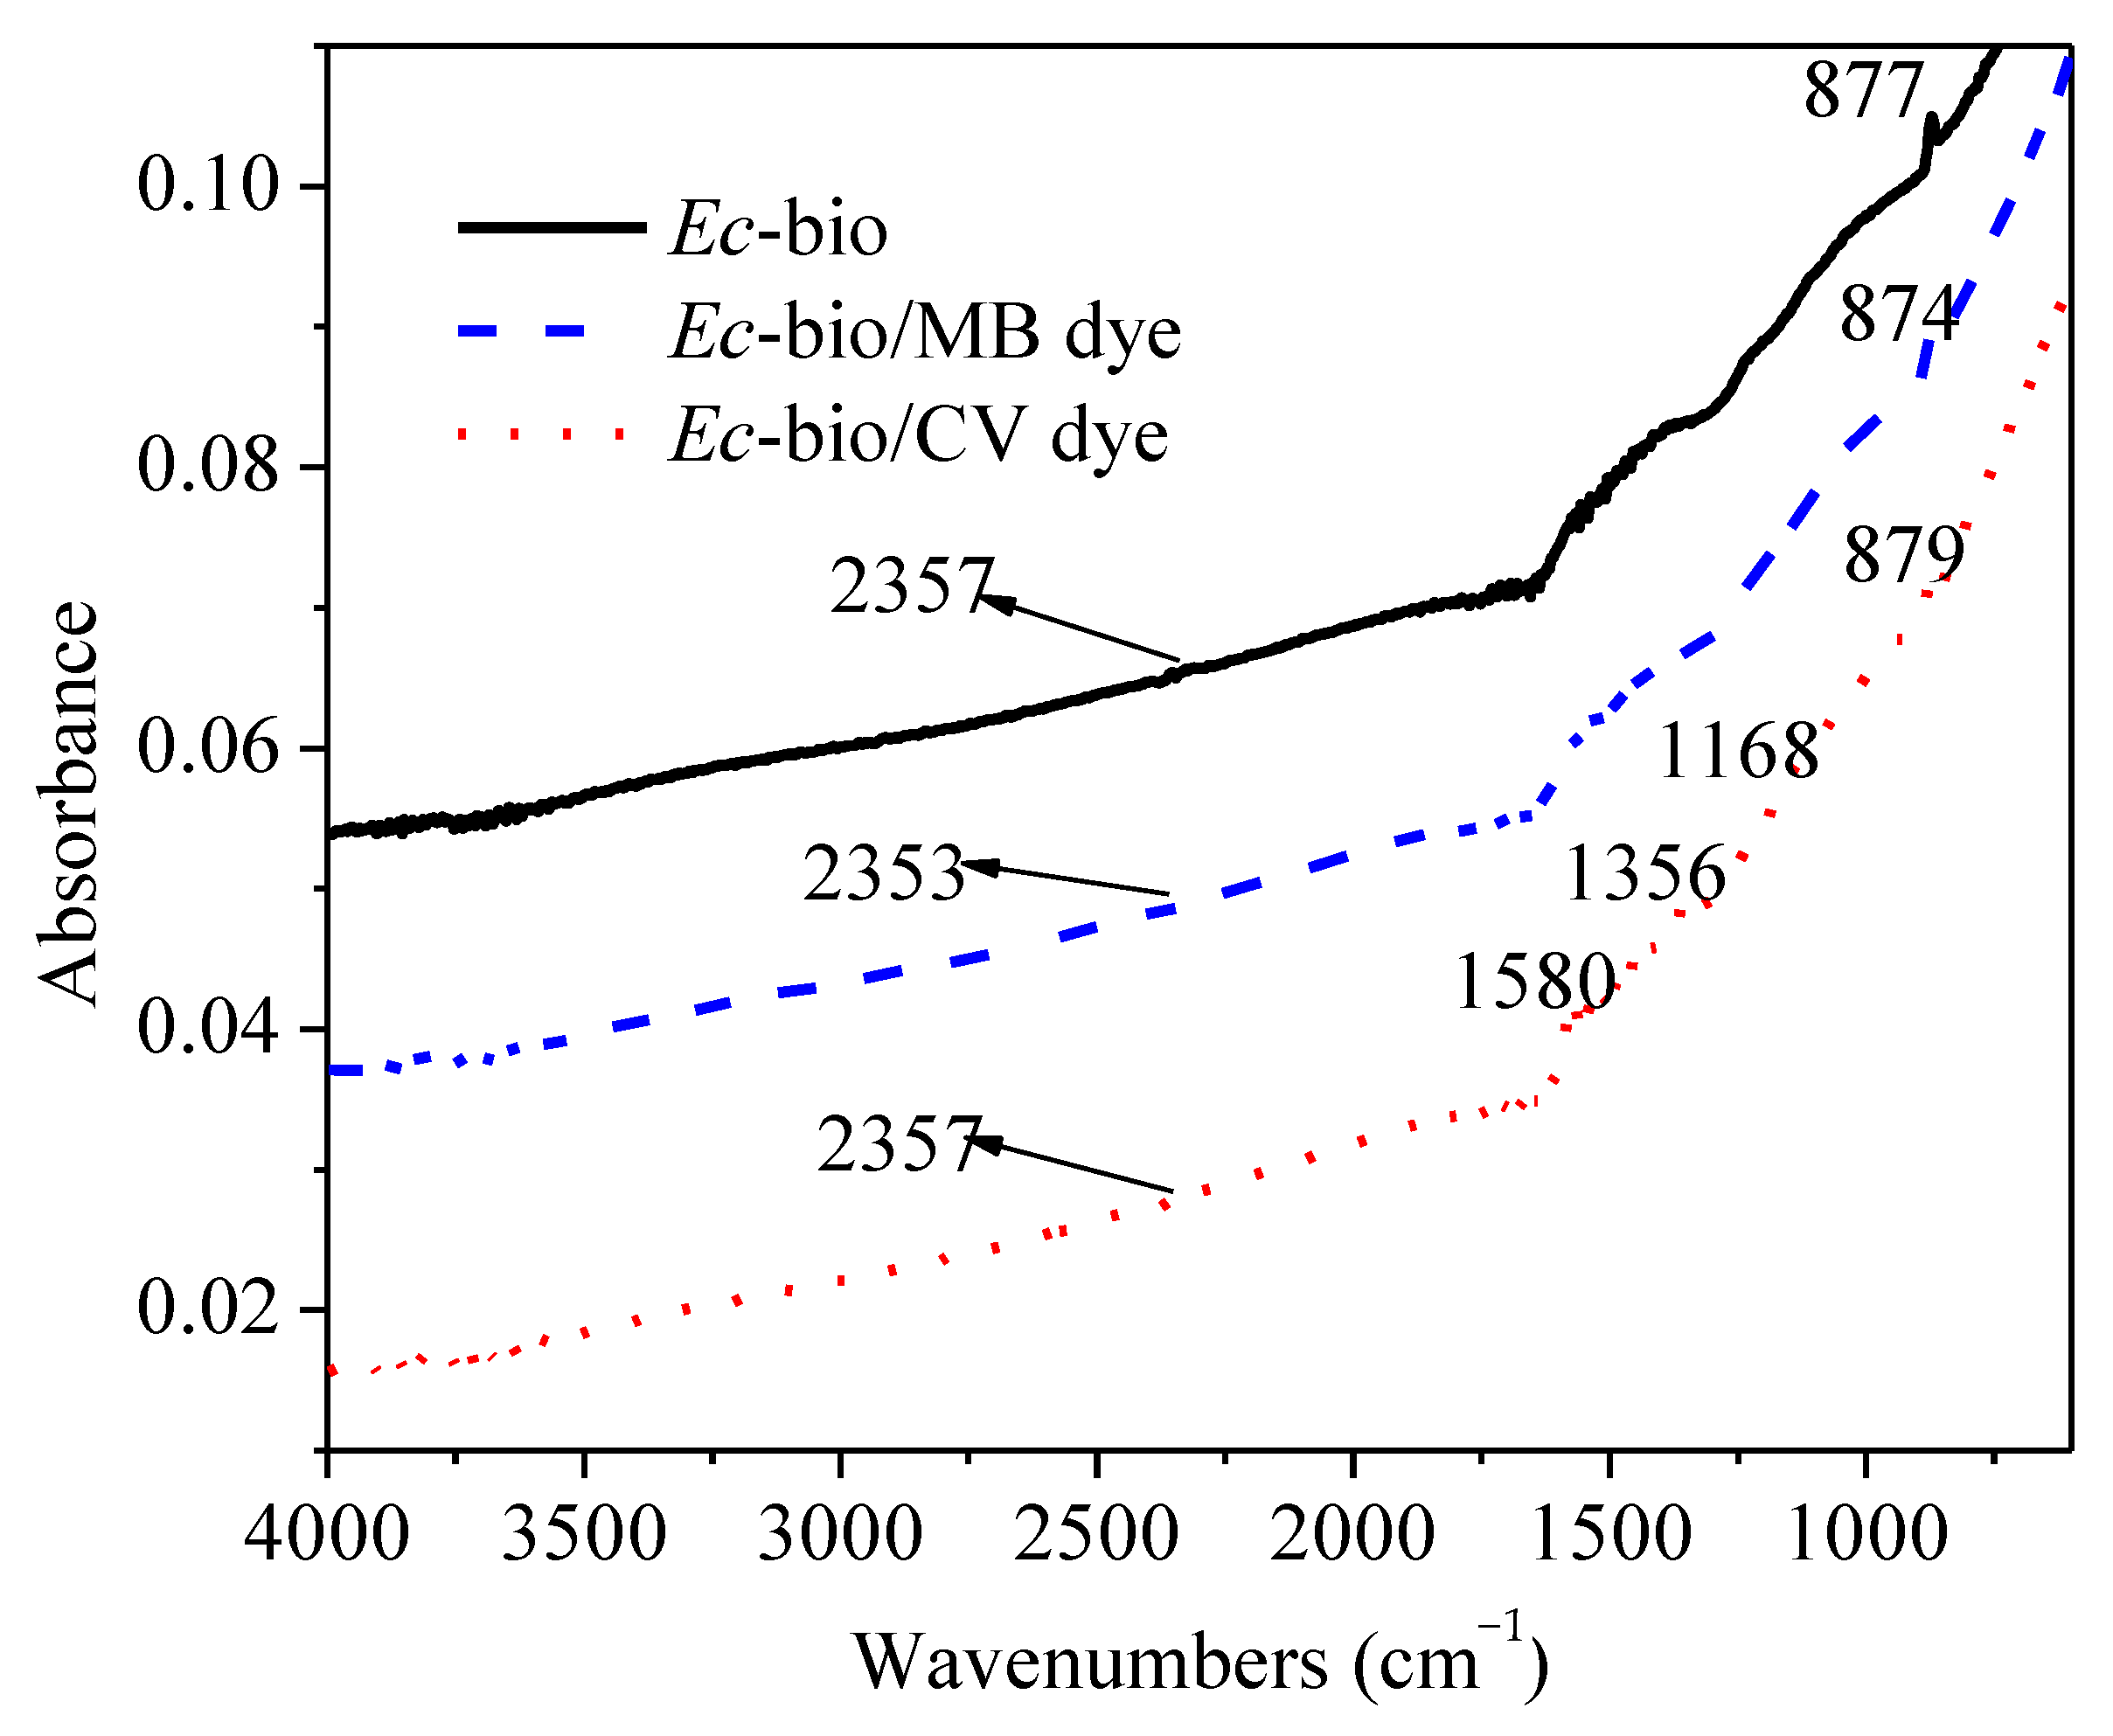
  • FTIR spectroscopy analyses
FTIR spectroscopy was used to investigate the changes in the surface functional groups of the adsorbent after CV and MB dye adsorption. The obtained FTIR spectra of the Ec-bio material before and after the adsorption of the CV (Ec-bio/CV) and MB (Ec-bio/MB) dyes are shown in Figure 2.
The pristine and loaded adsorbents exhibited few bands with low absorbance intensity, suggesting the loss of surface functional groups owing to the pyrolysis at a high temperature (800 °C). It has been reported that a higher pyrolysis temperature results in a loss of spectral resolution due to dehydration and decarboxylation reactions, subsequently diminishing the surface functional groups [25]. In the spectrum of Ec-bio, a low intensity vibrational absorption band is present at 877 cm−1, which can be ascribed to aromatic (C–H) bonding. However, the adsorption of the MB and CV dyes resulted in a slight shift in this C–H band to 874 and 879 cm−1, respectively. Another common absorption band in the spectrum of Ec-bio is present at 2357 cm−1, attributed to C≡N bonding (possibly as a result of a CO2 impurity), which shifted to 2353 cm−1 upon MB dye adsorption, but remained in the same position upon CV dye adsorption. Some new bands with lower intensities are present in the spectral data at 1168, 1356, and 1580 cm−1 upon CV dye adsorption, attributed to C–O, C=C, and C=O bonding, respectively [26]. The changes in the absorption bands in the spectra of Ec-bio after the adsorption of the CV and MB dyes suggest interactions of the adsorbate with the surface functional groups of the adsorbents, resulting in decontamination of the polluted water samples.

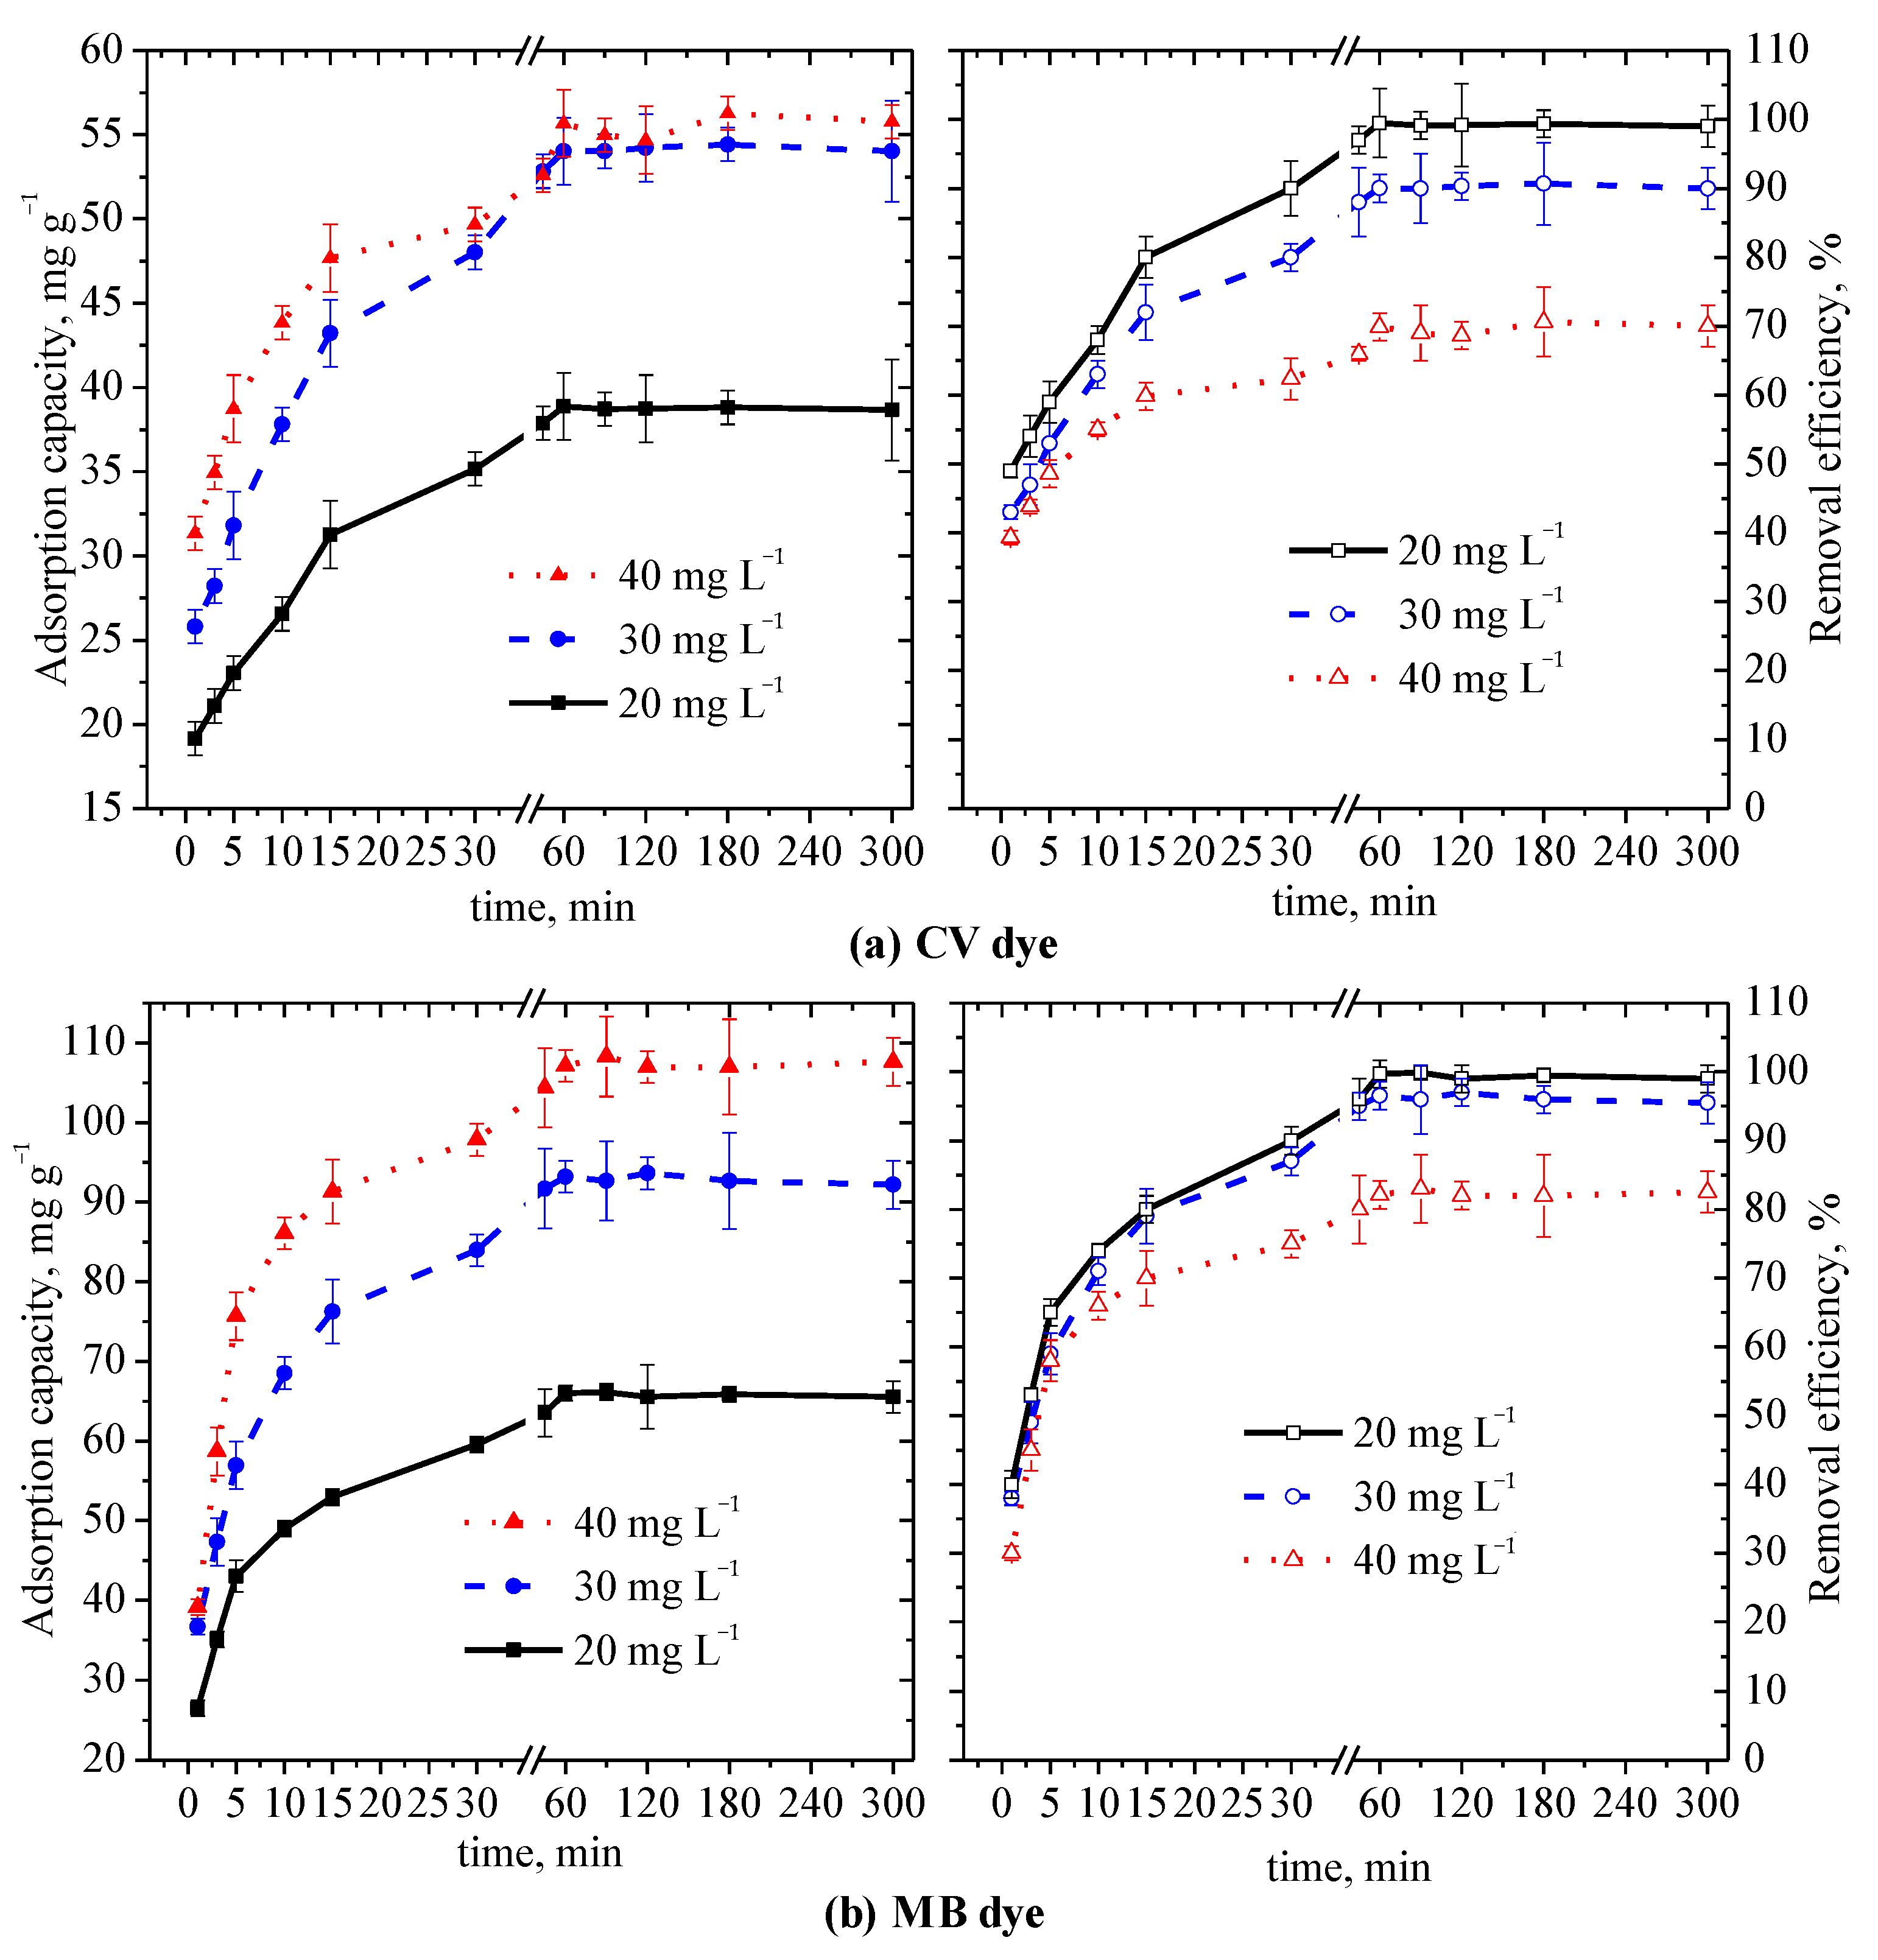
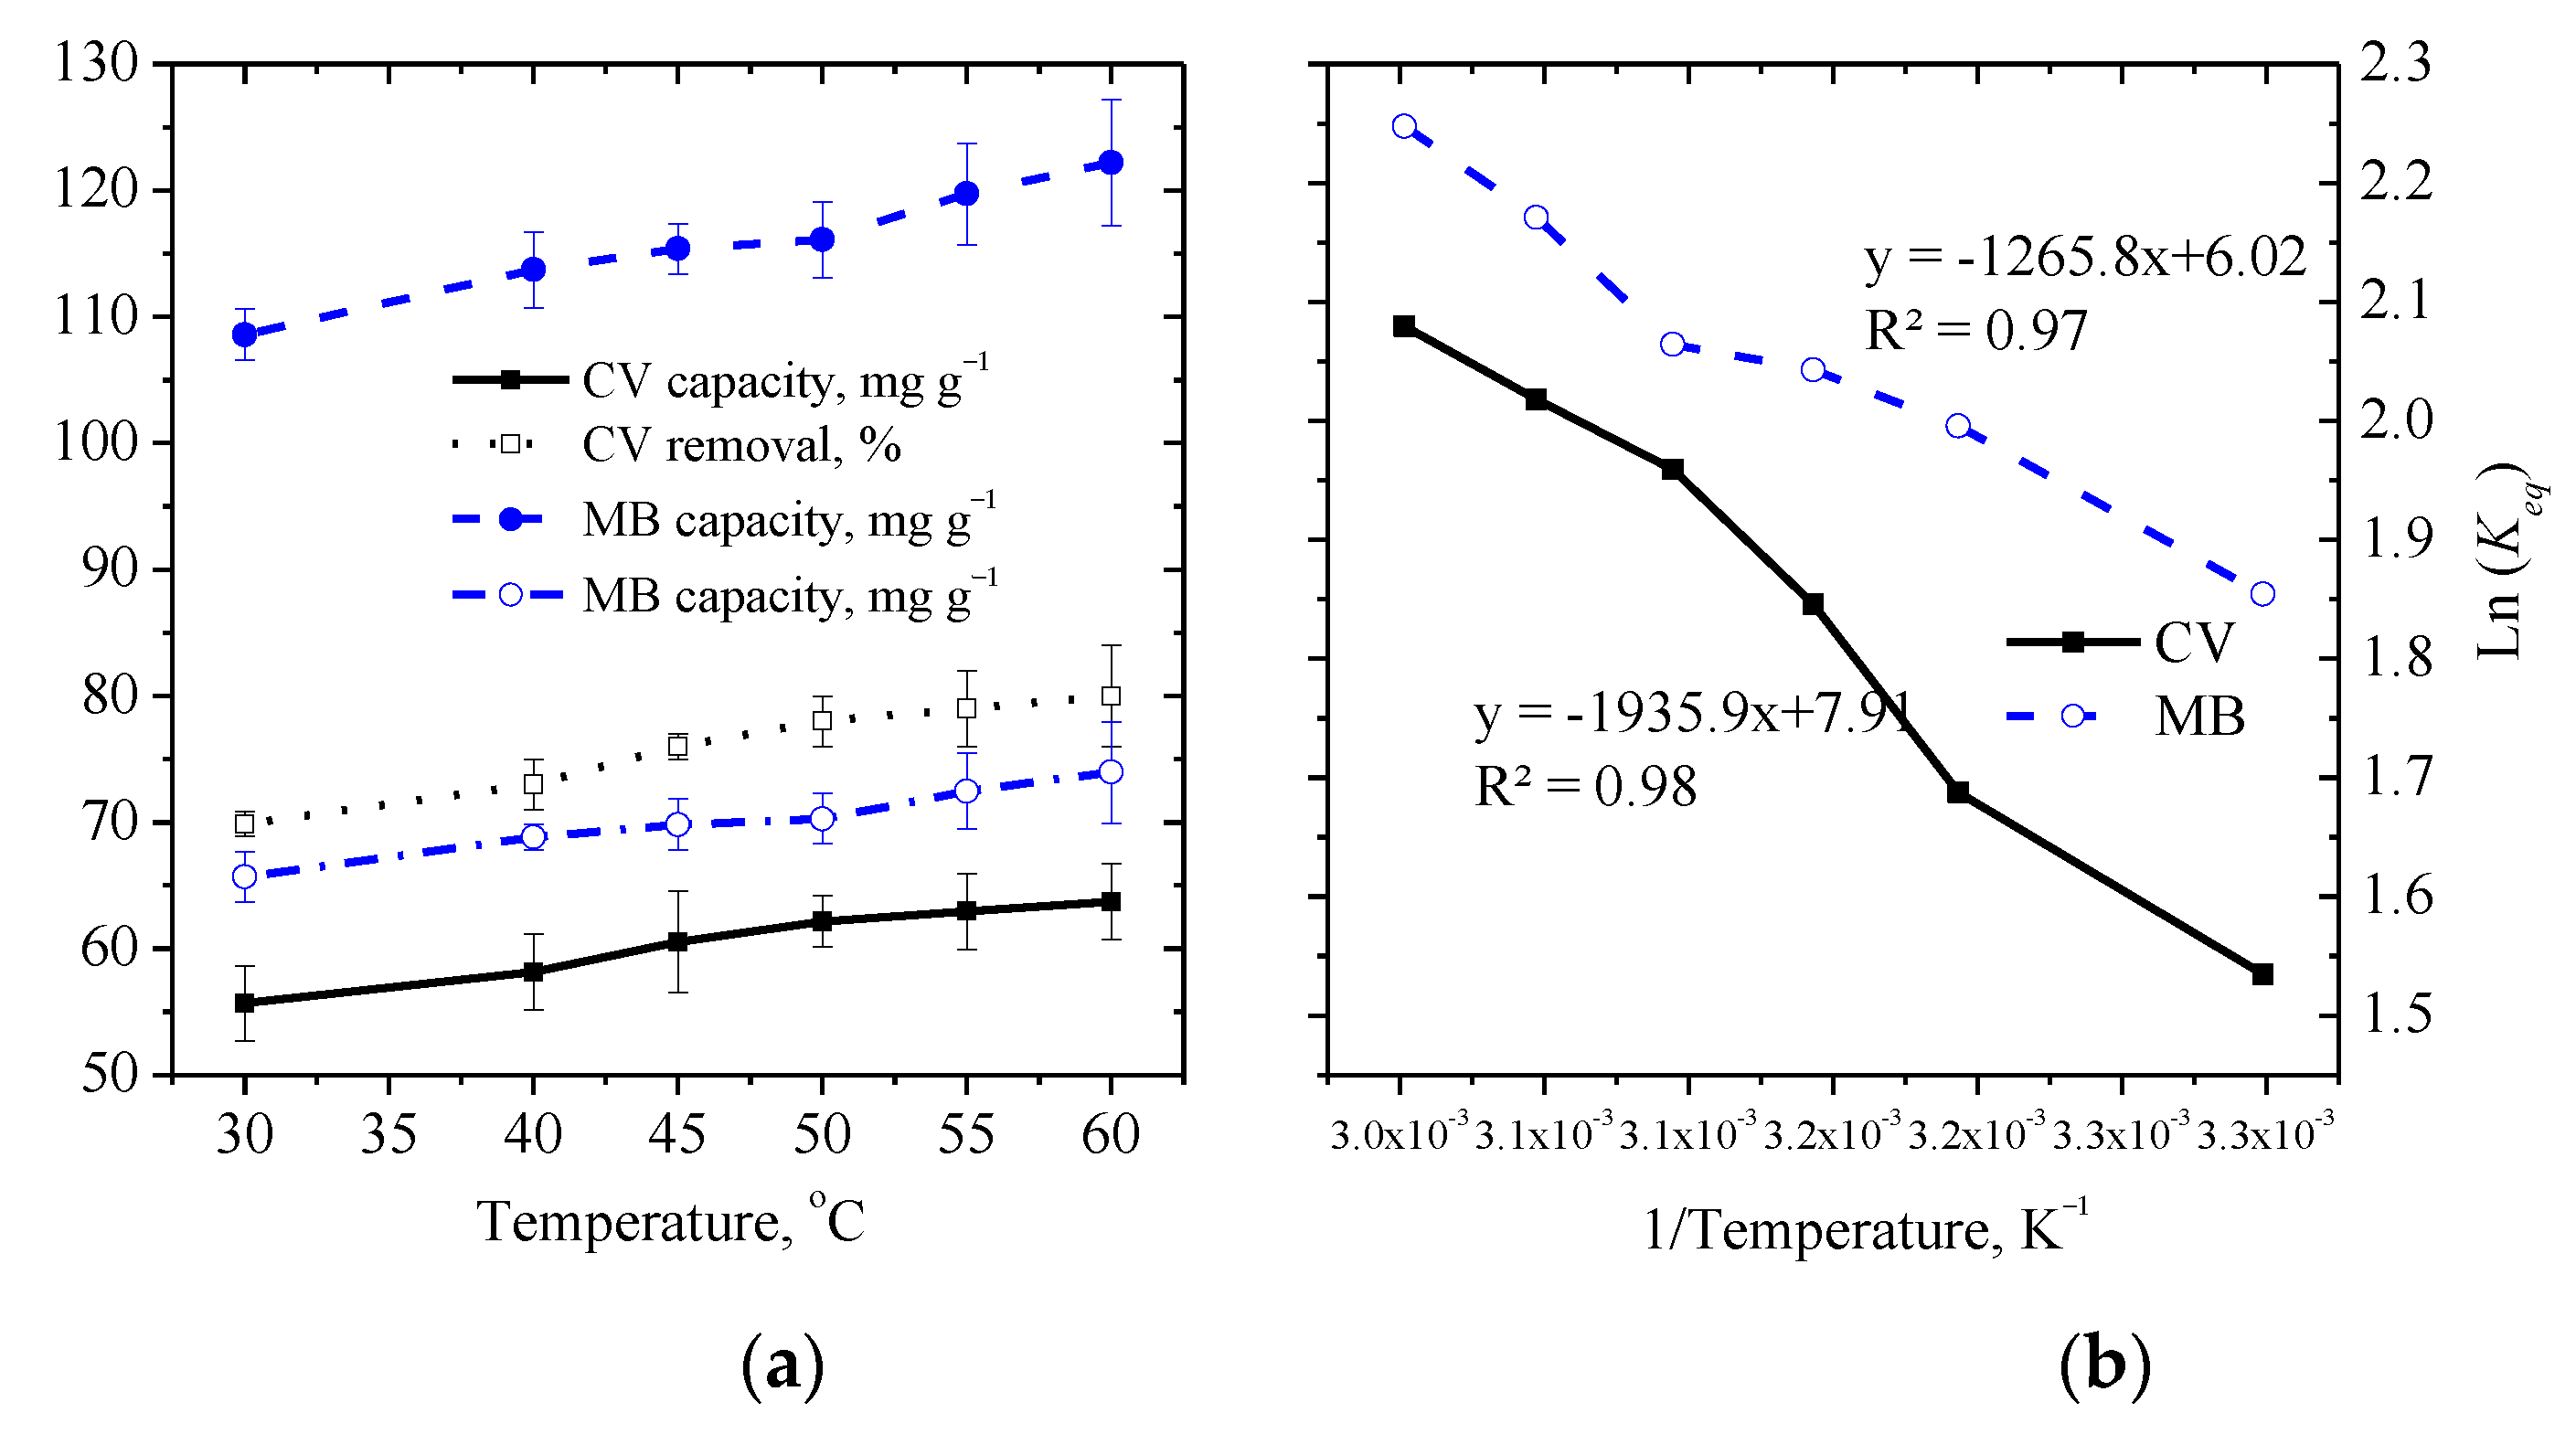
3.2. Measurement of the Equilibrium Contact Time and Effects of Temperature (Thermodynamic Studies)

To determine the necessary contact time required to reach equilibrium, batch tests were conducted by selecting four different initial concentrations (20–50 mg L−1) for each dye, with selected results presented in Figure 3. The same batch parameters for both dyes were used, including the solution temperature (30 °C) and pH (6.0) while 0.5 and 0.3 g of Ec-bio were used as the adsorbent doses for the CV and MB dyes, respectively. After 15 min of contact time, the dye uptake and percentage removal were almost 80% of the total values of these parameters after 60 min, which remained almost constant, with almost no or insignificant changes (p = 0.01) upon a further contact time of up to 300 min, as shown in Figure 3.
An immediate and very high uptake and removal efficiency of the dye molecules upon their initial contact with the adsorbent could be associated with high dye–biochar interactions due to the abundancy of active absorbent sites on the surface of the Ec-bio and limited interference due to solute–solute interactions [27]. Regardless of the initial dye concentrations, a fast rate of adsorption in the first 15 min was followed by a linear uptake, with 60 min being considered to be sufficient to reach equilibrium. The percentage removal was almost 100% for both dyes at 20 mg L−1, while the adsorption capacity differed considerably and was recorded as 39 and 66 mg g−1 for the CV and MB dyes, respectively, after 60 min. A similar trend was observed for other initial dye concentrations, despite the fact that the amount of Ec-bio for the CV dye (0.5 g) was higher than that of the MB dye (0.3 g), showcasing the much higher sorption efficiency of the Ec-bio for the CV dye compared to the MB dye.
Figure 4a illustrates the effect that varying the solution temperature (30–60 °C) has on the adsorption capacity of Ec-bio for both dyes, and a van’t Hoff plot (Figure 4b) was used to estimate the thermodynamic parameters. Changes in the standard enthalpy (ΔH, kJ mol−1) and standard entropy (ΔS, J K−1 mol−1) were calculated from the intercept and slope of the linear plot (ln Keq vs. 1/T), respectively, using Equation (3), while Equation (4) was used to calculate the Gibbs free energy change (ΔG, kJ·mol−1), in which R (8.314 kJ mol−1·K−1) and T (Kelvin) represent the universal gas constant and absolute temperature, respectively.
ln K d   =   Δ S R Δ H R T
Δ G = Δ H T Δ S .
The analysis was performed using 40 and 50 mg L−1 of CV and MB dyes on 0.5 and 0.3 g of Ec-bio, respectively, while a constant solution pH and equilibrium contact time of 6.0 and 60 min were used, respectively. The percentage removal of the MB dye was found to be slightly higher than that of the CV dye at the same solution temperature, but the adsorption capacity of the Ec-bio was almost double for the MB dye compared to the CV dye, as shown in Figure 4a, despite a lower amount of Ec-bio (0.3 g) being used in the adsorption of MB dye. The increase in the adsorption capacity and percentage removal of the CV dye with an increase in the solution temperature from 30 to 60 °C was slightly higher (14.5%) compared with that of the MB dye (12.6%). At elevated temperature, the activation of adsorption sites results in a high surface coverage and increased sorption, leading to the adsorption process being endothermic, as reported in the literature [28,29,30].
The distribution coefficient, Keq (L g−1), increased linearly by almost 72% and 48% for the CV and MB dyes, respectively, as the solution temperature increased from 30 to 60 °C. As a result, the negative values of the slope in the linear van’t Hoff plot (ln Keq vs. T−1), as shown in Figure 4b, confirm the positive changes in ΔH and ΔS (Table 2). The positive ΔH values further confirm the endothermic adsorption, indicating the probability of monolayer adsorption with higher ΔH and ΔS values for the CV dye compared to the MB dye, as shown in Table 2. The resulting negative values of ΔG thus suggest the nonspontaneous nature of the adsorption of both dyes onto the Ec-bio, and varied from −3.8 to −5.8 and −4.7 to −6.2 for the CV and MB dyes, respectively, as the solution temperature increased from 30 to 60 °C (Table 2).

3.3. Influence of the Dose of Ec-Bio, Initial Solution pH, and Dye Concentrations of on the Adsorption Performance

Although the amount of the adsorbent used can render the adsorption process uneconomical, it has a direct effect on the performance efficiency, so selecting the optimum amount is critical. The amount of Ec-bio was optimized by selecting the dose in the range 0.1–0.9 g and 0.1–0.5 g for the CV and MB dyes, respectively. The other batch parameters were maintained at a solution pH of 6.0 and contact time of 60 min, with 40 and 50 mg L−1, respectively, of the CV and MB dyes. As shown in Figure 5a, the percentage removal of both dyes increased linearly upon increasing the amount of Ec-bio with differences in the percentage removal of the CV and MB dyes of around 82% and 60%, respectively, in the selected range of Ec-bio. The adsorption capacity also followed an increasing trend in the initial selected range of the dose, but then started to reduce after 0.4 and 0.3 g of Ec-bio for the CV and MB dyes, respectively, establishing the observed values to be the optimal for the maximum uptake of the dyes. A steady decrease in the uptake of the dyes or a negligible increase in the percentage removal after the optimal dose of the Ec-bio is linked to the availability of a greater number of binding sites and the large surface area of the increasing amount of adsorbent for a fixed concentration of both dyes.
The effect that pH has on the effectiveness of the Ec-bio in absorbing both dyes was studied, considering its importance in controlling the adsorption process in a suitable range (2–7 for the CV dye and 2–10 for the MB dye), as shown in Figure 5b, by taking samples after a contact time of 60 min in the case of both dyes. In this process, 40 mg L−1 of CV dye was used with 0.5 g of Ec-bio while 50 mg L−1 of MB dye was used with 0.3 g of Ec-bio. An increase in both the adsorption capacity and the percentage removal with increasing solution pH was observed for both dyes, mainly due to the enhanced electrostatic interactions between positively charged dye molecules and the increased size of the negatively charged surface of the adsorbent at high pH [31,32,33]. Negligible changes in the uptake and removal of the CV dye beyond a solution pH of 4.0 was observed, but for the MB dye, the adsorption performance continued to increase until the maximum used value of the solution pH (i.e., 10), as shown in Figure 5b. The low adsorption performance under acidic conditions could be a result of the competitive adsorption of an excess amount of H+ ions and the negatively charged surface of the adsorbent by the cationic dyes, as reported previously [31,34]. The increase in pH enhanced the adsorption performance and adsorption capacities of 56 and 122 mg g−1 with corresponding percentage removals of 70% and 74% at pH values of 7.0 and 10.0 were observed for the CV and MB dyes, respectively.
A series of dye solutions with various initial concentrations in the range of 20–100 mg L−1 (at intervals of 10 mg L−1) were selected to examine the influence that the initial dye concentrations has on the adsorption process, as shown in Figure 5c. Observations were recorded at an equilibrium contact time of 60 min, a solution pH of 6.0, and Ec-bio doses of 0.5 and 0.3 g for the CV and MB dyes, respectively. For the CV dye, an increase in the adsorption capacity was observed in the initial range of the concentrations (20–40 mg L−1), but for the MB dye, the adsorption capacity continued to increase as the initial concentrations increased from 10 to 100 mg L−1. Reduced resistance to the dye uptake because of the high driving force of mass transfer at high initial concentrations could be the reason for the increased adsorption capacity. Moreover, it appears that amount of dye retained by Ec-bio increases with high initial dye concentrations, resulting in an efficient adsorption process. However, the percentage removal reduced from almost 99% (for both dyes) to around 26% and 37% for the CV and MB dyes, respectively, as shown in Figure 5c. This might be due to the unavailability of the fixed amount of Ec-bio and hence the saturation of the active sites when an increased dye concentration was used or the decrease in the ratio of active absorption sites to the initial dye concentrations, as previously reported for different adsorption systems [35,36,37,38].

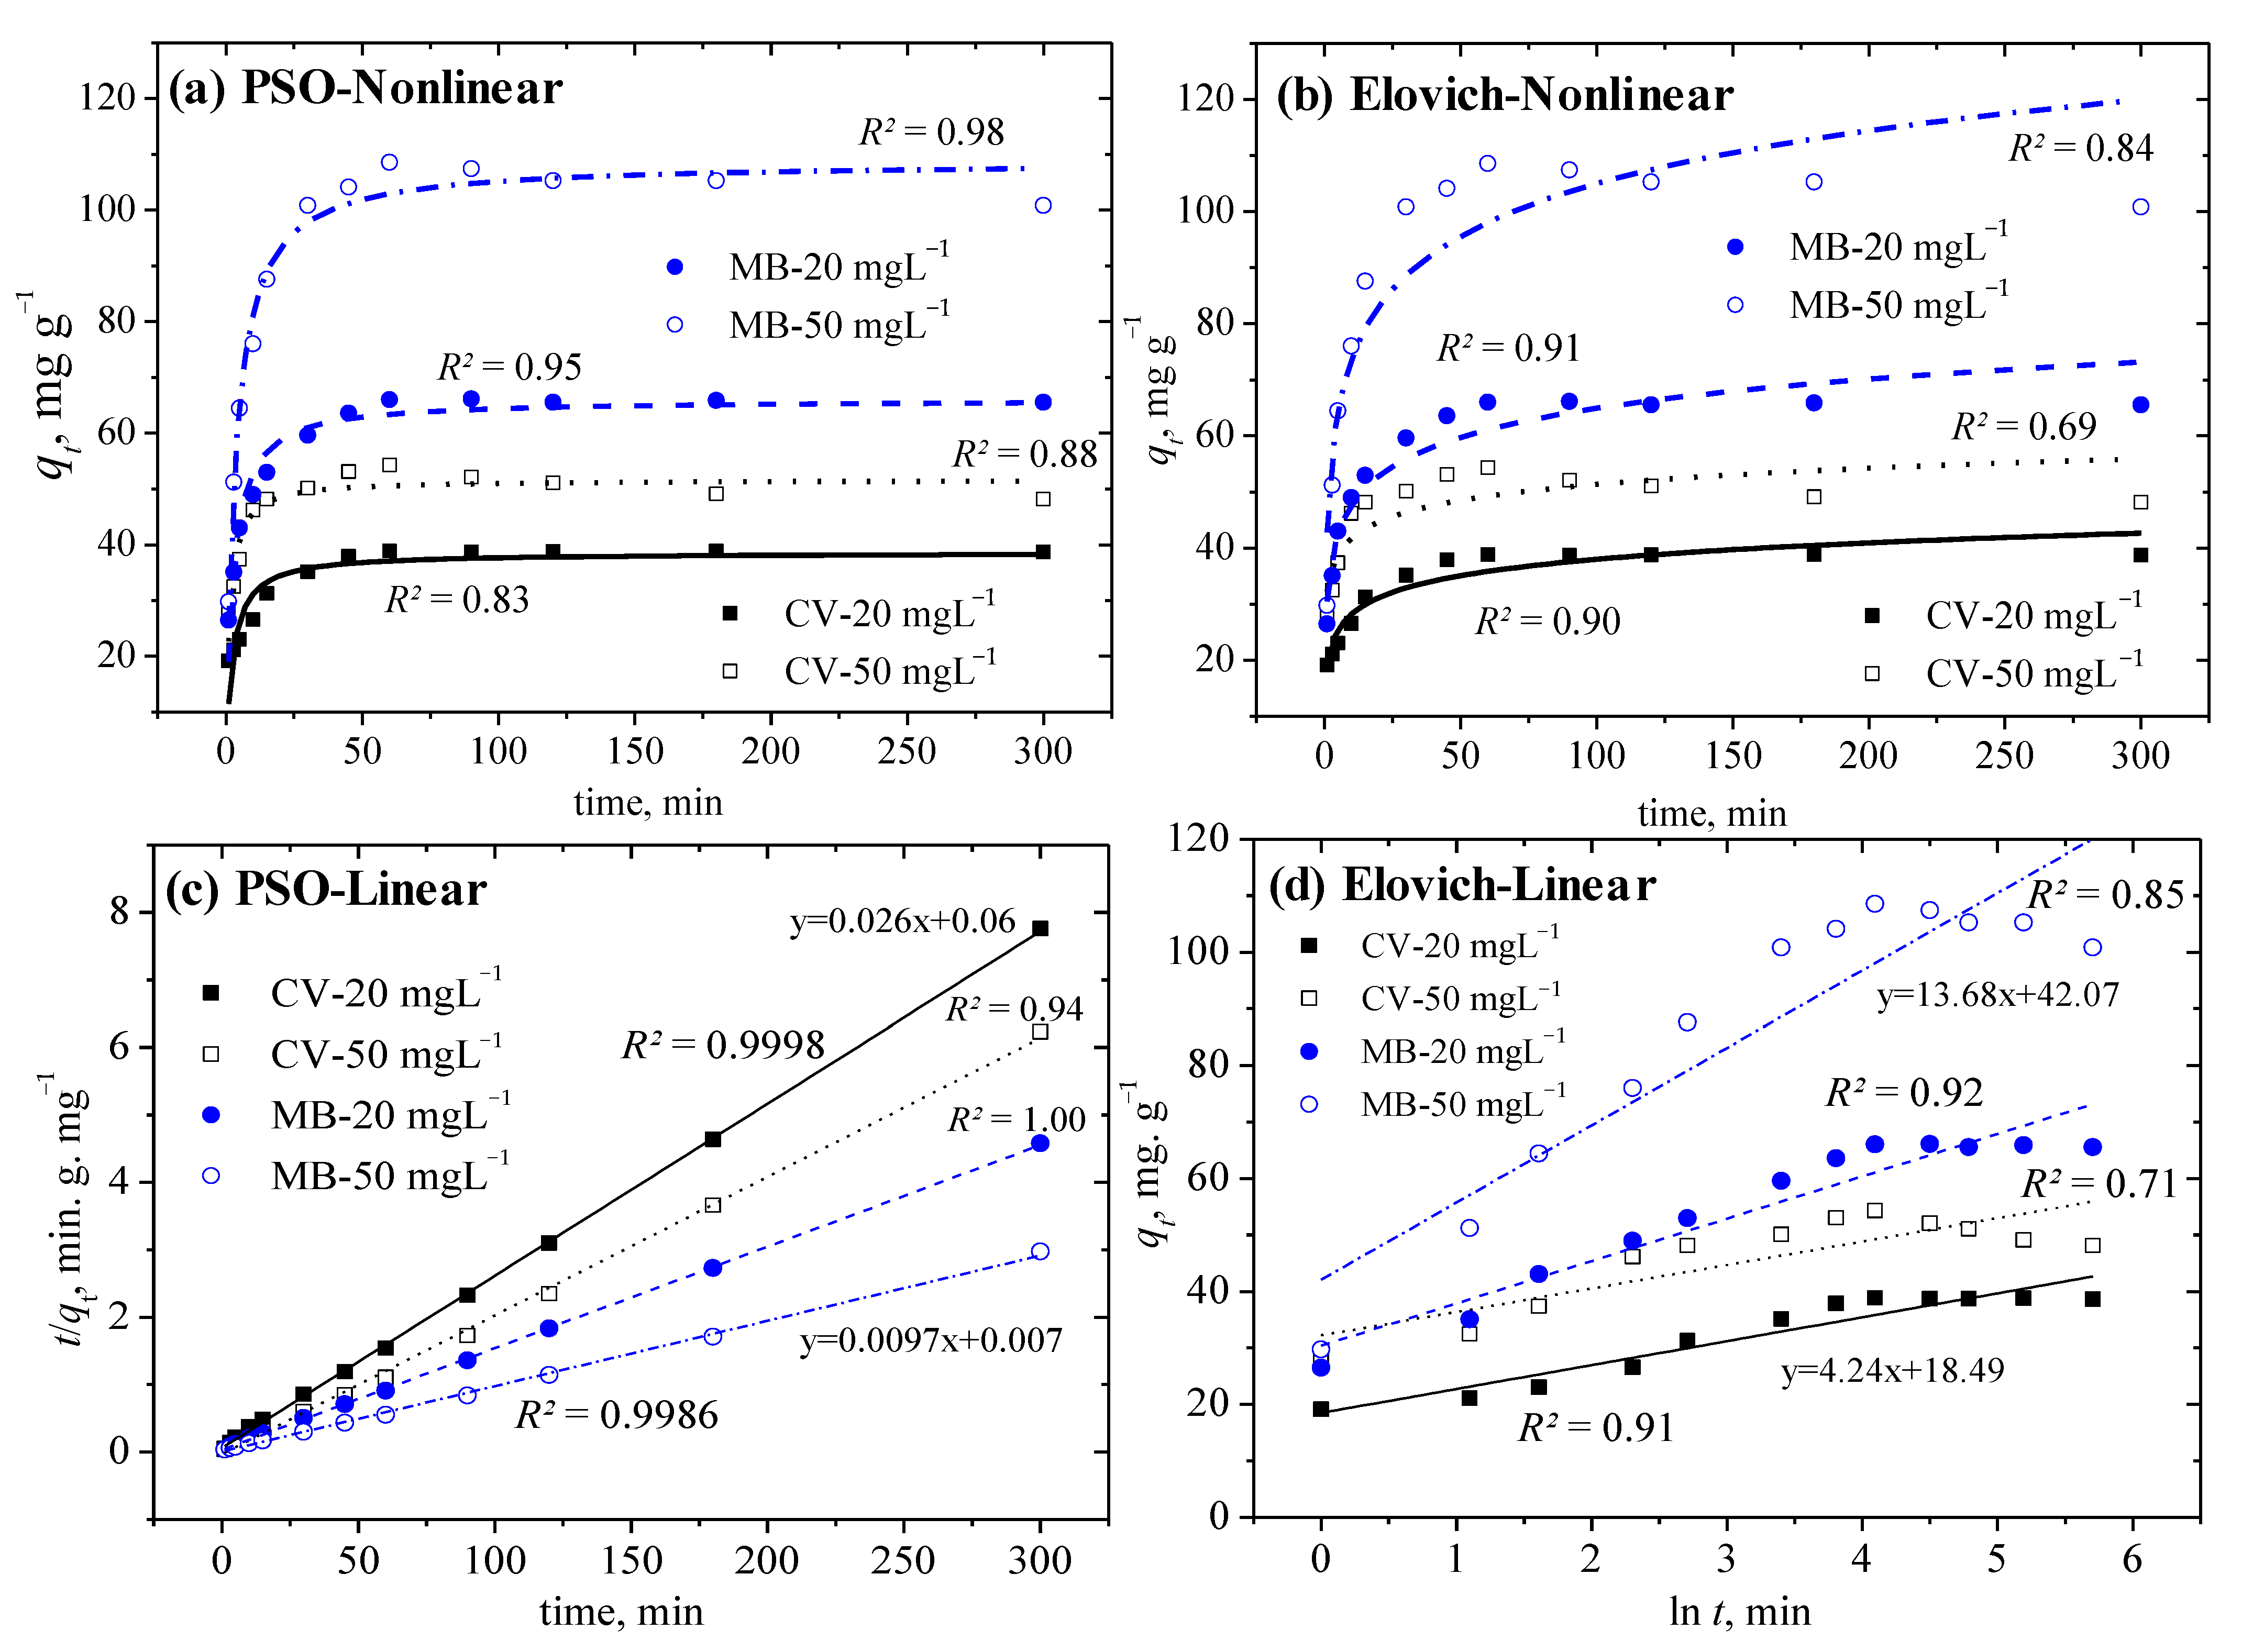
3.4. Adsorption Kinetics of Both Dyes onto the Ec-Bio

Table 1 lists the four different kinetic models that were used to analyze the experimental data of the dye adsorption onto Ec-bio (0.5 and 0.3 g for the CV and MB dyes, respectively) with varying initial concentrations in the range 20–50 mg L−1 (at intervals of 10 mg L−1), at a solution temperature of 30 °C and initial pH value of 6.0 ± 0.2. The values of the related constants and parameters in each model are given in Table 3, estimated by applying nonlinear (OriginPro 8.5 software) and linear (straight line curve fitting in MS Excel) approaches. Although the analysis was performed with four different initial concentrations of each dye, only the data related to the minimum and maximum values used in this study, i.e., 20 and 50 mg L−1 is presented.
For the PFO kinetic model, the correlation coefficients (R2) were found to be in the range of 0.52–0.72 and 0.81–0.93, respectively, for the CV and MB dyes in the case of nonlinear fitting, but very low values of R2 were observed in the case of the linear fitting of both dyes (0.07–0.63), with the lowest values being for 50 mg L−1 of each dye. These values suggest that the PFO model may not be suitable for explaining the adsorption data since this model is mostly suitable for initial stage of the adsorption process instead of the entire contact time [39,40]. The theoretical adsorption capacities (qe cal, mg g−1) closely matched the experimental values in the case of nonlinear fitting, but differed greatly in the case of the linear fitting, as shown in Table 3. The rate constants (k1, min−1) were considerably low for the linear fitting (0.0025 and 0.009 min−1 for 50 mg L−1 of the CV and MB dyes, respectively) but were in the range of 0.19–0.46 min−1 in the case of the nonlinear approach. The lowest and highest values were recorded when the initial amount of the MB and CV dye were 50 and 40 mg L−1, respectively, with no particular order of increasing or decreasing in line with the initial dye concentrations.
Examples of the nonlinear as well as linear fitting of the selected PSO and Elovich models to the adsorption data of both dyes at initial concentrations of 20 and 50 mg L−1 are illustrated in Figure 6. Figure 6a shows the good fit to the adsorption data of the CV dye onto Ec-bio with reasonable R2 values in the range of 0.83–0.88 and the very good representation of the adsorption data of the MB dye, with high R2 values in the range of 0.95–0.98. Figure 5c shows the nearly perfect fitting of the linear PSO kinetic model, with R2 values that are close to unity (1.0, Table 3) for all of the tested concentrations of both of the dyes. The qe cal values matched closely with the experimental values for both of the dyes at all of the initial concentrations using the nonlinear as well as the linear approach, except with slightly underestimated qe cal values compared to the experimental values for 50 mg L−1 of the CV (for both nonlinear and linear fitting) and the MB (only nonlinear fitting) dyes, as shown in Table 3.
The PSO kinetic model giving the best description of the adsorption data confirms the chemisorptive nature of the adsorption of both of the dyes onto Ec-bio. Similar results have been reported by many researchers regarding the adsorption of organic compounds and activated carbon [41,42,43]. The rate constants (k2, mg g−1 min−1) calculated using the PSO kinetic model did not follow any specific pattern with respect to the initial dye concentrations, but the initial adsorption rate (h = k2 qe2, mg g−1 min−1) followed an increasing trend in line with the increasing initial dye concentrations. The nonlinear approach yielded somewhat higher values of h for the CV dye at the respective initial concentration compared with the nonlinear approach, while the reverse trend was observed for the adsorption data of the MB dye. Considering the nonlinear approach to be more realistic than the linear fitting, it was observed that the initial uptake rate of the dye increased from 16 to 34.3 and 40.6 mg g−1 min−1 for the CV and MB dyes, respectively, as shown in Table 3, highlighting the higher h values for the MB dye compared with those of the CV dye using nonlinear as well as linear fitting.
The nonlinear fitting of the Elovich model with reasonable R2 values in the range of 0.87–0.94 for both the CV and MB dyes for all of the initial concentrations used (except for 50 mg L−1 of the CV dye) (Figure 6b) as well as the linear (Figure 6d) approach described and further supported the activated chemical adsorption without desorption of products [27]. The initial adsorption rate constant (α, mg g−1 min−1) mostly followed an increasing trend with increasing initial concentrations for both dyes using the nonlinear approach, with the exception of 50 mg L−1 of the MB dye. No particular trend was observed for α or β (g mg−1) using the linear approach, which represents the number of sites available for adsorption [44] and is indicative of the activation energy of the chemisorption [45]. The ID–WM kinetic model was employed to describe the steps involved in the adsorption process, giving very low values of R2 (0.30–0.69, Table 3), which indicated that the model was not suitable for the fitting of the adsorption data. The rate constant (Kip, mg g−1 min1/2) increased insignificantly for the MB dye while remaining almost constant with an irregular or decreasing trend for the CV dye as the initial concentrations increased from 20 to 50 mg L−1. As shown in Table 3, the thickness of the boundary layer (C, mg g−1) increased upon increasing the initial dye concentrations from 20 to 50 mg L−1.

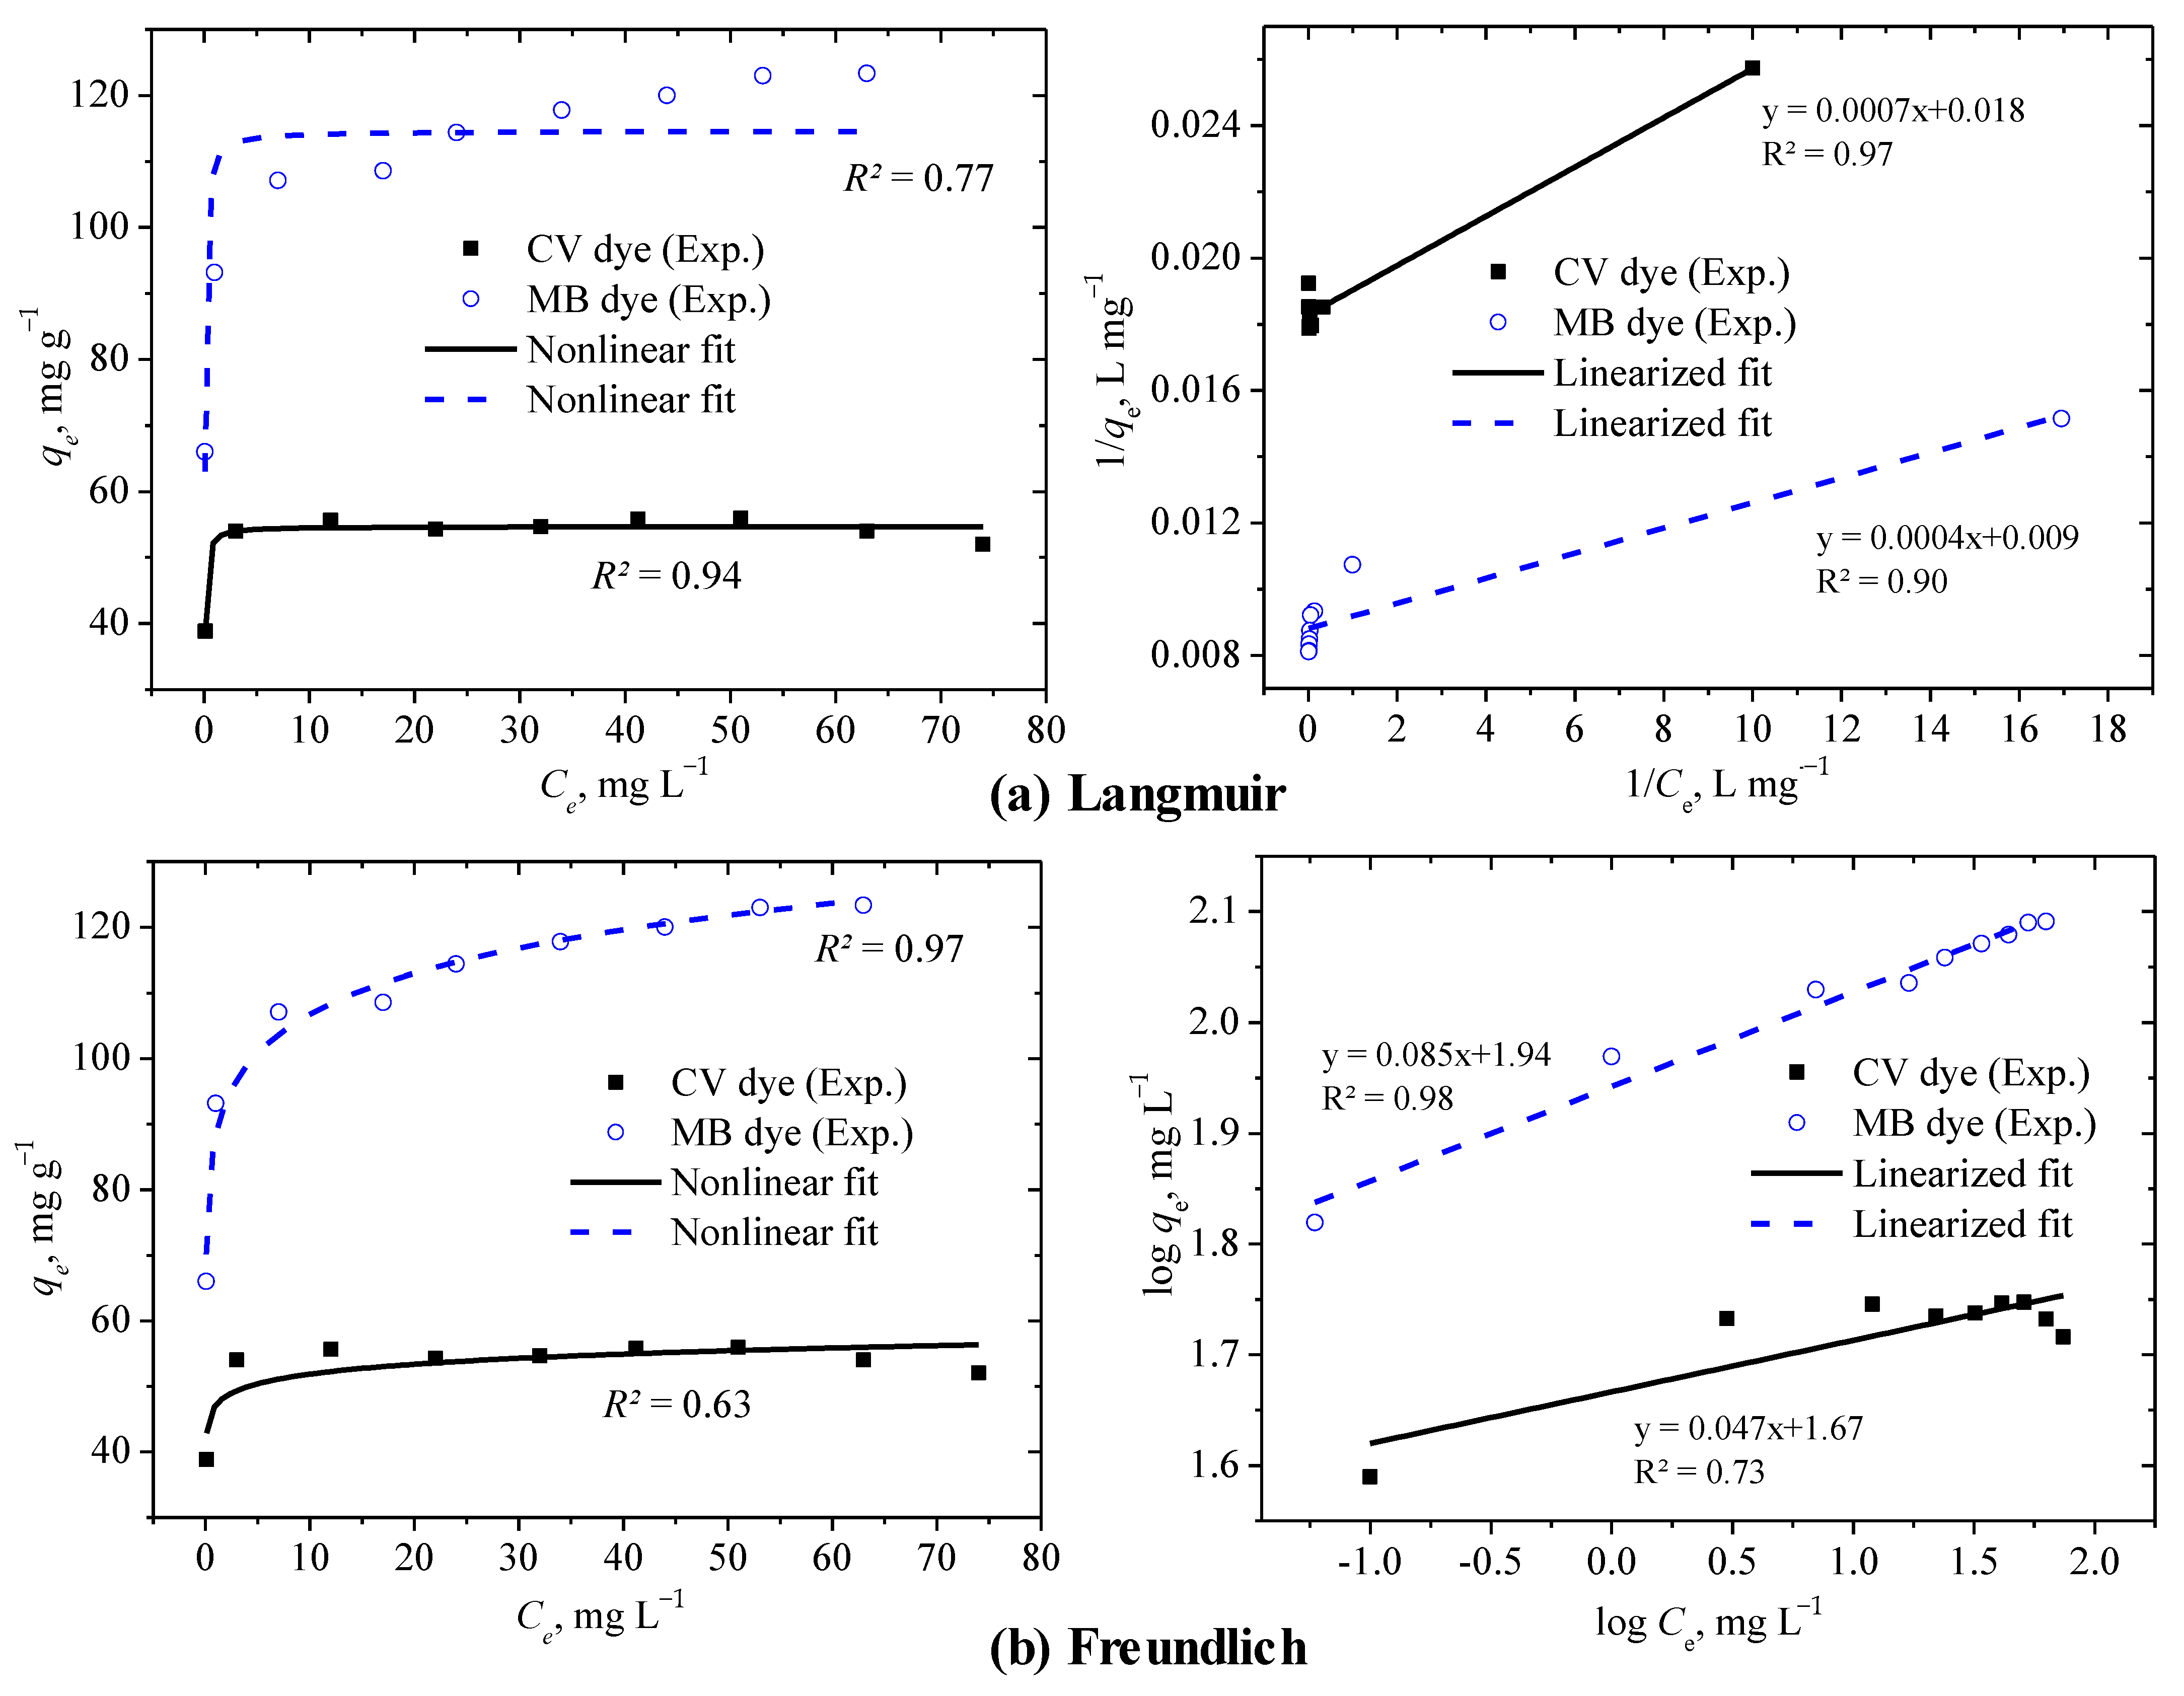
3.5. Two-Parameter Isotherm Models to Describe the Adsorption Process

To analyze the adsorption system, seven two-parameter isotherm models were used in this study using both nonlinear and linear approaches, as shown in Table 1. The OriginPro 8.5 and CurveExpert Professional software were used to evaluate the parameters in each model for the nonlinear fitting, while slope and intercept values were used for the linear approach. These parameters of both dyes are listed in Table 4, while the equilibrium residual concentrations and equilibrium adsorption capacities were calculated for the initial dye concentrations in the range of 20–100 mg L−1 onto 0.5 and 0.3 g of Ec-bio for the CV and MB dyes, respectively. The samples were agitated for a constant contact time of 60 min at a solution pH of 6 ± 0.2 and a temperature of 30 °C. Fitting of the most commonly used isotherm models, i.e., the Langmuir and Freundlich models, to the adsorption data of both of the dyes using both nonlinear and linear approaches is shown in Figure 7.
From the experimental data, the maximum adsorption capacities were observed for initial concentrations of the CV and MB dyes of 80 and 100 mg L−1, respectively. The theoretical maximum capacity (qm, mg g−1) was nearly the same as that of the experimental value (56 mg g−1) for the CV dye from both nonlinear or linear Langmuir and Freundlich isotherm models. However, for the MB dye, the Langmuir isotherm yielded a slightly lower qm (114.6 mg g−1) value in comparison to the experimental value (123.3 mg g−1) using both nonlinear and linear approaches, while in the case of the MB dye, lower and higher values than the experimental observations were estimated using nonlinear and linear Freundlich isotherms, respectively, as shown in Table 4. As shown in Figure 7a, the Langmuir model fitted well to the experimental data for the adsorption of CV dye onto Ec-bio, with high R2 values using both nonlinear and linear fitting, while it was not a good fit in the case of the MB dye, with an R2 value of 0.77 (nonlinear fitting). However, the Freundlich isotherm was a good representative model of the adsorption data of the MB dye, with high R2 values (Figure 7b), while it was a poor fit to the adsorption data of the CV dye (R2 = 0.63 and 0.73 for nonlinear and linear fitting, respectively).
As shown in Table 4, the Langmuir constant (KL, L mg−1) for the CV dye was slightly higher than that of the MB dye, showing its high affinity toward Ec-bio, which further supports the good fit of the Langmuir isotherm to the adsorption data of the CV dye and supporting its monolayer adsorption onto the Ec-bio. Due to a minor difference between the KL values for both of the dyes, nearly the same values for the dimensionless separation factor (RL = (1 + KLC0)−1) were observed for both dyes, illustrating the similarity in the shape of their isotherms [46] and favorability of the Langmuir isotherm to represent the adsorption of both of the dyes onto the Ec-bio. As shown in Table 4, the application of the Freundlich isotherm gave higher values of the model constant (KF, (mg/g) (L/mg)1/n) for the MB dye compared with the CV dye. The favorability of the model [47] was further demonstrated for both dyes, with acceptable dimensionless factor (0 < 1/n < 0) values observed, suggesting the surface heterogeneity of the Ec-bio in the studied adsorption systems.
The D–R isotherm was a good fit to the adsorption data of the CV dye in comparison to the MB dye, as reflected from the difference in their R2 values in the case of nonlinear fitting (Table 4) in addition to the close agreement of the theoretical qm value with the experimental value of the CV dye. Moreover, very low model constant (KDR, (mol kJ−1)2) values resulted in mean free energy of adsorption (E = (2KDR)−1/2, kJ mol−1) values of in the range of 6.8 to 7.45 kJ mol−1, suggesting the physisorption of both dyes onto the Ec-bio. The Halsey isotherm was a good fit to the adsorption data of the MB dye, with a close match of the theoretical qm value with the experimental value for the nonlinear fitting, hence suggesting the multilayer adsorption of the MB dye onto the heteroporous Ec-bio. In terms of the CV dye, despite the same observed values of the theoretical and experimental adsorption capacities, the Halsey model does not seem to reflect the adsorption data due to low R2 values (0.58 for the nonlinear fitting, Table 4). The model constant (kH) was very low (almost zero) for the nonlinear approach, while a higher kH value was observed for the MB dye compared to the CV dye in the linear fitting. The value of the model exponent (nH) was also higher for the MB dye compared to that of the CV dye for both the nonlinear and linear fitting.
Like the Freundlich and Halsey models, the Temkin isotherm was nearly a perfect fit to the adsorption data of the MB dye, with an R2 value close to unity (1.0), reflecting the heterogeneous adsorption of the MB dye with a uniform distribution of the binding energies [48] of the dye onto the surface of the Ec-bio. Considerably lower values of the binding constant at equilibrium (KT L mg−1) and the heat of adsorption (Hads, kJ mol−1) were observed for the MB dye compared to the CV dye using both nonlinear linear fitting of the Temkin model to the adsorption data. The H–J isotherm was a much better fit to the adsorption of MB dye, with a high R2 value (0.95) compared to the CV dye, with an R2 value of 0.6 for the nonlinear fitting, as shown in Table 4. The value of the model constant (AHJ, mg g−1) was almost the same for both dyes in nonlinear fitting, while for BHJ (another constant), the MB dye reflected a value of less than half that of the CV dye. The suitability of the H–J model supports the multilayer adsorption of MB onto the Ec-bio with heterogeneous pore distribution, as also suggested by the Halsey and Freundlich isotherm models. Significantly close agreement of the Jovanovic isotherm to the adsorption data of the CV dye, with a high R2 value (0.94) in the case of nonlinear fitting, suggested the localized monolayer adsorption of the CV dye onto the Ec-bio, as also suggested by the Langmuir isotherm, without lateral interactions, and suggests there are some mechanical interactions between the adsorbing and desorbing molecules [49,50]. As shown in Table 4, the model constant (Kj, L g−1) was higher for the CV dye compared to the MB dye, while the theoretical qm value for the CV dye was in good agreement with the experimental value but that of the MB dye was underestimated using both nonlinear and linear fitting. Finally, Table 5 presents the comparison of adsorption capacities of Eucalyptus camaldulensis biochar for both dyes with other previously reported biochar.

4. Conclusions

In this study, the potential that Ec-bio has for the batch adsorption of cationic CV and MB dyes from synthetic wastewater was explored. Different characteristics of Ec-bio (synthesized at 800 °C) were studied upon the adsorption of the CV and MB dyes to optimize the batch parameters for the enhancement of the adsorption process, and then the adsorption efficiency was estimated using different isotherm and kinetic models. SEM images confirmed the well-organized channels and pores in the pristine biochar before the adsorption of either of the dyes, while the appearance of very small aggregations of white particles on the surface was observed due to the molecules of the dye being adsorbed into the pores as well as on the porous surface of the Ec-bio. EDX spectra confirmed the changes in morphology, as well as the elemental composition of the Ec-bio upon the adsorption of the CV and MB dyes, suggesting that physiochemical interactions occur between the adsorbent and adsorbates, consequently resulting in the removal of the dyes from contaminated aqueous solutions. In the FTIR analysis, the changes in the absorption bands of Ec-bio after the adsorption of the CV and MB dyes suggested the interactions of the adsorbates with the surface functional groups of the adsorbent, resulting in the decontamination of the water.
The immediate high uptake and removal efficiency of both dyes upon initial contact with Ec-bio was observed in the first 15 min followed by linear uptake, with 60 min being considered sufficient to reach equilibrium, with a higher sorption efficiency of the Ec-bio for the CV dye being observed compared to the MB dye. A positive ΔH value confirmed an endothermic adsorption system, indicating the probability of monolayer adsorption with higher values of ΔH and ΔS for the CV dye compared to the MB dye, while the resulting negative ΔG values suggested the nonspontaneous nature of the adsorption of both dyes onto the Ec-bio.
The percentage removal of both dyes increased linearly upon increasing the amount of Ec-bio, however, after following an increasing trend in the initial selected range of the dose, the adsorption capacity started to reduce, showing that 0.4 and 0.3 g of Ec-bio gave the optimal values for the maximum adsorption of the CV and MB dyes, respectively. An increase in both the adsorption capacity and the percentage removal with increasing solution pH for both dyes was observed, with negligible changes beyond a solution pH of 4.0 for the CV dye, while the adsorption performance continued to increase until the maximum used solution pH (i.e., 10) was reached for the MB dye. An increase in adsorption capacity was observed upon increasing the initial concentrations of CV in the range of 20–40 mg L−1, but in the case of the MB dye, the adsorption capacity continued to increase as the initial concentration increased from 10 to 100 mg L−1 due to the reduced resistance to uptake of the dye because of the enhanced driving force of mass transfer at high initial concentrations. However, the percentage removal reduced from almost 99% (for both dyes) to around 26% and 37% for the CV and MB dyes, respectively, due to the saturation of the active sites of the Ec-bio that occurred upon increased dye concentration.
The PFO kinetic model was found to not be a suitable fit to the adsorption data of the selected dyes based on the calculated R2 values in both nonlinear and linear, as this model was only suitable for modeling the initial contact time of the adsorption process. However, a good fit to the adsorption data of the CV dye onto the Ec-bio was achieved using the PSO kinetic model (nonlinear approach), while almost perfect fitting was observed for the adsorption data of the MB dye, confirming the chemisorptive nature of the adsorption of both dyes onto the Ec-bio. The reasonable fitting of the Elovich model (nonlinear) to the adsorption data of both dyes further supported the process as being activated chemical adsorption without any desorption of the products. Finally, the observed low R2 values calculated using the ID–WM kinetic model indicated that this model was not at all suitable for modeling the steps involved in the adsorption process.
The Langmuir isotherm fitted the experimental data well in the case of the adsorption of the CV dye, supporting its monolayer adsorption onto the Ec-bio, but the same model was not a good fit in the case of the MB dye. However, the Freundlich isotherm gave a good representation of the adsorption data of the MB dye, suggesting the surface heterogeneity of the Ec-bio in the studied adsorption system. The D–R isotherm was a good model for the adsorption data of the CV dye in comparison to the MB dye, showing close agreement between the theoretical qm and the experimental value for the CV dye. The mean free energy of adsorption was estimated in the range of 6.8 to 7.45 kJ mol−1, suggesting the physisorption of both dyes onto the Ec-bio. The Halsey isotherm was a good fit for the adsorption data of the MB dye, suggesting the multilayer adsorption of the MB dye onto the heteroporous Ec-bio. The Temkin isotherm was almost a perfect fit to the adsorption data of the MB dye, reflecting the heterogeneous adsorption of the MB dye with uniform distribution of its binding energies onto the surface of the Ec-bio. Moreover, the H–J isotherm was a much better model for the adsorption of the MB dye compared to the CV dye, supporting the multilayer adsorption of the MB onto the Ec-bio with heterogeneous pore distribution. Finally, a significantly close agreement of the Jovanovic isotherm to the adsorption data of the CV dye revealed its localized monolayer adsorption onto the Ec-bio without any lateral interactions.

Author Contributions

Conceptualization, M.T.A. and A.A.A.; methodology, M.S.; software, M.T.A.; validation, M.T.A. and A.A.A.; formal analysis, M.S.; investigation, M.T.A. and M.S.; resources, A.A.A.; data curation, M.T.A.; writing—original draft preparation, M.T.A.; writing—review and editing, M.T.A. and A.A.A.; visualization, M.S.; supervision, A.A.A.; project administration, M.T.A. and M.S.; funding acquisition, A.A.A. All authors have read and agreed to the published version of the manuscript.

Funding

This project was funded by the National Plan for Science, Technology and Innovation (MAARIFAH), King Abdulaziz City for Science and Technology, Kingdom of Saudi Arabia, Award Number (12-WAT2623-02).

Data Availability Statement

Not applicable.

Acknowledgments

The authors appreciate the Deanship of Scientific Research and RSSU at King Saud University for their technical support (manuscript editing services).

Conflicts of Interest

The authors declare no conflict of interest.

References

  1. Chowdhary, P.; Bharagava, R.N.; Mishra, S.; Khan, N. Role of Industries in Water Scarcity and Its Adverse Effects on Envi-ronment and Human Health. In Environmental Concerns and Sustainable Development: Volume 1: Air, Water and Energy Resources; Shukla, V., Kumar, N., Eds.; Springer: Singapore, 2020; pp. 235–256. [Google Scholar]
  2. Abd-Elhamid, A.I.; Emran, M.; El-Sadek, M.H.; El-Shanshory, A.A.; Soliman, H.M.A.; Akl, M.A.; Rashad, M. Enhanced removal of cationic dye by eco-friendly activated biochar derived from rice straw. Appl. Water Sci. 2020, 10, 45. [Google Scholar] [CrossRef] [Green Version]
  3. Goswami, M.; Chaturvedi, P.; Sonwani, R.K.; Gupta, A.D.; Singhania, R.R.; Giri, B.S.; Rai, B.N.; Singh, H.; Yadav, S.; Singh, R.S. Application of Arjuna (Terminalia arjuna) seed biochar in hybrid treatment system for the bioremediation of Congo red dye. Bioresour. Technol. 2020, 307, 123203. [Google Scholar] [CrossRef]
  4. Turhan, K.; Ozturkcan, S.A. Decolorization and Degradation of Reactive Dye in Aqueous Solution by Ozonation in a Semi-batch Bubble Column Reactor. Water Air Soil Pollut. 2013, 224, 1–13. [Google Scholar] [CrossRef]
  5. Geis, S.W.; Fleming, K.L.; Korthals, E.T.; Searle, G.; Reynolds, L.; Karner, D.A. Modifications to the algal growth inhibition test for use as a regulatory assay. Environ. Toxicol. Chem. 2000, 19, 36–41. [Google Scholar] [CrossRef]
  6. Mittal, A.; Mittal, J.; Malviya, A.; Kaur, D.; Gupta, V. Adsorption of hazardous dye crystal violet from wastewater by waste materials. J. Colloid Interface Sci. 2010, 343, 463–473. [Google Scholar] [CrossRef] [PubMed]
  7. El-Sayed, G.O. Removal of methylene blue and crystal violet from aqueous solutions by palm kernel fiber. Desalination 2011, 272, 225–232. [Google Scholar] [CrossRef]
  8. Kulkarni, M.R.; Revanth, T.; Acharya, A.; Bhat, P. Removal of Crystal Violet dye from aqueous solution using water hyacinth: Equilibrium, kinetics and thermodynamics study. Resour. Effic. Technol. 2017, 3, 71–77. [Google Scholar] [CrossRef]
  9. Ciardelli, G.; Corsi, L.; Marcucci, M. Membrane separation for wastewater reuse in the textile industry. Resour. Conserv. Recycl. 2001, 31, 189–197. [Google Scholar] [CrossRef]
  10. Zahrim, A.; Dexter, Z.; Joseph, C.; Hilal, N. Effective coagulation-flocculation treatment of highly polluted palm oil mill biogas plant wastewater using dual coagulants: Decolourisation, kinetics and phytotoxicity studies. J. Water Process. Eng. 2017, 16, 258–269. [Google Scholar] [CrossRef] [Green Version]
  11. Škodič, L.; Vajnhandl, S.; Valh, J.V.; Željko, T.; Vončina, B.; Lobnik, A. Comparative Study of Reactive Dyes Oxidation by H2O2/UV, H2O2/UV/Fe2+ and H2O2/UV/Fe° Processes. Ozone Sci. Eng. 2016, 39, 14–23. [Google Scholar] [CrossRef]
  12. Feddal, I.; Ramdani, A.; Taleb, S.; Gaigneaux, E.M.; Batis, N.; Ghaffour, N. Adsorption capacity of methylene blue, an organic pollutant, by montmorillonite clay. Desalin. Water Treat. 2013, 52, 2654–2661. [Google Scholar] [CrossRef] [Green Version]
  13. Bhatnagar, A.; Sillanpää, M. Utilization of agro-industrial and municipal waste materials as potential adsorbents for water treatment—A review. Chem. Eng. J. 2010, 157, 277–296. [Google Scholar] [CrossRef]
  14. Amin, M.; Alazba, A.; Shafiq, M. Effective adsorption of methylene blue dye using activated carbon developed from the rosemary plant: Isotherms and kinetic studies. Desalin. Water Treat. 2017, 74, 336–345. [Google Scholar] [CrossRef]
  15. Hagemann, N.; Spokas, K.; Schmidt, H.-P.; Kägi, R.; Böhler, M.; Bucheli, T. Activated Carbon, Biochar and Charcoal: Linkages and Synergies across Pyrogenic Carbon’s ABCs. Water 2018, 10, 182. [Google Scholar] [CrossRef] [Green Version]
  16. Sen, T.K. Review on Dye Removal from Its Aqueous Solution into Alternative Cost Effective and Non-Conventional Ad-sorbents. J. Chem. Process Eng. 2013, in press. [Google Scholar] [CrossRef] [Green Version]
  17. Zhang, T.; Zhu, X.; Shi, L.; Li, J.; Li, S.; Lü, J.; Li, Y. Efficient removal of lead from solution by celery-derived biochars rich in alkaline minerals. Bioresour. Technol. 2017, 235, 185–192. [Google Scholar] [CrossRef] [PubMed]
  18. Amin, M.T.; Alazba, A.A.; Shafiq, M. Adsorptive Removal of Reactive Black 5 from Wastewater Using Bentonite Clay: Isotherms, Kinetics and Thermodynamics. Sustainability 2015, 7, 15302–15318. [Google Scholar] [CrossRef] [Green Version]
  19. Ahmad, M.; Usman, A.R.A.; Rafique, M.I.; Al-Wabel, M.I. Engineered biochar composites with zeolite, silica, and nano-zerovalent iron for the efficient scavenging of chlortetracycline from aqueous solutions. Environ. Sci. Pollut. Res. 2019, 26, 15136–15152. [Google Scholar] [CrossRef]
  20. Daful, A.G.; Chandraratne, M.R. Biochar Production from Biomass Waste-Derived Material. In Encyclopedia of Renewable and Sustainable Materials; Elsevier: Amsterdam, The Netherlands, 2020; pp. 370–378. [Google Scholar]
  21. Patra, J.M.; Panda, S.S.; Dhal, N.K. Biochar as a low-cost adsorbent for heavy metal removal: A review. Int. J. Res. Biosci. 2017, 6, 1–7. [Google Scholar]
  22. Ahmad, A.; Khan, N.; Giri, B.S.; Chowdhary, P.; Chaturvedi, P. Removal of methylene blue dye using rice husk, cow dung and sludge biochar: Characterization, application, and kinetic studies. Bioresour. Technol. 2020, 306, 123202. [Google Scholar] [CrossRef]
  23. Gardazi, S.M.H.; Butt, T.A.; Rashid, N.; Pervez, A.; Mahmood, Q.; Shah, M.M.; Bilal, M. Effective adsorption of cationic dye from aqueous solution using low-cost corncob in batch and column studies. Desalin. Water Treat. 2016, 57, 28981–28998. [Google Scholar] [CrossRef]
  24. Li, G.; Zhu, W.; Zhang, C.; Zhang, S.; Liu, L.; Zhu, L.; Zhao, W. Effect of a magnetic field on the adsorptive removal of meth-ylene blue onto wheat straw biochar. Bioresour. Technol. 2016, 206, 16–22. [Google Scholar] [CrossRef] [Green Version]
  25. Banik, C.; Lawrinenko, M.; Bakshi, S.; Laird, D.A. Impact of Pyrolysis Temperature and Feedstock on Surface Charge and Functional Group Chemistry of Biochars. J. Environ. Qual. 2018, 47, 452–461. [Google Scholar] [CrossRef] [PubMed] [Green Version]
  26. Rashid, S.A.; Othman, R.N.I.R.; Hussein, M.Z. Synthesis, Technology and Applications of Carbon Nanomaterials; Elsevier: Amsterdam, The Netherlands, 2018. [Google Scholar]
  27. Doğan, M.; Alkan, M.; Demirbaş, Ö.; Özdemir, Y.; Özmetin, C. Adsorption kinetics of maxilon blue GRL onto sepiolite from aqueous solutions. Chem. Eng. J. 2006, 124, 89–101. [Google Scholar] [CrossRef]
  28. Alkan, M.; Doğan, M.; Turhan, Y.; Demirbaş, Ö.; Turan, P. Adsorption kinetics and mechanism of maxilon blue 5G dye on sepiolite from aqueous solutions. Chem. Eng. J. 2008, 139, 213–223. [Google Scholar] [CrossRef]
  29. Ghaedi, M.; Hossainian, H.; Montazerozohori, M.; Shokrollahi, A.; Shojaipour, F.; Soylak, M.; Purkait, M. A novel acorn based adsorbent for the removal of brilliant green. Desalination 2011, 281, 226–233. [Google Scholar] [CrossRef]
  30. Nandi, B.; Goswami, A.; Purkait, M. Adsorption characteristics of brilliant green dye on kaolin. J. Hazard. Mater. 2008, 161, 387–395. [Google Scholar] [CrossRef] [PubMed]
  31. Chowdhury, S.; Mishra, R.; Saha, P.; Kushwaha, P. Adsorption thermodynamics, kinetics and isosteric heat of adsorption of malachite green onto chemically modified rice husk. Desalination 2011, 265, 159–168. [Google Scholar] [CrossRef]
  32. Hamdaoui, O. Dynamic sorption of methylene blue by cedar sawdust and crushed brick in fixed bed columns. J. Hazard. Mater. 2006, 138, 293–303. [Google Scholar] [CrossRef] [PubMed]
  33. Taty-Costodes, V.; Fauduet, H.; Porte, C.; Delacroix, A. Removal of Cd(II) and Pb(II) ions, from aqueous solutions, by adsorption onto sawdust of Pinus sylvestris. J. Hazard. Mater. 2003, 105, 121–142. [Google Scholar] [CrossRef]
  34. Tang, H.; Zhou, W.; Zhang, L. Adsorption isotherms and kinetics studies of malachite green on chitin hydrogels. J. Hazard. Mater. 2012, 209–210, 218–225. [Google Scholar] [CrossRef] [PubMed]
  35. Gunay, A. Application of nonlinear regression analysis for ammonium exchange by natural (Bigadiç) clinoptilolite. J. Hazard. Mater. 2007, 148, 708–713. [Google Scholar] [CrossRef] [PubMed]
  36. Manohar, D.; Noeline, B.; Anirudhan, T. Adsorption performance of Al-pillared bentonite clay for the removal of cobalt(II) from aqueous phase. Appl. Clay Sci. 2006, 31, 194–206. [Google Scholar] [CrossRef]
  37. Rajoriya, R.K.; Prasad, B.; Mishra, I.M.; Wasewar, K.L. Adsorption of Benzaldehyde on Granular Activated Carbon: Kinetics, Equilibrium, and Thermodynamic. Chem. Biochem. Eng. Q. 2007, in press. [Google Scholar]
  38. Zaghouane-Boudiaf, H.; Boutahala, M.; Arab, L. Removal of methyl orange from aqueous solution by uncalcined and calcined MgNiAl layered double hydroxides (LDHs). Chem. Eng. J. 2012, 187, 142–149. [Google Scholar] [CrossRef]
  39. Aksu, Z.; Tezer, S. Exploited Application of Bacillus sp. ETL-A & Pseudomonas sp. ETL-B in Microbial Degradation of Orange 16 Dye. Process Biochem. 2014, 36, 431–439. [Google Scholar]
  40. Chiou, M.-S.; Li, H.-Y. Equilibrium and kinetic modeling of adsorption of reactive dye on cross-linked chitosan beads. J. Hazard. Mater. 2002, 93, 233–248. [Google Scholar] [CrossRef]
  41. Hamdaoui, O.; Naffrechoux, E. Modeling of adsorption isotherms of phenol and chlorophenols onto granular activated carbon: Part I. Two-parameter models and equations allowing determination of thermodynamic parameters. J. Hazard. Mater. 2007, 147, 381–394. [Google Scholar] [CrossRef] [PubMed]
  42. Mestre, A.; Pires, J.; Nogueira, J.; Carvalho, A. Activated carbons for the adsorption of ibuprofen. Carbon 2007, 45, 1979–1988. [Google Scholar] [CrossRef]
  43. Önal, Y.; Akmil-Başar, C.; Sarıcı-Özdemir, Ç. Elucidation of the naproxen sodium adsorption onto activated carbon pre-pared from waste apricot: Kinetic, equilibrium and thermodynamic characterization. J. Hazard. Mater. 2007, 148, 727–734. [Google Scholar] [CrossRef]
  44. Baccar, R.; Sarrà, M.; Bouzid, J.; Feki, M.; Blánquez, P. Removal of pharmaceutical compounds by activated carbon prepared from agricultural by-product. Chem. Eng. J. 2012, 211–212, 310–317. [Google Scholar] [CrossRef]
  45. Tan, I.; Ahmad, A.; Hameed, B. Adsorption isotherms, kinetics, thermodynamics and desorption studies of 2,4,6-trichlorophenol on oil palm empty fruit bunch-based activated carbon. J. Hazard. Mater. 2009, 164, 473–482. [Google Scholar] [CrossRef]
  46. Foo, K.Y.; Hameed, B.H. Preparation, characterization and evaluation of adsorptive properties of orange peel based activated carbon via microwave induced K2CO3 activation. Bioresour. Technol. 2012, 104, 679–686. [Google Scholar] [CrossRef]
  47. Malik, P. Use of activated carbons prepared from sawdust and rice-husk for adsorption of acid dyes: A case study of Acid Yellow 36. Dye. Pigment. 2003, 56, 239–249. [Google Scholar] [CrossRef]
  48. Kumar, P.S.; Ramakrishnan, K.; Gayathri, R. Removal of Nickel(II) from Aqueous Solutions by Ceralite IR 120 Cationic Ex-change Resins. J. Eng. Sci. Technol. 2010, 5, 232–243. [Google Scholar]
  49. Ramadoss, R.; Subramaniam, D. Removal of divalent nickel from aqueous solution using blue-green marine algae: Adsorption modeling and applicability of various isotherm models. Sep. Sci. Technol. 2019, 54, 943–961. [Google Scholar] [CrossRef]
  50. Saadi, R.; Saadi, Z.; Fazaeli, R. Determination of axial dispersion and overall mass transfer coefficients for Ni (II) adsorption on nanostructured γ-alumina in a fixed bed column: Experimental and modeling studies. Desalin. Water Treat. 2015, 53, 2193–2203. [Google Scholar] [CrossRef]
  51. Dawood, S.; Sen, T.K.; Phan, C. Synthesis and characterization of slow pyrolysis pine cone bio-char in the removal of organic and inorganic pollutants from aqueous solution by adsorption: Kinetic, equilibrium, mechanism and thermodynamic. Bioresour. Technol. 2017, 246, 76–81. [Google Scholar] [CrossRef] [Green Version]
  52. Kyi, P.P.; Quansah, J.O.; Lee, C.-G.; Moon, J.-K.; Park, S.-J. The Removal of Crystal Violet from Textile Wastewater Using Palm Kernel Shell-Derived Biochar. Appl. Sci. 2020, 10, 2251. [Google Scholar] [CrossRef] [Green Version]
  53. Zubair, M.; Mu’Azu, N.D.; Jarrah, N.; Blaisi, N.I.; Aziz, H.A.; Al-Harthi, M.A. Adsorption Behavior and Mechanism of Methylene Blue, Crystal Violet, Eriochrome Black T, and Methyl Orange Dyes onto Biochar-Derived Date Palm Fronds Waste Produced at Different Pyrolysis Conditions. Water Air Soil Pollut. 2020, 231, 240. [Google Scholar] [CrossRef]
  54. Wathukarage, A.; Herath, I.; Iqbal, M.C.M.; Vithanage, M. Mechanistic understanding of crystal violet dye sorption by woody biochar: Implications for wastewater treatment. Environ. Geochem. Health 2019, 41, 1647–1661. [Google Scholar] [CrossRef] [PubMed]
  55. Fan, S.; Wang, Y.; Wang, Z.; Tang, J.; Tang, J.; Li, X. Removal of methylene blue from aqueous solution by sewage sludge-derived biochar: Adsorption kinetics, equilibrium, thermodynamics and mechanism. J. Environ. Chem. Eng. 2017, 5, 601–611. [Google Scholar] [CrossRef]
  56. Sewu, D.; Jung, H.; Kim, S.S.; Lee, D.S.; Woo, S.H. Decolorization of cationic and anionic dye-laden wastewater by steam-activated biochar produced at an industrial-scale from spent mushroom substrate. Bioresour. Technol. 2019, 277, 77–86. [Google Scholar] [CrossRef] [PubMed]
  57. Mahdi, Z.; Hanandeh, A.E.; Yu, Q. Influence of Pyrolysis Conditions on Surface Characteristics and Methylene Blue Adsorption of Biochar Derived from Date Seed Biomass. Waste Biomass Valoriz. 2017, 8, 2061–2073. [Google Scholar] [CrossRef]
Figure 1. Scanning electron microscopy (SEM) images and energy-dispersive X-ray (EDX) spectra of the (a) Ec-bio, (b) Crystal Violet (CV) dye-loaded Ec-bio, and (c) Methylene Blue (MB) dye-loaded Ec-bio.
Sustainability 13 03600 g001
Figure 2. Fourier-transform infrared (FTIR) spectra of the Ec-bio before and after the adsorption of both the CV and MB dyes.
Sustainability 13 03600 g002
Figure 3. Variations in the adsorption capacity and removal efficiency of the (a) CV and (b) MB dyes by Ec-bio with time.
Sustainability 13 03600 g003
Figure 4. Variation in the (a) adsorption capacity and (b) the distribution coefficient with temperature for both the CV and MB dyes.
Sustainability 13 03600 g004
Figure 5. Influence of varying the amounts of (a) Ec-bio, (b) the solution pH, and the (c) initial dye concentrations on the uptake of the dyes and their removal efficiency.
Sustainability 13 03600 g005
Figure 6. Plots of the nonlinear and linear PSO and Elovich kinetic models to fit the adsorption data of the CV and MB dyes onto the Ec-bio.
Sustainability 13 03600 g006
Figure 7. Plots of the nonlinear and linear fitting of the Langmuir and Freundlich isotherm models to the adsorption data of both dyes onto the Ec-bio.
Sustainability 13 03600 g007
Table 1. Description of conventional nonlinear and linear kinetic and isotherm models.
ModelNonlinearLinearized
Kinetic
PFO q t = q e   ( 1 exp ( k 1 t ) ) log ( q e q t ) = log q e   k 1 2.303 t
PSO q t = q e 2 k 2 . t q e k 2 . t + 1 t q t = 1 k 2 q e 2 + 1 q e t
Elovich q t = 1 β ln ( 1 + α β t ) q t = β ln ( t ) + β ln ( α )
ID-WM q t = K i p t 1 / 2 + C
Isotherm
Langmuir q e = q m K L C e ( 1 + K L C e )   1 q e = 1 q m + ( 1 q m K L ) 1 C e
Freundlich q e = K F c e 1 n l o g q e = l o g K F + 1 n l o g C e
D–R q e = q m exp ( K D R ( R T   ln ( 1 + 1 C e ) ) 2 ) ln q e = ln q m   K D R ( ( R T   ln ( 1 + 1 C e ) ) 2 )
Halsey q e = exp ( ln k H   ln C e n H ) ln q e = 1 n H   ln   k H   1 n H   ln   C e
Temkin q e = R T H a d s ln   ( K T   C e ) q e = R T b T ln   A T + R T b T ln   C e
H–J q e = ( A H J B H J l o g C e ) 1 2 1 q e 2 = ( B H J A H J ) ( 1 A H J )   l o g C e
Jovanovic q e = q m ( 1 exp ( k j C e ) ) ln q e = ln q m k j C e
Table 2. Estimated values of the thermodynamic parameters of the adsorption of the CV and MB dyes onto the Ec-bio.
ParameterTemperature, °CCV DyeMB Dye
ΔH, kJ·mol−130–6016.110.52
ΔS, J·K−1 mol−10.0660.05
ΔG, kJ·mol−130−3.84902−4.65947
40−4.50691−5.16032
45−4.83586−5.41074
50−5.16481−5.66117
55−5.49376−5.9116
60−5.8227−6.16202
Table 3. Parameters of the conventional kinetic models (nonlinear and linear fitting) for the adsorption of both dyes onto the Ec-bio adsorbent at selected initial concentrations.
Kinetic ModelParameterNonlinearLinear Fitting
CV DyeMB DyeCV DyeMB Dye
2050205020502050
qe exp (mg g−1)38.8655.6766.01108.638.8655.6766.01108.6
PFOqe cal (mg g−1)36.8549.9362.691036.528.4511.8314.62
k1 (min−1)0.240.410.250.190.0190.0030.0170.009
R20.620.720.810.930.630.070.660.25
PSOqe cal (mg g−1)39.2248.5465.98108.638.5551.6366.23103.09
k2 (g mg−1 min−1)0.0100.0150.0060.0030.0110.0150.0070.013
h (mg g1 min−1)16.0334.2526.8632.6816.3240.6229.41142.86
R21.001.000.950.980.830.881.001.00
Elovichα (mg g−1 min−1)329.579753.8431.21301.1978.652519.1957.4642.55
β (g mg−1)0.240.240.130.074.244.127.5013.68
R20.90.690.910.840.910.710.920.85
ID–WMKip (mg g−1 min1/2)1.251.032.153.711.251.032.153.71
C (mg g−1)23.6538.6740.0161.0523.6538.6740.0161.05
R20.640.30.590.480.670.370.630.53
Table 4. Estimated values of the parameters in two-parameter isotherm models (nonlinear and linear fitting) for the adsorption of both dyes onto the Ec-bio adsorbent.
IsothermParameterCV DyeMB Dye
NonlinearLinearNonlinearLinear
qe exp, mg g−155.92 (against 80 mg L−1)123.33 (against 100 mg L−1)
Langmuirqm, mg g−154.754.64114.6114.6
KL, L mg−124.5926.1420.6820.68
RL0.00050.00050.00050.0005
R20.940.970.770.90
Freundlichqm, mg g−156.1957.11106.99128.3
KF, ((mg/g)(L/mg)1/n)47.1646.5888.4486.58
1/n0.040.0470.040.085
R20.630.730.970.98
D–Rqm, mg g−154.5854.57114.1113.60
KDR, (mol kJ−1)29.3 × 10−99.0 × 10−91.1 × 10−81.0 × 10−8
E, kJ mol−17.337.456.807.07
R20.940.960.750.98
Halseyqe cal, mg g−156.0655.76124.19132.14
nH−18.77−21.51−12.22−11.71
KH0.0000.0040.0000.073
R20.580.730.970.98
TemkinKT, L mg−13.23 × 1093.23 × 1098.4 × 1048.4 × 104
Hads, kJ mol−11172.151172.16317.53317.53
R20.670.710.990.99
H–JAHJ, mg g−1110410,000105920,000
BHJ11.6756.032
R20.60.750.950.91
Jovanovicqm, mg g−154.5449.61113.4289.22
Kj, L g−1−12.47−0.002−14.78−0.007
R20.940.150.70.57
Table 5. Adsorption capacities of Eucalyptus camaldulensis biochar in comparison to other biochar for both dyes.
AdsorbentTextile DyeMaximum Adsorption Capacity, mg g−1Reference
Pine cone biocharMB117.65[51]
Palm Kernel Shell-Derived BiocharCV24.45[52]
Date Palm Fronds Waste biocharMB206.61[53]
Gliricidia sepium wood biocharCV7.9[54]
Sewage sludge biocharMB24.10[55]
Spent mushroom substrate biocharCV255[56]
Date seed biocharMB42.6[57]
Ec-bioCV56This study
Ec-bioMB123.3This study
Publisher’s Note: MDPI stays neutral with regard to jurisdictional claims in published maps and institutional affiliations.

