Article

Radiating Benefit of Windbreak and Sand Fixation in the Baijitan Nature Reserve of Lingwu, Ningxia, China

1
School of Ecology and Nature Conservation, Beijing Forest University, Beijing 100083, China
2
China National Forestry–Grassland Economics and Development Research Center, Beijing 100714, China
3
Ningxia Lingwu Baijitan National Nature Reserve Administration, Yinchuan 751400, China
*
Author to whom correspondence should be addressed.
Sustainability 2021, 13(6), 3508; https://doi.org/10.3390/su13063508
Submission received: 27 January 2021 / Revised: 8 March 2021 / Accepted: 16 March 2021 / Published: 22 March 2021

Abstract

:
Many important ecosystem services show spatial flow characteristics, which are crucial for the study of environmental processes, such as the transformation, correlation, coordination, and management of ecosystem services at different scales. As a result, flow characteristics should be taken into account when it comes to the evaluation of ecosystem services. The study area was the Baijitan Nature Reserve, used to assess the radiating benefits of the windbreak and sand fixation from 2000 to 2019, based on wind erosion loss and sand spatial erosion models. The main results are as follows: Firstly, the fractional vegetation coverage (FVC) clearly increased over the last 20 years and the medium coverage, which accounted for 66.13%, became the main vegetation cover. The wind speed in the reserve dropped gradually as well. Secondly, sand only affected the nature reserve and the surrounding communities. When the wind speed was above a strong breeze (10.8–13.8 m/s), coarse silt could affect 26 downwind administrative regions, with an affected area of 2.13 × 10⁶ km2. Thirdly, the benefits of windbreak and sand fixation varied with the beneficial range, including distance from the Baijitan Nature Reserve and the beneficial area. Dust deposition decreased as the beneficial distance increased. For instance, Shaanxi Province saw the greatest benefit of windbreak and sand fixation, with a dust deposition reduction of 6.87 × 10⁷ t (1 t = 103 kg), followed by Hubei and Henan Provinces, with reductions of 5.31 × 10⁷ t and 5.59 × 10⁷ t, respectively. Fourthly, the periodical deposition in administrative regions decreased gradually, as did the different influence ranges. The dust depositions in the five phases of Shaanxi Province were 2.04 × 10⁷, 1.83 × 10⁷, 6.63 × 10⁶, 4.65 × 10⁶, and 3.48 × 10⁶ t. Fifthly, medium silt, fine silt, and clay silt could easily drift long distances under the influence of sand-driving wind, thus affecting the air quality in downwind administrative regions. Sixthly, the sand source in Baijitan Nature Reserve was an important factor that caused sand–dust weather in downwind areas. The frequency of sand–dust weather was significantly higher in cities near the sand source than in other regions in downwind areas, and the correlations between particle concentrations less than 10 microns in diameter (PM10) and the time sequences of sand-driving wind reached significant levels in certain cities. We found that the windbreak and sand fixation in Baijitan Nature Reserve could offer great benefits to the downwind area. Establishing a desert nature reserve could be a great way to promote environmentally sustainable development since it could effectively reduce dust deposition and the frequency of sand–dust weather in downwind areas.

1. Introduction

Ecosystem services are the benefits people obtain from ecosystems, such as the stuff of life, the regulation of the Earth’s climate, the filtration of wastes and pollutants, protection from extreme weather, and flood, fire, and disease regulation [1]. The benefits that ecosystem services provide are the conditions for all people to lead a decent, healthy, comfortable, and secure life [2]. Scientists around the world have been devoted to ecosystem services on different scales and the creation of systems to evaluate ecosystem services has become the forefront of ecological research [3]. Meanwhile, numerous achievements have been made in some fields such as forest [4], wetland [5,6], desert [7,8], grassland [9,10], ocean [11,12], farmland [13,14], urban [15,16,17,18] ecosystems, and nature reserves [19,20].
There are still some ecological issues that need to be identified. For example, how should the spatial flow characteristics of ecosystem services be measured? Some research in recent years has emphasized the importance of ecosystem services and summarized some simple but incomplete approaches to assessing the benefits of ecosystem services. Meanwhile, the spatial flow characteristics of ecosystem services have rarely been studied. The spatial flow characteristics of ecosystem services refer to the process by which the benefits provided by an ecosystem radiate to other areas. For instance, the windbreak and sand fixation effects of desert ecosystems can protect downwind areas from wind erosion. In addition, some regional protected areas that have an essential influence on industrial and agricultural production are easy to neglect when assessing ecosystem service benefits on a large scale. For instance, the Baijitan National Nature Reserve in Lingwu City of Ningxia (hereinafter referred to as the BNR), located at the edge of Mu Us Sandy Land, plays an important role in protecting the Yellow River, maintaining ecological security, and improving the ecological environment around it, while its major ecosystem services, windbreak and sand fixation, can reduce greatly the frequency of sand–dust weather in the downwind area. Since the establishment of the reserve, through years of exploration, desertification prevention and control has been established and the south and west expansion of the Mu Us Sandy Land has been prevented [21]. Scientific evaluation of the service value of desert ecosystems is of great significance to ecological restoration and reconstruction in arid areas, and also contributes to the sustainable development of the social economy in arid areas [7].
We selected BNR as a case study to evaluate the radiating benefits of windbreak and sand fixation. Here, fractional vegetation coverage (FVC), which can effectively reflect vegetation cover, growth state, biomass, etc., was used to study windbreak and sand fixation as important basic data, and this metric has been widely used in the study of vegetation dynamics [22,23]. For example, it has been used to calculate the sand-fixing function [24], ecosystem service benefit transfer [25], and the response of wind erosion dynamics [26]. The normalized difference vegetation index (NDVI) can effectively indicate the growth status of plants and the spatial distribution density of vegetation, so it is one of the most widely used vegetation indexes to reflect the vegetation coverage in a study area, corresponding to each pixel. In addition to this, we used the dust deposition, calculated by a wind erosion model, as the primary index to measure the benefits of windbreak and sand fixation effects. Recently, researchers have carried out a large number of wind erosion simulation studies in different regions using the Texas Tech Erosion Analysis Model (TEAM) [27], the Wind Erosion Prediction System (WEPS) model [28], the Modified Wind Erosion Equation Model (RWEQ) [29,30], and the Wind Erosion Loss Model [31]. Dong Zhibao’s Wind Erosion Loss Model, established on the basis of wind tunnel experiments and field observations, has been applied in arid and semi-arid areas of China in many studies [32,33,34] and has obtained remarkable results. Similarly, we calculated the dust deposition in downwind areas of the BNR using this model.
Accordingly, it is necessary to study the radiating benefits of ecosystem services in order to provide a theoretical basis for establishing an evaluation system, which can be used to estimate the value of desert ecosystem services in nature reserves.

2. Materials and Methods
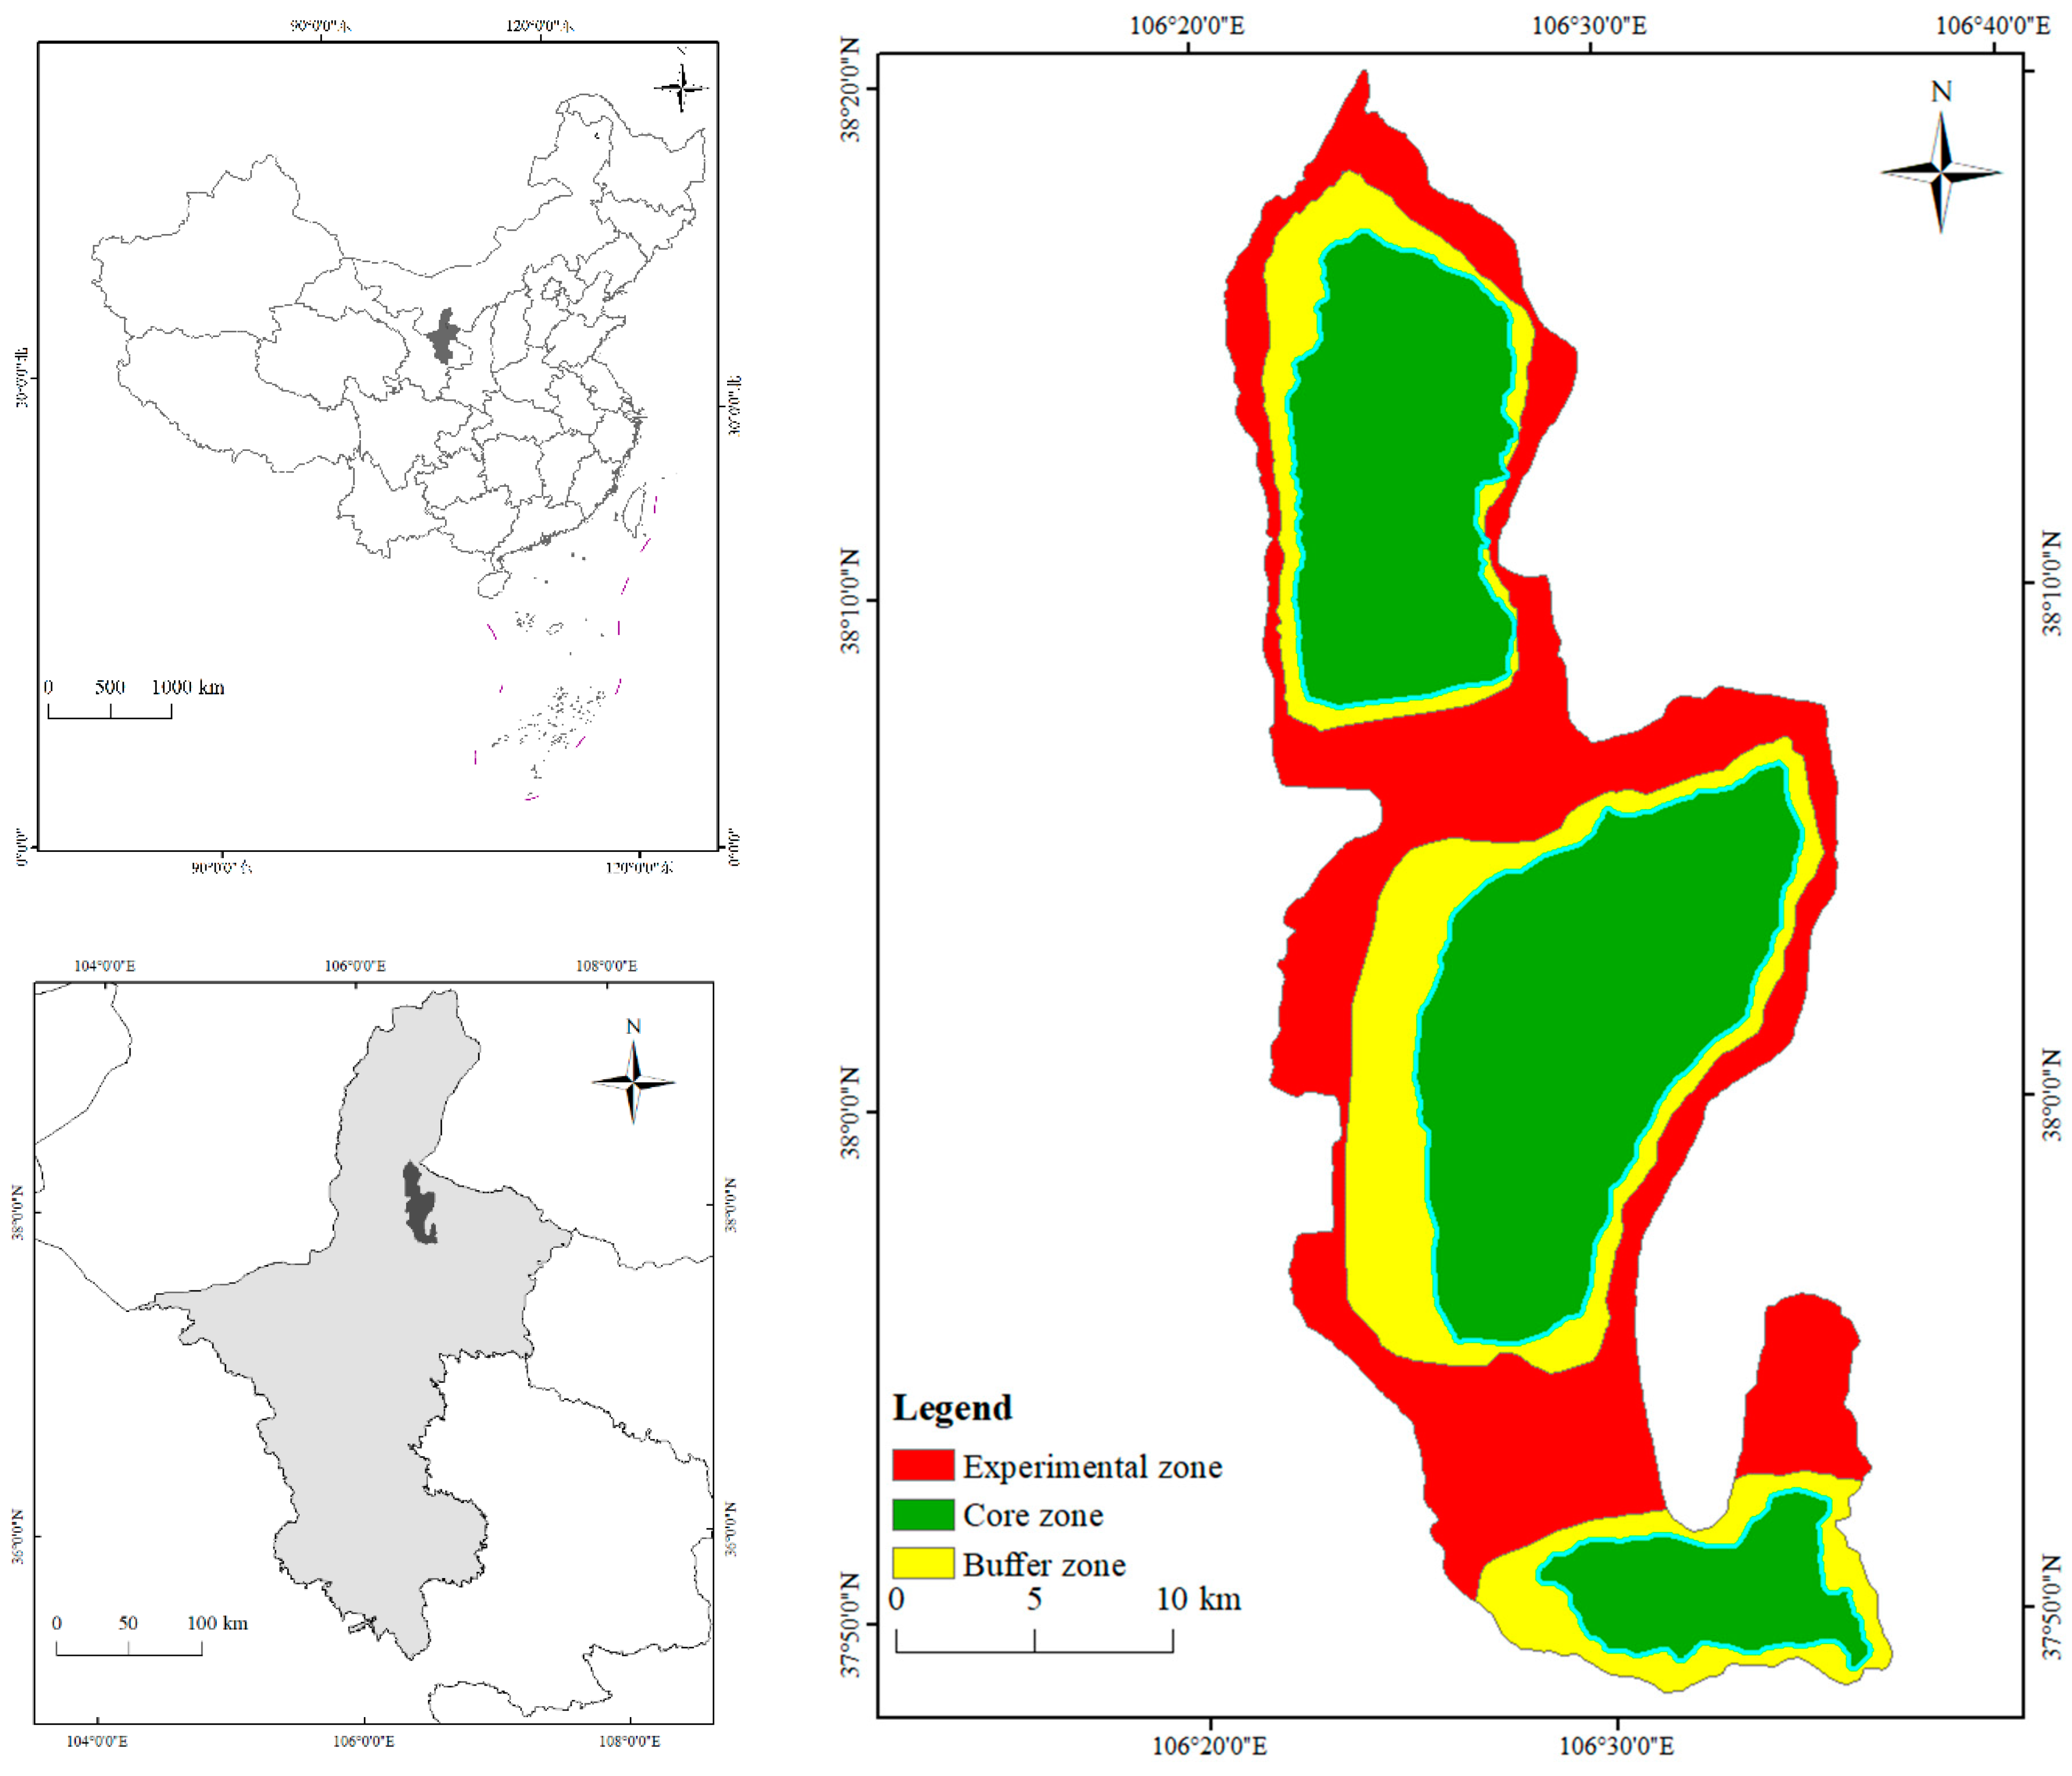
2.1. Study Area

The BNR was designated as a national nature reserve in April 2000. It lies at the edge of the Mu Us desert and the desert area in the eastern part of the Yellow River diversion irrigation area in Lingwu City, Ningxia, China (Figure 1), and has a relatively fragile ecological environment. The BNR is situated between 37°49′05″ and 38°20′54″ N and 106°20′22″ and 106°37′19″ E and measures 61 km from north to south and 21 km from east to west, with a total area of approximately 748.43 km2, which is about a quarter of the size of Lingwu City. The core area of the BNR is 313.18 km2, the buffer area is 186.06 km2 and the experimental area is 249.19 km2. The northern part of the reserve is adjacent to Yinchuan Hedong International Airport, which is 10 km from Yinchuan City, and the western part of the reserve is adjacent to Qingtongxia City and Wuzhong City. Several national roads and provincial roads pass through BNR, enabling convenient transportation [21].
The BNR has typical continental climate characteristics. Its climate characteristics are dry conditions with small amounts of concentrated rainfall, extensive evaporation, long winters, short, hot summers, large temperature differences, long periods of sunshine, sufficient light energy, high wintertime and springtime wind and sand, and a short frost-free period. The average annual precipitation is 192.9 mm, with annual maximum and minimum precipitation of 352.4 and 80.4 mm, respectively, and the maximum daily precipitation is 95.4 mm. The maximum snow depth is 130 mm. The annual average temperature is 10.4 °C, and the accumulated temperature is 3351.3 °C. The average minimum temperature of approximately −6.7 °C occurs in January and the average maximum temperature of 24.7 °C occurs in July. The annual extreme maximum and minimum temperatures are 41.4 °C and −28 °C, respectively. This region has a maximum annual sunshine duration of 3011 h and an annual average sunshine duration of 2717 h. The average daily sunshine time is the longest in July at 12.1 h, and the shortest in December at about 9.5 h.

2.2. Data Sources

2.2.1. Remote Sensing Data Sources

We obtained normalized difference vegetation index (NDVI) data from the National Aeronautics and Space Administration Moderate-Resolution Imaging Spectroradiometer instrument, which has a temporal resolution of 16 d and a spatial resolution of 250 m. The dataset eliminated the effects of volcanic eruptions, solar altitude angles, cloud cover, and other factors [35,36]. The NDVI is calculated from the near-infrared band (0.7–1.1 μm) and the red band (0.4–0.7 μm).
N D V I = R N I R R r e d R N I R + R r e d
Here, RNIR is the reflectance in the near-infrared spectral region; Rred is the reflectance in the red spectral region.
The data used, known as the MOD13Q1 Vegetation Index, were in Hierarchy Data Format–Earth Observation System (HDF–EOS) format (https://ladsweb.nascom.nasa.gov/, accessed on 15 April 2020). We selected datasets from 2000 to 2019, with 23 volumes per year.
We used digital elevation model (DEM) data with a 30 m spatial resolution, known as GDEMDEM, from the geospatial data cloud platform of the Computer Network Information Centre of the Chinese Academy of Sciences (http://www.gscloud.cn/, accessed on 15 April 2020).

2.2.2. Meteorological Data Sources

We used meteorological data from the Lingwu meteorological station (No. 53614), which is the station nearest to the BNR, lying northwest of the reserve at 38°28′ N and 106°12′ E. The meteorological data included daily average wind speed, maximum wind speed, and wind direction (16 directions) from 2000 to 2019. We obtained these data from the China Meteorological Science Data Sharing Service Network (http://data.cma.cn, accessed on 25 October 2019). Weather data were from China’s National Environmental Monitoring Station (http://www.cnemc.cn, accessed on 26 May 2020) and weather net (http://www.tianqi.com, accessed on 26 May 2020). On the basis of different directions and different ranges of sand erosion, we selected 12 cities—Yulin, Yan’an, Xi’an, Changzhi, Zhengzhou, Shiyan, Jining, Wuhan, Zhangjiajie, Hangzhou, Nanchang, and Guilin—for statistics on the March–May air quality characteristics and sand–dust weather frequency from 2017 to 2019. Particles less than 10 microns in diameter (PM10) were measured as a daily index value to reflect air quality characteristics.

2.3. Data Processing

2.3.1. Remote Sensing Data Processing

We used the ArcGIS 10.7 software to convert the NDVI data into TIFF files and then projected, transformed and trimmed the data. We converted the coordinate system to geographic coordinates CGCS2000_3_Degree_GK_CM_105E; the central longitude was 105° E, and the data were D_China_2000. We resampled the data to a 250 m resolution to achieve the unification of spatial resolution and clipped the data based on the vector boundary of BNR with the ArcGIS Data Management tools. The maximum value composite method was used to calculate NDVI data from March to May. We obtained slopes for BNR on the basis of the DEM data via the ArcGIS Spatial Analyst tools.

2.3.2. Wind Speed Processing

Sand–dust weather mainly occurs in the late spring and early summer. This is because a lack of precipitation makes the surface in arid areas unusually dry and loose, leading to low resistance to wind erosion during this period [37]. Strong winds will blow a large amount of sand into the air, forming sand–dust weather. As a result of the high wind speeds, low precipitation and dry ground conditions, sand–dust weather occurs frequently from March to May in the BNR [21].
The condition for sand to move only when the wind speed reaches the sand-driving wind speed was affected primarily by the sand particle size [38]. To process the wind speed data [39], we first linearly interpolated the wind speed. Then, we computed the duration of maximum wind speeds greater than the sand-driving wind speed for winds from the west and northwest from March to May [40]. Lastly, the influence times of sand blown at different wind speed grades were calculated.

2.3.3. Periodic Division

In order to research the radiating benefit variation in windbreak and sand fixation in the BNR, the last 20 years can be divided into five phases based on the reserve construction and its overall plan: The first phase of 2000–2003 is the period where it was just promoted as a national nature reserve. The second phase is the period from 2004 to 2007 when the infrastructure was gradually standardized. The third phase is from 2008 to 2011, after the first adjustment of the function zoning. The fourth phase is from 2012 to 2015, after the second adjustment of the function zoning. The fifth phase is from 2016 to 2019, which is the period when the short-term plan of the overall plan was completed and the long-term one was implemented.

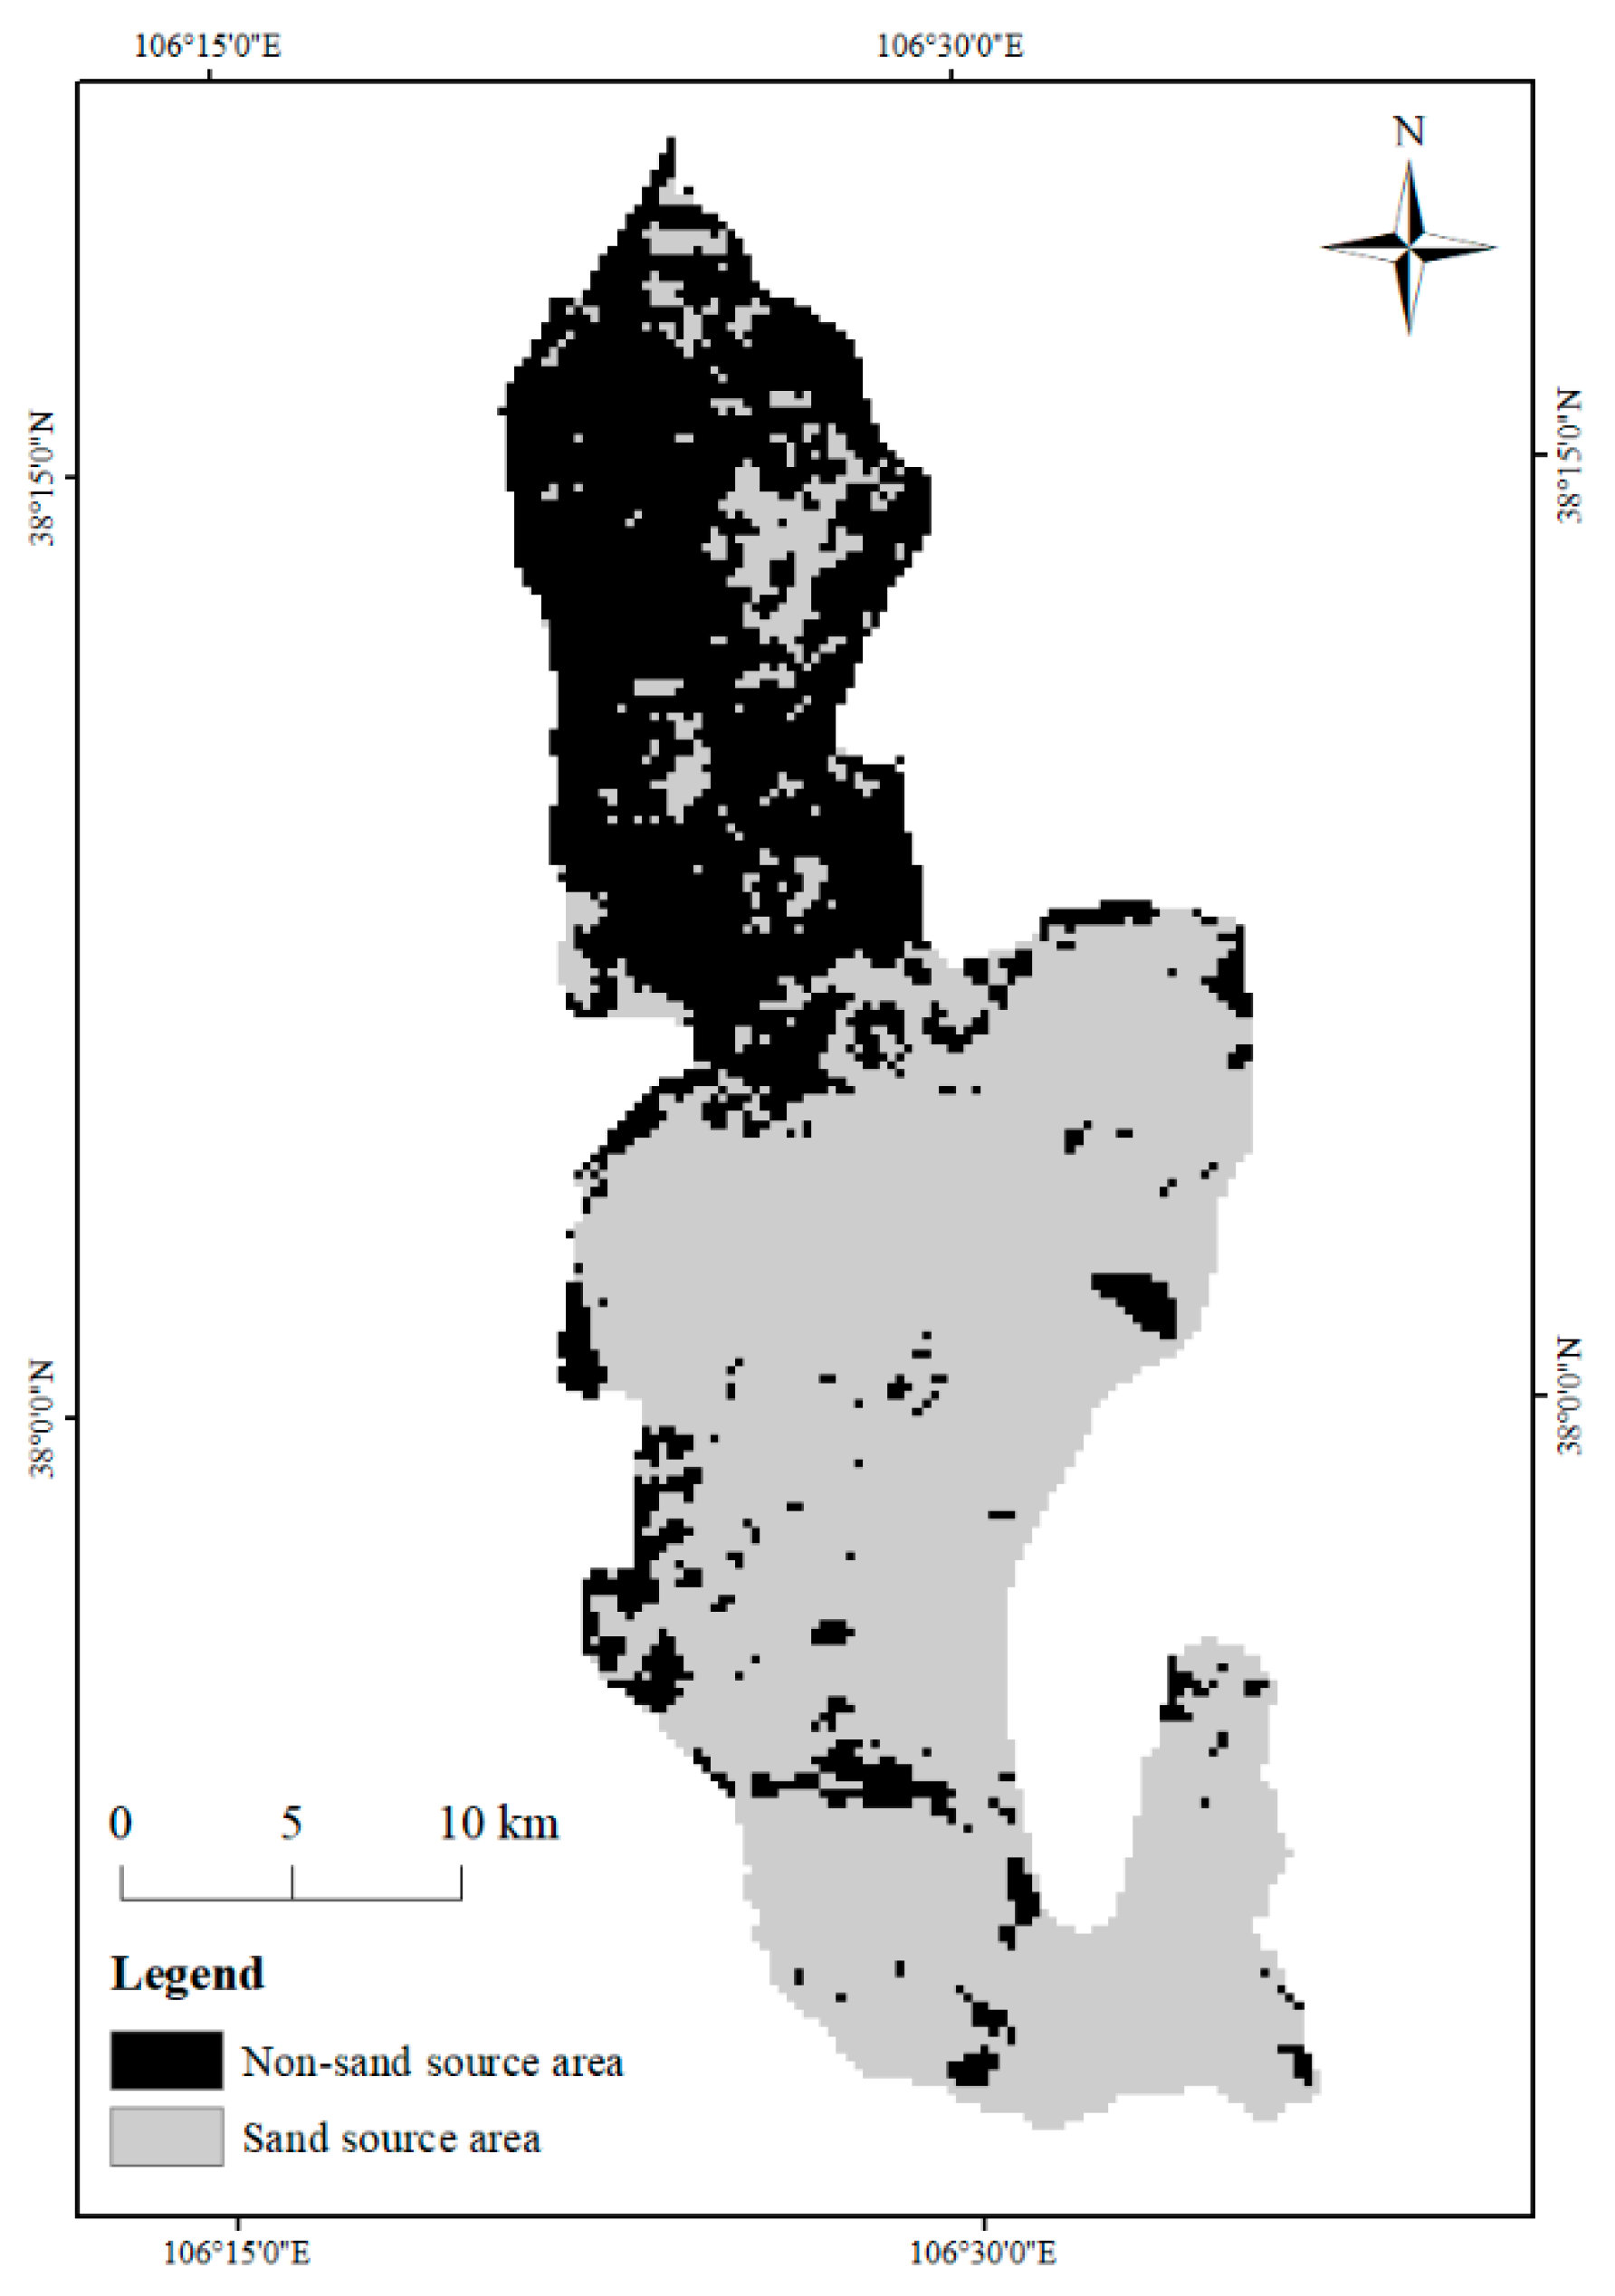
2.3.4. Distribution of Sand

The terrain of the BNR includes low mountains and hills, gently sloping hills, low mountains and hilly deserts. The wind erosion of soil is serious in the low mountains and hills and gently sloping hills, which are covered with thin soil and gravel [21]. The sand dune chain in the reserve comprises mainly star-type and barchan dunes in the eastern part of the desert, low mountains, and hills. The sand dunes in the western part of the desert low mountains and hills are high, dense, and continuous. We know that the distribution of sand in the reserve is mainly in the low mountain and hilly desert areas. We used remote sensing images with 2 m spatial resolution captured on 27 July 2016, to exclude the non-sand areas through supervised classification and visual interpretation with the ENVI software. Referring to relevant studies and combined with field investigation, we excluded rocky mountains, water areas, farmlands and other non-sand areas (Figure 2).

2.3.5. Influence Range Processing

We calculated the wind erosion distances of various types of particles under different wind speeds using a wind erosion distance model. We classified grain size on the basis of the particle composition of aeolian soil in the nature reserve [21,41], which is dominated by naturally mixed sands (Table 1) [42,43]. Previous studies showed that the sand-driving wind speed of mixed sand is 4.85 m·s−1 [44]. Then, we determined the wind speed grades on the basis of meteorological classification methods related to average and maximum wind speed (Table 2) [45]. Using ArcGIS, we drew the influence range of sand on a map of China on the basis of the propagation distance of sand particles of various sizes at different wind speeds.

2.4. Calculating Method

2.4.1. Method for Calculating Fractional Vegetation Coverage

There are many methods that use remote sensing data to estimate FVC [44,46,47,48,49,50,51,52]. Here, we used a pixel bisection model to estimate FVC on the basis of NDVI data. The calculation formula is as follows:
F V C = N D V I N D V I s o i l N D V I e v g N D V I s o i l
Here, NDVIveg is the pixel value of pure vegetation, which is close to 1 in theory but is affected by the vegetation type, soil conditions and other factors; NDVIsoil is the pixel value of pure soil, which is close to 0 in theory but is affected by atmosphere, surface humidity, surface roughness, soil type, and soil color. Different studies have used various methods for choosing NDVIveg and NDVIsoil. In the absence of detailed regional vegetation and soil spectral data for the Yinchuan City vegetation coverage inversion in the present study, we referred to the approximate estimation algorithm to calculate the NDVIsoil and NDVIveg values of 0.05 and 0.70, respectively [53,54,55,56,57,58,59].
According to [60], FVC can be divided into four types: poor coverage (<10%), low coverage (10–30%), medium coverage (30–50%), and high coverage (>50%).

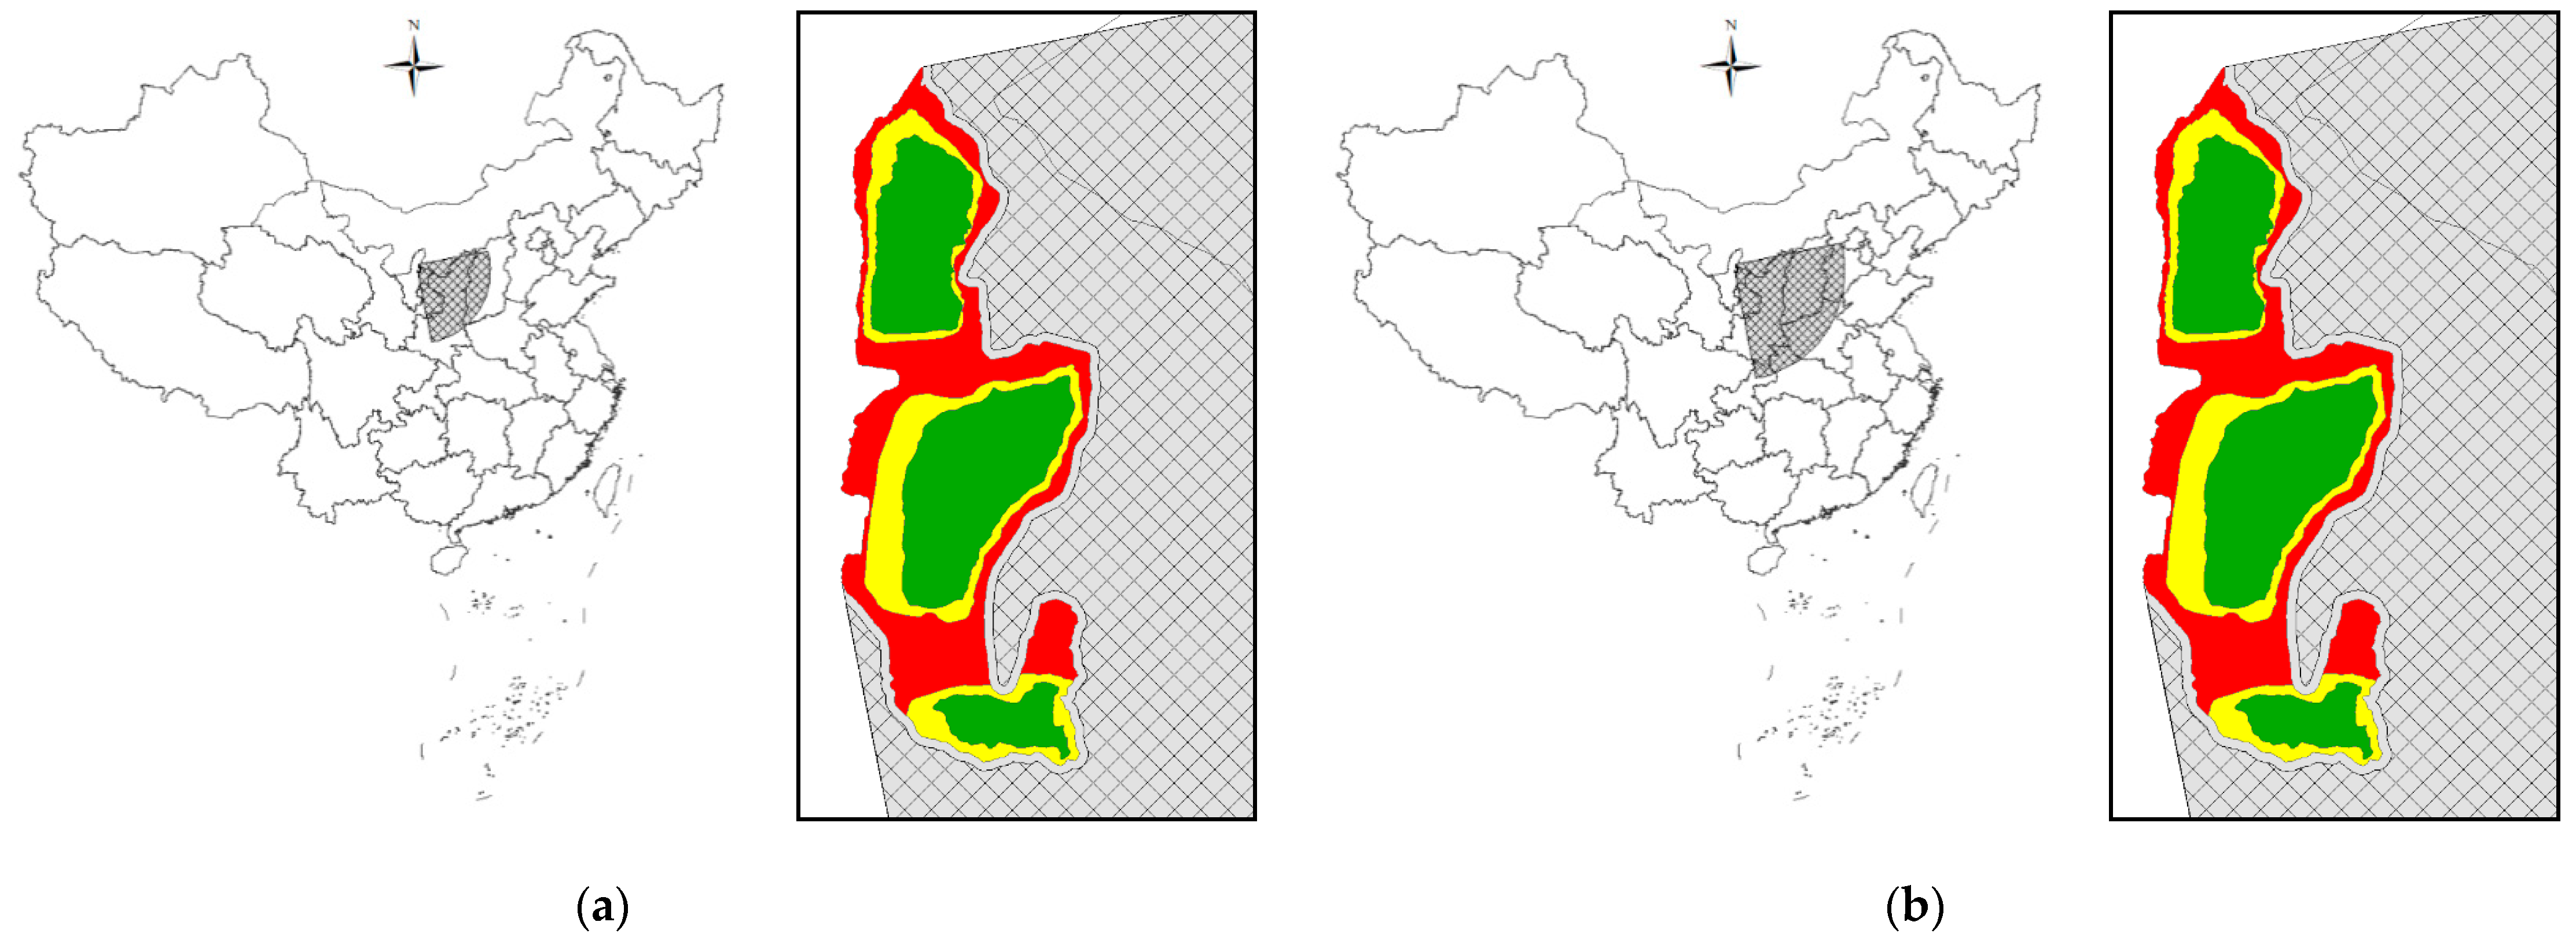
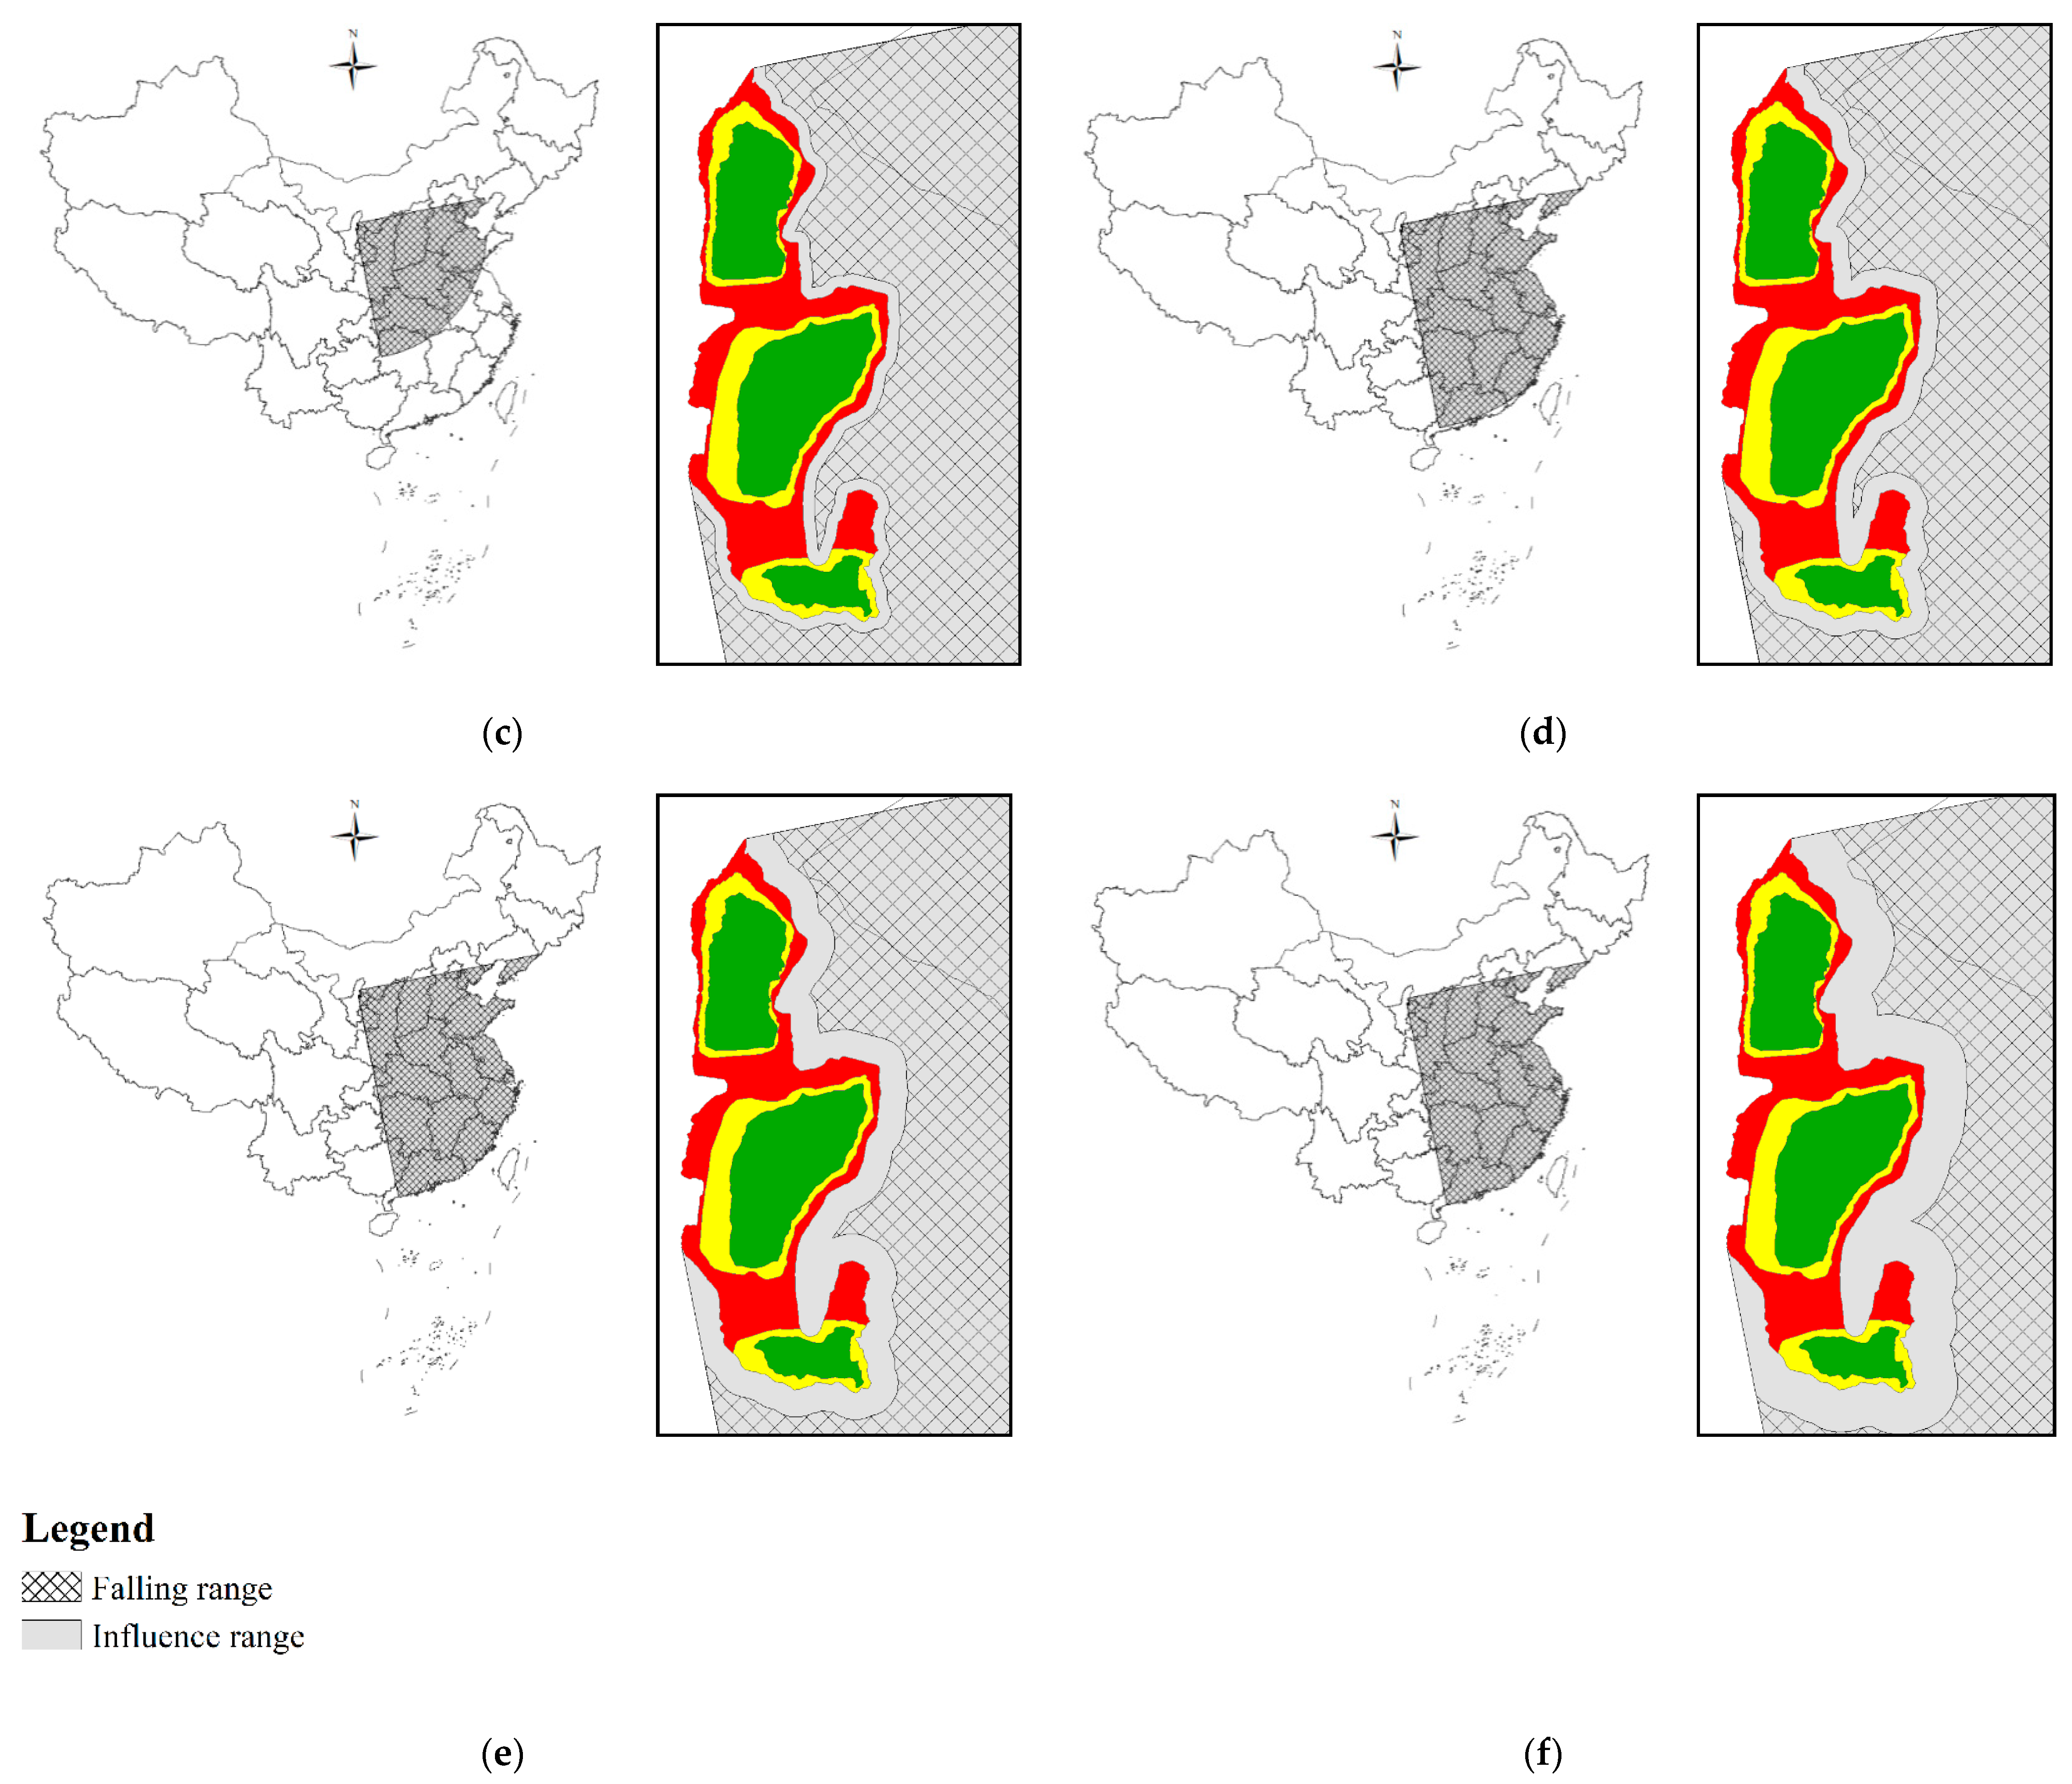
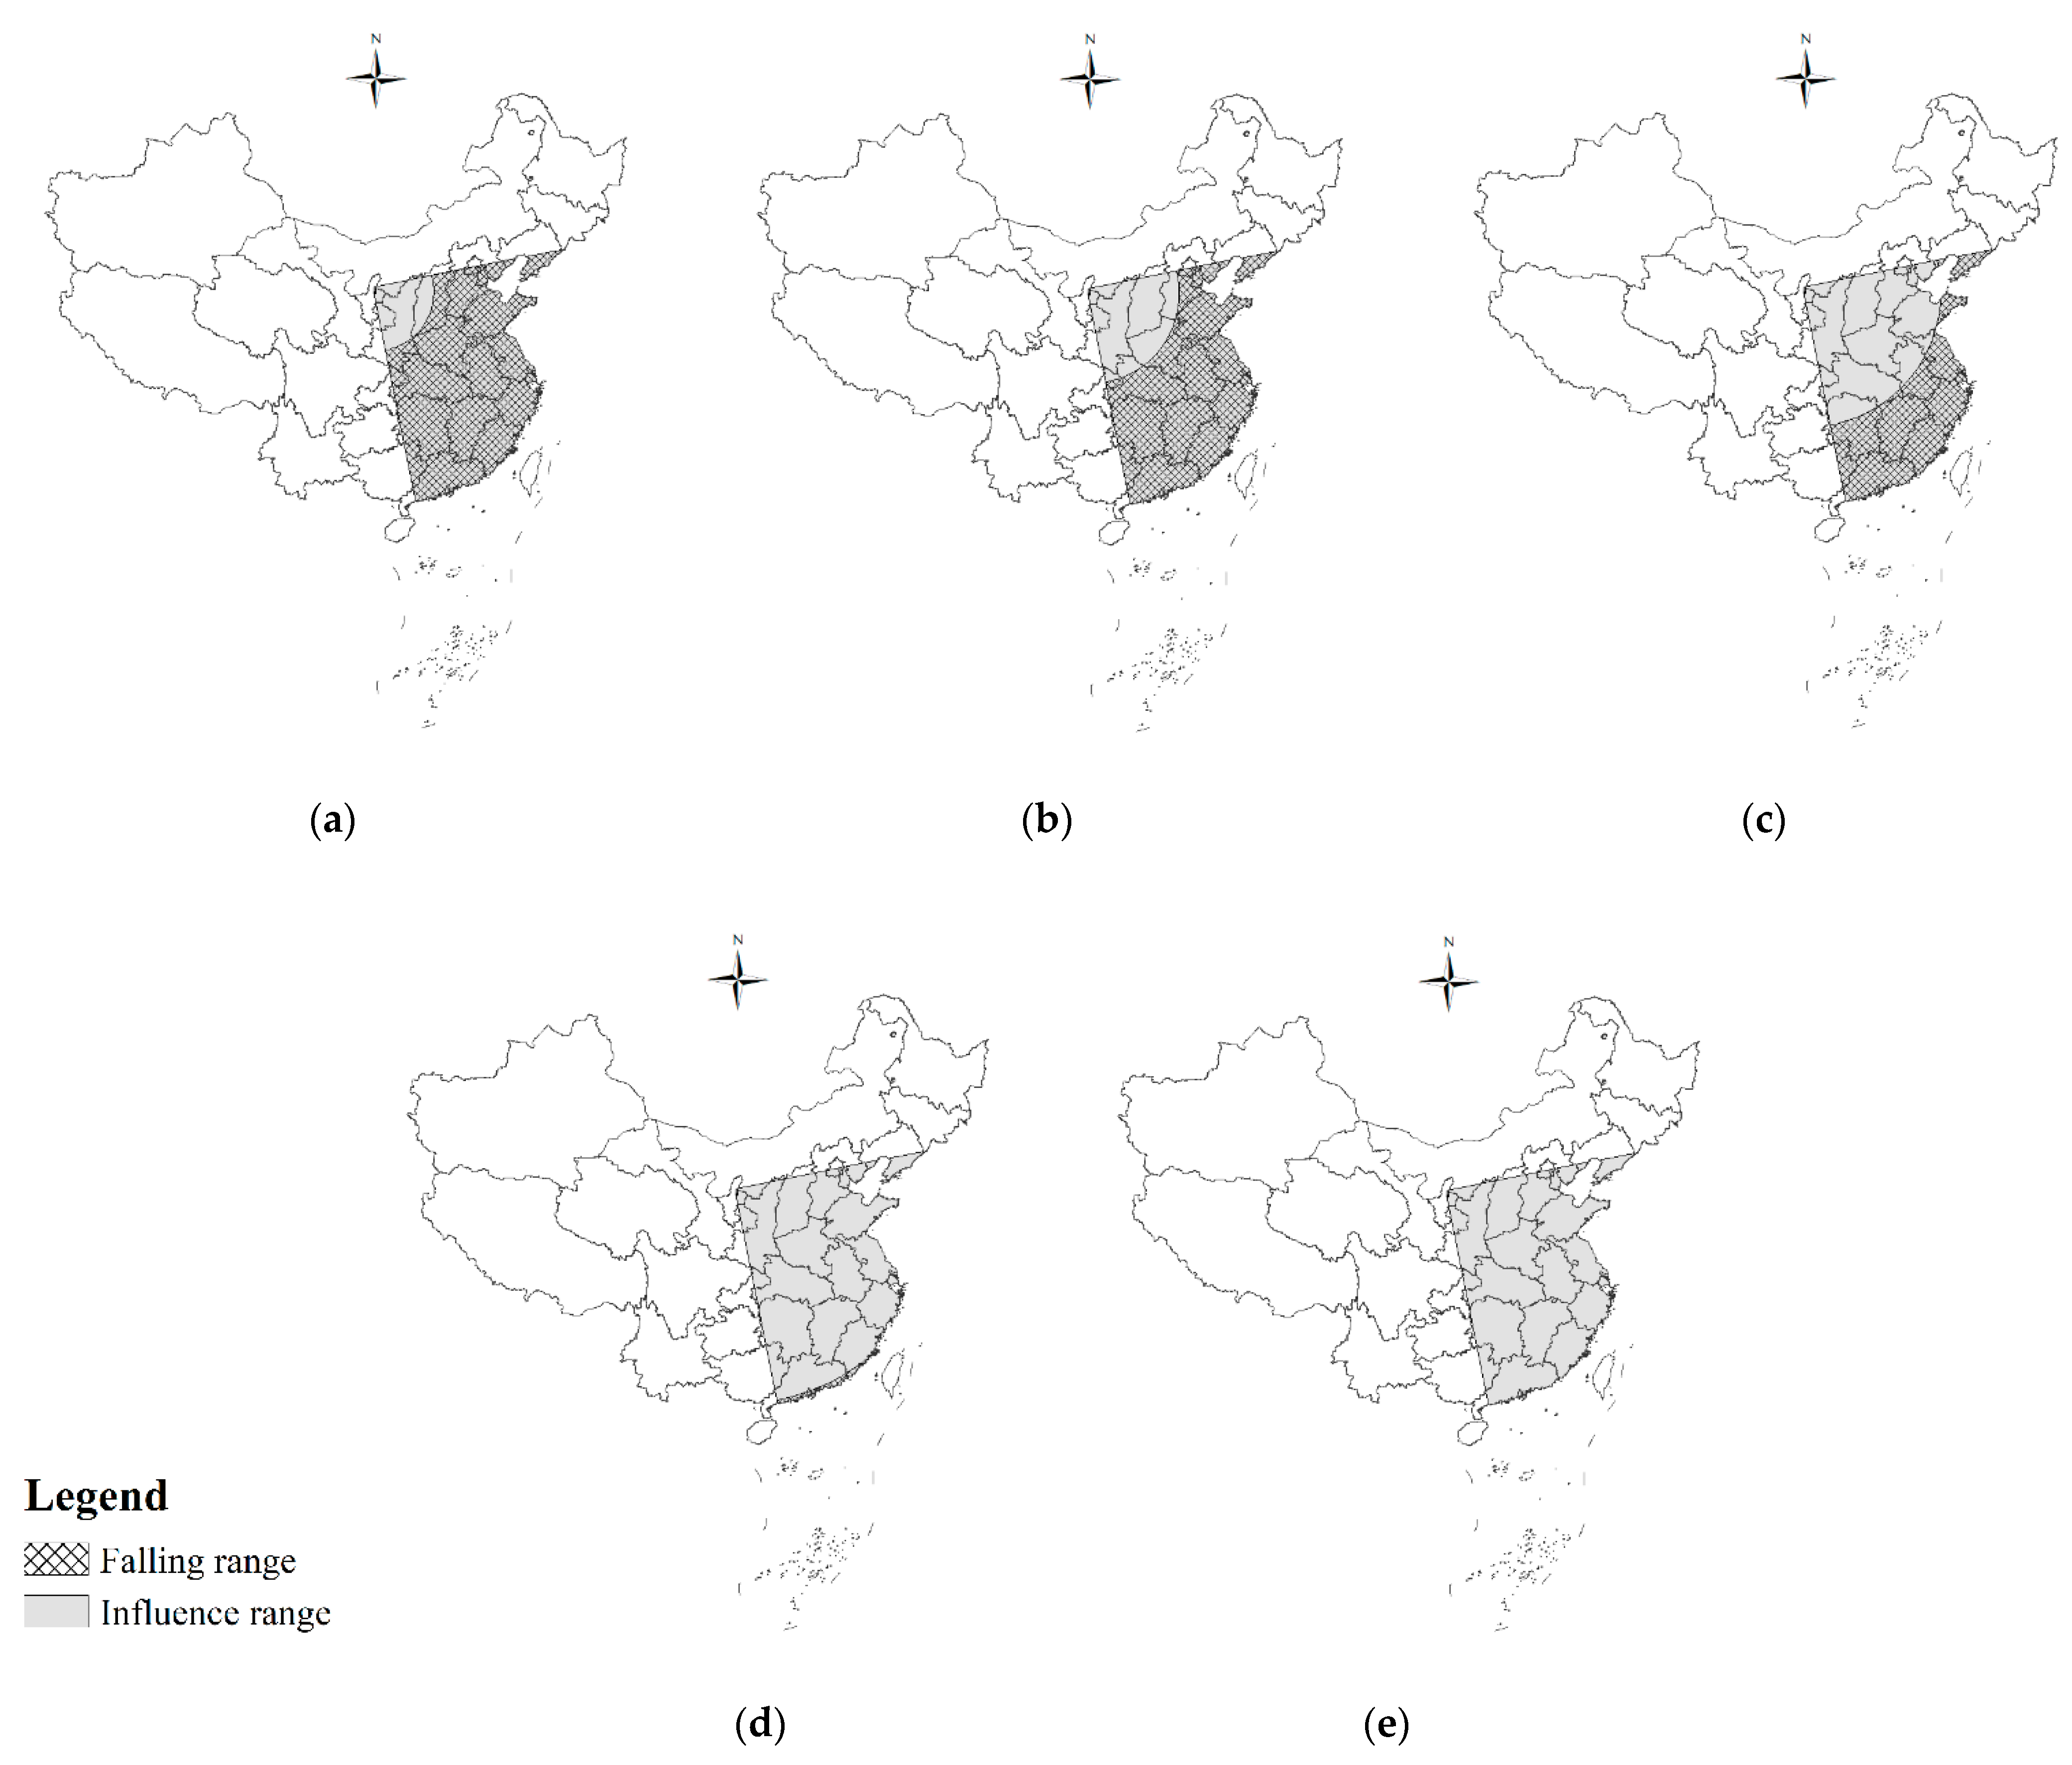
2.4.2. Method for Calculating Influence Range

The sand particle erosion distance varies under different wind speeds. On the basis of the average wind speed of different wind speed grades and the relationship between wind speed and the turbulent exchange coefficient, we calculated the erosion distance and times of different grain sizes under different wind speeds using von Karman’s empirical distance transmission formula:
L = 40 ε μ 2 V ρ s 2 g 2 d 4
t = 40 ε μ 2 ρ s 2 g 2 d 4
Here, L is the sand erosion distance (km); t is the duration of sand particles in the air (s); ε is the turbulent exchange coefficient (cm2·s−1), which changes with wind speed [32,33,34,61]; μ is the viscosity coefficient of air (1.98 × 10⁻⁵ Pa·s); V is the wind speed (m·s−1); ρs is the sand particle density (1.4 g·cm−3); g is the acceleration due to of gravity (10 m·s−2); and d is the sand grain size (mm).

2.4.3. Method for Calculating Wind Erosion

Dong Zhibao established a wind erosion loss model on the basis of the wind tunnel experiments and field observations of Liudaogou, a small watershed in Shaanxi Province at the northeast edge of Mu Us Sandy Land with a Loess Hill landform type covered by sheet sand [31]. This area is close to the BNR both in terms of its geographical location and natural conditions. This wind erosion loss model has been used in many studies and has achieved good results [32,33,34]. Therefore, we estimated wind erosion in the BNR on the basis of this model. We divided remote sensing data of the BNR into 11,811 250 m × 250 m grids. There was an error of 10 km2 between the reserve’s total area in the model and the actual situation because of the grid accuracy and clipping. By calculating the wind erosion amount per grid of sand source in the reserve, we could obtain the total wind erosion amount by adding the grids one by one. The specific wind erosion model of the sand area can be expressed as follows [31,32,33,34]:
Q = t x y { 3.90 ( 1.0413 + 0.04413 θ + 0.0021 θ 2 0.0001 θ 3 ) × [ V 2 ( 8.2 × 10 5 ) V c r S D R 2 ( H 8 d 2 F ) x , y , t ] } d x d y d t
Here, Q is wind erosion (t) (1 t = 103 kg); θ is slope (°); V is wind speed (m·s−1); VCR is vegetation coverage (%); SDR is the damage rate of an artificial surface structure (%), which was not considered in the present study, and thus, a value of 100% was taken; H is the relative humidity, which was calculated using the average relative humidity values from when the wind speeds exceeded the sand-driving wind speed (35% was the value used in the present study); D is the sand particle size (mm), with the average particle size of 0.025 mm taken; F is the soil hardness (n·cm−2), which refers to the parameter table of the soil texture model (0.9 n·cm−2 was taken); x and y are 0.25 km based on the grid size; and T is the duration (s), which is the total annual time where the wind speeds exceeded the sand-driving wind speed.

2.4.4. Method for Calculating Dust Deposition

The dust deposition amount is an important index for measuring wind erosion. The degree of influence of different administrative regions was evaluated by calculating the downwind dust deposition. We evaluated the benefits of windbreaks and sand fixation in the BNR by calculating the dust deposition reduction in downwind areas.
We used the following equation for calculating dust deposition in downwind areas:
S p = A p × i = n m Q i A i
Here, Sp is the dust deposition (t) with the influence range p of sand (Table 3); Ap is the area of the region with a given sand particle influence range level p (km2); m and n are the highest and lowest wind speed grades, respectively; Qi is the erosion amount of the nature reserve (t) when the wind speed is I; Ai is the falling range of sand (km2) when the wind speed is i; and i is the wind speed grade.
We used the following equation for calculating the dust deposition in different administrative regions:
S D = p ( S p × S D p A p )
Here, SD is the dust deposition in different administrative regions, with D representing the administrative region, and SDp is the area of different administrative regions in the area with the dust influence range p.
We used the following equation for calculating the dust deposition reduction in the reserve from 2000 to 2019.
S r = y = y s y e S y ( y e y s + 1 ) × S y s
Here, Sr is the dust deposition reduction (t); ys and ye are the starting and ending years, respectively, of the period in which the dust deposition reduction time series was calculated; y is the year in which the dust deposition occurred; Sy is the dust deposition in year y (t); and s y s is dust deposition in year ys (t).

2.4.5. Verification Method for Dust Deposition

We counted the days where sand or floating dust occurred in different cities and the days when the PM10 index did not reach the second level of air quality. We then used nonparametric analysis (Spearman’s rank correlation coefficient) to study the PM10 concentration response to different wind speeds [62,63]. We used the SPSS 22.0 software to analyze the correlation between PM10 and sand wind duration series (the current day, the next day, the third day, and the fourth day).

3. Results

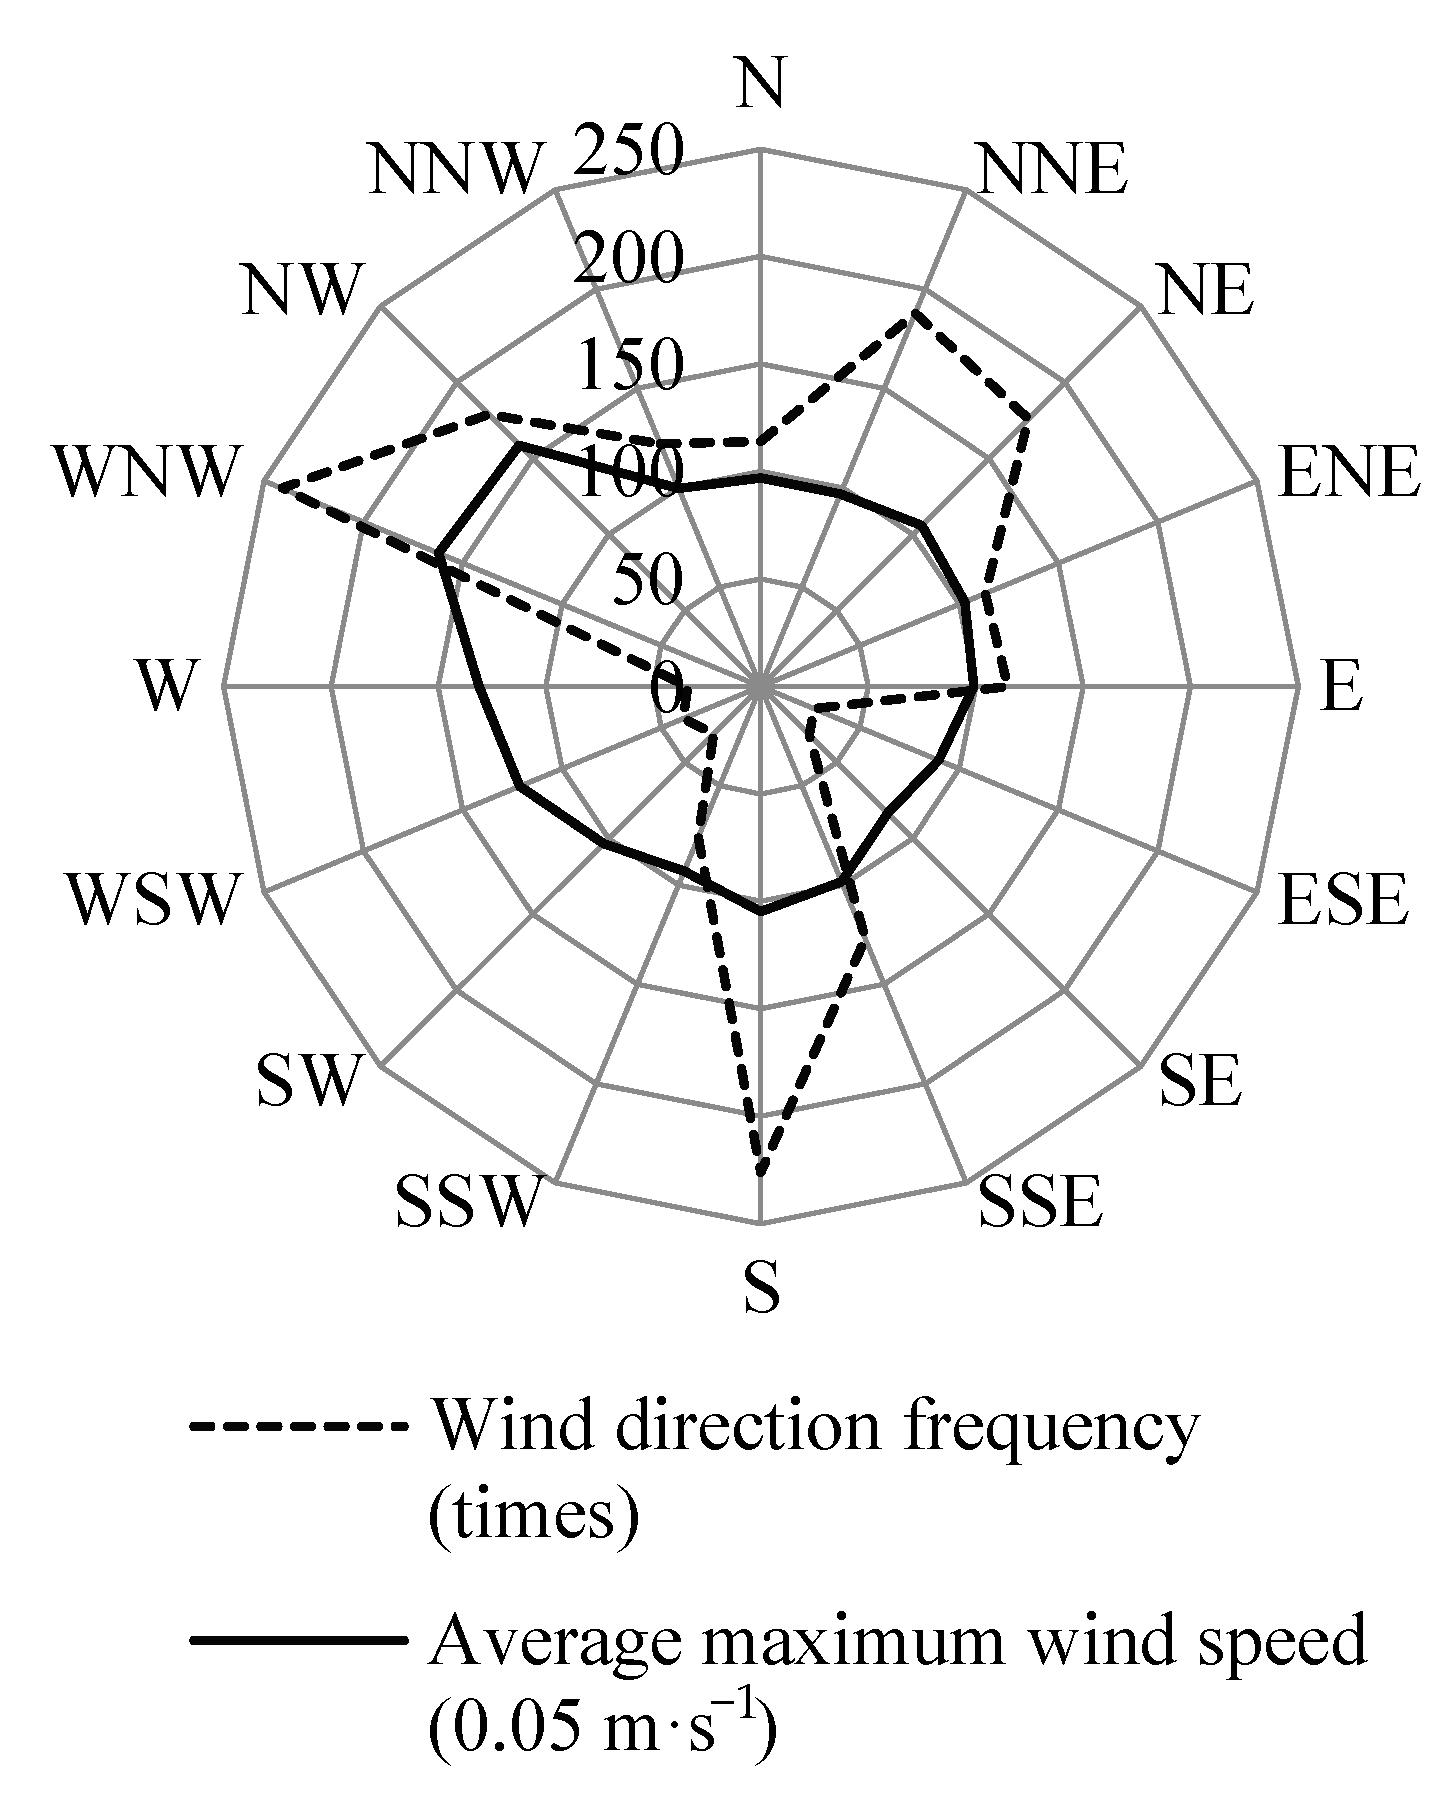
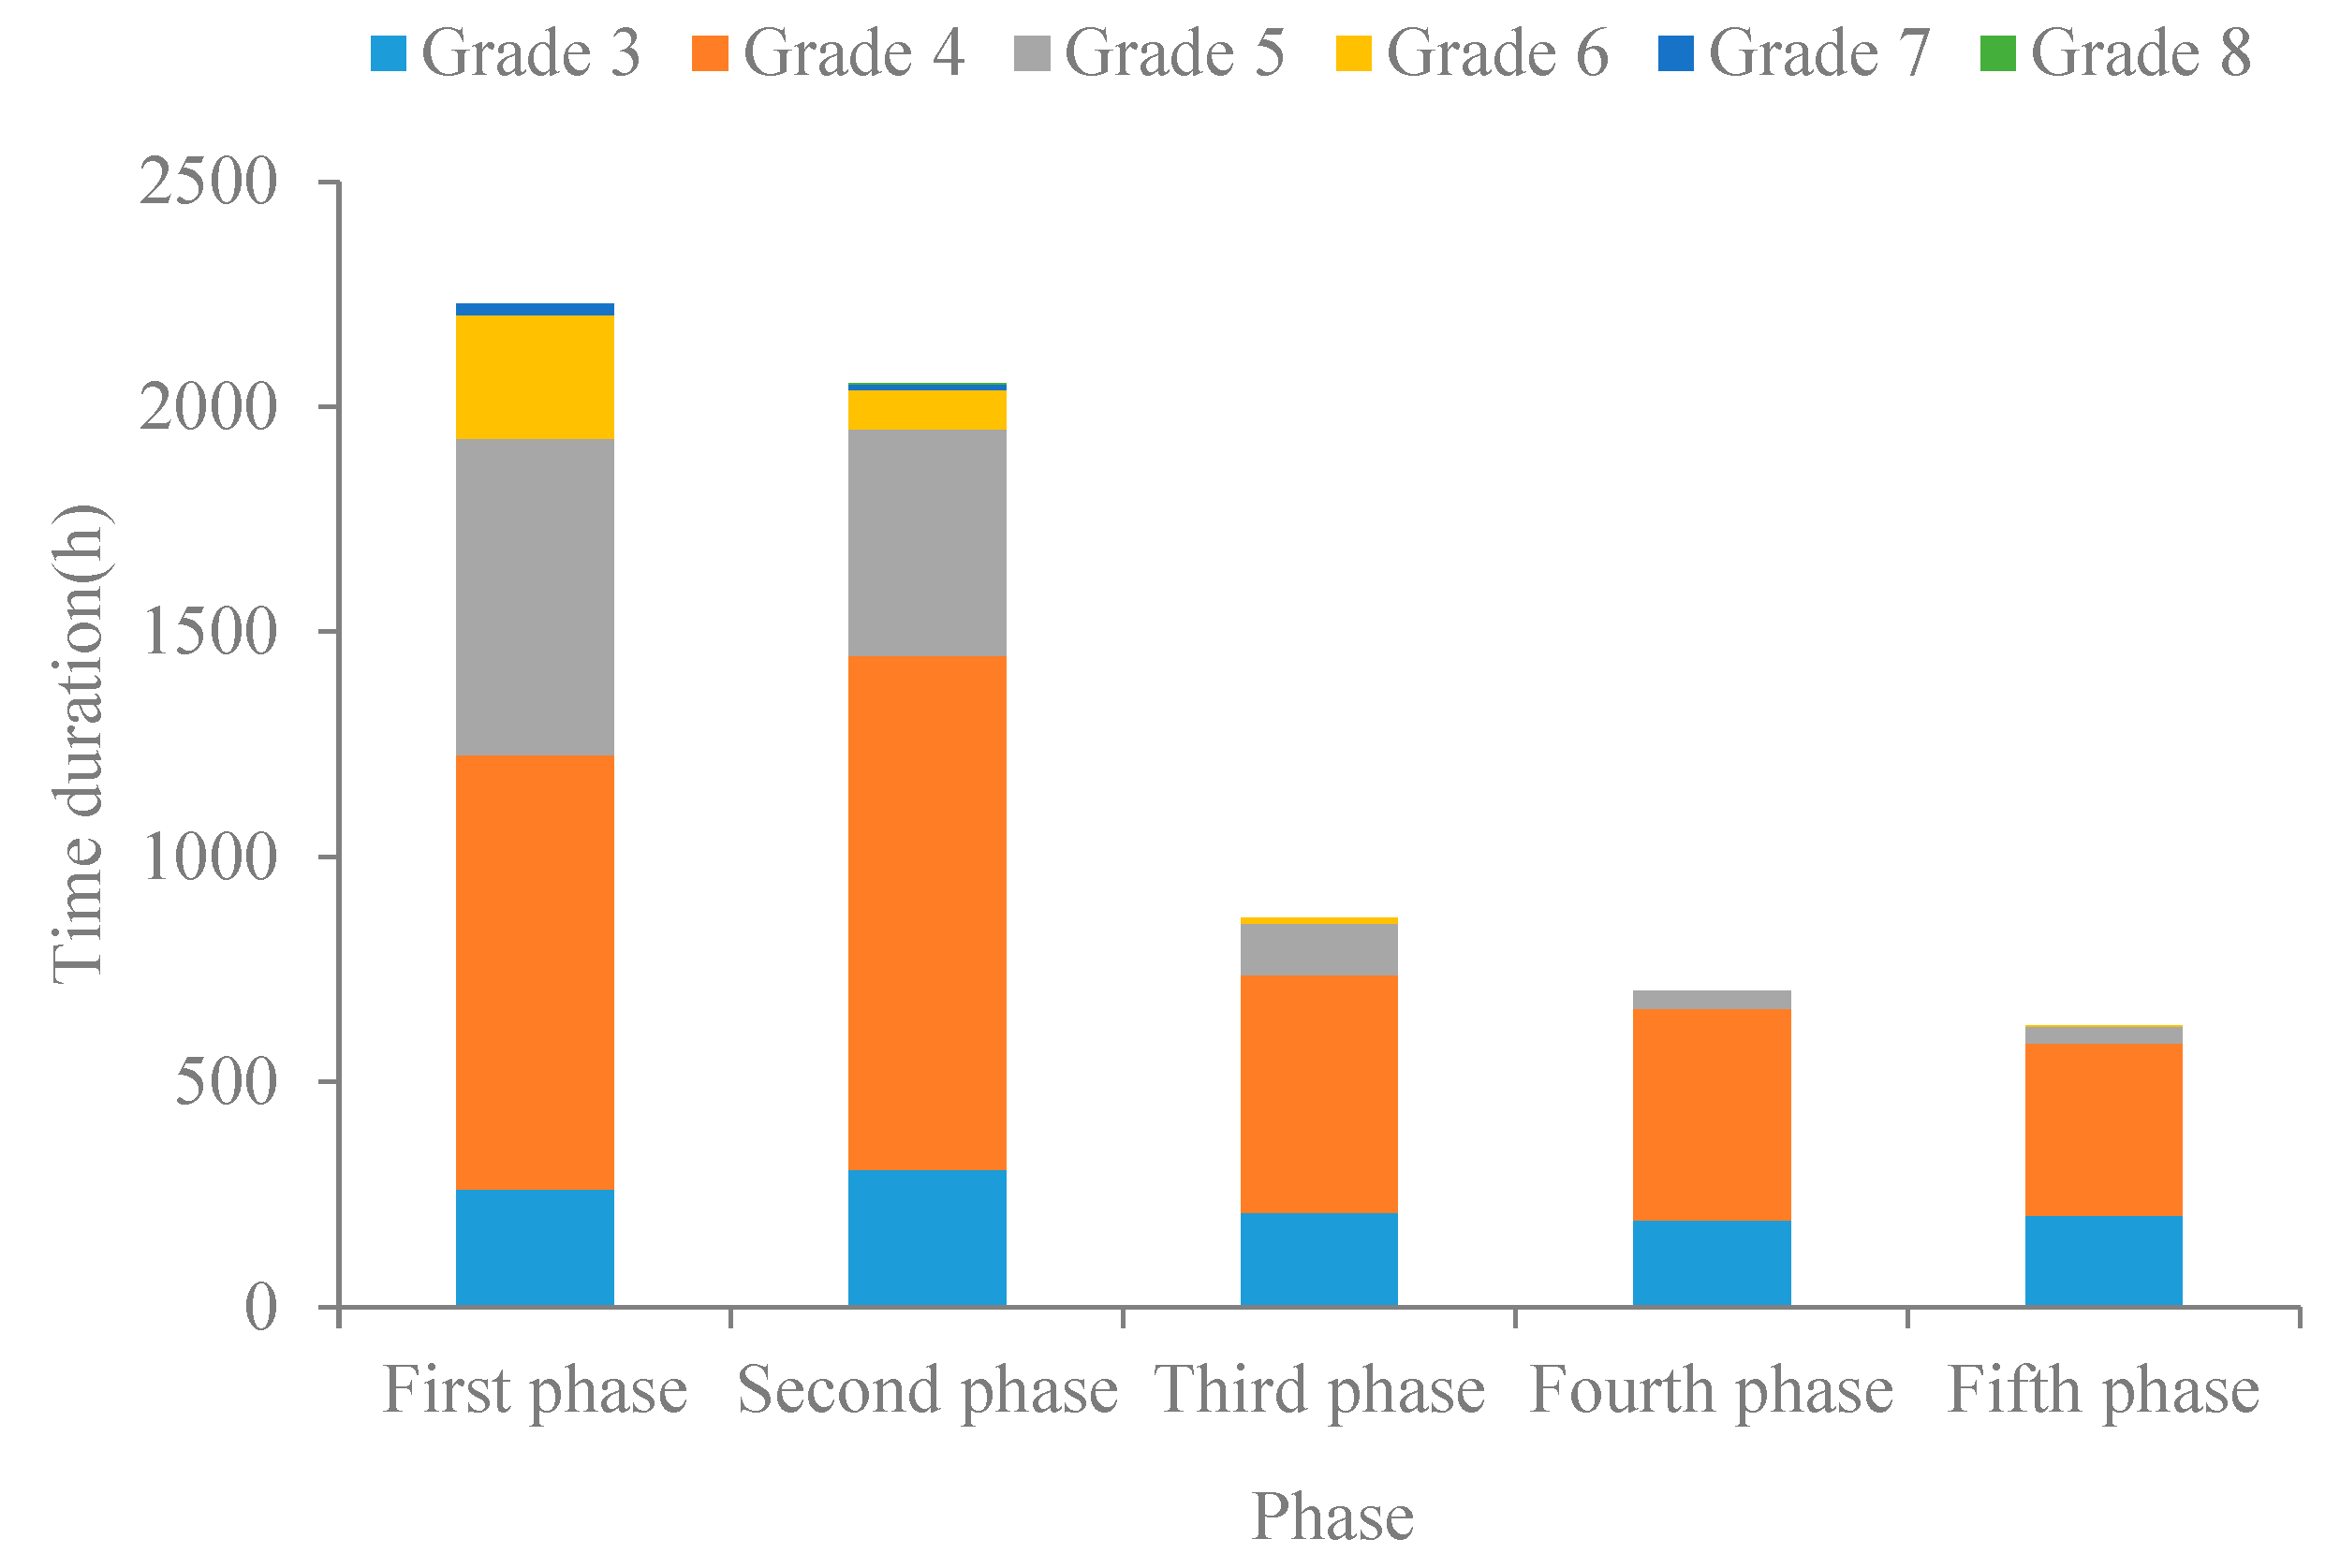
3.1. Analysis of Wind Speed

An analysis of the wind speeds in the reserve over the past 20 years (Figure 3) showed that high wind speeds from the WNW and NW occurred at frequencies of 10% and 9.72%, respectively, and the average wind speeds from the WNW and NW were 8.12 and 7.94 m·s−1, respectively. For winds from the W, the frequency was low, but the wind speed was high at an average of 6.55 m·s−1, which is second only to the WNW and NW winds.
Based on time variations in the wind-blown sand (Figure 4), strong breezes and moderate and fresh gales (grades 6, 7, and 8) mainly occurred in the first and second phases and moderate and fresh gales (grades 7 and 8) disappeared in the third phase. In addition, the duration of fresh breezes (grade 5) was significantly reduced from 702.05 h in the first phase to 37.36 h in the fifth phase. In addition to this, the change in moderate breezes (grade 4) was obvious as well because the duration of moderate breezes was getting smaller and smaller. It was, however, the dominant type of winds in the BNR, since its duration—nearly 400 h—in the fifth phase was the longest. The one that changed the least was gentle breeze (grade 3), which has the lowest potential to cause sand disasters compared with other types of winds. The duration of gentle breezes, over 200 h, was the second longest in the fifth phase.

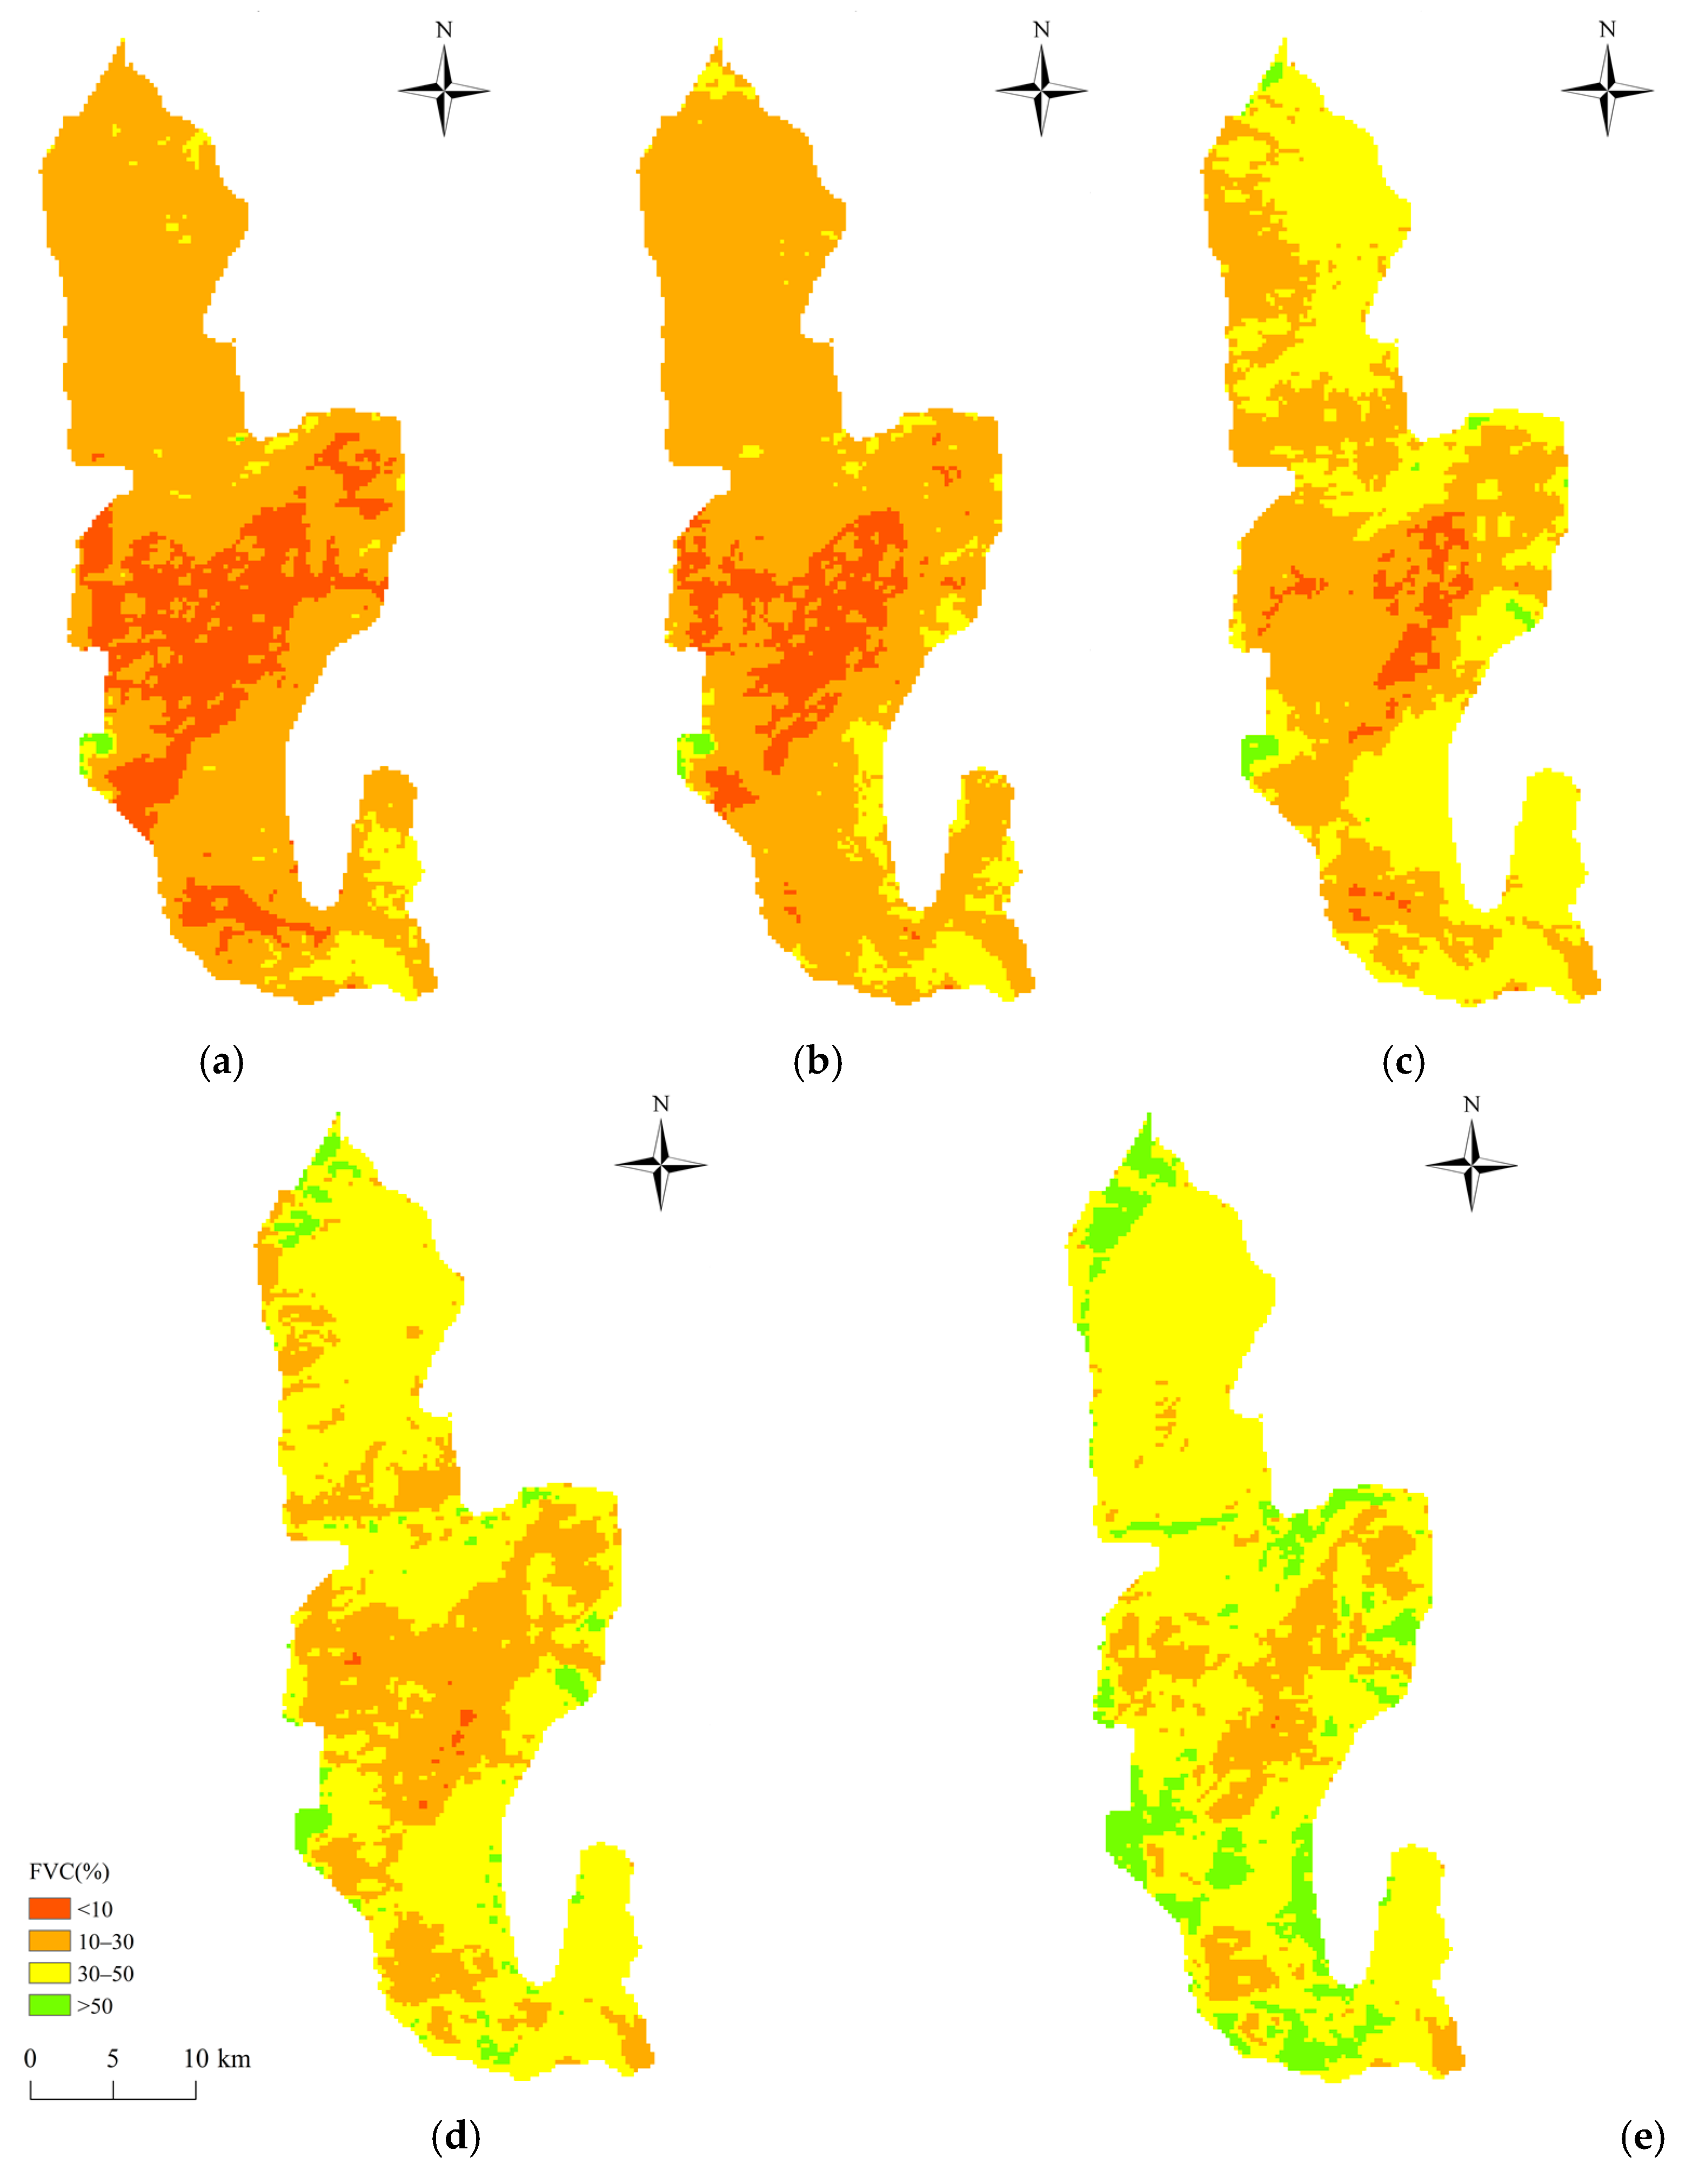
3.2. Analysis of Fractional Vegetation Coverage

According to the spatial distribution law of FVC in different phases (Figure 5), the FVC of BNR exhibited an increasing trend. The characteristics of vegetation cover types in different phases were obvious. In the first phase, low coverage had the absolute advantage, with an area of 555.25 km2, accounting for 75.22% of the total area of the reserve. Poor coverage, accounting for 21.11%, came second only to low coverage, with an area of 155.88 km2. The distribution of medium and high coverage was very small, together accounting for only 3.67% of the total area of the reserve. In the second phase, poor coverage decreased, and low coverage still accounted for the highest total area (81.95%). The area of the medium and high coverage types increased, increasing by 3.39% and 0.08%, respectively. Low coverage and medium coverage in the third phase became the main types, with a proportion of 94.90%. Poor coverage, accounting for only 0.32% in the fourth phase, became the least prevalent type and medium coverage, accounting for 54.96%, grew at a rapid rate, becoming one of the most prevalent vegetation types. In the fifth phase, low coverage gradually changed to medium coverage, and the area difference between them increased, with the proportion of medium coverage reaching 66.13%. High coverage increased significantly, with an area of 100.81 km2.

3.3. Attenuation by Windbreak and Sand Fixation

Based on the sand erosion distance and influence time (Table 4), the influence range varied under different wind speeds, showing the following characteristics:
Coarse sand, medium sand, fine sand and very fine sand only affected the reserve and surrounding communities. When the maximum wind speed was 17.4 m·s−1, the maximum influence distances of coarse sand, medium sand, fine sand and very fine sand were 4.72, 75.5, 290, and 4720 m, respectively, and the longest influence times were 0.03, 0.43, 16.79, and 268.71 s, respectively. The predominant movement modes were creeping and saltation.
Coarse silt can affect the downwind area under a moderate gale (grade 7) (Figure 6). Coarse silt can easily become a suspended load. Once the sand-driving wind speed of mixed sand is reached, coarse silt will move to high altitudes. Based on the influence range of coarse silt, when a gentle breeze (grade 3) occurred, the influence distance reached 508.05 km and the longest influence time was 26 h, and six administrative regions—Shanxi Province, Inner Mongolia Autonomous Region, Henan Province, Shaanxi Province, Gansu Province, and Ningxia Hui Autonomous Region—were affected. When a moderate breeze (grade 4) occurred, the influence distance reached 777.97 km and 10 administrative regions were affected. When a fresh breeze (grade 5) occurred, the influence distance reached 1184.99 km. The nearest distance between the reserve and the coastline was 957.67 km, and thus part of the influence range was beyond the coastline. In this case, 18 administrative regions were affected. When a strong breeze (grade 6) occurred, the maximum influence distance reached 1840.74 km, meaning that part of the influence range was beyond the coastline, and the longest influence time was 30 h. In this case, 26 administrative regions—Beijing Municipal, Tianjin Municipal, Hebei Province, Shanxi Province, Inner Mongolia Autonomous Region, Liaoning Province, Jilin Province, Shanghai Province, Jiangsu Province, Zhejiang Province, Anhui Province, Fujian Province, Jiangxi Province, Shandong Province, Henan Province, Hubei Province, Hunan Province, Guangdong Province, Guangxi Zhuang Autonomous Region, Hainan Province, Chongqing Municipal, Sichuan Province, Guizhou Province, Shaanxi Province, Gansu Province, and Ningxia Hui Autonomous Region—were affected.
When moderate and fresh gales (grades 7 and 8) occurred, the maximum influence distance exceeded the coastline (the longest distance between the reserve and the coastline is 1903.12 km), and the affected administrative area was the same as that affected by a strong breeze (grade 6). The longest impact times were 37 and 46 h.
When the sand-driving wind speed was reached, the air quality of the downwind region could be affected by medium, fine, and clay silt (Figure 7), which easily become suspended loads such as coarse silt. When the radiating distance reached 508.05 km, they began to descend gradually. When the wind speeds reached grades 7 and 8, the shortest radiating distance could reach 2871.86 km, which is enough to go beyond China’s coastline. Due to the influence of forests, mountain ranges, cities, and other factors, even if it does not reach the theoretical landing range, the medium silt, fine silt and clay will fall to different degrees.

3.4. Evaluating the Benefits of Windbreak and Sand Fixation

Based on the spatial distribution map of dust deposition over the past 20 years (Figure 8), the dust deposition in downwind areas decreased with increased distance. Based on the attenuation law, the influence range could be divided into four regions. In each of these regions, the deposition over the past 20 years tended to gradually decrease.
The influence area with an influence range level less than or equal to six was 2.43 × 10⁵ km2 and the dust deposition, accounting for 36.21% of the total dust deposition over the past 20 years, was 8.16 × 10⁷ t. The periodical depositions were 3.01 × 10⁷, 2.78 × 10⁷, 1.05 × 10⁷, 7.47 × 10⁶, and 5.66 × 10⁶ t, respectively.
The influence area with an influence range level of seven was 2.94 × 10⁵ km2 and the dust deposition, accounting for 34.19% of the total dust deposition, was 7.70 × 10⁷ t. The periodical depositions were 3.07 × 10⁷, 2.72 × 10⁷, 8.94 × 10⁶, 6.05 × 10⁶, and 4.20 × 10⁶ t, respectively.
The influence area with an influence range level of eight was 6.21 × 10⁵ km2 and the dust deposition, accounting for 23.38% of the total dust deposition, was 5.27 × 10⁷ t. The periodical depositions were 2.99 × 10⁷, 1.79 × 10⁷, 3.27 × 10⁶, 8.84 × 10⁵, and 7.48 × 10⁵ t, respectively.
The influence area with an influence range level of greater than or equal to nine was the largest (9.64 × 10⁵ km2), but the dust deposition, accounting for only 6.22% of the total dust deposition, was the smallest (1.40 × 10⁷ t). The periodical depositions were 1.04 × 10⁷, 3.24 × 10⁶, 3.39 × 10⁵, 0, and 5.25 × 10⁴, respectively.

3.5. Attenuation by Windbreak and Sand Fixation

Based on the dust deposition of administrative regions in China (Figure 9), the dust deposition reduction in the administrative regions is closely related to the influence range, level of distribution, and influence area. A shorter influence distance and larger influence area yielded a greater reduction in dust deposition and a greater benefit from windbreak and sand fixation. In addition, the deposition in the administrative areas decreased gradually. Shaanxi Province, which experienced the greatest benefit from windbreak and sand fixation, is distributed in the influence range level of 6–7, with an influence area of 1.65 × 10⁵ km2. Its dust depositions in five phases were 2.04 × 10⁷, 1.83 × 10⁷, 6.63 × 10⁶, 4.65 × 10⁶, and 3.48 × 10⁶ t. The areas that benefited the second most were Hubei and Henan Provinces. The influence area of Hubei Province is the largest of all the administrative regions in the downwind direction, reaching 1.83 × 10⁷ km2. The dust deposition reductions in Hubei and Henan Provinces were 5.31 × 10⁷ and 5.59 × 10⁷ t, respectively, exceeding the dust deposition over the past 20 years. Similarly, the periodical deposition in the two provinces showed a downwards trend. For instance, the deposition in different phases of Hubei Province were 1.11 × 10⁷, 7.26 × 10⁶, 1.68 × 10⁶, 8.01 × 10⁵, and 5.93 × 10⁵ t.
In the administrative areas with influence range levels of 1–7, the dust deposition reduction did not exceed the average dust deposition over the past 20 years. In the administrative areas with influence range levels of 8–10, the dust deposition reduction was more than that of dust deposition, and this became more obvious with increased influence distance. Taking the administrative regions in the southwestern portion of the influence range of wind break and sand fixation in the nature reserve as an example, Ningxia Hui Autonomous Region, Gansu Province and Shaanxi Province are distributed in influence range levels of 1–7 and had dust deposition reductions of 0.57, 0.58, and 0.61 times that of the past 20 years. Chongqing, Hubei, Hunan, Guangxi, Guangdong, and Hainan provinces are all distributed in influence range levels of 8–10, and the dust deposition reductions of these regions were 1.00, 1.50, 2.40, 3.76, 3.77, and 3.93 times the level of dust deposition over the past 20 years, respectively.

3.6. Verification of Dust Deposition

On the basis of the number of the days—including those with sand–dust weather days—that did not reach the secondary standard of ambient air quality in 12 cities, including Yan’an (Table 5), we can conclude that the sand–dust weather frequency is much lower than the number of days that the PM10 concentration failed to reach the secondary standard of ambient air quality.
The tangible impact on various cities was analyzed based on the relationship between the ambient air quality and sand-driving wind duration. Being closer to a sand source yields a higher frequency of sand–dust weather, meaning that the air quality can be affected more easily. The frequency of sand–dust weather from March to May in 2017–2019 was highest in cities with influence range levels less than or equal to six. Although sand–dust weather occurred eight times in Yulin, the number of days that the PM10 concentration did not reach the secondary standard was less than the number of days in Xi’an and Yan’an. Among cities with influence range levels greater than six, only one sand–dust weather event occurred in Changzhi. This is not closely related to the number of days that the PM10 concentration did or did not reach the secondary standard.
We analyzed the correlations between PM10 concentrations in the specific cities and the time sequences (i.e., the current day, the next day, the third day and the fourth day) of sand-driving wind in the BNR (Table 6). Our results indicate that the correlations between PM10 concentrations and all sand-driving wind duration sequences during specific periods reach significant levels. In areas with influence range levels less than or equal to six, the correlation between PM10 concentration and sand-driving wind in Yan’an and Yulin reached a highly significant level, and the correlation between PM10 concentration and wind the next-day in Xi’an reached a significant level. In areas with influence range levels equal to seven, the correlations between PM10 concentrations and next-day winds in Shiyan and Zhengzhou reached highly significant levels, and the correlation between PM10 concentration and next-day winds in Changzhi reached a significant level. In areas with an influence range level equal to eight, the correlation between PM10 concentration in Jining and third-day winds reached a significant level, and the correlations between the PM10 concentrations in Zhangjiajie and Wuhan and the third-day winds reached highly significant levels. In areas with an influence range level greater than or equal to nine, the correlation between PM10 concentrations in Nanchang and Hangzhou and third-day winds reached highly significant levels, and the correlation between PM10 concentration in Guilin and fourth-day winds reached a highly significant level. Therefore, we observed that the sand-driving wind duration has a hysteresis effect on the rise in PM10 concentrations. In addition, even if the sand-driving wind has ended in the nature reserve, the PM10 concentrations in cities may still increase to varying extents in the following days, leading to reduce air quality. The PM10 concentrations may also be affected by terrain and weather. For example, Shiyan City reached the Qinling Mountains in the north and Ba Mountain in the south, and the Han River and Wudang Mountain span this city, meaning that dust storms have less effect on the city. The correlation is highly significant; however, the correlation coefficient is small.

4. Discussion

In the present study, we improved the accuracy of the influence range of wind erosion and the beneficial range of windbreak and sand fixation because we took the temporal and spatial variation rules of wind speed and the influence range of wind erosion into account. The wind speed differences at various heights and time intervals [64] rendered making predictions is very difficult [40]. In addition to this, winds from the south do not easily cause dust disasters because of their warm and humid nature, so we only considered winds from the WNW, NW, and W directions. Therefore, it is important to further improve the measurement accuracy in a follow-up study.
Medium, fine, and clay silt all have particle sizes less than 10 μm. Once blown up, these particles drift for a long distance at high altitudes and will be sent to the China Sea and even the North Pacific Ocean [65]. Therefore, even if there is no sand–dust weather, the PM10 concentrations will increase significantly and affect the air quality in downwind areas.
The Gobi Desert is widely distributed in the arid and extremely arid regions in north China [66]. Wind-blown sand is mainly derived from the Gobi, grasslands, and other desert belts in arid and semi-arid areas, such as the Hexi corridor and the Mongolian Plateau in midwestern Inner Mongolia. As a result, there are many sources of dust storms in downwind administrative regions.
Even though the PM10 concentrations in cities rapidly increased during sand–dust weather, surpassing the secondary standard of ambient air quality [67], industrial combustion, engineering construction and transportation are also sources of PM10 pollution [68,69,70]. As a result, the dust storms in the BNR and its surrounding areas are just one of the factors affecting cities in the influence area. PM10 is also related to weather factors and meteorological conditions in cities [71,72]. The effect of various factors on sand–dust weather must be further studied.
The benefits increasing the windbreak and sand fixation of the ecosystem in the BNR result from China’s ecological policy as well as natural and economic factors. First, the Lingwu Baijitan Forest Farm, in which the reserve is located, was established in 1953 and has brought decades of experience in windbreak, sand fixation, and forestation. Second, since the BNR was designated a national nature reserve in 2000, methods such as increasing vegetation coverage and changing land use patterns have been adopted to influence ecosystem services. China’s ecological protection project was implemented to promote the role of ecosystems in positive development. Ecosystem services cover production, ecological regulation, life support, and social and cultural support services as well as other types of ecosystem products. Therefore, we only discussed the effect of windbreak and sand fixation in this paper, and other ecosystem services must be further studied.
Over the past few decades, China has conducted a great deal of work in ecological protection compensation and has achieved useful results in ecological protection compensation for nature reserves [73,74,75,76]. The ecological protection compensation standard is the core of the ecological protection compensation mechanism, and ecosystem service value is one basis of this compensation standard. As one avenue of further study, we estimated the total value of ecological protection compensation on the basis of the reserve’s ecological protection cost. We also proposed additional work on formulating the ecological protection compensation standard of each administrative region on the basis of the attenuation law of windbreak and sand fixation, as well as the level of social and economic development in the area. This would provide a reference for establishing ecological protection compensation systems in nature reserves.

5. Conclusions

The FVC of the BNR has clearly increased over the last 20 years and the area of different vegetation cover types has also changed greatly. Medium coverage accounting for 66.13% became the main type of vegetation cover up until the fifth phase. The proportion of poor coverage, low coverage, medium coverage and high coverage changed from 21.12%, 75.22%, 3.39%, and 0.27% in the first phase to 0.02%, 20.19%, 66.13%, and 13.66% in the fifth phase, respectively. Poor coverage and low coverage decreased significantly, of which the reduced area was 561.79 km2, accounting for 76.13% of the total area of the BNR. The area of medium coverage and high coverage increased significantly, accounting for 62.75% and 13.39%, respectively.
Only the BNR and its surrounding areas are affected by coarse sand, medium sand, fine sand and very fine sand. When the wind speed was above grade 6, coarse silt could affect 26 downwind administrative regions, with an affected area of 2.13 × 10⁶ km2. When the winds reached the sand-driving speed, medium silt, fine silt and clay silt could easily drift long distances in the upper atmosphere. The air quality in areas without sand–dust weather is also affected by such suspended loads. Our results indicate that windbreak and sand fixation in BNR can offer great benefits to downwind areas.
In downwind areas, the windbreak and sand fixation varied with the beneficial range, which was the distance from BNR, and the beneficial area and dust deposition decreased as the influence distance increased. Administrative regions with shorter influence distances and larger influence areas experienced greater reductions in dust deposition; thus, the benefits of windbreak and sand fixation were greater. With the gradual increase in distance, the dust deposition reduction gradually exceeded the dust deposition over nearly 20 years. It is observed that Shaanxi Province saw the greatest benefit of windbreak and sand fixation, with a dust deposition reduction of 4.63 × 10⁷ t, followed by Hubei and Henan Provinces, with reductions of 4.47 × 10⁷ and 4.35 × 10⁷ t, respectively. The dust deposition reduction in 21 administrative regions was greater than the average dust deposition for the past 20 years. This indicates that establishing nature reserves effectively reduce dust deposition in downwind areas.
The temporal variation in the deposition in both administrative regions and different influence ranges tended to present a downward trend. The dust depositions in five phases were 2.04 × 10⁷, 1.83 × 10⁷, 6.63 × 10⁶, 4.65 × 10⁶, and 3.48 × 10⁶ t, respectively. The periodical depositions with an influence range less than or equal to 6 were 3.01 × 10⁷, 2.78 × 10⁷, 1.05 × 10⁷, 7.47 × 10⁶, and 5.66 × 10⁶ t, respectively. Consequently, we can draw the conclusion that the radiating benefit of windbreak and sand fixation in the BNR prominently weakens the influence of dust weather across the entire downwind area.
The frequency of sand–dust weather is relatively high in cities near sand sources. In the 12 selected cities with various directions and sand influence ranges, the correlations between PM10 concentrations and the time sequences of sand-driving wind reach significant levels.

Author Contributions

C.S. and G.C. conceived and designed the study. C.S. collected and analyzed the data and wrote the paper. Q.Y. and R.W. made substantial contributions to the conception and design, the interpretation of data and writing of the manuscript. G.C. reviewed and edited the manuscript. All authors have read and agreed to the published version of the manuscript.

Funding

This study was supported by the National Key Research and Development Program of China: Design and assessment techniques for biodiversity conservation targets (No. 2018YFC0507200).

Institutional Review Board Statement

Not applicable.

Informed Consent Statement

Not applicable.

Data Availability Statement

Data sharing not applicable.

Conflicts of Interest

The authors declare no conflict of interest.

References

  1. Reid, W.V.; Mooney, H.A.; Cropper, A.; Capistrano, D.; Carpenter, S.R.; Chopra, K.; Dasgupta, P.; Dietz, T.; Duraiappah, A.K.; Hassan, R.; et al. Millenium Ecosystem Assessment—Ecosystems and Human Well-Being: Synthesis; Island Press: Washington, DC, USA, 2005; ISBN 1597260401. [Google Scholar]
  2. Daily, G.C. Nature’s Services: Societal Dependence on Natural Ecosystems; Island Press: Washington, DC, USA, 1997; ISBN 1-55963-476-6. [Google Scholar]
  3. Xie, G.D.; Cao, S.Y.; Lu, C.X.; Zhang, C.S.; Yu, X. Current status and future trends for eco-compensation in China. J. Resour. Ecol. 2015, 6, 355–362. [Google Scholar] [CrossRef]
  4. Yu, X.X.; Lu, S.W.; Jin, F.; Chen, L.H.; Rao, L.Y. The assessment of the forest ecosystem services evaluation in China. Acta Ecol. Sin. 2005, 25, 2096–2102. [Google Scholar] [CrossRef]
  5. Chen, L.; Mou, Z.P.; Qin, H.P.; Su, Q. Study on ecological service function and its radiation effect of wetland ecosystem. Environ. Sci. Technol. 2017, 40, 179–186. [Google Scholar] [CrossRef]
  6. Thapa, S.; Wang, L.; Koirala, A.; Shrestha, S.; Bhattarai, S.; Aye, W.N. Valuation of ecosystem services from an important wetland of Nepal: A Study from Begnas watershed system. Wetlands 2020, 40, 1071–1083. [Google Scholar] [CrossRef]
  7. Cheng, L.L.; Guo, H.; Lu, Q. Review on the valuation of desert ecosystem service values. J. Desert Res. 2013, 33, 281–287. [Google Scholar] [CrossRef]
  8. Sawut, M.; Eziz, M.; Tiyip, T. The effects of land-use change on ecosystem service value of desert oasis: A case study in Ugan-kuqa river delta oasis, China. Can. J. Soil Sci. 2013, 93, 99–108. [Google Scholar] [CrossRef]
  9. Zhao, T.Q.; Ouyang, Z.Y.; Jia, L.Q.; Zheng, H. Ecosystem services and their valuation of China grassland. Acta Ecol. Sin. 2004, 24, 1101–1110. [Google Scholar] [CrossRef]
  10. Schirpke, U.; Kohler, M.; Leitinger, G.; Fontana, V.; Tasser, E.; Tappeiner, U. Future impacts of changing land-use and climate on ecosystem services of mountain grassland and their resilience. Ecosyst. Serv. 2017, 26, 79–94. [Google Scholar] [CrossRef]
  11. Wang, M. Study on Evalution of Ecosystem Services in Shandong Coastal Waters; Ocean University of China: Qingdao, China, 2018. [Google Scholar]
  12. Rogers, A.D.; Frinault, B.A.V.; Barnes, D.K.A.; Bindoff, N.L.; Downie, R.; Ducklow, H.W.; Friedlaender, A.S.; Hart, T.; Hill, S.L.; Hofmann, E.E.; et al. Antarctic futures: An assessment of climate-driven changes in ecosystem structure, function, and service provisioning in the Southern Ocean. Ann. Rev. Mar. Sci. 2020, 12, 87–120. [Google Scholar] [CrossRef] [PubMed] [Green Version]
  13. Yang, X.M. Evaluation of the Farmland Ecosystem Services in Jiangsu Province; Nanjing Agricultural University: Nanjing, China, 2011. [Google Scholar]
  14. Firbank, L.; Bradbury, R.B.; McCracken, D.I.; Stoate, C. Delivering multiple ecosystem services from Enclosed Farmland in the UK. Agric. Ecosyst. Environ. 2013, 166, 65–75. [Google Scholar] [CrossRef]
  15. Peng, J.; Wang, Y.L.; Chen, Y.F.; Li, W.F.; Jiang, Y.Y. Economic value of urban ecosystem services: A case study in Shenzhen. Acta Sci. Nat. Univ. Pekin. 2005, 4, 594–604. [Google Scholar] [CrossRef]
  16. Larondelle, N.; Haase, D. Urban ecosystem services assessment along a rural-urban gradient: A cross-analysis of European cities. Ecol. Indic. 2013, 29, 179–190. [Google Scholar] [CrossRef]
  17. Wang, Y.T.; Guo, W.H.; Liu, J.; Wang, S.J.; Wang, Q.; Wang, R.Q. Value of ecosystem services of Kunyu Mountain Natural Reserve. Acta Ecol. Sin. 2009, 29, 523–531. [Google Scholar] [CrossRef]
  18. Xue, D.Y.; Bao, H.S.; Li, W.H. A valuation study on the indirect values of forest ecosystem in Changbaishan Mountain Biosphere Reserve of China. China Environ. Sci. 1999, 19, 247–252. [Google Scholar] [CrossRef]
  19. Castro, A.J.; Martín-López, B.; López, E.; Plieninger, T.; Alcaraz-Segura, D.; Vaughn, C.C.; Cabello, J. Do protected areas networks ensure the supply of ecosystem services? Spatial patterns of two nature reserve systems in semi-arid Spain. Appl. Geogr. 2015, 60, 1–9. [Google Scholar] [CrossRef]
  20. Badola, R.; Hussain, S.A.; Mishra, B.K.; Konthoujam, B.; Thapliyal, S.; Dhakate, P.M. An assessment of ecosystem services of Corbett Tiger Reserve, India. Environmentalist 2010, 30, 320–329. [Google Scholar] [CrossRef]
  21. Wang, X.D. Comprehensive Investigation Report on Baijitan National Nature Reserve in Lingwu City of Ningxia; Ocean University of China: Qingdao, China, 2018. [Google Scholar]
  22. Buitenwerf, R.; Rose, L.; Higgins, S.I. Three decades of multi-dimensional change in global leaf phenology. Nat. Clim. Chang. 2015, 5, 364–368. [Google Scholar] [CrossRef]
  23. Purevdorj, T.S.; Tateishi, R.; Ishiyama, T.; Honda, Y. Relationships between percent vegetation cover and vegetation indices. Int. J. Remote Sens. 1998, 19, 3519–3535. [Google Scholar] [CrossRef]
  24. Gong, G.L.; Liu, J.Y.; Shao, Q.Q.; Zhai, G. Sand-Fixing function under the change of vegetation coverage in a wind erosion area in northern China. J. Resour. Ecol. 2014, 5, 105–114. [Google Scholar] [CrossRef]
  25. Xu, J.; Xiao, Y.; Xie, G.D.; Wang, Y.Y.; Zhen, L.; Zhang, C.S.; Jiang, Y. Interregional ecosystem services benefits transfer from wind erosion control measures in Inner Mongolia. Environ. Dev. 2020, 34. [Google Scholar] [CrossRef]
  26. Zhang, H.Y.; Fan, J.W.; Cao, W.; Harris, W.; Li, Y.Z.; Chi, W.F.; Wang, S.Z. Response of wind erosion dynamics to climate change and human activity in Inner Mongolia, China during 1990 to 2015. Sci. Total Environ. 2018, 639, 1038–1050. [Google Scholar] [CrossRef] [PubMed]
  27. Gregory, J.M.; Wilson, G.R.; Singh, U.B.; Darwish, M.M. TEAM: Integrated, process-based wind-erosion model. Environ. Model. Softw. 2004, 19, 205–215. [Google Scholar] [CrossRef]
  28. Coen, G.M.; Tatarko, J.; Martin, T.C.; Cannon, K.R.; Goddard, T.W.; Sweetland, N.J. A method for using WEPS to map wind erosion risk of Alberta soils. Environ. Model. Softw. 2004, 19, 185–189. [Google Scholar] [CrossRef]
  29. Xu, J.; Xiao, Y.; Xie, G.; Wang, Y.; Jiang, Y. How to guarantee the sustainability of the wind prevention and sand fixation service: An ecosystem service flow perspective. Sustainability 2018, 10, 1995. [Google Scholar] [CrossRef] [Green Version]
  30. Zhang, H.B.; Gao, Y.; Sun, D.F. Wind erosion changes in a semi-arid sandy area, Inner Mongolia, China. Sustainability 2019, 11, 188. [Google Scholar] [CrossRef] [Green Version]
  31. Dong, Z.B. Establishing statistic model of wind erosion on small watershed basis. Bull. Soil Water Conserv. 1988, 18, 56–63. [Google Scholar]
  32. Han, Y.W.; Tuo, X.S.; Gao, J.X.; Liu, C.C.; Gao, X.T. Assessment on the sand-fixing function and its value of the vegetation in eco-function protection areas of the Lower reaches of the Heihe River. J. Nat. Resour. 2011, 26, 58–65. [Google Scholar] [CrossRef]
  33. Li, B.Y. Spatial and Temporal Differences of Ecological Effects of Land Change in Yinchuan Basin; Shaanxi Normal University: Shanxi, China, 2016. [Google Scholar]
  34. Ma, X.F. Ebinur Lake Wetland Landscape Pattern Change and Ecosystem Service Value Relations Research; Xinjiang Normal University: Xinjiang, China, 2017. [Google Scholar]
  35. Zhu, L.K.; Southworth, J. Disentangling the Relationships between Net Primary Production and Precipitation in Southern Africa Savannas Using Satellite Observations from 1982 to 2010. Remote Sensing. Remote Sens. 2013, 5, 3803–3825. [Google Scholar] [CrossRef] [Green Version]
  36. Ibrahim, Y.Z.; Balzter, H.; Kaduk, J.; Tucker, C.J. Land degradation assessment using residual trend analysis of GIMMS NDVI3g, soil moisture and rainfall in Sub-Saharan West Africa from 1982 to 2012. Remote Sens. 2015, 7, 5471–5494. [Google Scholar] [CrossRef] [Green Version]
  37. Wang, J.Q. An analysis of the harmful effects on agriculture production, caused by sandstorm. J. Educ. Ist. Jilin Prov. 2010, 26, 157–158. [Google Scholar]
  38. Ding, G.D. Aeolian Physics, 2nd ed.; China Forestry Publishing: Beijing, China, 2010. [Google Scholar]
  39. Han, Y.W.; Tuo, X.S.; Gao, J.X.; Gao, X.T. Ecosystem services radiation of significant eco-function area in the lower reaches of Heihe River. Acta Ecol. Sin. 2010, 30, 5185–5193. [Google Scholar] [CrossRef]
  40. Li, Z.S.; Zhang, Q.F.; Bao, H.J. Wind-velocity variation in recent 30 years in three typical desertified counties of north China. J. Desert Res. 2006, 26, 20–26. [Google Scholar] [CrossRef]
  41. Zhan, X.L.; Han, L. Physicochemical property of aeolian sandy soil in Baijitan in Ningxia. Chin. Agric. Sci. Bull. 2015, 31, 186–190. [Google Scholar]
  42. Li, J.F. Desert Climate; China Meteorological Press: Beijing, China, 2002; ISBN 9787502933890. [Google Scholar]
  43. Wu, K.N.; Zhao, R. Soil texture classification and its application in China. Acta Pedol. Sin. 2019, 56, 227–241. [Google Scholar] [CrossRef]
  44. Zhou, C.L.; Yang, X.H.; Yang, F.; Huo, W.; Zhong, X.J.; Pan, H.L.; He, Q. Analysis of calculated dust emission threshold wind speed based on the field experiments. J. Arid Meteorol. 2018, 36, 90–96. [Google Scholar] [CrossRef]
  45. Zhou, S.Z.; Zhang, R.Y.; Zhang, C. Meteorology and Climatology, 3rd ed.; Higher Education Press: Beijing, China, 1997; ISBN 9787040060164. [Google Scholar]
  46. Yang, Q.; Wang, T.; Chen, H.; Wang, Y.D. Characteristics of vegetation cover change in Xilin Gol League based on MODIS EVI data. Trans. Chin. Soc. Agric. Eng. 2015, 31, 191–198. [Google Scholar] [CrossRef]
  47. Luo, Y.; Xu, J.H.; Yue, W.Z. Research on vegetation indices based on the remote sensing images. Ecol. Sci. 2005, 24, 75–79. [Google Scholar] [CrossRef]
  48. Bao, J.Y.; Li, X.S.; Wu, B. Desertification evaluation based on sand vegetation index. J. Northeast For. Univ. 2008, 36, 69–72. [Google Scholar] [CrossRef]
  49. He, Y.Q.; Qin, Y.; Fu, Q.H.; Liu, C.Q.; Yin, B. Application of mixed pixel decomposition method using dynamic endmember combination in dynamic monitoring of vegetation abundance: A case study of Changting county. Trop. Geogr. 2016, 36, 860–868. [Google Scholar] [CrossRef]
  50. Li, X.S.; Gao, Z.H.; Li, Z.Y.; Bai, L.N.; Wang, B.Y. Estimation of sparse vegetation coverage in arid region based on hyperspectral mixed pixel decomposition. Chin. J. Appl. Ecol. 2010, 21, 152–158. [Google Scholar]
  51. Liu, Y.; Lv, Y.H.; Zheng, H.F.; Chen, L.D. Application of regression tree in analyzing the effects of climate factors on NDVI in loess hilly area of Shaanxi Province. Chin. J. Appl. Ecol. 2010, 21, 1153–1158. [Google Scholar] [CrossRef]
  52. Chen, J.J.; Huang, Y.; Zhao, X.N.; Zhang, H.Z.; Tian, Z.L. Accuracy evaluation of vegetation coverage inversion model for Alpine grassland in the source region of the Yellow River. Sci. Technol. Eng. 2019, 19, 37–45. [Google Scholar] [CrossRef]
  53. Mu, S.J.; Li, J.L.; Chen, Y.Z.; Gang, C.C.; Zhou, W.; Ju, W.M. Spatial differences of variations of vegetation coverage in Inner Mongolia during 2001–2010. Acta Geogr. Sin. 2012, 67, 1255–1268. [Google Scholar] [CrossRef]
  54. Wang, X.J.; Hu, E.C.; Li, A.P.; Li, Q.J. Dynamic changes of vegetation coverage in Daqingshan Nature Reserve based on MODIS NDVI image. J. Arid L. Resour. Environ. 2014, 28, 61–65. [Google Scholar]
  55. Murat, A.; Zhang, X.P.; Chen, L.L.; Lin, P.F.; Sun, Y.P. Spatial-temporal distribution of desertification on the Loess plateau using the GIMMS NDVI data. Sci. Soil Water Conserv. 2015, 13, 24–31. [Google Scholar] [CrossRef]
  56. Li, P.X.; Zheng, J.H.; Liu, P. Analysis of spatial and temporal variations about vegetation fractional cover in Urumqi city from 2000 to 2014. For. Resour. Manag. 2016, 88–95. [Google Scholar] [CrossRef]
  57. Sha, R.N. Analysis of temporal and spatial variation of vegetation cover in Wulatehouqi based on NDVI. For. Resour. Manag. 2017, 102, 89–93. [Google Scholar] [CrossRef]
  58. Sha, R.N. Spatial and Temporal Variations of Vegetation Coverage in Urad Rear Banner and Analysis of Influencing Factors; Beijing Forestry University: Beijing, China, 2018. [Google Scholar]
  59. Arukhan. Temporal and spatial variation of vegetation coverage in Horqin National Nature Reserve of Inner Mongolia Based on NDVI. Inn. Mong. Sci. Technol. Econ. 2018, 50, 47–48. [Google Scholar] [CrossRef]
  60. Guo, Z.C.; Liu, S.L.; Kang, W.P.; Chen, X.; Zhang, X.Q. Change trend of vegetation coverage in the Mu Us Sandy Region from 2000 to 2015. J. Desert Res. 2018, 38, 1099–1107. [Google Scholar]
  61. Yan, J.Y.; Tang, Z.Y.; Yao, H.D.; Li, J.L.; Xiao, Y.G.; Chen, Y.D. A study on the air-sea fluxes exchange coefficients over the South China Sea (SCS) during the onset of southwest monsoon. Acta Meteorol. Sin. 2006, 64, 335–344. [Google Scholar] [CrossRef]
  62. Zhao, C.X.; Wang, Y.Q.; Wang, Y.J.; Zhang, H.L.; Zhao, B.Q. Temporal and spatial distribution of PM2.5 and PM10 pollution status and the correlation of particulate matters and meteorological factors during winter and spring in Beijing. Environ. Sci. 2014, 35, 418–427. [Google Scholar]
  63. Wang, Y.R.; Zhang, X.X.; Zhao, J.Y.; Yu, X.X.; Jiang, Q.O. Study on the response of PM2.5 and PM10 concentrations to the ground meteorological conditions in different seasons in Beijing. Environ. Monit. China 2017, 33, 34–41. [Google Scholar] [CrossRef]
  64. Chen, W.N.; Dong, Z.B.; Yang, Z.T.; Han, Z.W.; Zhang, M.L.; Zhang, J.S. Threshold velocities of sand-driving wind in the Taklimakan desert. Acta Geogr. Sin. 1995, 50, 360–367. [Google Scholar]
  65. Shen, W.X. Investigation on the Pollution of Airborne Inhalable Particulate Matter PM10 in Huainan City; Anhui University of Science and Technology: Huainan, China, 2007. [Google Scholar]
  66. Shen, Y.C.; Wang, X.H.; Cheng, W.M.; Wu, J.F.; Lu, Q.; Feng, Y.M. Integrated physical regionalization of stony deserts in China. Prog. Geogr. 2016, 35, 57–66. [Google Scholar] [CrossRef]
  67. Xu, X.Q.; Wang, X.; Huang, J.P. Observational study on the particle size distribution of sand aerosol in Zhangye and Yuzhong of Lanzhou. Plateau Meteorol. 2011, 30, 208–216. [Google Scholar] [CrossRef]
  68. Bi, X.H.; Feng, Y.C.; Wu, J.H.; Wang, Y.Q.; Zhu, T. Source apportionment of PM10 in six cities of northern China. Atmos. Environ. 2007, 41, 903–912. [Google Scholar] [CrossRef]
  69. Gao, S.; Pan, X.C.; Madaniyazi, L.N.; Xie, J.; He, Y.H. Preliminary study of source apportionment of PM10 and PM2.5 in three cities of China during spring. Chin. J. Prev. Med. 2013, 47, 837–842. [Google Scholar] [CrossRef]
  70. Zou, B.D.; Xu, Z.Y.; Hua, L.; Han, Y.P.; Dong, S.Y.; Lu, H.F. Sources spportionment of atmospheric particles PM10 in Beijing by factor analysis. Environ. Monit. China 2007, 23, 79–85. [Google Scholar] [CrossRef]
  71. Li, M.K.; Shen, Z.X.; Li, X.X.; Yao, Y.Q.; Zheng, Y.; Fan, D. Mass concentration of PM10 and its relationship with meteorological conditions over Xi’an. Chin. J. Process Eng. 2006, 6, 15–19. [Google Scholar]
  72. Xie, F.Y.; Wang, Z.F.; Wang, X.Q. A study of the characteristics of the synoptic situations and meteorological conditions in PM10 air pollution episodes of Beijing during the 2008 Olympic Games period. Clim. Environ. Res. 2010, 15, 584–594. [Google Scholar] [CrossRef]
  73. Min, Q.W.; Zhen, L.; Yang, G.M. Progress of researches and practices of ecological compensation of nature reserves. J. Ecol. Rural Environ. 2007, 23, 81–84. [Google Scholar] [CrossRef]
  74. Li, Y.Y. Study on construction method and implementation approaches of ecological compensation mechanism for China’s nature reserves. Ecol. Environ. 2011, 20, 1957–1965. [Google Scholar] [CrossRef]
  75. Wang, L.; Su, Y.; Cui, G.F. Quantitative study on the ecological compensation for nature reserves based on the “virtual land” method. J. Nat. Resour. 2011, 26, 34–47. [Google Scholar] [CrossRef]
  76. Yang, Z.; Wu, J. Conservation cost of China’s nature reserves and its regional distribution. J. Nat. Resour. 2019, 34, 839–852. [Google Scholar] [CrossRef]
Figure 1. Location of Baijitan Nature Reserve.
Sustainability 13 03508 g001
Figure 2. The distribution of sand in Baijitan Nature Reserve.
Sustainability 13 03508 g002
Figure 3. Wind speeds and direction in Baijitan Nature Reserve.
Sustainability 13 03508 g003
Figure 4. Temporal variations of wind-blown sand.
Sustainability 13 03508 g004
Figure 5. The spatial distribution law of fractional vegetation coverage (FVC) in different phases. (a) First phase; (b) second phase; (c) third phase; (d) forth phase; (e) fifth phase.
Sustainability 13 03508 g005
Figure 6. Influence range of coarse silt in the Baijitan Nature Reserve. (a) with gentle breeze (grade 3); (b) with moderate breeze (grade 4); (c) with fresh breeze (grade 5); (d) with strong breeze (grade 6); (e) with moderate gale (grade 7); (f) with fresh gale (grade 8).
Sustainability 13 03508 g006aSustainability 13 03508 g006b
Figure 7. Influence range of medium silt, fine silt and clay in Baijitan Nature Reserve. (a) In gentle breeze (grade 3); (b) with moderate breeze (grade 4); (c) with fresh breeze (grade 5); (d) with strong breeze (grade 6); (e) with moderate gale (grade 7).
Sustainability 13 03508 g007
Figure 8. Spatial distribution map of dust deposition from 2000 to 2019.
Sustainability 13 03508 g008
Figure 9. Dust deposition of administrative regions in China.
Sustainability 13 03508 g009
Table 1. Composition of aeolian soil particles in the Baijitan Nature Reserve.
Grain SizeParticle Size (mm)Proportion (%)
Coarse sand1.00–0.500.16
Medium sand0.50–0.2517.98
Fine sand0.25–0.1075.04
Very fine sand0.10–0.056.16
SiltCoarse silt0.05–0.010.66
Medium silt0.01–0.005
Fine silt0.005–0.002
Clay<0.002
Table 2. The classification of wind speed over sand-driving wind speed in the Baijitan Nature Reserve.
Wind GradeNameWind Speed (m·s−1)Average Wind Speed (m·s−1)
3Gentle breeze4.85–5.45.13
4Moderate breeze5.5–7.96.70
5Fresh breeze8.0–10.79.35
6Strong breeze10.8–13.812.3
7Moderate gale13.9–17.115.5
8Fresh gale17.2–17.417.3
Table 3. The classification of wind speed over sand-driving wind speed in the Baijitan Nature Reserve.
LevelInfluence Range (km)China’s Land Area within the Radiating Range (km2)The Grade of Wind Speed, Affected by the Radiating Range
10.75–0.817.80 × 10−13
20.81–1.255.71 × 1013,4
31.25–1.98.21 × 1013,4,5
41.9–2.951.20 × 1023,4,5,6
52.95–4.591.69 × 1023,4,5,6,7
64.59–508.052.43 × 1053,4,5,6,7,8
7508.05–777.972.94 × 1054,5,6,7,8
8777.97–1184.996.21 × 1055,6,7,8
91184.99–1840.749.39 × 1056,7,8
101840.74–2871.862.53 × 1047,8
Table 4. Sand erosion distance and influence time.
NameParticle Size (mm)Wind Speed (m·s−1)Erosion Distance (km)Influence Time (s)
Medium silt, fine silt and clay<0.014.85–5.4>508.05>94,082.98
5.5–7.9>777.97>94,082.98
8.0–10.7>1184.99>98,477.32
10.8–13.8>1840.74>110,746.84
13.9–17.1>2871.86>133,387.03
17.2–17.4>2947.68>167,945.18
Coarse silt0.01–0.054.85–5.40.75–508.05150.53–94,082.98
5.5–7.90.81–777.97157.56–96,428.95
8.0–10.71.25–1184.99177.19–98,477.32
10.8–13.81.90–1840.74213.42–110,746.84
13.9–17.12.95–2871.86268.71–133,387.03
17.2–17.44.59–2947.68272.62–167,945.18
Very fine sand0.05–0.14.85–5.40.05–0.819.41–154.29
5.5–7.90.05–1.249.85–150.53
8.0–10.70.08–1.9011.07–157.56
10.8–13.80.12–2.9513.34–177.19
13.9–17.10.18–4.5916.79–213.42
17.2–17.40.29–4.7217.04–268.71
Fine sand0.10–0.254.85–5.41.20 × 10−2–0.050.24–9.64
5.5–7.91.30 × 10−2–0.080.25–9.41
8.0–10.71.99 × 10−2–0.120.28–9.85
10.8–13.83.03 × 10−2–0.180.34–11.07
13.9–17.14.71 × 10−2–0.290.43–13.34
17.2–17.47.35 × 10−2–0.290.44–16.79
Medium sand0.25–0.504.85–5.47.48 × 10−5–1.30 × 10−20.02–0.25
5.5–7.98.13 × 10−4–1.99 × 10−20.02–0.24
8.0–10.71.24 × 10−3–3.03 × 10−20.02–0.25
10.8–13.81.90 × 10−3–4.71 × 10−20.02–0.28
13.9–17.12.95 × 10−3–7.35 × 10−20.03–0.34
17.2–17.44.59 × 10−3–7.55 × 10−20.03–0.43
Coarse sand0.5–1.04.85–5.44.68 × 10−6–8.13 × 10−49.41 × 10−3–0.02
5.5–7.95.08 × 10−6–1.24 × 10−39.85 × 10−3–0.02
8.0–10.77.78 × 10−6–1.90 × 10−31.12 × 10−2–0.02
10.8–13.81.18 × 10−5–2.95 × 10−31.33 × 10−2–0.02
13.9–17.11.84 × 10−5–4.59 × 10−31.68 × 10−2–0.02
17.2–17.42.87 × 10−5–4.72 × 10−31.70 × 10−2–0.03
Table 5. Particles less than 10 microns in diameter (PM10) concentration fails to reach the secondary standard of ambient air quality and sand–dust weather days in different cities.
Influence Range LevelCityPM10 Concentration Failed to Reach the Secondary Standard of Ambient Air Quality (d)Sand–Dust Weather (d)
≤6Xi’an672
Yan’an444
Yulin428
7Shiyan60
Zhengzhou870
Changzhi301
8Zhangjiajie10
Wuhan180
Jining340
≥9Guilin10
Nanchang30
Hangzhou40
Table 6. The correlations between PM10 concentration and the time sequences of sand-driving wind.
Influence Range LevelCityCurrent Day Next DayThird DayFourth Day
≤6Xi’an0.1110.233 *0.190 *0.094
Yan’an0.306 **0.231 **0.1160.079
Yulin0.318 **0.073−0.0240.071
7Shiyan−0.0540.1140.195 **0.124 *
Zhengzhou0.1160.201 **0.213 **0.111
Changzhi0.1020.136 *0.0990.02
8Zhangjiajie−0.0420.1030.324 **0.142 *
Wuhan0.0070.175 **0.339 **0.164 **
Jining0.0140.1120.119 *0.109
≥9Guilin0.0190.0290.239 **0.256 **
Nanchang−0.0310.030.215 **0.194 **
Hangzhou−0.0330.0270.230 **0.134 *
Note: * is significant and ** is highly significant.
Publisher’s Note: MDPI stays neutral with regard to jurisdictional claims in published maps and institutional affiliations.

