Abstract
This project aims to present a methodology to establish the biomass content of unused tires as a typical fuel in cement factories. To this end, between 2011–2016 samples were collected every 2 years (four surveys) to assess natural and synthetic rubber in scrap tires through the thermodynamic analysis. Ninety-six samples were used in the study, 803.6 tonnes of scrap tires, as fuel. Knowing the Spanish vehicle fleet and considering undifferentiated tires, it is possible to predict the biomass content. The methodology has also been evaluated taking into consideration mono-brand samples. The simplicity of the methodology makes it possible to apply it in different regions and countries. New materials included in current and future tires will require constant samples and an assessment of the formulae state. Lastly, the biomass content in non-conventional fuels and its use in the cement sector will reduce CO2 emissions in said sector, with significant economic implications for it is regulated by the 2003/87/EC Directive, with up to 2792.91 tonnes of CO2 reductions.
1. Introduction
Considering the CO2 concentration in the atmosphere (411.75 ppm, 2020, Mauna Loa) [1], the fight against climate change should not only cover the decarbonisation of the energy sector (CCS, fuel shift to renewables), but also explore technologies and/or circular based economy processes in other sectors. Following the Paris Agreement and the European Commission’s firm commitment to significantly reduce CO2 emissions by 2030 [2]. This requires a research for technologies that meet these environmental commitments, while maintaining the competitiveness of the European industry [3].
The cement sector is a regulated sector [4,5], which consumes approximately 11–15% of the total industrial energy use [6], with 7% of global anthropogenic CO2 emissions [7].
The terms circular economy and sustainability are increasingly gaining traction with academia, industry, and policymakers [8]. Life cycles are designed into the products we use every day [9], considering industrial ecology [10] and blue economy [8]. Circular economy aims to end or (at least) reduce the use of some materials (e.g., rare earths, critical raw materials, bio-ingredients) and energy sources (e.g., fossil fuels) [11]. Nowadays, plastic waste is out of control and it either blends in with Municipal Solid Waste and/or gets disposed on landfills [12]. Landfilling takes over a large amount of land and causes environmental and medical problems [13]. Thus, recycling plastic helps create eco-friendly products and avoids putting tons of waste into said landfills [14]. Each year 1.3–1.5 billion tires complete their life cycle all over the world [15]. Thus, the use of waste derived fuels by cement plants will also be beneficial to the environment [16]. Tires are generally made of Natural Rubber (NR) (20–25%), Styrene-Butadiene Rubber (SBR) (30–50%), Butyl Rubber (BR) (up to 30%), Carbon Black (≅30%), Sulphur (1–2.5%), and small quantities of organic and inorganic additives [17].
The use of waste as co-fuels in the cement sector backs the concept of circular economy and reduces the environmental impact of this sector [18,19], proving important savings in the energy sector and environment benefits [20]. The calorific value of co-fuel must be stable enough to allow the control of the energy supply into the kiln, so that it reaches a homogeneous composition. In addition, the physical form must warrant easy handling of the material for transportation, and a stable, adjustable flow of material in the cement plant [16]. The wastes usually co-processed are paper, wood, tires, plastic, hydrocarbon waste, and solvents [21]. Between wastes used as fuel are scrap tires [22] and hazardous waste [23]. The use of scrap tires as waste, also known as Tire Not in Use (TNU), should be considered economically and for its high calorific value [24].
This study aims to quantify the CO2 emissions avoided (thanks to the used scrap tires) through 2010–2016. On this basis, characterization tests assess TNU as a feasible energy resource. Based on (i) the percentage of biomass established for each period (biannual characterization), and (ii) the consumption of this energy resource in the 22 Spanish factories. The study will be able to find out the CO2 avoided when including this natural rubber in the discarded tires.
There are several alternatives for the calcination of minerals such as CO2 capture [25] and concentrated solar power [26] but there are alternatives for the far future, and the following study is a solution currently in use.
2. Materials and Methods
2.1. Sampling Scrap Tires and Characterization
The methodology to determine the quantity of biomass included in scrap tires used through the 2010–2016 period, is based on the methodology described in [27]. We will apply this methodology to find out the amount of biomass in scrap tires. To this end, annual samples of scrap tires have been taken, differentiating between light and heavy vehicles scrap tires. Light vehicles are defined as good vehicles weighing less than 3.5 tonnes and heavy vehicles are defined as those weighing more than 3.5 tonnes. The Spanish vehicle fleet had a total of 34,434,791 vehicles in 2019 [28].
The analyses to determine the biomass content of the waste tires are complex due to a set of variables: The heterogeneity of the material itself, the different presence of natural rubber in the different commercial brands, the different presence of natural rubber in the different parts of the tire, and the different degree of wear of the tread layer in waste tires, Figure 1 and Figure 2. All is driven by the type of tire considered (light/heavy vehicle) and also, the presence of one or another type of tire depends on the rate of replacement of the fleet in the period considered. Therefore, these last two variables determine the sampling strategy and those mentioned in the first place, will define the sampling plan.
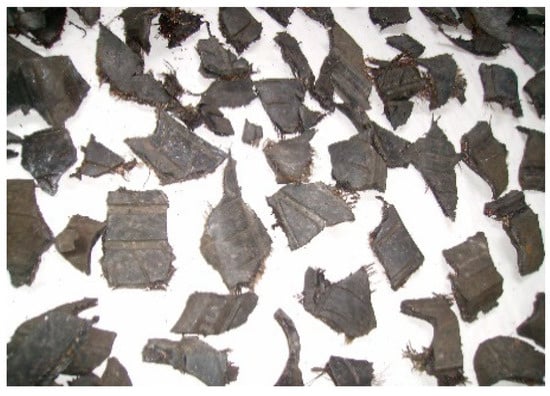
Figure 1.
Scrap tires before processing.
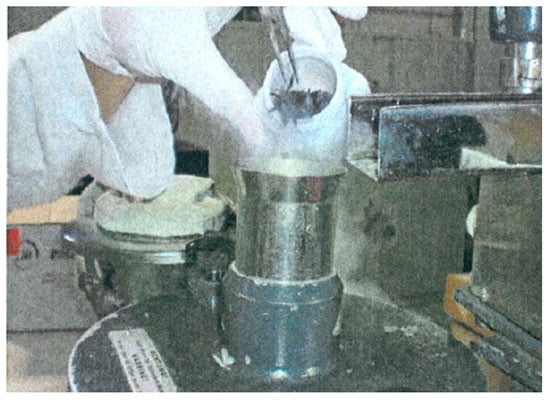
Figure 2.
Processing of samples in the cryogenic mill.
The ratio of light/heavy vehicles is determined by obtaining the corresponding value from the historical series published by the Spanish General Traffic Directorate (DGT) combined with the rate of generation of tires by type of vehicle recommended by the Spanish Office for Climate Change (OECC).
The samples are 12 for each type of vehicle and in each survey, that is to say, 24 samples by survey. Therewith, with an undifferentiated tire an average value is obtained, which will show the percentage of biomass introduced in cement manufacturing kilns.
In order to determine the NR content, thermogravimetric tests will be used in concordance with UNE 80602, where the temperatures of decomposition and the mass reduction of NR, and SBR are determined. Samples between 15 to 20 mg of weight, subjected to a temperature ramp of 30 to 600 °C with a rising rate that starts at 20 °C/min in an atmosphere of dry nitrogen supplied with a flow rate of 80 mL/min. Thus, it is possible to obtain the characteristics of the temperature dependence of the sample mass at a constant heating rate [29]. Finally, weight loss versus time allows determining two points:
H1, defined as the maximum speed of weight loss in the range of 330–400 °C when NR degrades [30].
H2, maximum speed of weight loss in the interval of 420–500 °C when SBR degrades [31].
In addition, the test can identify the inorganic residue that has black carbon, steel, and additives, and that remains in the crucible.
The vehicle fleet informs the tire replacement rate and the percentage of scrap tires, classified by scrap tires related with light, XL, and heavy vehicles, XH, Equation (1). The values obtained will be the average of the 2 years that correspond to the sampling surveys.
Eventually, this will show the percentage of biomass included in scrap tires, Equation (2).
FB = (XL·NL) + (XH·NH)
2.2. Spanish Cement Sector as Case Study
As described in [32], Spain ranks nineteenth in cement production worldwide, accounting for 0.5% of worldwide production, 20 Mt. Table 1 shows the scrap tires consumed by 22 Spanish cement plants. The consumption evolution of this fuel is linked to the availability of the resource and its cut in the market, Equation (3).
Kg biomass TNU = FB·Kg TNU

Table 1.
Scrap tires consumption (t) as fuel in the Spanish cement sector.
2.3. Fuel Characterization
It is estimated that the theoretical heat requirement for clicker making is close to 1.75 ± MJ/kg. The actual heat requirement is higher, and varies depending on the type of process applied [33]. Best Available Techniques (BAT) levels for new plants and major upgrades consume 3300 to 2900 MJ/t clinker [34], though it is forecasted to drop to 3100 and 2700 MJ/t cement by 2050 [35]. The use of waste as fuel is a widely used alternative in the cement industry with unquestionable benefits.
The composition of TNU is mainly elastomers and rubber, combined with natural and synthetic elements. The high heating value was estimated to be 35.86 MJ/Kg [36], which is close to the experimental values of Copper et al. 37.79 MJ/kg and Clark et al. 36.05 MJ/kg [37,38]. Therefore, and, in comparison to the energy values of other fuels, Figure 3, it can be considered an appealing fuel to use in cement manufacturing processes, Equation (4).
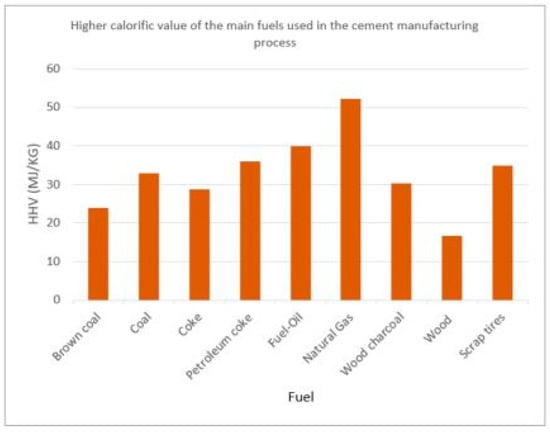
Figure 3.
Higher calorific value of the main fuels used in the cement manufacturing process [24,36,39,40,41,42,43,44].
2.4. CO2 Emissions
The use of tires from the four studies as substitute fuel in the 22 Spanish cement plants leads to a decline in CO2 emissions. Consequently, to know the avoided CO2, we must look at the petroleum coke emission factor, 0.35748 kg CO2/kWh [45], for this is the fuel replaced by tires in the cement plants. Along with the emission factor, we must know the tires energy. From Table 1 we gather the total weight of the tires used in the study, and from Figure 3 its calorific value. The avoided CO2 emissions are calculated with Equation (5).
3. Results
3.1. Thermogravimetric Analisys
The Thermogravimetric Analysis (TGA) was performed using a temperature sweep from 30 to 600 °C at a rate of 20 °C/min in nitrogen atmosphere, Figure 4. To establish the relationship between NR and SBR, the analysis of the normalised derivative resulting from thermogravimetry has been carried out.
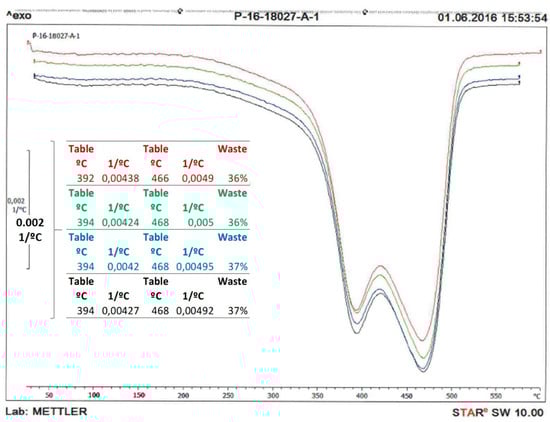
Figure 4.
TGA screening of a single sample.
The standard samples have been analysed with the same method as the other samples. To obtain the calibration curve, the ratio NR/(SBR + NR) in percentage is shown against the ratio of H1/H2 where:
- H1 is the maximum rate of mass loss versus temperature in the range 300–400 °C where the degradation of natural rubber occurs.
- H2 is the maximum mass loss rate versus temperature in the 420–500 °C range where the degradation of SBR rubber occurs.
3.2. Determination of Biomass in Scrap Tires, period 2010–2016
To measure the biomass, biannual surveys of scrap tires were taken in concordance with three sampling surveys. There are 12 samples for each type of vehicle and for each survey.
Table 2 shows the outcomes of the undefined tires, which are the result of having carried out four thermogravimetric tests of each sample to obtain the percentages of NR, SBR, and black carbon for each indefinite tire of each survey.
Table 2.
Determination of natural rubber (NR), styrene-butadiene rubber (SBR), and black carbon (BC).
Natural rubber was analyzed first in light vehicles. Its average value increases 8.75% from survey 1 until 3 and decreases 0.76% from survey 3 to 4. The maximum value is seen in survey 3 with a difference of 2.13% with respect to survey 4. The minimum value is identified in survey 1, which, with respect to survey 3, increases 9.73% and decreases 1.05% in survey 4.
In the analysis of SBR, the average value decrease 8.6% from survey 2 to 3 and increases 1.46% from survey 3 to 4. The maximum value decreases 8.02% from survey 1 to 2, and from survey 2 until 4 this value remains practically unchanged. The minimum value can be found in survey 3, it decreases 10.83% from survey 1 until 3, and increases 2.15% in survey 4 with respect to survey 3.
The highest average value for the analysis of black carbon is in survey 2, with a previous increase of 5.51% from survey 1, and with a decrease of the same percentage from survey 2 until 4. The maximum value in survey 2 decreases around 2.00% until survey 4. The minimum value increases 1.99% from survey 1 to 2, decreases 1.24% from survey 2 to 3.
The highest average value of natural rubber in heavy vehicles corresponds to survey 1 followed by survey 4, with 7.81% difference between both. In survey 2, there is a decrease of 21.95% with respect to survey 1, and in survey 3 it increases by 11.72% with respect to survey 2. The maximum value can be seen in survey 1 with a difference of 18.86% with respect to the following maximum value in survey 3, this value remains practically unchanged from survey 3 to 4. The minimum value is observed in survey 1, which increases until survey 4 by 12.81%.
For the analysis of natural rubber in heavy vehicles: When it comes to the SBR analysis, the average value increases by 26.97% from survey 1 to 2, decreases around 17.08% from survey 2 to 3, and then decreases 2.34% from survey 3 to 4. The maximum value is appreciated in survey 2 with a difference of 0.16% with survey 1, and this value decreases by 11.30% until survey 4. The minimum value is observed in survey 1, which has a difference of 28.78% with respect to survey 2, it decreases by 13.91% in survey 3, and an increase of 1.78% is observed in survey 4.
The analysis of black carbon shows that the highest average value is observed in survey 2 and it has a decrease of 9.18% until survey 4. The maximum value is in survey 2, decreases 3.25% until survey 3, and increases 0.51% from survey 3 to 4. In survey 1, the minimum value increases by 3.49% from survey 1 to 2 and decreases 1.74% from survey 2 until 4.
Additionally, mono-brand samples were taken to see the evolution of biomass content by isolating one of the variables involved, Table 3. Both samples are from light vehicles. In the study carried out for the two mono-brand samples specifically, the maximum SBR value is 39.37%, the minimum value is 22.62% in natural rubber, and the highest SBR average value is 39.20%. According to the standard deviation, the highest value is 2%.
Table 3.
Determination of natural rubber, styrene-butadiene rubber, and black carbon in mono-brand samples.
3.3. Calibration Line
3.3.1. Patterns, Data, and Composition
To obtain the calibration line (NR/(NR + SBR)), four pattern samples, composed by the known mixture of NR and SBR in different proportions, were prepared, with the proportion of black carbon fixed in the four pattern samples. Three new concentration patterns have also been obtained close to the real samples. The results are the seven patterns shown in Table 4.
Table 4.
Pattern samples.
3.3.2. Determination of the Calibration Line
The laboratory has used one calibration line made with pattern samples and known NBR/(NR + SBR) ratios vulcanized solely for these analyses. With the calibration line, for both light and heavy vehicles, the surveys were analyzed to find out the most and least favourable sample, and the calibration line was also used to find out the evolution of the surveys. In the following graphs, we considered supplier 1 from survey 1 but supplier 2 has been discarded. Figure 5 shows the result of the different surveys and tests carried out in this study.
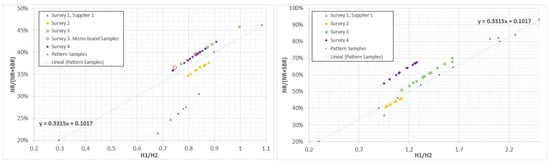
Figure 5.
Calibration line for light vehicles and heavy vehicles.
3.3.3. Analysis of Results of the Second Survey, 2011–2012
When talking about light vehicles, the percentage differences are 2 and 1.7 in absolute values with the calibration line, and in deviation terms all samples obtain expected deviations: Less than 1, being the maximum value 0.88. The maximum value from survey 2 increased by 6.6% with respect to survey 1, the minimum value rose almost 12.7% and the average value increased 10%.
Regarding heavy vehicles, the percentage differences are 1.43 and 1.64 in absolute values with the calibration line. The maximum value from survey 2 decreased by 47% with respect to survey 1, the minimum value rose almost 4.7% and the average value decreased by 21%.
3.3.4. Analysis of Results of the Third Survey, 2013–2014
The percentage differences of light vehicles are 3.27 and 5.8 in absolute values with the calibration line. The biomass value has a range between 37.37% and 45.7%. Compared to survey 1, the biomass value in tires of light vehicles has a range between 22% and 31% and with an average value of 26.5%, regarding survey 2 its average value is 36.18%. The maximum and minimum values for survey 3 increase around 15% regarding survey 1, and the average increases 15%, and the best biomass value can be seen through the surveys.
The two mono-brand samples are very close to the calibration line, with a percentage difference of 1.46 and 1.82 in absolute values. The biomass value has a range between 36.5% and 39.5%.
Regarding the values obtained for tires of heavy vehicles, the percentage differences are 3.27 and 5.86 in absolute values with the calibration line. Moreover, in deviation terms all samples are between 1.1 and 1.7, being the maximum value 1.63. The maximum value decreases 23% and the minimum value increases 14% with respect to survey 1. The average value is 4 points lower than that of survey 1 and 17.04 points upper than that of survey 2.
3.3.5. Analysis of Results of the Fourth Survey, 2015–2016
For the analysis of light vehicles, the percentage differences are 1.2 and 2 in absolute values with the calibration line, and in deviation terms all samples are below 1. The biomass value has a range between 35.84% and 42.39%, it increases by 12.62% with respect to survey 1. The maximum value has increased by 11.39% and the minimum value has an increase of 13.93%, both values with respect to survey 1.
The percentage differences in heavy vehicles are 11.68 and 14.44 in absolute values with the calibration line, and in deviation terms all samples are between 0.9 and 1.1. The biomass has an average value of 61.35% and this value decreases 3.15% with respect to survey 1. The maximum value has decreased by 25.3% and the minimum value has increased 19%, both values with respect to survey 1.
3.3.6. Undifferentiated Scrap Tire and Renewable Energy Assessment
Considering the renewal of the vehicle fleet, light and heavy vehicles determine the percentage of scrap tires for each survey, Table 5.
Table 5.
Percentage of scrap tires: Light and heavy vehicles.
Table 6 shows the biomass content in scrap tires for each survey, the kilograms of biomass in said scrap tires, and the clean energy produced. Biomass content is calculated with Equations (1) and (2), whose results are in Table 2 and Table 5, respectively. In Equation (3), the kilograms of biomass included in scrap tires are identified for each survey, this includes the scrap tires used in the 22 Spanish cement plants. Moreover, the measurement of clean energy has been done according to the average calorific value of the scrap tires referenced in the previous sections and the kilograms of biomass included in scrap tires.
Table 6.
Determination of biomass content, kilograms of biomass, and clean energy in scrap tires.
Looking at the variation of biomass content in scrap tires from survey 1 to 2 there is a decrement of 6.21%, from survey 2 to 3 an increment of 6.72%, and from survey 3 to 4 an increment of 0.72%. The kilograms of biomass included in scrap tires have a progressive increase from survey 1 to 4, with a total increase of 37,557.84 Kg. Clean energy has a progressive increase from survey 1 to survey 4 of 1,314,524.48 MJ.
3.4. CO2 Emissions
Equation (5) shows 2792.91 tonnes of CO2 avoided when replacing the petroleum coke with non-used tires as fuel in cement industrial kilns. The results indicate that each ton of tire used as fuel prevents 3.5 tonnes of CO2.
4. Conclusions
The use of waste in the cement manufacturing process is a common and sustainable practice, when considered as an economic incentive and when used as fuel, which strengthen the circular economy and waste recycling.
Scrap tire has high calorific values, and a fraction of it is renewable, which gives it an undoubted value as a fuel. Based on this, during the tire manufacturing process, natural rubber is used in different proportions. This must not only be considered as an environmental incentive but also as an economic saving. Directives 2003/87/CE and 2009/29/CE limit CO2 emissions in certain industry sectors, including the cement sector.
With the results obtained in the surveys, it is noted that in surveys 2 and 3 the procedure followed leads to a reduction of CO2 emissions. Therefore, the methodology that identifies undifferentiated scrap tires can be considered as a robust strategy to assess natural rubber in scrap tires. It was tested in biannual surveys from 2010 to 2016.
According to the results obtained in the surveys, the CO2 emissions avoided can be calculated. In the case of the study, it represents a 29.61% of the total emissions, when using these scrap tires. The avoided emissions value is the amount of biomass in the scrap tires that matches the CO2 neutral emissions. The CO2 price evolution, a result of an adjustment in the market and an increasing limitation of greenhouse gas emissions, makes the use of this fuel in the cement manufacturing process socially, environmentally, and economically attractive.
Author Contributions
Conceptualization and methodology, P.M., and A.A.; formal analysis, validation, and writing—review and editing, P.M. and B.L.; writing—original draft preparation and investigation, L.S.-M. All authors have read and agreed to the published version of the manuscript.
Funding
This research received no external funding.
Informed Consent Statement
Not applicable.
Data Availability Statement
Not applicable.
Acknowledgments
The authors of this work would like to thank Rocío Sanchez Ramos for her contribution as a translator, proof-reader, and editor of the text.
Conflicts of Interest
The authors declare no conflict of interest.
References
- Global Monitoring Laboratory. Available online: https://www.esrl.noaa.gov/gmd/ccgg/trends/index.html (accessed on 20 March 2019).
- Tobin, P.; Schmidt, N.M.; Tosun, J.; Burns, C. Mapping state’s Paris climate pledges: Analysing targets and groups at COP 21. Glob. Environ. Chang. 2018, 48, 11–21. [Google Scholar] [CrossRef]
- Pontzen, F.; Liebner, W.; Gronemann, V.; Rothaemel, M.; Ahlers, B. CO2-based methanol and DME—Efficient technologies for industrial scale production. Catal. Today 2011, 171, 242–250. [Google Scholar] [CrossRef]
- Directive 2003/87/EC of the European Parliament and of the Council of 13 October 2003. Available online: https://eur-lex.europa.eu/legal-content/EN/TXT/PDF/?uri=CELEX:32003L0087&from=EN (accessed on 22 March 2019).
- Directive 2009/28/EC of the European Parliament and of the Council of 23 April 2009. Available online: https://eur-lex.europa.eu/legal-content/EN/TXT/PDF/?uri=CELEX:32009L0028&from=EN (accessed on 22 March 2019).
- Stafford, F.N.; Dias, A.C.; Arroja, L.; Labrincha, J.A.; Hotza, D. Life cycle assessment of the production of Portland cement: A Southern Europe case study. J. Clean. Prod. 2016, 126, 159–165. [Google Scholar] [CrossRef]
- El Ouahrani, A.; Mesa, J.M.; Merzouki, A. Anthropogenic CO2 emissions from fossil fuels. Int. J. Clim. Chang. Strat. Manag. 2011, 3, 16–28. [Google Scholar] [CrossRef]
- Geissdoerfer, M.; Savaget, P.; Bocken, N.M.P.; Hultink, E.J. The Circular Economy—A new sustainability paradigm? J. Clean. Prod. 2017, 143, 757–768. [Google Scholar] [CrossRef]
- Huecker, S. Cradle to Cradle: Incorporating Natures´s Plan. Environ. Mag. 2007, 18, 35. [Google Scholar]
- Prieto-Sandoval, V.; Jaca, C.; Ormazabal, M. Towards a consensus on the circular economy. J. Clean. Prod. 2018, 179, 605–615. [Google Scholar] [CrossRef]
- Türkeli, S.; Kemp, R.; Huang, B.; Bleischwitz, R.; McDowall, W. Circular economy scientific knowledge in the European Union and China: A bibliometric, network and survey analysis (2006–2016). J. Clean. Prod. 2018, 197, 1244–1261. [Google Scholar] [CrossRef]
- Cetin, M. Landscape Engineering, Protecting Soil, and Runoff Storm Water; IntechOpen: London, UK, 2013; pp. 697–722. [Google Scholar]
- Rowhani, A.; Rainey, T.J. Scrap Tyre Management Pathways and Their Use as a Fuel—A Review. Energies 2016, 9, 888. [Google Scholar] [CrossRef]
- Cetin, M. Consideration of permeable pavement in landscape architecture. J. Environ. Prot. Ecol. 2015, 16, 385–392. [Google Scholar]
- Singh, R.K.; Ruj, B.; Jana, A.; Mondal, S.; Jana, B.; Sadhukhan, A.K.; Gupta, P. Pyrolysis of three different categories of automotive tyre wastes: Product yield analysis and characterization. J. Anal. Appl. Pyrolysis 2018, 135, 379–389. [Google Scholar] [CrossRef]
- Chatziaras, N.; Psomopoulos, C.S.; Themelis, N.J. Use of waste derived fuels in cement industry: A review. Manag. Environ. Qual. Int. J. 2016, 27, 178–193. [Google Scholar] [CrossRef]
- Quek, A.; Balasubramanian, R. Mathematical modeling of rubber tire pyrolysis. J. Anal. Appl. Pyrolysis 2012, 95, 1–13. [Google Scholar] [CrossRef]
- Communication from the Commission to the European Parliament, the Council, the European Economic and Social Committee and the Committee of the Regions—The Role of Waste-to-Energy in the Circular Economy. Available online: http://ec.europa.eu/environment/waste/waste-to-energy.pdf (accessed on 20 March 2019).
- Sarc, R.; Lorber, E.K.; Pomberger, R.; Rogetzer, M.; Sipple, E.M. Design, quality, and quality assurance of solid recovered fuels for the substitution of fossil feedstock in the cement industry. Waste Manag. Res. 2014, 32, 565–585. [Google Scholar] [CrossRef] [PubMed]
- Schneider, M. Process technology for efficient and sustainable cement production. Cem. Concr. Res. 2015, 78, 14–23. [Google Scholar] [CrossRef]
- Lamas, W.D.Q.; Palau, J.C.F.; De Camargo, J.R. Waste materials coprocessing in cement industry: Ecological efficiency of waste reuse. Renew. Sustain. Energy Rev. 2013, 19, 200–207. [Google Scholar] [CrossRef]
- Lecouls, H.; Klöpffer, W. Note on the critical review of the study “Life Cycle Assessment for the different used tyres recycling methods” prepared for Aliapur by Ecobilan. Int. J. Life Cycle Assess. 2010, 15, 893–895. [Google Scholar] [CrossRef]
- Genon, G.; Brizio, E. Perspectives and limits for cement kilns as a destination for RDF. Waste Manag. 2008, 28, 2375–2385. [Google Scholar] [CrossRef]
- Molino, A.; Donatelli, A.; Marino, T.; Aloise, A.; Rimauro, J.; Iovane, P. Waste tire recycling process for production of steam activated carbon in a pilot plant. Resour. Conserv. Recycl. 2018, 129, 102–111. [Google Scholar] [CrossRef]
- Plaza, M.G.; Martínez, S.; Rubiera, F. CO2 Capture, use, and Storage in the Cement Industry: State of the Art and Expectations. Energies 2020, 13, 5692. [Google Scholar] [CrossRef]
- Haneklaus, N.; Zheng, Y.; Allelein, H.-J. Stop Smoking—Tube-In-Tube Helical System for Flameless Calcination of Minerals. Processes 2017, 5, 67. [Google Scholar] [CrossRef]
- Mora, P.; Alarcón, A.; Tercero, S.; Llamas, B. Method to assess biomass in scrap tires: Spanish cement sector as a case study. Environ. Dev. Sustain. 2020, 1–18. [Google Scholar] [CrossRef]
- Dirección General de Tráfico. Available online: http://www.dgt.es/es/seguridad-vial/estadisticas-e-indicadores/parque-vehiculos/tablas-estadisticas (accessed on 16 February 2021).
- Januszewicz, K.; Klein, M. Thermogravimetric analysis/pyrolysis of used tyres and waste rubber. Physicochem. Probl. Miner. Process. 2017, 53, 802–811. [Google Scholar] [CrossRef]
- Han, J.; Li, W.; Liu, D.; Qin, L.; Chen, W.; Xing, F. Pyrolysis characteristic and mechanism of waste tyre: A thermogravimetry-mass spectrometry analysis. J. Anal. Appl. Pyrolysis 2018, 129, 1–5. [Google Scholar] [CrossRef]
- Islam, M.R.; Haniu, H.; Fardoushi, J. Pyrolysis kinetics behavior of solid tire wastes available in Bangladesh. Waste Manag. 2009, 29, 668–677. [Google Scholar] [CrossRef]
- Mikulčić, H.; Klemeš, J.J.; Vujanović, M.; Urbaniec, K.; Duić, N. Reducing greenhouse gasses emissions by fostering the deployment of alternative raw materials and energy sources in the cleaner cement manufacturing process. J. Clean. Prod. 2016, 136, 119–132. [Google Scholar] [CrossRef]
- Hendriks, C.; Worrell, E.; Price, L.; Martin, N.; Meida, L.O.; De Jager, D.; Riemer, P. Emission reduction of greenhouse gases from the cement industry. In Proceedings of the 4th International Conference on Greenhouse Gas Control Technologies, Interlaken, Austria, 13 July 2003; pp. 939–944. [Google Scholar] [CrossRef]
- Schneider, M.; Romer, M.; Tschudin, M.; Bolio, H. Sustainable cement production—Present and future. Cem. Concr. Res. 2011, 41, 642–650. [Google Scholar] [CrossRef]
- Energy Technology Perspectives 2012—Pathways to a Clean Energy System. Available online: https://www.iea.org/reports/energy-technology-perspectives-2012 (accessed on 2 April 2019).
- Machin, E.B.; Pedroso, D.T.; De Carvalho, J.A. Energetic valorization of waste tires. Renew. Sustain. Energy Rev. 2017, 68, 306–315. [Google Scholar] [CrossRef]
- Cooper, C.D.; Kim, B.; Macdonald, J. Estimating the Lower Heating Values of Hazardous and Solid Wastes. J. Air Waste Manag. Assoc. 1999, 49, 471–476. [Google Scholar] [CrossRef]
- Clark, G.M. Burning Tires for Fuel and Tire Pyrolysis: Air Implications; Durham University: Durham, UK, 1999; p. 140. [Google Scholar]
- Savitsky, D.P.; Stanishevskii, Y.M.; Gizha, S.S.; Tur’Yanskii, A.G. Desulfurization of Brown Coal in Water under Supercritical Conditions. Solid Fuel Chem. 2018, 52, 143–152. [Google Scholar] [CrossRef]
- Dmitrienko, M.A.; Nyashina, G.S.; Strizhak, P.A. Major gas emissions from combustion of slurry fuels based on coal, coal waste, and coal derivatives. J. Clean. Prod. 2018, 177, 284–301. [Google Scholar] [CrossRef]
- Wang, R.; Zhao, Z.; Liu, J.; Lv, Y.; Ye, X. Enhancing the storage stability of petroleum coke slurry by producing biogas from sludge fermentation. Energy 2016, 113, 319–327. [Google Scholar] [CrossRef]
- Zhang, Q.; Tian, W.; Zheng, Y.; Zhang, L. Fuel consumption from vehicles of China until 2030 in energy scenarios. Energy Policy 2010, 38, 6860–6867. [Google Scholar] [CrossRef]
- Nukman, S.R.; Yani, I.; Arief, T. The blending effect of coalite, coconut shell charcoal and gelam wood charcoal on calorific value. Am. J. Appl. Sci. 2014, 11, 833–836. [Google Scholar] [CrossRef][Green Version]
- Štícha, V.; Macků, J.; Zahradník, D.; Klvač, R.; Nuhlíček, O.; Ruman, D. Seasoning Poplar (Populus maximowiczii × Populus nigra ´Max 4–5´) Wood using Evapotranspiration. BioResources 2018, 13, 7496–7507. [Google Scholar] [CrossRef]
- MAPAMA. Fabricación de Cemento (Combustión). Available online: https://www.mapama.gob.es/es/calidad-yevaluacion-ambiental/temas/sistema-espanol-de-inventario-sei-/030311-combust-fabric-cemento_tcm30-430164.pdf (accessed on 17 February 2021).


Publisher’s Note: MDPI stays neutral with regard to jurisdictional claims in published maps and institutional affiliations. |
© 2021 by the authors. Licensee MDPI, Basel, Switzerland. This article is an open access article distributed under the terms and conditions of the Creative Commons Attribution (CC BY) license (http://creativecommons.org/licenses/by/4.0/).