Abstract
The flexible packaging industry has registered a significant growth over the last years, especially due to rising demand from healthcare, automotive, construction, food, beverage, and retail industries. It is essential for the production plants to regularly assess their ability to achieve performance target objectives and, at the same time, to compare their performance with that of factories from the same industry. By combining qualitative and quantitative research, this study proposes a set of thirty-two key performance indicators (KPIs), grouped into six activity areas, believed to be adequate to the flexible packaging industry, for assessing the operational performance. The analytical hierarchy process (AHP) method was employed to obtain the weights of the KPIs and to select the best manufacturing facility from a leading flexible packaging company in line with the opinions of experts that activate in this field. The results indicated that the main aspects considered by experts for assessing manufacturing plants operational performance were financial issues followed by production, customers contentment, quality, employee satisfaction and environmental protection. The proposed practical framework for assessing the operational performance along with the detailed information obtained in the paper are expected to represent important benchmarks for stakeholders involved in the decision-making process for flexible packaging industry.
1. Introduction
The contemporary production environment is highlighted by globalization, increasing competition, growing customer demand for new, more complex, and customizable products frequently with shorter life cycles, accelerated adoption of technological innovation, and rising customer expectations concerning the quality of the products [1,2,3].
The operational performance is usually employed to evaluate a company’s operational superiority [4,5]. The performance of a manufacturing company represents its capability to attain the clearly defined goals as efficiently and effectively as possible by making use of its available resources [6].
In order to achieve an excellent performance, the synchronizing of manufacturing function and business strategy is required [7]. A better competitiveness may be reached by developing a manufacturing strategy which helps to exploit the manufacturing function’s strategic capability [8]. Thus, a superior performance may be achieved by an appropriate manufacturing strategy development and implementation [1].
Valaskova et al. [9] investigated, the main challenges companies faced so as to adopt smart manufacturing solutions, including artificial intelligence ones, for a performance-based planning and decision making in smart manufacturing. Operational performance underpins a competitive and profitable company. It is not enough for a company to be competitive only today, but on the contrary, it has to remain competitive for long-term. In the modern production environment, the competitiveness and sustainability of a manufacturing company are closely related [10]. The speed, cost, quality, flexibility and delivery are frequently used to assess the enterprise’s operational performance [11,12,13,14,15,16]. One of the most important factors that cause the success of a firm in today’s competitive market is performance measurement [17], the process in which the effectiveness and efficiency of an action is being assessed [18].
The companies operating in the flexible packaging industry have to measure their operational performance at regular intervals and, at the same time, to compare it with that of other organizations from the same industry. It is also very important that if a company has more than one production plant, their operational performance should be measured periodically for each of them, in order to take the appropriate measures at the right time.
Establishing the appropriate performance indicators for a complete assessment of operational performance represents a starting point of the performance measurement process. For assessing and enhancing the operational performance for a company from the flexible packaging industry, specific KPIs are required. KPIs are one of the most important performance measurement tools employed for assessing the company’s actual performance and, at the same time, to establish the suitable strategies for improvement.
KPIs can vary from industry to industry, mainly due to the specific processes that have to be evaluated. KPIs can be used for measuring performance and identifying waste in various areas of a company [19]. KPI help decision makers to evaluate the progress towards the achievement of a specific stated goal [20]. KPI inform stakeholders if the firm is heading in the right direction or not, highlighting the gap between current and planned performance [21].
KPI topic has received lots of attention, especially in the last decade. Numerous studies have been performed to examine performance indicators from different industries. KPIs for an aggregates production plant have been investigated by Bhadani et al. [22] and it was found that they are valuable in diagnosing and comparing the equipment and processes performance. KPIs for augmented reality in automotive industry were identified by Jetter et al. [23] and their benefits were highlighted. Bhatti et al. [24] explored KPIs and their impact on the companies’ performance in the manufacturing sector, being revealed that enterprises are focusing especially on customer satisfaction and delivery reliability. Quality KPIs for food and pharmaceutical companies were investigated by Torkko et al. [25] and it was noticed that pharmaceutical industry was slightly behind the food industry in the usage of these indicators. Ali et al. [26] identified a set of KPIs, classified into five activity areas, for evaluating the performance of companies operating in construction industry in Saudi Arabia and it was revealed that the most important KPIs are those from financial areas. KPIs, classified to five primary criteria groups, for assessing the performance of sanitary sewer systems in South Korea have been investigated by Nam et al. [27] and, it was found that experts pay more attention to operation and maintenance aspect, whilst management is the least prioritized criteria group. Key performance evaluation indicators for the marketing alliance amongst the credit card issuing banks and catering industry has been explored by Chiang et al. [28] and thirty KPIs grouped into five areas have been identified, the customer aspect being the most important one, while the internal process is the least valued aspect. The perceptions of higher education administrators and professors concerning quality in higher education institutions have been investigated by Varouchas et al. [29] and specific KPIs that can be used by universities for assessing multiple aspects of quality have been proposed.
Multi-criteria decision-making (MCDM) methods are structured approaches for modelling complex decision-making problems [30]. AHP is one of the most commonly used MCDM methods due to its flexibility and simplicity [31]. AHP is one of the most suitable approaches for assessing complex alternatives based on multiple criteria that implies both objective and subjective judgement [32].
AHP method was employed to identify the importance weights of KPI. AHP method was used for assessing the importance of KPIs for sustainable intelligent buildings [33]. The importance level of KPIs designed to evaluate the sustainable supply chain management for palm oil processing industry in Indonesia was measured by use of AHP method [34]. AHP method was employed to hierarchize KPIs used to assess sustainable production in oil and gas sector [35]. Khalil et al. [36] used AHP method for classifying building performance’s indicators. AHP has been applied to prioritize the KPIs used to evaluate the performance of the sanitary sewer systems [27].
KPIs represent one of the most essential business metrics used to assess the performance of a company or of a specific industry. Each industry has its own particularities, and at the same time its distinctive KPIs. It is very important to establish the most suitable KPIs for a specific industry. In this paper, the proposed set of KPIs contains metrics specific to flexible packaging industry, especially for production, environmental protection and quality areas, and at the same time KPIs used in other industries, like automotive, textile, electronics [24], oil and gas [35], in financial, customers contentment, and employee satisfaction areas. This investigation raises the following major questions: (1) Which KPIs are suitable to assess the operational performance in the flexible packaging industry? and (2) How these KPIs will be ranked?
To date, according to the literature review performed by the authors, no study, using KPIs, has been conducted, to examine the performance of production plants in the flexible packaging industry. To fill this gap, this work aims to establish a set of KPIs that can be used for assessing the operational performance of companies operating in the flexible packaging industry. Expert’s opinions for determining a set of representative KPI’s useful for evaluating the operational performance of production plants in the field of flexible packaging production was obtained through a survey. The AHP method has been applied for calculating the KPIs’ relative weights and an operational performance evaluation of manufacturing facilities belonging to the aforementioned company was performed. The assessment model provides valuable decision-making information to firm’s management and stakeholders in monitoring the health of the enterprise and, at the same time, facilitates patterns identification for securing competitive advantage. The remaining part of this study is organized as follows: in the second section the methodology is outlined. The third section presents a case study to show the usefulness of the proposed methodology at a large company that activates in the flexible packaging industry. The results are pointed out in the fourth section and, finally, the conclusions are exposed in the last section.
2. Materials and Methods
This investigation focuses on establishing an evaluation model for assessing the operational performance of production plants in the flexible packaging industry and, at the same time, on testing the model’s applicability on manufacturing facilities owned by an important company. The methodology used in this paper has the following two principal phases:
- Phase I—KPIs for measuring and monitoring various aspects of the operational performance of production plants were identified based on a survey conducted in a large flexible packaging industry firm in Romania.
- Phase II—AHP method has been applied for determining the weight of each key performance area and KPI and, at the same time to assess the operational performance based on the KPIs identified in the previous phase.
Below, the two phases are presented in detail.
2.1. Phase I: Survey Elements
The process of the establishing the KPIs for evaluating the operational performance in flexible packaging industry has been approached in the following three steps.
- Step I—A literature-based review has been performed in order to determine potential metrics to assess and compare the operational performance of flexible packaging firms.
- Step II—Semi-structured interviews with industry experts have been conducted, a method used in similar research studies [37], to discuss the opportunity of implementing indicators ascertained in the previous step and, at the same time, to identify their suggested KPIs. Adler and Adler [38] pointed out that the number of interviews should vary between 12 and 60, in line with the purpose. The authors conducted a total of thirty interviews with experts. The interviewees that are working at the aforementioned company were selected to have at least ten years of experience in the flexible packaging industry. The interviews, lasting between thirty and forty minutes, were conducted over the first three months of 2020. The purpose sampling method has been applied in order to choose the participants for this investigation. The adopted method does not require a particular number of participants and it is very practical in situations where not all the members of a specific organization can provide the necessary knowledge or information, but only a part of them [39,40,41]. Due to the fact that a research gap in assessing the performance of production plants in the flexible packaging industry has been pointed out in the literature review, industry professionals have been selected as central participants to collect their views, knowledges and practices regarding operational performance evaluation process. The professionals were composed of plant general managers (6.67%), production managers (20%), quality managers (16.67%), financial managers (10%), sales managers (16.67%), human resource managers (13.33%), and supply chain managers (16.67%). In order to measure the operational performance of companies from flexible packaging industry, the speed, cost, quality, flexibility and dependability [42,43] aspects have been evaluated. In this study, KPIs were classified into six activity areas, namely production, quality, financial, customer’s contentment, employee satisfaction, and environmental protection. The manifest content analysis has been used to analyze the data collected from the interviews for establishing feasible metrics grouped into activity areas in accordance with [44]. The adopted analysis is used when the investigator reports what interviewees say, stays close to the text, and depicts what is visible and evident from the text [45]. Both authors of this paper performed the analysis independently and a consensus has been attained regarding the results for enhancing the validity as noticed in Graneheim et al. [46]. One of the most important conclusions drawn during the interviews was that it is recommended an adequate number of performance indicators in key performance areas to be provided to obtain a comprehensive framework for measuring the organization’s operational performance, an aspect also noticed in Badawy et al. [47].
- Step III—A questionnaire has been developed and distributed to the interviewed industry experts for validating the set of KPIs determined in the previous step. Investigation using questionnaires represents a method employed for performance assessment in similar research studies [48], where KPIs were grouped into key performance areas. The closed questions in the questionnaire were designed to capture the industry professionals’ opinions with respect to importance they attach to each identified metric consistent with [26,48]. In order to improve the questionnaire clarity, before it has been distributed among the experts, a pre-testing with three managers has been performed. The experts were asked to provide their knowledge-based judgement by using a five-points Likert-type scale (1—very low importance; 2—low importance; 3—medium importance; 4—high importance, 5—very high importance). They rated the importance of each metric in assessing the operational performance of flexible packaging companies. In order to establish the final set of KPIs, the questionnaire method results have been collected with a 100% response rate. Table 1 shows the survey results, both the KPIs proposed during the interviews, and the ranking determined by questionnaire filling.
 Table 1. Descriptive statistics for the key performance areas and KPIs.
Cronbach’s alpha has been determined for investigating the questionnaire’s scale reliability or internal consistency. It can be noticed that all the Cronbach’s alpha values are greater than the minimum acceptable value of 0.7 [49]. The final set of KPIs includes all the performance metrics that scored more than 60% importance, in line with similar research studies [48].
2.2. Phase II: AHP Implementation
Once the final set of KPIs has been determined, the application of AHP method for evaluating and comparing the operational performance of flexible packaging companies is applied.
The major steps of AHP method application for this study are presented below [35,50,51]. The first step consists of modelling the decision problem as a hierarchy that includes a goal, criteria and variants. Assessing the operational performance of production plants from flexible packaging industry represents the goal. The identified KPIs within KPIs areas are the criteria used to evaluate the variants, which are the manufacturing plants. In the second step, the judgement matrix is constructed. It is a square matrix obtained by pairwise comparisons among elements that is assessing for every criterion the relative importance of each variant. The decision maker’s preferences about pairwise comparisons are expressed by using a 1–9 scale, as shown in Table 2. The pairwise comparison was made by ten top managers of the same company who have a considerable work experience; they have previously worked at various worldwide companies operating in the flexible packaging industry.
Table 2.
Relative importance’ scale [52].
The managers expressed their preferences on the KPIs individually by using the scale presented in Table 2 and then the geometrical average was computed. The judgement matrix Anxn elements have the structure defined by Equation (1).
where xi and xj—weight value of i and j, respectively; i and j = 1, 2 … n; n—number of criteria.
The next step consists of computing a weight vector, x, containing the relative weights of the elements of hierarchy as defined by Equation (2).
where λmax—largest eigenvalue of judgement matrix. By normalizing the principle eigenvector of A, can be calculated x.
The pairwise comparisons have to be evaluated for avoiding conflicting results by calculating the corresponding consistency ratio (CR). In order to be consistent, the corresponding CR of the judgement matrix has to be less than ten percent [53]. The consistency index (CI) is determined by using Equation (3).
The random index (RI) is calculated by using Equation (4) [36].
The CR is calculated by dividing the CI by the RI, as in Equation (5):
If the CR has a value greater than ten percent, then the level of inconsistency is considered unacceptable and the comparison has to be repeated. The final ranking is obtained by comparing the variants against criteria from each area and by multiplying them with the corresponding determined weight vectors.
3. Case Study Presentation
Further on is presented the case study carried out in cooperation with the management of one of the leading flexible packaging companies. The manufacturing facilities of this company are situated both in Romania and in other European countries. The AHP based hierarchical structure for evaluating the operational performance of production plants operating in flexible packaging industry is shown in Figure 1.
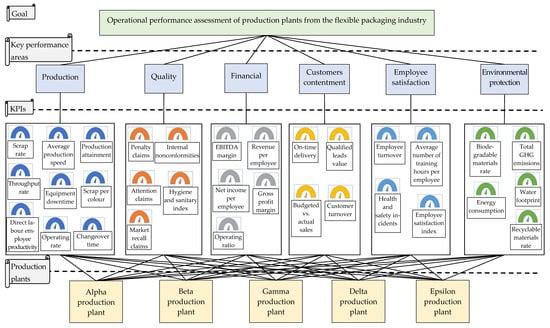
Figure 1.
The hierarchy structure of the problem.
KPIs from production, quality, financial, customers contentment, employee satisfaction and environmental protection areas are employed in forming a hierarchy. The hierarchical structure includes four levels. The top level is the goal of this investigation. The second level contains the key performance areas. The third level encompasses the proposed KPIs corresponding to each key performance area and the bottom level comprises the manufacturing plants (Alpha, Beta, Gamma, Delta, and Epsilon) belonging to the investigated company that performs in the field of flexible packaging production.
The KPIs with a determined average of at least 3, according to the information in Table 1, were included in the final set. Figure 1 presents the framework of the hierarchical structure of the problem.
The proposed KPIs related to production are presented as follows. Scrap rate represents the percentage of failed production in relation to the total production obtained in manufacturing plant in kg per month. Equipment’s average production speed can be determined as a ratio between the total monthly production in linear meters and the run time. Throughput rate quantifies the average production in kg or square meters or linear meters on a manufacturing plant per month. Colour changeover time represents the average time it takes a colour to be changed in the manufacturing processes. Production attainment shows the percentage of actual quantity produced in relation to the production schedule per month. Scrap per colour measures the average failed production from an order in relation to average number of colours. Operating rate reveals the percentage of actual manufacturing plant utilization in relation to the total potential capacity. Direct labour employee productivity reveals the average quantity manufactured in square meters or kg by a direct labour employee per month. Equipment downtime represents the percentage of time the equipment is not operating on the packaging line in relation to the total period measured.
The proposed quality KPIs are summarized as follows. Internal nonconformities represent the number of defective products identified in the plant and are calculated as a percentage of the production volume per month. Attention claims constitute the defects claimed by customers, but are not penalized, being used with a derogation by them, and are determined as a percentage of the sales volume per month. Penalty claims are the defects claimed by customers that are with penalties (return and reverse invoice, discount for use), and are calculated as a percentage of the sales volume per month. Market recall claims represent the defects claimed from the market (consumers or merchants), which are with or without penalties, and are determined as a percentage of the sales volume per month. Hygiene and sanitary index constitute the number of hygiene or sanitation incidents reported by the customer’s factory per month out of the total number of orders entered in the warehouse in that month.
As regards the financial KPIs, they are presented as follows. Revenue per employee shows the average revenues generated by each employee of the manufacturing plant for one month. Earnings before interest, taxes, depreciation, and amortization (EBITDA) margin is employed to assess the profitability by comparing the revenue to earnings and is calculated as a ratio between EBITDA and net sales. Net income per employee is determined as a ratio between net income and the number of employees. Gross profit margin represents the percentage of the difference between revenue and cost of goods sold in relation to revenue. Operating ratio is determined as a ratio between total operating expenses, including cost of goods sold, and the total net sales.
The proposed KPIs related to customers contentment are presented as follows. On-time delivery is the percentage of times for which a production plant delivers the products to the customers on or before the requested delivery date. This KPI is determined on a monthly basis. Qualified leads value indicates the total value of all the qualified leads in the pipeline. Budgeted vs. actual sales represents the percentage of the difference between actual sales and budgeted sales in relation to actual sales. Customer turnover shows the capability to preserve customers and is calculated as a ratio between lost customers over a specific month and the total number of customers at the end of that month.
The proposed employee satisfaction KPIs are summarized as follows. Employee turnover is determined by dividing the number of employees that are leaving the manufacturing plant over a specific month by the average number of employees over the same month. Average number of training hours per employee shows the way the manufacturing plant is developing its personnel and is calculated as a ratio between the number of training hours attended by employees and the labour force that has been participated at training programs over a specific month. Health and safety incidents indicate the number of health and safety incidents registered in a manufacturing plant during a month. Employee satisfaction index assesses how satisfied the personnel are at their workplace and is determined based on information collected from an employee’s survey that takes place annually.
As regards the environmental protection KPIs, they are presented as follows. Biodegradable materials rate indicates the percentage of biodegradable materials used to make packaging. Total greenhouse gas (GHG) emissions indicate the GHG emissions in metric tons emitted by the production plant per month. Energy consumption reveals the amount of energy the manufacturing plant is consuming during a year. Water footprint indicates the total freshwater consumption of a manufacturing plant during a year. Recyclable materials rate shows the percentage of recyclable materials used to make packaging.
4. Results
This investigation proposes a comprehensive set of KPIs to establish a practical framework for assessing the operational performance of flexible packaging enterprises. The AHP model was employed to obtain the KPIs’ weights in conformity with the experts’ practical outlook in the first stage and to assess the operational performance of several manufacturing plants belonging to a company that operates in flexible packaging industry in the second stage of the results section. One of the advantages of using the AHP technique is that it takes into account the opinion of experts in determining the importance of performance indicators and, therefore, has a comparatively higher practical applicability by comparison with the investigations relying only on literature review.
In order to calculate the importance weights, the decision makers have defined their preferences. Table 3 shows the importance weight for each key performance area that has been determined based on AHP methodology.
Table 3.
Key performance areas importance weights.
Macharis et al. [54] indicate that selecting weights has a particular significance because it expresses the perceptions and preferences of the decision makers. The importance weights results reveal that certain indicators are less or more valuable than another. As regards the key performance areas, the financial one has the highest importance weight with a value of 0.2962, followed closely by production with a value of 0.2414. The customers contentment, quality and employee satisfaction are ranked the third, fourth and fifth most important key performance areas, while environmental protection is regarded as being the least important with a value of 0.0483. It can be noticed that all the CRs have values less than ten percent, thus it can be stated that the obtained results are valid.
Figure 2 shows the relative weights for each KPI, taking into account every key performance area, based on a computation according to AHP methodology.
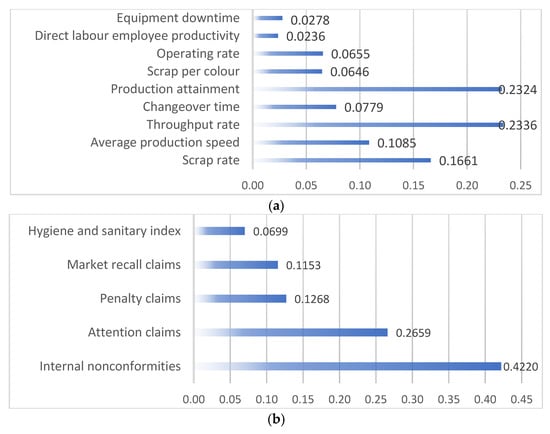
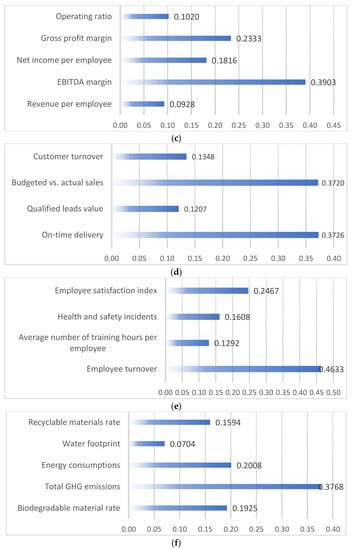
Figure 2.
Relative weights of KPIs as regards (a) production, (b) quality, (c) financial, (d) customers contentment, (e) employee satisfaction, (f) environmental protection key performance area.
With regard to the production key performance area, throughput rate, production attainment and scrap rate were found to be the most important KPIs, the weightings of these criteria amounted more than 63% of the total. Among the KPIs from quality field, internal nonconformities had a significantly higher weight than the others, totaling close to 43%. EBITDA margin is evaluated as being the most valuable indicator regarding financial key performance area, the weight of this criterion being over four times higher than that of revenue per employee one. Within the customers contentment key performance area, on-time delivery was found to be the most important KPI, followed closely by budgeted vs. actual sales, the weightings of these criteria representing almost three quarters of the total.
As regards employee satisfaction key performance area, employee turnover was the most important indicator compared with employee satisfaction index, health and safety incidents, and average hours of training hours per employee. Among the KPIs from environmental protection point of view, total GHG emissions and water footprint are the most important and respectively the least significant performance indicators. The global weights of the proposed KPIs are presented in Figure 3.
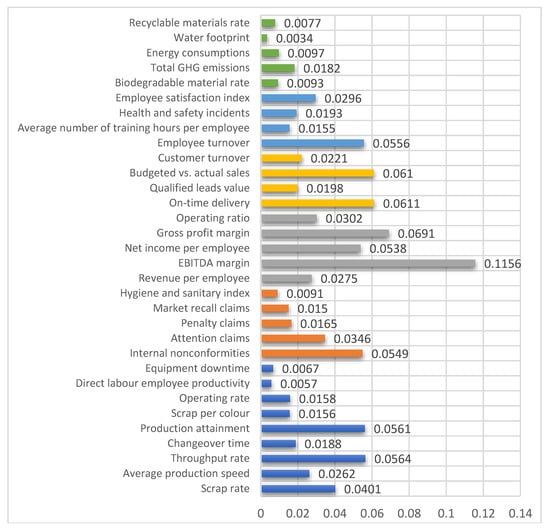
Figure 3.
Global weights of KPIs.
It is important that managers from flexible packaging companies to assess the operational performance considering multiple areas concomitantly. Thereby, assessing the operational performance in terms of production, quality, financial, customers contentment, employee satisfaction, and environmental protection KPIs provide valuable insights that contribute to competitiveness enhancement.
The performance indicators ranked in the first quarter are contributing close to 53% of the global weight, as can be seen in Figure 3. The study revealed that EBITDA margin is the most important KPI according to flexible packaging company managers, with a global weight value of 0.1156. EBITDA margin is also taken into account as an essential metric in other industries, such as airport [55], transportation [56], and mining [57]. At the same time, EBITDA margin represents a useful metric for evaluating the enterprise’ operational performance. Because this KPI does not consider non-operating components, such as financing costs, taxes and depreciating assets, it provides a more precise evaluation regarding operating profitability of a firm. Thus, flexible packaging company managers ranked EBITDA margin as the most valuable metric in assessing the enterprise’ operational performance. Gross profit margin comes second according to its global weightiness after EBITDA margin. Gross profit margin is a metric that highlights the company’s production process efficiency. A higher gross profit margin emphasizes that the enterprise is manufacturing the products efficiently. This KPI is also an essential indicator in construction [58] and automotive retail industry [59].
On-time delivery and budgeted vs. actual sales were ranked third and fourth, respectively. On-time delivery is a fundamental indicator used in measuring the operational performance. It assesses the way the flexible packaging orders are delivered in a predictable manner and secures customer loyalty. This KPI is also an important metric for measuring the performance in industrial services [60] and third-party logistics industry [61]. Budgeted vs. actual sales is a useful metric that highlights the variance in sales performance, emphasizing operational deviations.
Throughput rate and production attainment were ranked fifth and sixth, respectively. Flexible packaging represents the favorite solution for companies operating mainly in healthcare, food, beverage, retail, automotive and construction industry. The companies need to rapidly adapt to manage the changing customer demand. Throughput rate is one of the most valuable metrics employed in assessing the operational performance because it provides valuable insights regarding the output of production plants over a specific time frame. This KPI is also an indispensable performance indicator in manufacturing [62] and aggregate industry [22]. Production attainment underlines the performance of the manufacturing plants in attaining the scheduled production.
Employee turnover and internal nonconformities were ranked seventh and eighth, respectively. Mohr et al. [63] found that employee turnover does not have a positive effect on company’s operational performance, especially where there is a weak group-oriented organizational culture. A high employee turnover leads to significant recruiting and training costs related to the replacing employees, and, at the same time, lost skills and wasted time. Employee turnover also represents a basic performance indicator in other industries, like soft drinks [64], process [65] and retail [66]. The company’s management is aware that the flexible packaging products ordered must live up to customer expectation. Internal nonconformities represent an important indicator employed in evaluating the operational performance because it provides significant insights regarding the production reliability of manufacturing plants. This KPI is also a central performance metric in manufacturing [67], soft drinks [64] and pulp and paper industry [68].
Among the performance metrics ranked in the top quarter of the ranking, two of each come from financial, customer satisfaction and production key performance area and one of each comes from quality and employee satisfaction key performance area, as shown in Figure 3. As concerns KPIs from environmental protection key performance area, the best ranked is total GHG emissions which placed twentieth. Total GHG emissions represent one of the most important metrics that highlights the environmental performance in flexible packaging production. This KPI is also employed for assessing the performance in construction [69], wastewater treatment [70], clean energy [71], water desalinization [72] and airport industry [73]. The European Union Emissions Trading Scheme represents a major instrument to mitigate climate change which aims to decrease GHG emissions [74]. The environmental issues are an increasingly important issue to be dealt by company’s management. Tzouvanas et al. [75] found that environmental performance has a positive effect on financial performance of the companies. In order to promote climate change mitigation, policymakers should provide incentives to support low-carbon investments made by the companies to improve their environmental performance. Environmental protection KPIs play an important role in a sustainable strategy implementation leading to acquire a competitive advantage [76]. Demartini et al. [77] pointed out that a firm’s performance is positively influenced by a sustainable strategy, highlighting the benefits owing to be used by resource efficiency.
The results indicate that the flexible packaging company managers perceive financial area KPIs as being the most important ones, whilst the KPIs from environmental protection area are the least significant, in accordance with the results obtained in the construction [26], oil and gas [35] industries.
The final ranking of manufacturing plants owned by the examined company performing in the field of flexible packaging production is presented in Table 4. It can be noticed that Beta production plant obtained the greatest weight (0.3989) comparatively with the other alternatives, being the most performing one. The company Epsilon was ranked second, whilst the third and fourth variants in the ranking have registered relatively close weight values. On the other hand, Alpha occupies the last place, being the least performing manufacturing plant, with a weight value more than three times lower than the first ranked alternative.
Table 4.
Overall ranking of the variants.
The performance of the manufacturing plants with respect to each key performance areas is presented in Figure 4.
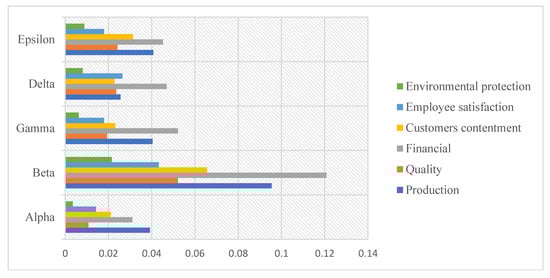
Figure 4.
Manufacturing plants performance.
Beta manufacturing plant obtained the best performances in comparison with all the other alternatives for each of the analysed key performance area. As regards production key performance area, Epsilon alternative was ranked second, followed closely by Gamma and Alpha, while with respect to financial key performance area, Gamma attained the second-best performance, followed by Delta and Epsilon.
Delta registered good performance in employee satisfaction and quality areas, occupying the second, respectively third place in terms of these dimensions. At the other extreme, Alpha ranks last in terms of quality, financial, customer contentment, and employee satisfaction.
5. Conclusions
Over the last decade, the flexible packaging industry has experienced continuous growth, influencing almost all the industries. The operational performance of companies performing in the flexible packaging industry has to be assessed periodically and KPIs are probably the most suitable measurement tools that can be employed.
The continuous enhancement of operational performance is vital for flexible packaging companies to improve their competitiveness in the modern manufacturing environment. It is very important that the top management understand the significant role played by the competitiveness for a prosperous sustainable development of the enterprises.
This paper proposes a set of KPIs that can be used for assessing the operational performance of companies operating in the flexible packaging industry. A total of thirty-two KPIs are proposed, classified into six activity areas respectively production, quality, financial, customers contentment, employee satisfaction and environmental protection. Based on the AHP methodology, an assessment model was developed and the importance of each key performance area and KPI has been determined by assigning importance weights. During the case study that has been carried out in cooperation with the management of an important company that performs in the field of flexible packaging production it was shown that the top management pays more attention to financial and production dimensions. In what regards the operational performance of the five manufacturing facilities belonging to the investigated company the findings indicate that the operational performance of manufacturing plants gets more attention from the financial and production points of view, whilst they are less influenced from environmental protection one. Even though, environmental protection ranked the last, it needs to be taken into account the fact that the flexible packaging industry has registered steady growth over the last decade, but the companies need to gradually enhance their environmental performance over the coming years to cope successfully with rising environmental challenges. One of the most important concerns of managers will be implementing suitable green practices to enhance the operational performance of the company.
The proposed KPIs reveal the strengths and weaknesses, underlining the gap between actual and expected performance. The results provide comprehensive information that can be used by the company’s management to establish the proper strategies for improvement at the right time. The methodology proposed in this study supports the companies operating in the flexible packaging industry to evaluate and improve their operational performance and secure sustainable competitive advantage. For testing the suitability of the proposed KPIs, future works will investigate responses from several other companies that activate in the flexible packaging industry, and even more from sectors that have similar activity.
Author Contributions
Conceptualization, C.C.; methodology, C.C.; software, M.C.; validation, C.C. and M.C.; formal analysis, C.C.; investigation, C.C.; resources, C.C.; data curation, C.C.; writing—original draft preparation, C.C.; visualization, C.C.; supervision, C.C.; project administration, C.C. All authors have read and agreed to the published version of the manuscript.
Funding
This research received no external funding.
Institutional Review Board Statement
Not applicable.
Informed Consent Statement
Informed consent was obtained from all subjects involved in this study.
Data Availability Statement
The data presented in this study are available on request from the corresponding author.
Acknowledgments
This paper was supported by the Project POCU/380/6/13/123927 “Entrepreneurial competences and excellence research in doctoral and postdoctoral programs—ANTREDOC”, project co-founded by the European Social Fund.
Conflicts of Interest
The authors declare no conflict of interest.
References
- Arana-Solares, I.A.; Ortega-Jimenez, C.H.; Alfalla-Luque, R.; Perez-Diez de los Rios, J.L. Contextual factors intervening in the manufacturing strategy and technology management-performance relationship. Int. J. Prod. Econ. 2019, 207, 81–95. [Google Scholar] [CrossRef]
- Trattnera, A.; Hvam, L.; Forzab, C.; Herbert-Hansen, Z.N.L. Product complexity and operational performance: A systematic literature review. CIRP J. Manuf. Sci. Technol. 2019, 25, 69–83. [Google Scholar] [CrossRef]
- Grabowska, A. Inventory management in the smart company industry 4.0. In Proceedings of the 8th International Congress CLC 2018: Carpathian Logistics Congress, Prague, Czech Republic, 3–5 December 2018; pp. 469–474. [Google Scholar]
- Prajogo, D.I.; Sohal, A.S. The integration of TQM and technology/R&D management in determining quality and innovation performance. Omega 2006, 34, 296–312. [Google Scholar] [CrossRef]
- Flynn, B.B.; Huo, B.; Zhao, X. The impact of supply chain integration on performance: A contingency and configuration approach. J. Oper. Manag. 2010, 28, 58–71. [Google Scholar] [CrossRef]
- Neely, A. Measuring performance: The operations management perspective. In Business Performance Measurement: Unifying Theory and Integrating Practice, 2nd ed.; Neely, A., Ed.; Cambridge University Press: Cambridge, UK, 2007; pp. 64–81. [Google Scholar]
- Amoako-Gyampah, K.; Acquaah, M. Manufacturing Strategy, Competitive Strategy and Firm Performance: An Empirical Study in a Developing Economy Environment. Int. J. Prod. Econ. 2008, 111, 575–592. [Google Scholar] [CrossRef]
- Thun, J.-H. Empirical analysis of manufacturing strategy implementation. Int. J. Prod. Econ. 2008, 113, 370–382. [Google Scholar] [CrossRef]
- Valaskova, K.; Throne, O.; Kral, P.; Michalkova, L. Deep Learning-enabled Smart Process Planning in Cyber-Physical System-based Manufacturing. J. Self Gov. Manag. Econ. 2020, 8, 121–127. [Google Scholar]
- Chen, T. Competitive and sustainable manufacturing in the age of globalization. Sustainability 2017, 9, 26. [Google Scholar] [CrossRef]
- Gambi, L.D.N.; Boer, H.; Gerolamo, M.C.; Jørgensen, F.; Carpinetti, L.C.R. The relationship between organizational culture and quality techniques, and its impact on operational performance. Int. J. Oper. Prod. Manag. 2015, 35, 1460–1484. [Google Scholar] [CrossRef]
- Yu, W.; Chavez, R.; Feng, M.; Wiengarten, F. Integrated green supply chain management and operational performance. Supply Chain Manag. 2014, 19, 683–696. [Google Scholar] [CrossRef]
- Baird, K.; Hu, K.J.; Reeve, R. The relationships between organizational culture, total quality management practices and operational performance. Int. J. Oper. Prod. Manag. 2011, 31, 789–814. [Google Scholar] [CrossRef]
- Lau, A.K.W.; Lee, S.H.; Jung, S. The Role of the Institutional Environment in the Relationship between CSR and Operational Performance: An Empirical Study in Korean Manufacturing Industries. Sustainability 2018, 10, 834. [Google Scholar] [CrossRef]
- Santos, H.; Lannelongue, G.; Gonzalez-Benito, J. Integrating Green Practices into Operational Performance: Evidence from Brazilian Manufacturers. Sustainability 2019, 11, 2956. [Google Scholar] [CrossRef]
- Liu, H.; Wu, S.; Zhong, C.; Liu, Y. The Sustainable Effect of Operational Performance on Financial Benefits: Evidence from Chinese Quality Awards Winners. Sustainability 2020, 12, 1966. [Google Scholar] [CrossRef]
- Spitzer, D.R. Transforming Performance Measurement: Rethinking the Way We Measure and Drive Organizational Success; AMACOM: New York, NY, USA, 2007; pp. 9–20. [Google Scholar]
- Neely, A.; Gregory, M.; Platts, K. Performance Measurement System Design: A Literature Review and research agenda. Int. J. Oper. Prod. Manag. 1995, 15, 80–116. [Google Scholar] [CrossRef]
- Lindberg, C.F.; Tan, S.T.; Yan, J.; Starfelt, F. Key Performance Indicators Improve Industrial Performance. Energy Procedia 2015, 75, 1785–1790. [Google Scholar] [CrossRef]
- Gonzalez, E.; Nanos, E.M.; Seyr, H.; Valldecabres, L.; Yürüşen, N.Y.; Smolka, U.; Muskulus, M.; Melero, J.J. Key Performance Indicators for Wind Farm Operation and Maintenance. Energy Procedia 2017, 137, 559–570. [Google Scholar] [CrossRef]
- Zhu, L.; Johnsson, C.; Varisco, M.; Schiraldi, M.M. Key performance indicators for manufacturing operations management—gap analysis between process industrial needs and ISO 22400 standard. Procedia Manuf. 2018, 25, 82–88. [Google Scholar] [CrossRef]
- Bhadani, K.; Asbjorsson, G.; Hulthen, E.; Evertsson, M. Development and implementation of key performance indicators for aggregate production using dynamic simulation. Miner. Eng. 2020, 145, 1–14. [Google Scholar] [CrossRef]
- Jetter, J.; Eimecke, J.; Rese, A. Augmented reality tools for industrial applications: What are potential key performance indicators and who benefits? Comput. Hum. Behav. 2018, 87, 18–33. [Google Scholar] [CrossRef]
- Bhatti, M.I.; Awan, H.M.; Razaq, Z. The key performance indicators (KPIs) and their impact on overall organizational performance. Qual. Quant. 2014, 48, 3127–3143. [Google Scholar] [CrossRef]
- Torkko, M.; Katajavuori, N.; Linna, A.; Juppo, A.M. The Utilization of Quality KPIs in the Pharmaceutical Industry. J. Pharm. Innov. 2014, 9, 175–182. [Google Scholar] [CrossRef]
- Ali, H.A.E.M.; Al-Sulaihi, I.A.; Al-Gahtani, K.S. Indicators for measuring performance of building construction companies in Kingdom of Saudi Arabia. J. King Saud Univ. Eng. Sci. 2013, 25, 125–134. [Google Scholar] [CrossRef]
- Nam, S.-N.; Nguyen, T.T.; Oh, J. Performance Indicators Framework for Assessment of a Sanitary Sewer System Using the Analytic Hierarchy Process (AHP). Sustainability 2019, 11, 2746. [Google Scholar] [CrossRef]
- Chiang, J.-T.; Chiou, C.-C.; Doong, S.-C.; Chang, I.-F. Research on the Construction of Performance Indicators for the Marketing Alliance of Catering Industry and Credit Card Issuing Banks by Using the Balanced Scorecard and Fuzzy AHP. Sustainability 2020, 12, 9005. [Google Scholar] [CrossRef]
- Varouchas, E.; Sicilia, M.-Á.; Sánchez-Alonso, S. Academics’ Perceptions on Quality in Higher Education Shaping Key Performance Indicators. Sustainability 2018, 10, 4752. [Google Scholar] [CrossRef]
- Durmuşoğlu, Z.D.U. Assessment of techno-entrepreneurship projects by using Analytics Hierarchy Process (AHP). Technol. Soc. 2018, 54, 41–46. [Google Scholar] [CrossRef]
- Karasakal, E.; Aker, P. A multicriteria sorting approach based on data envelopment analysis for R&D project selection problem. Omega 2017, 73, 79–92. [Google Scholar] [CrossRef]
- Huang, C.-C.; Chu, P.-Y.; Chiang, Y.-H. A fuzzy AHP application in government-sponsored R&D project selection. Omega 2008, 36, 1038–1052. [Google Scholar] [CrossRef]
- ALwaer, H.; Clements-Croome, D.J. Key performance indicators (KPIs) and priority setting in using the multi-attribute approach for assessing sustainable intelligent buildings. Build. Environ. 2010, 45, 799–807. [Google Scholar] [CrossRef]
- Kusrini, E.; Primadasa, R. Design of Key Performance Indicators (KPI) for Sustainable Supply Chain Management (SSCM) Palm Oil Industry in Indonesia. In Proceedings of the 2nd International Joint Conference on Advanced Engineering and Technology (IJCAET 2017) and International Symposium on Advanced Mechanical and Power Engineering (ISAMPE 2017), Bali, Indonesia, 24–26 August 2017. [Google Scholar] [CrossRef]
- Elhuni, R.M.; Ahmad, M.M. Key Performance Indicators for Sustainable Production Evaluation in Oil and Gas Sector. Procedia Manuf. 2017, 11, 718–724. [Google Scholar] [CrossRef]
- Khalil, N.; Kamaruzzaman, S.N.; Baharum, M.R. Ranking the indicators of building performance and the users’ risk via Analytical Hierarchy Process (AHP): Case of Malaysia. Ecol. Indic. 2016, 71, 567–576. [Google Scholar] [CrossRef]
- Khalifa, M.; Khalid, P. Developing Strategic Health Care Key Performance Indicators: A Case Study on a Tertiary Care Hospital. Procedia Comput. Sci. 2015, 63, 459–466. [Google Scholar] [CrossRef]
- Adler, P.; Adler, P. Expert voice. In How Many Qualitative Interviews Are Enough? Baker, S.E., Edwards, R., Eds.; National Centre for Research Methods: Southampton, UK, 2012; pp. 8–11. [Google Scholar]
- Tongco, M.D.C. Purposive sampling as a tool for informant selection. Ethnobot. Res. Appl. 2007, 5, 147–158. [Google Scholar] [CrossRef]
- Li, S.; Long, C.; Liu, F.; Lee, S.; Guo, Q.; Li, R.; Liu, Y. Herbs for medicinal baths among the traditional Yao communities of China. J. Ethnopharmacol. 2006, 108, 59–67. [Google Scholar] [CrossRef]
- Buhusayen, B.; Seet, P.-S.; Coetzer, A. Front-Line Management during Radical Organisational Change: Social Exchange and Paradox Interpretations. Sustainability 2021, 13, 893. [Google Scholar] [CrossRef]
- Slack, N.; Chambers, S.; Johnston, R. Operations Management, 6th ed.; Pearson: Harlow, UK, 2010; pp. 32–59. [Google Scholar]
- Shah, R.; Ward, P.T. Lean manufacturing: Context, practice bundles, and performance. J. Oper. Manag. 2003, 21, 129–149. [Google Scholar] [CrossRef]
- Kondracki, N.L.; Wellman, N.S.; Amundson, D.R. Content Analysis: Review of Methods and Their Applications in Nutrition Education. J. Nutr. Educ. Behav. 2002, 34, 224–230. [Google Scholar] [CrossRef]
- Bengtsson, M. How to plan and perform a qualitative study using content analysis. NursingPlus 2016, 2, 8–14. [Google Scholar] [CrossRef]
- Graneheim, U.H.; Lundman, B. Qualitative content analysis in nursing research: Concepts, procedures and measures to achieve trustworthiness. Nurse Educ. Today 2004, 24, 105–112. [Google Scholar] [CrossRef]
- Badawy, M.; El-Aziz, A.A.A.; Idress, A.M.; Hefny, H.; Hossam, S. A survey on exploring key performance indicators. Future Comput. Inform. J. 2016, 1, 47–52. [Google Scholar] [CrossRef]
- Eshtaiwi, M.; Badi, I.; Abdulshahed, A.; Erkan, T.E. Determination of key performance indicators for measuring airport success: A case study in Libya. J. Air Transp. Manag. 2018, 68, 28–34. [Google Scholar] [CrossRef]
- Lin, C.J.; Belis, T.T.; Kuo, T.C. Ergonomics-Based Factors or Criteria for the Evaluation of Sustainable Product Manufacturing. Sustainability 2019, 11, 4955. [Google Scholar] [CrossRef]
- Alaqeel, T.A.; Suryanarayanan, S. A fuzzy Analytic Hierarchy Process algorithm to prioritize Smart Grid technologies for the Saudi electricity infrastructure. Sustain. Energy Grids Netw. 2018, 13, 122–133. [Google Scholar] [CrossRef]
- Li, H.; Ni, F.; Dong, Q.; Zhu, Y. Application of analytic hierarchy process in network level pavement maintenance decision-making. Int. J. Pavement Res. Technol. 2018, 11, 345–354. [Google Scholar] [CrossRef]
- Saaty, T.L. How to make a decision: The analytic hierarchy process. Eur. J. Oper. 1990, 48, 9–26. [Google Scholar] [CrossRef]
- Saaty, T.L. Decision Making with the Analytic Hierarchy Process. Int. J. Serv. Sci. 2008, 1, 83–98. [Google Scholar] [CrossRef]
- Macharis, C.; Springael, J.; De Brucker, K.; Verbeke, A. PROMETHEE and AHP: The design of operational synergies in multicriteria analysis. Strengthening PROMETHEE with ideas of AHP. Eur. J. Oper. Res. 2004, 153, 307–317. [Google Scholar] [CrossRef]
- Vogel, H.A.; Graham, A. Devising airport grouping for financial benchmarking. J. Air Transp. Manag. 2013, 30, 32–38. [Google Scholar] [CrossRef]
- Mao, X.; Gan, J.; Zhao, X. Debt risk evaluation of toll freeways in Mainland China using the grey approach. Sustainability 2019, 11, 1430. [Google Scholar] [CrossRef]
- MacDiarmid, J.; Tholana, T.; Musingwini, C. Analysis of key value drivers for major mining companies for the period 2006–2015. Resour. Policy 2018, 56, 16–30. [Google Scholar] [CrossRef]
- Bilal, M.; Oyedele, L.O.; Kusimo, H.O.; Owolabi, H.A.; Akanbi, L.A.; Ajayi, A.O.; Akinade, O.O.; Delgado, J.M.D. Investigating profitability performance of construction projects using big data: A project analytics approach. J. Build. Eng. 2019, 26, 100850. [Google Scholar] [CrossRef]
- Hines, P.; Silvi, R.; Bartolini, M. Demand chain management: An integrative approach in automotive retailing. J. Oper. Manag. 2002, 20, 707–728. [Google Scholar] [CrossRef]
- Meier, H.; Lagemann, H.; Morlock, F.; Rathmann, C. Key Performance Indicators for Assessing the Planning and Delivery of Industrial Services. Procedia CIRP 2013, 11, 99–104. [Google Scholar] [CrossRef]
- Domingues, M.L.; Reis, V.; Macário, R. A comprehensive framework for measuring performance in a third-party logistics provider. Transp. Res. Procedia 2015, 10, 662–672. [Google Scholar] [CrossRef]
- Kang, N.; Zhao, C.; Li, J.; Horst, J.A. A hierarchical structure of key performance indicators for operation management and continuous improvement in production systems. Int. J. Prod. Res. 2016, 54, 6333–6350. [Google Scholar] [CrossRef] [PubMed]
- Mohr, D.C.; Young, G.I.; Burgess, J.F., Jr. Employee turnover and operational performance: The moderating effect of group-oriented organisational culture. Hum. Resour. Manag. J. 2012, 22, 216–233. [Google Scholar] [CrossRef]
- Pinna, C.; Demartini, M.; Tonelli, F.; Terzi, S. How Soft Drink Supply Chains drive sustainability: Key Performance Indicators (KPIs) identification. Procedia CIRP 2018, 72, 862–867. [Google Scholar] [CrossRef]
- Jovan, V.; Zorzut, S.; Gradišar, D.; Dorneanu, B. Closed-loop production control of polymerization plant using production KPIs. IFAC Proc. Vol. 2007, 40, 553–558. [Google Scholar] [CrossRef]
- Erol, I.; Sencer, S.; Sari, R. A new fuzzy multi-criteria framework for measuring sustainability performance of a supply chain. Ecol. Econ. 2011, 70, 1088–1100. [Google Scholar] [CrossRef]
- Varisco, M.; Deuse, J.; Johnsson, C.; Nöhring, F.; Schiraldi, M.M.; Wöstmann, R. From production planning flows to manufacturing operation management KPIs: Linking ISO18828 & ISO22400 standards. IFAC PapersOnLine 2018, 51, 25–30. [Google Scholar] [CrossRef]
- Chioua, M.; Bauer, M.; Chen, S.-L.; Schlake, J.C.; Sand, G.; Schmidt, W.; Thornhill, N.F. Plant-wide root cause identification using plant key performance indicators (KPIs) with application to a paper machine. Control Eng. Pract. 2016, 49, 149–158. [Google Scholar] [CrossRef]
- Janjua, S.Y.; Sarker, P.K.; Biswas, W.K. Development of triple bottom line indicators for life cycle sustainability assessment of residential buildings. J. Environ. Manag. 2020, 264, 110476. [Google Scholar] [CrossRef]
- Archer, G.; Jin, C.; Parker, W. Benchmarking the sustainability of sludge handling systems in small wastewater treatment plants. J. Environ. Manag. 2020, 256, 109893. [Google Scholar] [CrossRef] [PubMed]
- Colla, M.; Ioannou, A.; Falcone, G. Critical review of competitiveness indicators for energy projects. Renew. Sust. Energy Rev. 2020, 125, 109794. [Google Scholar] [CrossRef]
- Balfaqih, H.; Nopiah, Z.M.; Saibani, N. A conceptual framework for supply chain performance in desalination industry. Int. J. Ind. Eng. Manag. 2016, 7, 95–101. [Google Scholar] [CrossRef]
- Baltazar, M.E.; Rosa, T.; Silva, J. Global decision support for airport performance and efficiency assessment. J. Air Transp. Manag. 2018, 71, 220–242. [Google Scholar] [CrossRef]
- European Commission, EU Emissions Trading System (EU ETS). Available online: https://ec.europa.eu/clima/policies/ets_en (accessed on 30 December 2020).
- Tzouvanas, P.; Kizys, R.; Chatziantoniou, I.; Sagitova, R. Environmental and financial performance in the European manufacturing sector: An analysis of extreme tail dependency. Br. Account. Rev. 2020, 52, 100863. [Google Scholar] [CrossRef]
- Hristov, I.; Chirico, A. The Role of Sustainability Key Performance Indicators (KPIs) in Implementing Sustainable Strategies. Sustainability 2019, 11, 5742. [Google Scholar] [CrossRef]
- Demartini, M.; Pinna, C.; Aliakbarian, B.; Tonelli, F.; Terzi, S. Soft Drink Supply Chain Sustainability: A Case Based Approach to Identify and Explain Best Practices and Key Performance Indicators. Sustainability 2018, 10, 3540. [Google Scholar] [CrossRef]
Publisher’s Note: MDPI stays neutral with regard to jurisdictional claims in published maps and institutional affiliations. |
© 2021 by the authors. Licensee MDPI, Basel, Switzerland. This article is an open access article distributed under the terms and conditions of the Creative Commons Attribution (CC BY) license (http://creativecommons.org/licenses/by/4.0/).