Article

Investigating Regional and Generational Heterogeneity in Low-Carbon Travel Behavior Intention Based on a PLS-SEM Approach

1
Faculty of Infrastructure Engineering, School of Transportation and Logistics, Dalian University of Technology, Dalian 116024, China
2
Faculty of Traffic Engineering, Kunming University of Science and Technology, Kunming 650504, China
*
Authors to whom correspondence should be addressed.
Sustainability 2021, 13(6), 3492; https://doi.org/10.3390/su13063492
Submission received: 1 March 2021 / Revised: 14 March 2021 / Accepted: 15 March 2021 / Published: 22 March 2021
(This article belongs to the Section Sustainable Transportation)

Abstract

:
This study aims at reviewing whether regional and generational differences exist in behavior intention to adopt low-carbon travel modes. Based on 759 questionnaires collected from three cities (Zhenjiang, Suzhou, and Shanghai) with different population sizes in China, we develop a modified theory of planned behavior (MTPB) model framework integrating low-carbon transport policies, psychological aspects, personal norms, and travel habits. A more advanced partial least-square method of structural equation model (PLS-SEM) and a multiple-group analysis (MGA) model are applied to estimate the effects and heterogeneities of these factors on low-carbon travel behavior intention among three cities and four age groups. The results show that the roles of low-carbon policies, subjective norms, and personal norms on behavior intention of adopting low-carbon travel modes are more salient. The effect of low-carbon policy on behavior is much weaker than it is on intention, and it does not follow that such intention will often be followed up with action. There is regional and generational heterogeneity in terms of the influence on low-carbon travel behavior intention. In particular, the benefits of low-carbon policies are more remarkable in the middle-sized city, young adult group, and pre-older adult group. The low-carbon travel behavior intention in the large-sized city, junior-middle adult group, and senior-middle adult group are affected by subjective norms more easily. The large-sized city and young adult group have better personal norms in favor of low-carbon travel. The findings could provide helpful insights into developing heterogeneous transport policies to encourage different travelers to switch from auto to low-carbon travel modes.

1. Introduction

How to develop sustainable transport has played an important role in addressing the issue of climate change in the last decade. With rapid urbanization and motorization, the transportation and automobile industry has gradually become an essential source of greenhouse gas emissions, especially carbon dioxide (CO2) emissions, which was increasing dramatically at almost 7.4% per year during the 32 years from 1980 to 2012 in China [1]. According to academic institutions’ research, the travel issue is a leading cause of growth in transport sector emissions [2]. For instance, Beijing’s CO2 emissions caused by urban residents’ travel have increased by about three times in the past decade, of which private cars accounting for 84% [2]. Therefore, how to encourage urban residents to use low-carbon travel modes effectively, such as walking, biking, and public transport, has become a focus in the area of environment, energy, and transport.
The progress in new energy technology and the adoption of low-carbon travel modes are regarded as the key measures to decrease CO2 emissions in the transport sector [3]. However, the importance of low-carbon travel is often overlooked by managers and authorities. As a matter of fact, several studies have documented that people could remarkably decrease CO2 emissions by only slightly changing their travel modes [4,5]. Therefore, the research has focused on the behavior intention to use low-carbon travel modes and the factors that affect the formation of such a behavior intention from external factors (such as individual income, occupation, and policy benefit) and internal factors (such as attitude, expectation, and beliefs) [4,5,6,7,8]. Based on social psychology research, it has been found that low-carbon travel would be the travel choice after comparing with travel cost, the disadvantages of car travel, environmental concern [9,10], and the green perceived value [11], which are the key variables that affect travel choice. Meanwhile, the theory of planned behavior (TPB) model [4,12], the technology acceptance model (TAM) [10,13], the Value–Belief–Norm (VBN) model [14,15], and their extended and integrated model [11,16,17] have been used to explore the relationship between travel behavior and the influence factors mentioned above by using the structural equation model based on covariance (CB-SEM). Actually, CB-SEM is a bit inappropriate to test the extended, modified, and improved theoretical framework for the first time because of its limitations [18].
In order to reduce CO2 emissions and energy consumption in the transport sector in China, the Chinese government has launched the action plan for green travel from 2019 to 2022, which points out that low-carbon travel will be the direction of Chinese urban traffic development. Therefore, understanding regional and generational differences of behavior intention in choosing low-carbon travel modes will help to develop targeted countermeasures to promote residents’ travel behavior shifting from motorization to low carbonization. However, the current literature in the field of social psychology mainly focuses on the effect of psychological factors on the travel intention; it rarely comprehensively considers the extra utility of transport policy, personal habits, and individual beliefs, and few researchers pay attention to the heterogeneity of behavior intention between various cities and age groups. Jia et al. [5] conducted a large cross- city study (in Beijing, Hangzhou, and Jinan) to analyze the influence of low-carbon factors on commuting mode choice. This is an important piece of research on group heterogeneity in the field of low-carbon travel. However, the interrelationships among factors were oversimplified because they used a basic binary logistic regression model to estimate the probability of travel mode choice. Additionally, many of the studies have been conducted in developed countries, and case studies from developing countries are limited.
This study attempts to address above two gaps in the existing literature. Using 759 questionnaires collected from three cities (Zhenjiang, Suzhou, and Shanghai) with different sizes in China, we develop a modified TPB conceptual framework with integrated low-carbon transport policies, psychological aspects, and personal norms to explore direct and indirect effects of these factors on low-carbon travel behavior intention based on partial least-square method of structural equation modeling (PLS-SEM), and we also compare the differences of these effect paths, directions, and coefficients between various cities and age groups. This study tries to provide a better understanding of how regional and generational heterogeneity would affect Chinese individual low-carbon travel behavior, which has potential implications for public institutions to develop travel demand management policies.
This work is structured as follows. Section 2 presents a systematic literature review on the previous theoretical model. Section 3 presents the data profile and the introduction of PLS-SEM. Section 4 presents the analysis results and finally, the key findings and implications are replicated in Section 5 and Section 6.

2. Theoretical Model

2.1. Previous Models to Explain Behavior Intention

Different theories exist in the literature regarding what could affect individual behavior intention. In general, the existing literature pays particular attention to the theory of planned behavior (TPB) [19], the technology acceptance model (TAM) [20], and the Value–Belief–Norm model (VBN) [21]. There are some differences in explaining individual behavior intention among these models. The TPB model offers three social–psychological factors that influence behavior intention: attitudes towards the behavior (AB), subjective norms (SN), and perceived behavioral control (PBC). The TAM stemming from the theory of reasoned action [22] was usually used to probe into public acceptance regarding a certain new technology, such as automated vehicles [13], shared parking [17], public bike systems [11], and many other fields. Previous research has established that the perceived usefulness (PU) and perceived ease of use (PEU) could exert a positive influence on the adoption of new technologies. Unlike TPB and TAM, a great deal of previous research about the VBN model has mainly focused on environmental studies, which suggested that the formation of pro-environmental behaviors is related to individual values, beliefs, and norms. Hence, the VBN model is widely deemed as an effective tool to reveal the factors influencing energy conservation behavior [23], environmental behavior [24], and supportive behavior of car reduction policies [25].
Over the past decade, some research in the field of behavioral psychology gradually has emphasized the explanatory power and comprehensiveness of the theoretical model. Therefore, integrating, extending, and modifying the abovementioned three models makes them become a general research method. Specially, the unified theory of acceptance and use of technology (UTAUT) [26,27] integrates the social influence (SI), facilitating conditions (FC), user characteristics on the basis of the perceived usefulness (PU), and perceived ease of use (PEU), and the original TAM has been replaced by this model stage by stage. More recently, the UTAUT has become one of the mainstream models to explain AV (automated vehicle) acceptance with behavior theories [28]. Meanwhile, some studies also considered how to link two different theoretical frameworks and integrate other factors to generate a novel explanation paradigm. For example, Liu et al. [6] presented the comprehensive intention determination model (CIDM) by integrating the TPB and VBN model to examine the relationship between travelers’ intentions and factors. Liang et al. [17] combined the TAM and TPB to generate the C-TAM-TPB framework to investigate the intention to use shared parking. Additionally, some researchers developed the extended theoretical conceptual framework to investigate behavior intention by adding other variables. The main additional factors include transport policy (TP) [6], environmental concern (EC) [10], low-carbon awareness (LCA) [4], and personal habits (PH) [23]. The representative behavior intention models are presented in Table 1.

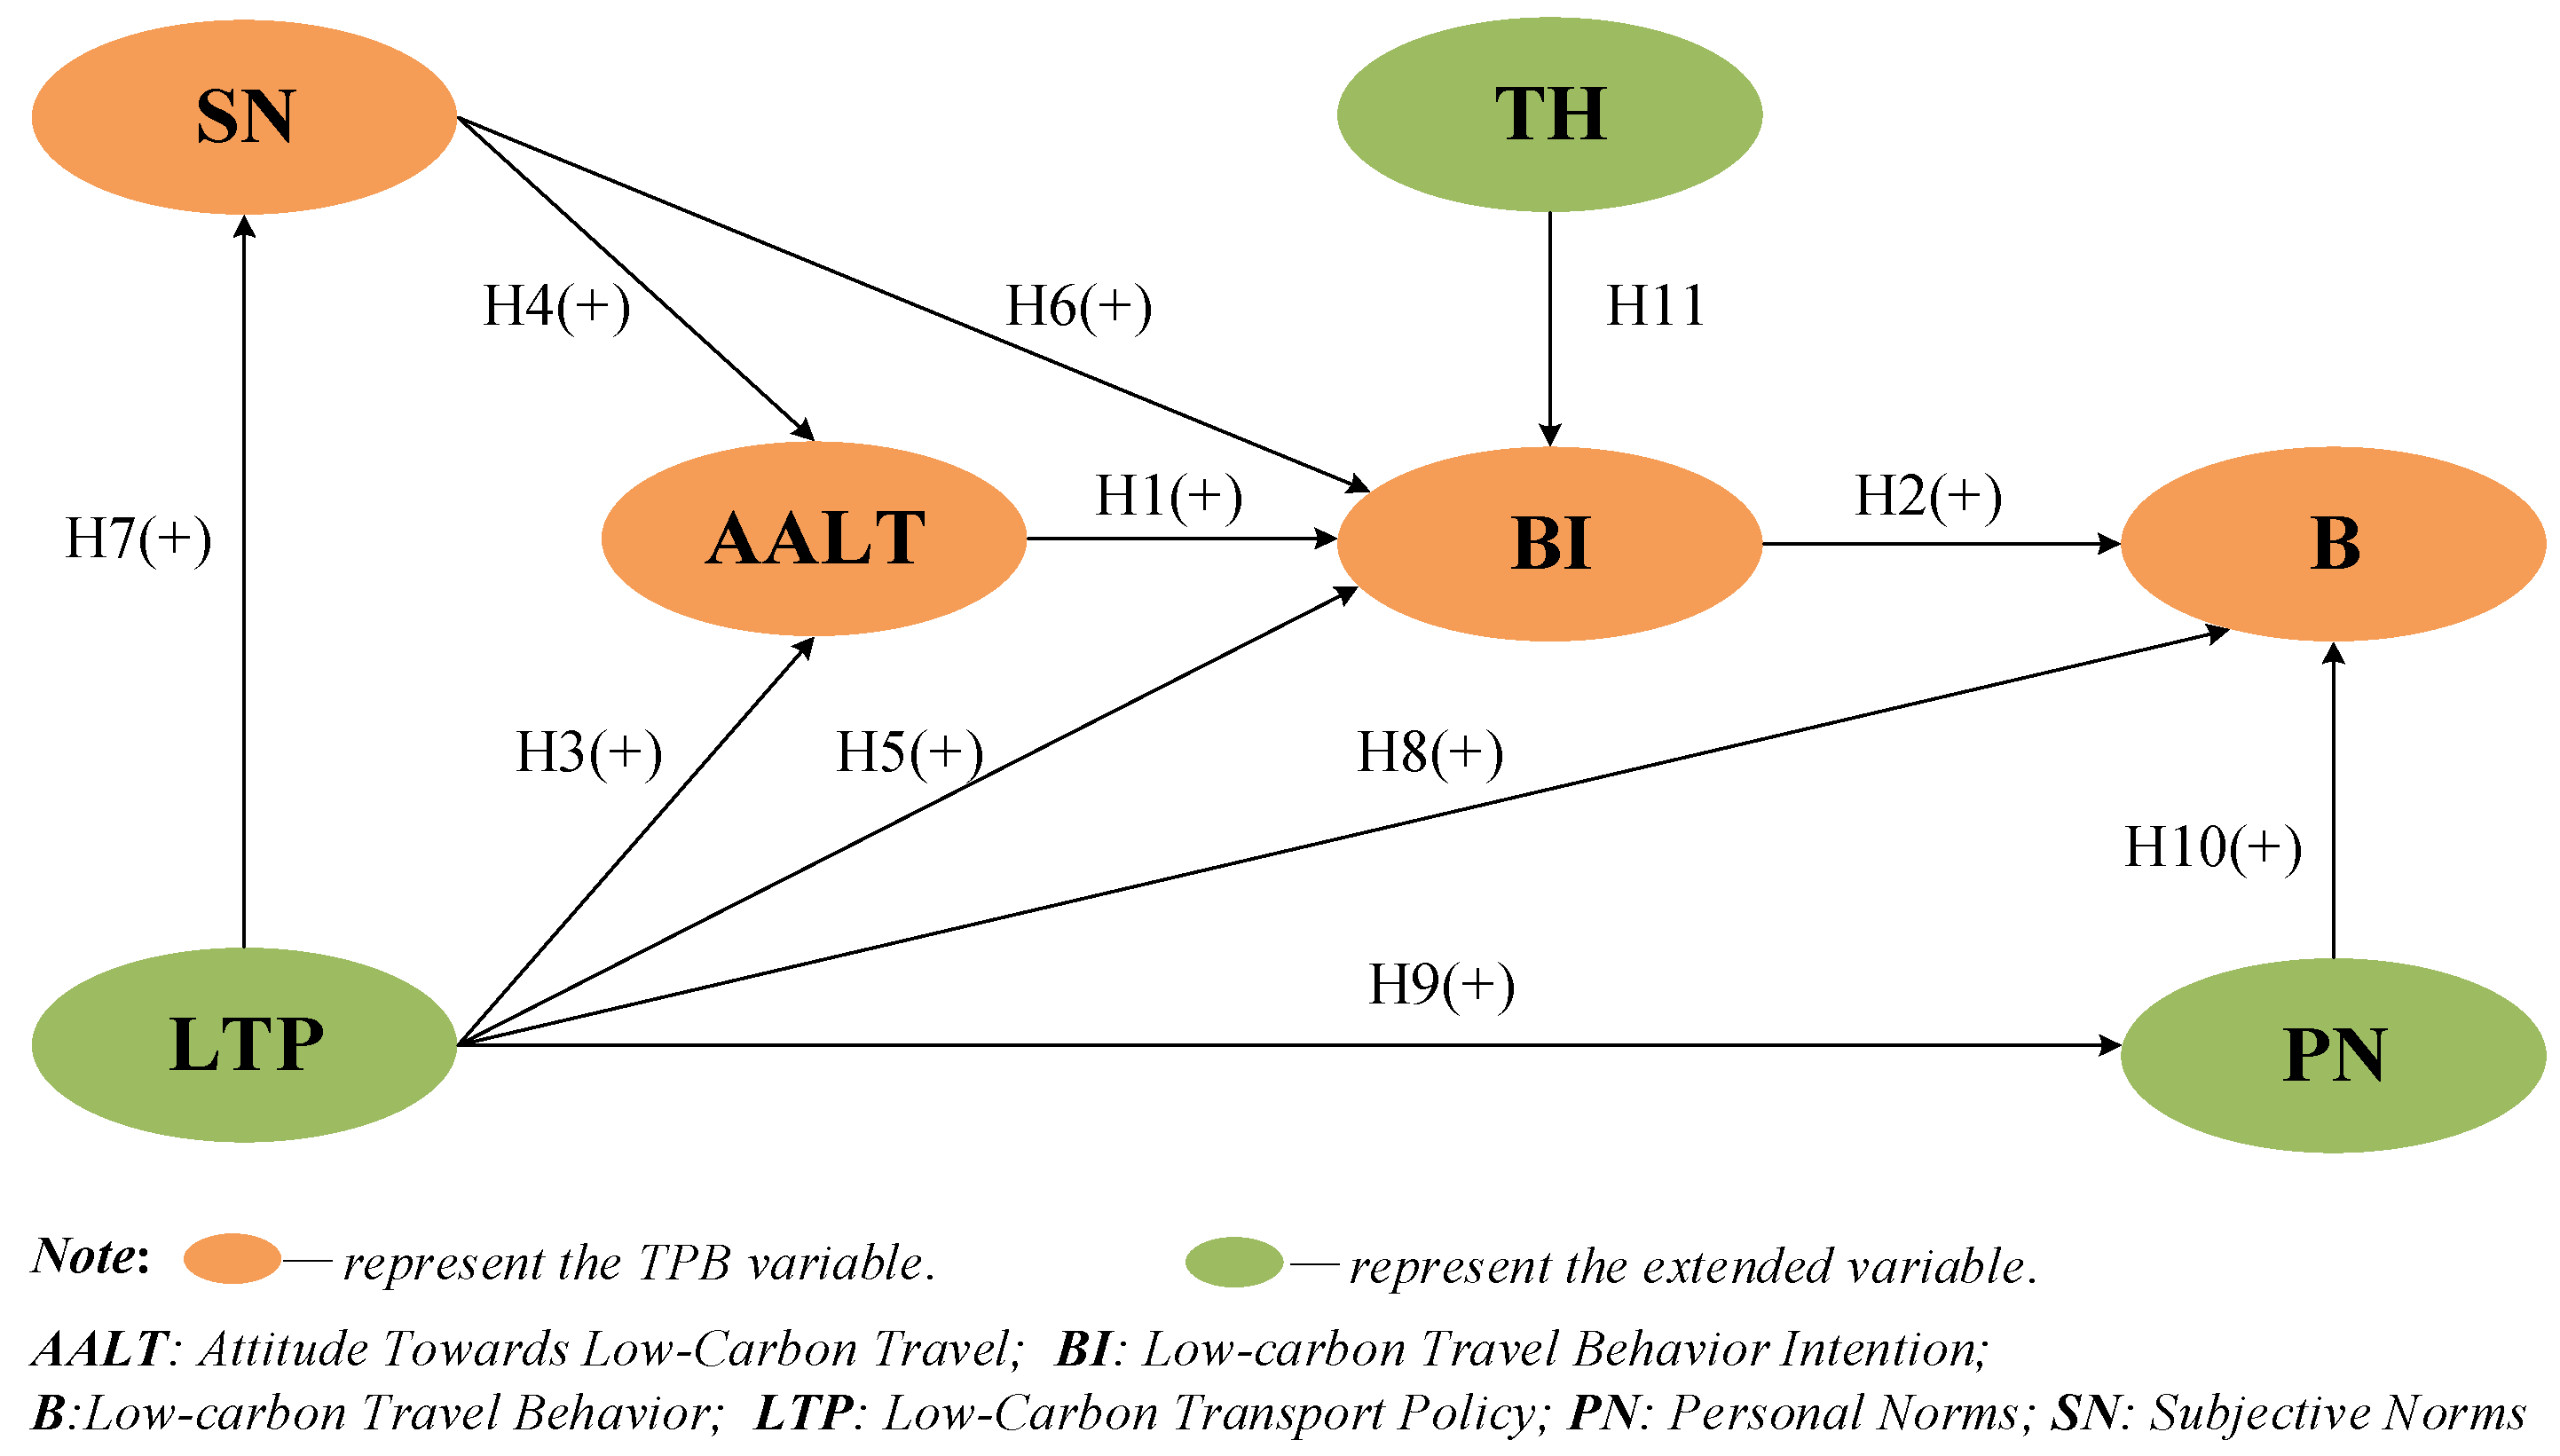
2.2. Model Improvement and Hypotheses

Previous studies have documented the role of social-psychological elements in the intention to choose low-carbon travel modes and adopt new energy technology. For example, Liu et al. [6] used a comprehensive intention determination model to verify the synergistic effect of combining social-psychological factors and transport policies on residents’ willingness to choose low-carbon travel modes. Du et al. [4] reported a slight moderating effect of low-carbon awareness on the intention of purchasing new energy vehicles, and they proved that the influence exerted by subjective norms is much higher than other factors. Their findings provided a valuable reference for this study to select key social-psychological factors. However, few studies have focused on the heterogeneity of these elements on behavior intention between various cities and age groups. In fact, the role of group heterogeneity is worth integrating into the process of developing low-carbon oriented policies, which could help narrow the gap between low-carbon intention and behavior by introducing different policies and practices.
In the existing literature, many studies directly concentrate on the combination of TPB and TAM or VBN. However, this made part of the theoretical models seems to be a bit redundant, because some latent variables do not exert a direct effect on travel behavior in a theoretical framework. Therefore, to better understand the residents’ formation mechanism of low-carbon travel behavior intention, we chose the TPB model as a basic theoretical framework in view of its effectiveness and simplicity. Then we proposed a modified TPB model (MTPB), which is more concise than the CIDM [6]. In particular, low-carbon transport policy (LCA), personal norms (PN), and individual travel habits (TH) are incorporated into the original TPB framework to generate our model. The adopted model is presented in Figure 1.
The MTPB framework consists of two parts: the original TPB variables and the extended variables. The first part is the original TPB variables. The attitude towards travel (AT) is seen as a key mediating variable affected by subjective norms (SN) and perceived behavioral control (PBC), which could exert a direct positive effect on behavior intention (BI) and an indirect effect on behavior (B) [6,19]. Meanwhile, subjective norms (SN) and perceived behavioral control (PBC) both have a positive impact on behavior intention (BI) [19]. Additionally, perceived behavioral control (PBC) also could regulate subjective norms (SN), and it would directly affect behavior (B) [29,30]. In general, perceived behavioral control (PBC) refers to an individual’s perceived ability to control their own behavior under a given condition, such as past experiences, secondhand information, and management policies [17,29]. In the context of low-carbon travel, this paper focuses on the regulating effect and control ability of transport policy on low-carbon travel behavior. Hence, we used the low-carbon transport policy (LCP) construct to replace the perceived behavioral control (PBC) construct. Based on the above findings, we propose that:
Hypothesis 1 (H1).
Positive attitude towards low-carbon travel will increase behavior intention to choose low-carbon travel modes.
Hypothesis 2 (H2).
Low-carbon travel behavior intention is positively related to travel behavior.
Hypothesis 3 (H3).
Low-carbon transport policy and subjective norms both have positive effects on attitude towards low-carbon travel.
Hypothesis 4 (H4).
Low-carbon transport policy and subjective norms both have positive effects on attitude towards low-carbon travel.
Hypothesis 5 (H5).
Low-carbon transport policy and subjective norms both have positive effects on low-carbon travel behavior intention.
Hypothesis 6 (H6).
Low-carbon transport policy and subjective norms both have positive effects on low-carbon travel behavior intention.
Hypothesis 7 (H7).
Low-carbon transport policy has a positively regulated effect on subjective norms.
Hypothesis 8 (H8).
Low-carbon transport policy has a positive effect on low-carbon travel behavior.
The second part of the MTPB framework is extended variables. This study mainly concentrates on the impact of personal norms (PN) and travel habits (TH) on low-carbon travel. Personal norms (PN) stemmed from the VBN theory, which means a sense of moral obligation and responsibility to support the development goal of low-carbon transportation [21,23]. Therefore, we propose that personal norms (PN) could be influenced by low-carbon transport policy. Meanwhile, some empirical analysis, which uses the VBN theory in the field of environmentalism, suggests that personal norms (PN) are directly related to the individual’s actual behavior [23,31]. As for the other extended variable, travel habits (TH) are regarded as a habitual pattern repeated in past behavior [32] and can improve the relationship between intention and behavior [16,33]. In this study, we tried to figure out whether individual daily travel preference in urban cities has a direct influence on the formation of low-carbon travel behavior intention. Thus, travel habits (TH) were added into the basic model as an exogenous latent variable of behavior intention. To sum up, it was hypothesized as follows:
Hypothesis 9 (H9).
Low-carbon transport policy has a positive correlation with personal norms.
Hypothesis 10 (H10).
Personal norms could positively affect actual low-carbon travel behavior.
Hypothesis 11 (H11).
Travel habits have significant effects on low-carbon travel behavior intention.

3. Method

3.1. Measures

We presented the items used to measure the constructs (Table 2) following previous studies to measure the constructs in the proposed model (Figure 1). According to these items, a self-reported questionnaire was framed to collect study data. The first part of the questionnaire measured respondents’ demographic characteristics, including gender, age, education, residence, income, and children. Subsequently, the commuting characteristics of residents, including travel mode, distance, and time, were gathered. Finally, a low-carbon travel behavior intention questionnaire including the subjective norms construct, low-carbon transport policy construct, attitude construct, personal norms construct, travel habits construct, behavior intention construct, and behavior construct was presented. There are some differences between the subjective norms construct and the personal norms construct. The former one comes from the TPB theory, and it mainly stresses the importance of the low-carbon atmosphere in our model. The latter one derives from the VBN theory, and it is concerned more with the influence on environmental responsibility. The travel habits construct was applied to describe travelers’ vehicle preferences in past trips. In general, these are the travel habits formed from using a preferred vehicle for a long time. Hence, travel habits were regarded as a formative construct, and others were seen as reflective constructs. Additionally, to better reflect actual low-carbon travel behavior, the behavior construct was arranged as a simple single-item construct, which has been proven to be similar to a multi-item scale considering its validity [34,35]. In this study, we used a five-point Likert scale to measure all items, with “1” being very inconsistent and “5” being very consistent. According to the pilot test, the respondents needed five to 10 min to finish the questionnaire.

3.2. Data Profile

The open-source data from “Open-ITS (Intelligent Transportation System) Alliance” (www.openits.cn, accessed date: 14 November 2019) were used to test the modified TPB model. The data was originally collected via a face-to-face questionnaire survey conducted by Jiangsu University in June 2015. The HSR (high-speed railway) stations, train stations, and coach stations located in downtown Zhenjiang city were selected as the survey area, where the passenger flow was large and the occupation and education backgrounds of the respondents were diverse. A total of 2941 completed questionnaires were collected, and 268 responses were incomplete. These non-probability samples mainly came from Zhenjiang city and the other regions in the Yangtze River Delta including Shanghai, Wuxi, Suzhou, and Changzhou. We chose the respondents who lived in Zhenjiang, Suzhou, or Shanghai for different city size factor comparisons, and we further limited the response time from 5 to 12 min in order to omit invalid responses. Finally, a total of 759 questionnaires were applied in this study. The demographic statistics of the samples are summarized in Table 3. A total of 62.58% of them were males and 37.43% of them were female. Their age was concentrated between 26 and 45, which accounted for 84.19%. Most participants’ average education years were 16 years (56.39%), and their monthly income mainly ranged from RMB 2000 to RMB 6000 (45.32%). More than half of the respondents’ households (59.82%) had children, including preschool, elementary school, and junior school students.

3.3. Method

Based on the conceptual framework of the modified TPB (MTPB) model, this paper adopted the partial least-square method of structural equation modeling (PLS-SEM) to analyze the 759 questionnaires holistically, and it also adopted multi-group analysis (MGA) to observe the heterogeneity among various cities and age groups. The PLS-SEM model, which is based on path modeling, has been increasingly popular in transport research to test the interactive relationships among latent variables in recent years [17,37,38]. Compared with the covariance-based structural equation model (CB-SEM), which is also named SEM for short, the PLS-SEM has some prominent advantages in its sample size, hypothesis testing, and complex modeling (Table 4) [18,39].
We applied the PLS-SEM for the following reasons: (1) the MTPB model is the development of existing structural theory rather than the testing of an existing one. It is not appropriate to use the CB-SEM to test an improved theoretical model because the advantages of CB-SEM are inclined to validate an existing model. (2) The MTPB model is a relatively complex path model with 7 latent variables and 11 hypotheses, and compared to CB-SEM, PLS-SEM was more suitable for this model. (3) The MTPB model has both reflective and formative constructs. (4) Our study aimed at identifying the key “drive” constructs that affect low-carbon travel behavior intention instead of finding the best goodness of fit.

4. Results

4.1. Evaluation of Measurement Model

4.1.1. Convergence Validity

First, we tested whether the items used to measure the same construct had internal reliability. Table 5 shows the results of the convergence validity of the constructs in our research model. There are four criteria to evaluate the results of reflective constructs: the composite reliability (CR), average variance extracted (AVE), Cronbach’s α, and factor loading. The composite reliability (CR), average variance extracted (AVE), and Cronbach’s α of each construct respectively ranged from 0.784 to 0.872, 0.514 to 0.743, and 0.599 to 0.780. The factor loading of each item was significantly greater than 0.6 (p < 0.001). For the formative construct, the outer weights for the travel habits construct were higher than 0.2, and all variance inflation factors (VIFs) were lower than 3.3. In summary, these results indicate that our measurement model had satisfactory convergence validity.

4.1.2. Discriminate Validity

In order to test whether the items could measure two different constructs at the same time, three methods—the squared root of the average variance extracted, cross-loading, and the heterotrait–monotrait (HTMT) ratio of correlations [40] were used. Table 6 shows the square roots of the AVE for each construct that was larger than its correlation. Table 7 provides the value of the item loadings, which were all higher than the cross-loadings of the items used to measure the other constructs. Table 8 presents the value of the HTMT ratio of correlations for each reflective construct that was below the critical value (0.85). Thus, these results demonstrate good discriminant validity for our measurement model.

4.1.3. Common Method Variance

Data analysis based on the questionnaire may have been affected by common method variance (CMV), because these data were self-reported and there were many similar items to measure the construct. Thus, Harmon’s single-factor test [41] was applied to the diagnostic common method variance issue. All variables in the measurement model are loaded into an exploratory factor analysis. If a single factor emerges or one general factor accounts for the majority (>50%) of the covariance among the measures, the impact of the common method variance on the data analysis should not be overlooked [41,42]. In exploratory factor analysis, five factors with characteristic roots greater than 1 are extracted, and 25.3% of the variance was explained by the first factor, which indicates that our measurement model was not influenced by CMV.

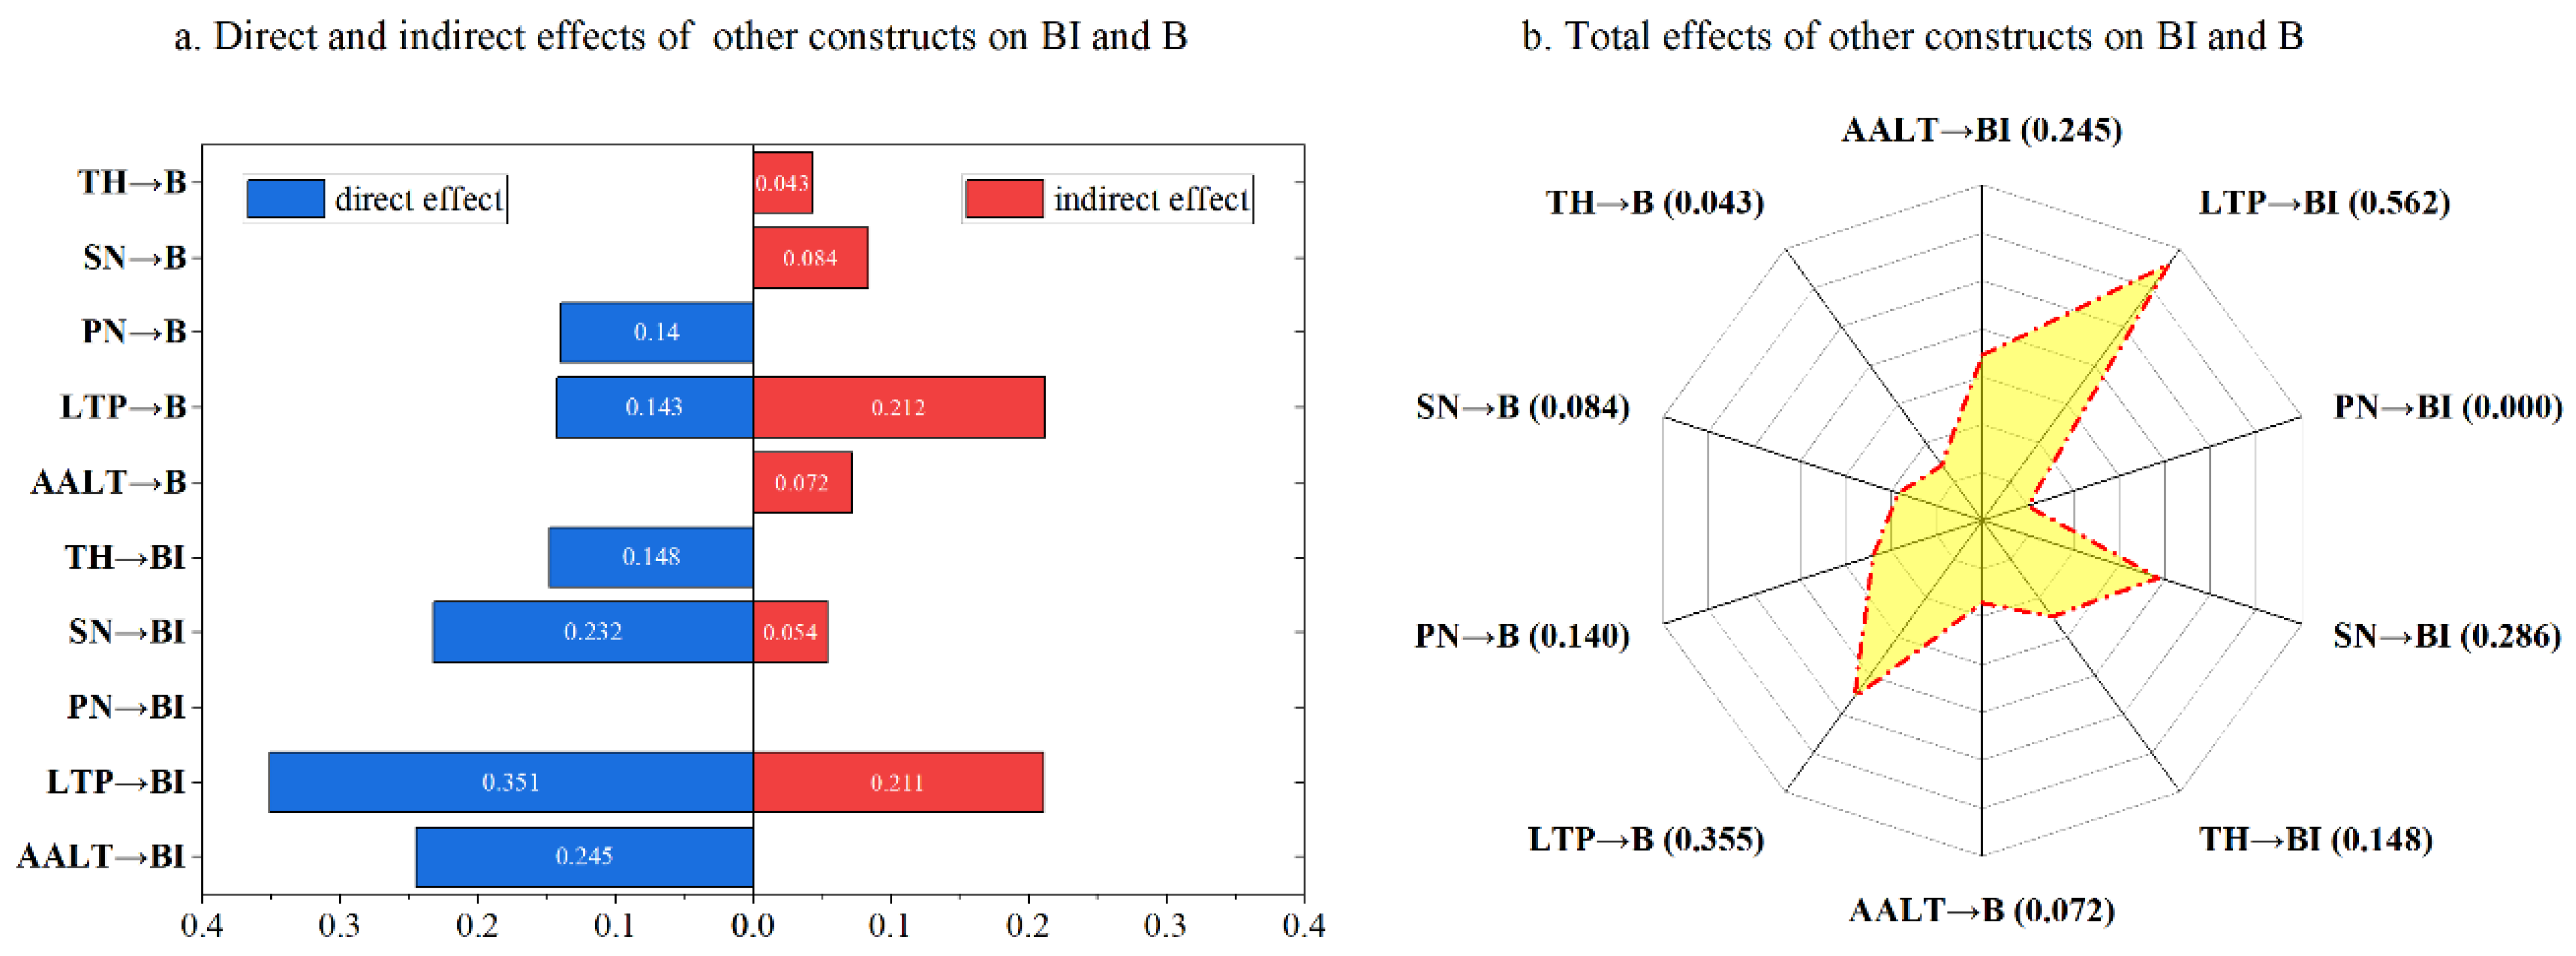
4.2. Evaluation of Structural Model

We use a bootstrap method with 5000 resamples [43,44] to acquire the validity of the structural model-based SmartPLS 2.0 software. The results are presented in Table 9 (path coefficients) and Table 10 (goodness of fit, GOF), which were used to test the hypotheses in Figure 1. In the Table 9, it is clear that all path coefficients were significant at the level p < 0.001, and the effect size of each path was above 0.02. This indicates that the measures of structure model were statistically significant. As for the goodness of fit of the structural model (Table 10), the R2 evaluated that the endogenous latent variable for attitude towards low-carbon travel behavior, behavior intention, personal norms, and subjective norms were 0.184, 0.208, 0.496, 0.112, and 0.254, respectively, which indicates that the model explained 18.4% of the variance in attitude towards low-carbon travel, 20.8% in low-carbon travel behavior, 49.6% in low-carbon travel behavior intention, 11.2% in personal norms, and 25.4% in subjective norms. In regard to low-carbon travel behavior intention, the model had moderate explanatory power. Meanwhile, the Q2 value was also obtained by using the blindfolding procedure and setting the d value as 7 in SmartPLS 2.0. The Q2 values for five endogenous latent variables were larger than zero (the minimum is 0.096), demonstrating that these endogenous variables attained predictive relevance. Additionally, the value of GOF (the goodness of fit) was 0.416, which confirms that it was a large global fit measure for PLS path modeling [43,44].To sum up, the theoretical pathways we hypothesized in Figure 1 (H1 to H11) were acceptable. The results suggest that AALT, LTP, PH, SN, and TH constructs influence the behavior and behavior intention constructs positively, and AALP, SN, and PN constructs show significant mediating effects on behavior and behavior intention.
Figure 2 compares the direct, indirect, and total effects of other constructs on low-carbon travel behavior and behavior intention in our model. In particular, the AALT had direct effects on BI and indirect effects on B. The total effects of AALT on BI (0.245) were higher than on B (0.072). The LTP exerted both direct and indirect influence on B and BI, and the total effects of LTP on B (0.355) and BI (0.562) were the strongest in all pathways. The SN construct was different than LTP. It had double the effect on B and BI, but only affected B indirectly. Hence, its total effects on BI (0.286) were also stronger than on B (0.084). For the TH construct, the TH to BI path was 0.148, and the TH to BI to B path was 0.043. The indirect effects of TH on B were much smaller than the direct effects on BI. In all constructs, only PN did not directly influence BI, but it directly influenced B, and the PN to B path was 0.140.

4.3. Multiple-Group Analysis

4.3.1. Cross-City Comparison

In order to compare the difference of the effect on how AALT, LTP, PN, SN, and TH constructs influenced the behavior and behavior intention constructs between cities of different sizes, a multiple-group analysis (MGA) model for cross-city comparison was developed in SmartPLS 2.0 software. Table 11 displays the results of the MGA models of three cities (Zhenjiang, Suzhou, and Shanghai) in China. The basic information of the three cities is shown in Table 12. In China, Shanghai city, Suzhou city, and Zhenjiang city represent Chinese first-tier cities, new first-tier cities, and third-tier cities, respectively. A huge gap exists among the three cities in urban scale, transport infrastructure, and another external environments. Therefore, we also believed that this regional difference might affect individual low-carbon travel intention and behavior, and moderate the effect of low-carbon transport policy.
For the purpose of facilitating group comparison, the samples that were from Zhenjiang city were set as a reference group. In the three groups, it was clear that the coefficient on most pathways was significant and presented some differences, except for “LTP→B” and “PN→B.” The positive impact of AALT on BI (0.299, p = 0.000), BI on B (0.308, p = 0.000), and TH on BI (0.152, p = 0.005) for the Zhenjiang group was stronger. That is to say, the role of AALT and TH in low-carbon travel intention and behavior was more prominent in small cities. However, the relationship between LTP and B (0.197, p = 0.006), PN and B (0.261, p = 0.000), and SN and BI (0.261, p = 0.000) was recognized as being stronger for the Shanghai group. In particular, the direct influence of LTP and PN was significant only in the Shanghai group, which suggests that the measure of using low-carbon transport policy to promote individual low-carbon travel is usually more efficient in the metropolis. Meanwhile, for large cities such as Shanghai, motivating low-carbon-oriented personal norms also could enhance residents’ low-carbon travel behavior. As for the path LTP to BI, there was little variation in the three cities. However, its coefficient was higher than for other paths. In other words, the role of low-carbon transport policy in low-carbon travel intention had equal importance in different cities.

4.3.2. Cross-Age Comparison

The process of multiple-group analysis of cross-age was similar to the cross-city comparison. In the present study, the samples were divided into four groups based on their age range. The samples aged 18 and below only accounted for less than 1%, so we dropped those samples. Therefore, we defined four groups, with the ages of the first group from 19 to 25 years old, and the two subsequent groups were incremental at 10-year interval, that is, there was a “26–35-year-olds” group and a “36–45-year-olds” group. For the last group, we merged the “46–55-year-olds” (86 samples) and “55-year-old and above” (28 samples) respondents into one category named “46 years old and above”. Group 1, “19–25-year-olds,” was chosen as a reference group to facilitate group comparison. As mentioned before, the samples in the multiple-group analysis were all adults because they had formed a steady opinion on low-carbon travel, and they may have had much higher travel demand.
As shown in Table 13, the direct impacts of AALT on BI (0.251, p = 0.000) and LTP on B (0.167, p = 0.039) in the “19–25-year-olds” group were stronger than on the “26–35-year-olds” group and the “46-year-old and above” group, and weaker than on the “36–45-year-olds” group. However, the path coefficients of LTP to B in the “26–35-year-olds” group (0.116, p = 0.138) and the “46 years old and above” group (0.030, p = 0.795) were both not significant, which indicates that it is effective for young adults (19–25-year-olds) and senior-middle adults (36–45-year-olds) to use low-carbon transport policy intervention to change their travel behavior. For the positive effect of BI on B and SN on BI, the effect on the group of young adults (19–25-year-olds) was weaker than other groups. In the LTP and TH to BI path, the moderating effect of the “46 years old and above” group was the strongest, which suggests that the direct influence of low-carbon transport policy and travel habits on behavior intention was more valid in the pre-older adult group. Although the PN to B path was 0.192 in the young adults (19–25-year-olds) group and the coefficient was higher than in the other three groups, this result was not significant in senior-middle adults (36–45-year-olds) or the pre-older adults (46 years old and above).

5. Discussion

5.1. Implications

Travel behavior is an important factor affecting increasing carbon emissions and the development of sustainable transport. In this study, we attempted to investigate regional and generational heterogeneity using the partial least-square method of structural equation model (PLS-SEM) and multiple-group analysis (MGA) model empirically in low-carbon travel behavior intention in China.
Firstly, the empirical PLS-SEM analysis substantiated that residents’ low-carbon travel intention and behavior depend on government low-carbon policies and their personal norms, subjective norms, travel habits, and attitudes towards low-carbon travel. The direct and indirect effects of low-carbon policies were both the strongest in all paths affecting low-carbon travel intention and behavior. Therefore, we can infer that appropriate low-carbon policies might provide an effective safeguard in promoting moving from motorization to low-carbonization. Meanwhile, the effects of low-carbon policies on travel behavior via subjective norms (0.506) and personal norms (0.337) were respectively stronger than via attitude (0.275). This means that the authorities should address the importance of how to create “herd mentality” in groups and motivate travelers’ moral obligation and responsibility to support low-carbon transportation when developing low-carbon policies. However, the study also demonstrated that the effect of low-carbon policy on behavior (0.144) was much weaker than on intention (0.355), which implies that there is a gap between low-carbon travel intention and behavior. In other words, policies can create an intention, but it does not follow that such an intention will often be followed up with action, i.e., with resulting low-carbon behavior.
The second major finding of this study was that regional and generational differences existed in the paths where low-carbon policy, social-psychological factors, and travel habits affected individual low-carbon travel intention and behavior. From a regional heterogeneity perspective, the roles of attitudes, transport policies, and travel habits in promoting the formation of low-carbon travel were more significant in small cities. On the contrary, personal norms and subjective norms were more remarkable in large cities. From a generational heterogeneity perspective, the young adult (19–25-year-olds) group had more remarkable personal norms and attitudes towards low-carbon travel intention. Low-carbon travel behavior intention in the junior-middle adult (26–35-year-olds) group and the senior-middle adult (36–45-year-olds) group was more easily affected by subjective norms and attitudes. The pre-older adult group (46-year-old and above) had the most supported willingness for low-carbon transport policies. The results suggest that generational heterogeneity should be considered when low-carbon transport policies are prepared. The policies should target more young adults and pre-older adults and cultivate their personal norms towards low-carbon travel. For junior-middle adults and senior-middle adults, correcting their attitude and motivating social influence towards low-carbon transport is worth considering.

5.2. Limitations and Future Work

The findings from this study extend the results of Jia et al. [5] and Liu et al. [6], which confirmed that the influence mechanism is diverse in terms of how low-carbon travel behavior intention is affected by social-psychological factors and transport policies. However, several limitations to this pilot study need to be acknowledged. Although our hypotheses were supported statistically, the interaction relationship among the travel habits construct, transport policy construct, and social-psychological aspects construct is worth further modeling. In addition, because of the lack of panel data and longitudinal surveys, it is difficult to assess the long-term effects of regional and generational heterogeneity over time and space. Finally, a few important latent variables, such as the samples’ usage experiences of low-carbon transport modes, residence conditions, and their environmental concerns, are worth applying to advance our model in a future study.

6. Conclusions

By incorporating low-carbon policy, personal norms, and travel habits into the original TPB model, we developed a modified TPB model and adopted PLS-SEM and MGA to uncover the regional and generational differences of social-psychological, political, and habitual variables on how low-carbon travel behavior intentions are influenced. The results provided some helpful evidence and deep insights into using heterogeneous transport policies and management practices to encourage an increasing number of people from motorization to low-carbon travel. From a theoretical perspective, the MTPB model presented in our study is more concise than existing structural models that directly connect different theoretical frameworks, and our model also provides an applicable position for social-psychological, political, and habitual factors in the framework of behavior decisions. From a pragmatic perspective, low-carbon policies play a more important role than social-psychological aspects in affecting low-carbon travel intention. However, it does not follow that such an intention will often be followed up with action. Motivating personal norms is positive for the formation of low-carbon travel behavior. In addition, the regional and generational heterogeneity of influencing paths should attach enough importance to it. For example, the benefits of low-carbon policies were more remarkable in the middle-sized city, young adult group, and pre-older adult group. The low-carbon travel behavior intention in the large-sized city, junior-middle adult group, and senior-middle adult group was affected by subjective norms more easily. The large-sized city and young adult group had better personal norms in favor of low-carbon travel. These findings imply that measures should be adjusted to local conditions and current groups in developing low-carbon transport policies. If we could take full advantage of the regional and generational heterogeneity gained from low-carbon policies, subjective norms, and personal norms in urban transport planning and management, it may encourage more residents to choose low-carbon travel modes for commuting and other activities.

Author Contributions

Conceptualization, W.L. and S.Z.; methodology, W.L.; software, W.L.; validation, W.L., and J.M.; writing—original draft preparation, W.L.; writing—review and editing, S.Z., J.M., and W.Q.; visualization, W.Q. and S.Z.; project administration, S.Z.; funding acquisition, S.Z. All authors have read and agreed to the published version of the manuscript.

Funding

This study was funded by the National Natural Sciences Foundation of China (grant no. 51478085).

Institutional Review Board Statement

Not applicable.

Informed Consent Statement

Not applicable.

Data Availability Statement

The data profiles come from “Open-ITS Alliance” (www.openits.cn, accessed date: 14 November 2019).

Acknowledgments

We would like to appreciate Sun Yat-sen University for running the “Open-ITS Alliance” in China and Jiangsu University for sharing the survey data freely.

Conflicts of Interest

No conflict of interest exists in the submission of this manuscript, and it is approved by all authors for publication. I would like to declare on behalf of my co-authors that the work described was original research that has not been published previously, and is not under consideration for publication elsewhere, in whole or in part. All the authors listed have approved the manuscript that is enclosed.

References

  1. Xu, B.; Lin, B. Carbon dioxide emissions reduction in China’s transport sector: A dynamic VAR (vector autoregression) approach. Energy 2015, 83, 486–495. [Google Scholar] [CrossRef]
  2. Wang, Z.; Liu, W. Determinants of CO2 emissions from household daily travel in Beijing, China: Individual travel characteristic perspectives. Appl. Energy 2015, 158, 292–299. [Google Scholar] [CrossRef]
  3. Allinson, D.; Irvine, K.N.; Edmondson, J.L.; Tiwary, A.; Hill, G.; Morris, J.; Bell, M.; Davies, Z.G.; Firth, S.K.; Fisher, J.; et al. Measurement and analysis of household carbon: The case of a UK city. Appl. Energy 2016, 164, 871–881. [Google Scholar] [CrossRef] [Green Version]
  4. Du, H.; Liu, D.; Sovacool, B.K.; Wang, Y.; Ma, S.; Li, R.Y.M. Who buys New Energy Vehicles in China? Assessing social-psychological predictors of purchasing awareness, intention, and policy. Transp. Res. Part F Traffic Psychol. Behav. 2018, 58, 56–69. [Google Scholar] [CrossRef] [Green Version]
  5. Jia, N.; Li, L.; Ling, S.; Ma, S.; Yao, W. Influence of attitudinal and low-carbon factors on behavioral intention of commuting mode choice—A cross-city study in China. Transp. Res. Part A Policy Pract. 2018, 111, 108–118. [Google Scholar] [CrossRef]
  6. Liu, D.; Du, H.; Southworth, F.; Ma, S. The influence of social-psychological factors on the intention to choose low-carbon travel modes in Tianjin, China. Transp. Res. Part A Policy Pract. 2017, 105, 42–53. [Google Scholar] [CrossRef]
  7. Geng, J.; Long, R.; Chen, H.; Li, W. Exploring the motivation-behavior gap in urban residents’ green travel behavior: A theoretical and empirical study. Resour. Conserv. Recycl. 2017, 125, 282–292. [Google Scholar] [CrossRef]
  8. Zhang, W.; Tian, Z.; Zhang, G.; Dong, G. Spatial-temporal characteristics of green travel behavior based on vector perspective. J. Clean. Prod. 2019, 234, 549–558. [Google Scholar] [CrossRef]
  9. Wang, S.; Li, J.; Zhao, D. The impact of policy measures on consumer intention to adopt electric vehicles: Evidence from China. Transp. Res. Part A: Policy Pract. 2017, 105, 14–26. [Google Scholar] [CrossRef]
  10. Wu, J.; Liao, H.; Wang, J.W.; Chen, T. The role of environmental concern in the public acceptance of autonomous electric vehicles: A survey from China. Transp. Res. Part F Traffic Psychol. Behav. 2019, 60, 37–46. [Google Scholar] [CrossRef]
  11. Chen, S.Y. Using the sustainable modified TAM and TPB to analyze the effects of perceived green value on loyalty to a public bike system. Transp. Res. Part A Policy Pract. 2016, 88, 58–72. [Google Scholar] [CrossRef]
  12. Fu, X.; Juan, Z. Exploring the psychosocial factors associated with public transportation usage and examining the “gendered” difference. Transp. Res. Part A Policy Pract. 2017, 103, 70–82. [Google Scholar] [CrossRef]
  13. Zhang, T.; Tao, D.; Qu, X.; Zhang, X.; Lin, R.; Zhang, W. The roles of initial trust and perceived risk in public’s acceptance of automated vehicles. Transp. Res. Part C: Emerg. Technol. 2019, 98, 207–220. [Google Scholar] [CrossRef]
  14. Fornara, F.; Pattitoni, P.; Mura, M.; Strazzera, E. Predicting intention to improve household energy efficiency: The role of value-belief-norm theory, normative and informational influence, and specific attitude. J. Environ. Psychol. 2016, 45, 1–10. [Google Scholar] [CrossRef]
  15. Ghazali, E.M.; Nguyen, B.; Mutum, D.S.; Yap, S.-F. Pro-environmental behaviours and value-belief-norm theory: Assessing unobserved heterogeneity of two ethnic groups. Sustainability 2019, 11, 3237. [Google Scholar] [CrossRef] [Green Version]
  16. Klöckner, C.A. A comprehensive model of the psychology of environmental behaviour-A meta-analysis. Glob. Environ. Chang. 2013, 23, 1028–1038. [Google Scholar] [CrossRef] [Green Version]
  17. Liang, J.K.; Eccarius, T.; Lu, C.C. Investigating factors that affect the intention to use shared parking: A case study of Taipei City. Transp. Res. Part A Policy Pract. 2019, 130, 799–812. [Google Scholar] [CrossRef]
  18. Sharma, P.N.; Kim, K.H. Model selection in information systems research using partial least squares based structural equation modeling. In Proceedings of the International Conference on Information Systems, ICIS 2012, Orlando, FL, USA, 16–19 December 2012; Volume 1, pp. 420–432. [Google Scholar]
  19. Ajzen, I. The theory of planned behavior. Organ. Behav. Hum. Decis. Process. 1991, 50, 179–211. [Google Scholar] [CrossRef]
  20. Davis, B.F.D. Information technology perceived usefulness and perceived ease of use. MIS Q. 1989, 319–339. [Google Scholar] [CrossRef] [Green Version]
  21. Stern, P.C.; Dietz, T.; Abel, T.; Guagnano, G.A.; Kalof, L. A value-belief-norm theory of support for social movements: The case of environmentalism. Hum. Ecol. Rev. 1999, 6, 81–97. [Google Scholar]
  22. Ajzen, I.; Fishbein, M. The prediction of behavior from attitudinal and normative variables. J. Exp. Soc. Psychol. 1970, 6, 466–487. [Google Scholar] [CrossRef]
  23. Shi, D.; Wang, L.; Wang, Z. What affects individual energy conservation behavior: Personal habits, external conditions or values? An empirical study based on a survey of college students. Energy Policy 2019, 128, 150–161. [Google Scholar] [CrossRef]
  24. Gkargkavouzi, A.; Halkos, G.; Matsiori, S. Environmental behavior in a private-sphere context: Integrating theories of planned behavior and value belief norm, self-identity and habit. Resour. Conserv. Recycl. 2019, 148, 145–156. [Google Scholar] [CrossRef]
  25. Ünal, A.B.; Steg, L.; Granskaya, J. “To support or not to support, that is the question”. Testing the VBN theory in predicting support for car use reduction policies in Russia. Transp. Res. Part A Policy Pract. 2019, 119, 73–81. [Google Scholar] [CrossRef]
  26. Venkatesh, V.; Thong, J.Y.L.; Xu, X. Consumer acceptance and use of information technology: Extending the unified theory of acceptance and use of technology. MIS Q. Manag. Inf. Syst. 2012, 36, 157–178. [Google Scholar] [CrossRef] [Green Version]
  27. Venkatesh, V.; Morris, M.G.; Davis, G.B.; Davis, F.D. User Acceptance of Information Technology: Toward a Unified View. MIS Q. 2003, 27, 425. [Google Scholar] [CrossRef] [Green Version]
  28. Jing, P.; Xu, G.; Chen, Y.; Shi, Y.; Zhan, F. The determinants behind the acceptance of autonomous vehicles: A systematic review. Sustainability 2020, 12, 1719. [Google Scholar] [CrossRef] [Green Version]
  29. Bamberg, S.; Ajzen, I.; Schmidt, P. Choice of travel mode in the theory of planned behavior: The roles of past behavior, habit, and reasoned action. Basic Appl. Soc. Psychol. 2003, 25, 175–187. [Google Scholar] [CrossRef]
  30. Nie, H.; Vasseur, V.; Fan, Y.; Xu, J. Exploring reasons behind careful-use, energy-saving behaviours in residential sector based on the theory of planned behaviour: Evidence from Changchun, China. J. Clean. Prod. 2019, 230, 29–37. [Google Scholar] [CrossRef]
  31. Thøgersen, J. Norms for environmentally responsible behaviour: An extended taxonomy. J. Environ. Psychol. 2006, 26, 247–261. [Google Scholar] [CrossRef]
  32. Limayem, M.; Hirt, S.G.; Cheung, C.M.K. How habit limits the predictive power of intention: The case of information systems continuance. MIS Q. 2007, 31, 705–737. [Google Scholar] [CrossRef] [Green Version]
  33. Klöckner, C.A.; Matthies, E. How habits interfere with norm-directed behaviour: A normative decision-making model for travel mode choice. J. Environ. Psychol. 2004, 24, 319–327. [Google Scholar] [CrossRef]
  34. Bergkvist, L.; Rossiter, J.R. The predictive validity of multiple-item versus single-item measures of the same constructs. J. Mark. Res. 2007, 44, 175–184. [Google Scholar] [CrossRef]
  35. Diamantopoulos, A.; Sarstedt, M.; Fuchs, C.; Wilczynski, P.; Kaiser, S. Guidelines for choosing between multi-item and single-item scales for construct measurement: A predictive validity perspective. J. Acad. Mark. Sci. 2012, 40, 434–449. [Google Scholar] [CrossRef] [Green Version]
  36. Schneider, R.J. Theory of routine mode choice decisions: An operational framework to increase sustainable transportation. Transp. Policy 2013, 25, 128–137. [Google Scholar] [CrossRef]
  37. Zhang, C.; Juan, Z.; Lu, W.; Xiao, G. Do the organizational forms affect passenger satisfaction? Evidence from Chinese public transport service. Transp. Res. Part A Policy Pract. 2016, 94, 129–148. [Google Scholar] [CrossRef]
  38. Friman, M.; Gärling, T.; Ettema, D.; Olsson, L.E. How does travel affect emotional well-being and life satisfaction? Transp. Res. Part A Policy Pract. 2017, 106, 170–180. [Google Scholar] [CrossRef]
  39. Hair, J.F.; Ringle, C.M.; Sarstedt, M. PLS-SEM: Indeed a silver bullet. J. Mark. Theory Pract. 2011, 19, 139–151. [Google Scholar] [CrossRef]
  40. Henseler, J.; Ringle, C.M.; Sarstedt, M. A new criterion for assessing discriminant validity in variance-based structural equation modeling. J. Acad. Mark. Sci. 2014, 43, 115–135. [Google Scholar] [CrossRef] [Green Version]
  41. Podsakoff, P.M.; MacKenzie, S.B.; Lee, J.Y.; Podsakoff, N.P. Common method biases in behavioral research: A critical review of the literature and recommended remedies. J. Appl. Psychol. 2003, 88, 879–903. [Google Scholar] [CrossRef]
  42. Premkumar, G.; Bhattacherjee, A. Explaining information technology usage: A test of competing models. Omega 2008, 36, 64–75. [Google Scholar] [CrossRef]
  43. Tenenhaus, M.; Vinzi, V.E.; Chatelin, Y.M.; Lauro, C. PLS path modeling. Comput. Stat. Data Anal. 2005, 48, 159–205. [Google Scholar] [CrossRef]
  44. Wetzels, M.; Odekerken-Schröder, G.; van Oppen, C. Using PLS path modeling for assessing hierarchical construct models: Guidelines and empirical illustration. MIS Q. 2009, 33, 177–195. [Google Scholar] [CrossRef]
Figure 1. The conceptual framework based on the modified TPB model.
Sustainability 13 03492 g001
Figure 2. The effects of AALT, LTP, PN, SN, and TH on BI and B.
Sustainability 13 03492 g002
Table 1. Summary of the representative behavior intention models.
Influencing Factors on Behavior IntentionThe Theoretical Model
TPBVBNTAMUTAUTIntegrated
Attitude towards the behavior (ATT)*///*
Subjective norms (SN)*///*
Perceived behavioral control (PBC)*///*
Individual values (IV)/*//*
Attribution of responsibility (AR)/*//*
Consequence awareness (CA)/*//*
Personal norms (PN)/*//*
Perceived usefulness (PU)//***
Perceived ease of use (PEU)//***
Effort expectancy (EE)///*/
Social influence (SI)///*/
Performance expectancy (PE)///*/
Facilitating conditions (FC)///*/
Transport policy (TP)////*
Environmental concern (EC)////*
Low-carbon awareness (LCA)////*
Personal habits (PH)////*
Note: The symbol “*” means that the factor belongs to the above model. “TPB” is the theory of planned behavior. “VBN” the Value–Belief–Norm model. “TAM” is the technology acceptance model. “UTAUT” is the unified theory of acceptance and use of technology. “Integrated” means a comprehensive explanation model based on two or more models above.
Table 2. Items used to measure the constructs.
ConstructsItemsContentsSources
Subjective Norms
(SN)
SN1People who influence my behavior usually are used to choosing low-carbon travel modes.[4]
SN2People around me usually hope that I use low-carbon travel modes.
SN3Advocating low-carbon travel has a great influence on my choice of travel modes.
Low-Carbon Transport Policy
(LTP)
LTP1Promoting public bikes will make me prefer to use low-carbon travel modes.[4,6]
LTP2Prioritizing public transport will make me prefer to use low-carbon travel modes.
LTP3Raising taxi fares will make me prefer to use low-carbon travel modes.
LTP4Restrictions on automobile purchases will make me prefer to use low-carbon travel modes.
LTP5Restrictions on automobile driving will make me prefer to use low-carbon travel modes.
Attitude Towards Low-Carbon Travel
(AALT)
AALT1I think low-carbon travel could decrease environmental pollution.[10,36]
AALT2I think commuting by walking or cycling is good for our health.
AALT3I think using low-carbon travel modes could meet our daily travel demand.
Personal Norms
(PN)
PN1It is the moral obligation of every citizen to reduce automobile use. [4,24]
PN2I regret overusing automobiles because it is environmentally disastrous.
Travel Habits
(TH)
TH1I usually use portable vehicles for trips.[23,24]
TH2I usually use the fastest vehicle for trips.
TH3I usually use a safer vehicle for trips.
Low-Carbon Travel Behavior Intention
(BI)
BI1On most trips, I always planned to use low-carbon travel modes.[5,17]
BI2I will probably use low-carbon travel modes.
BI3I have a strong intention to use low-carbon travel modes.
Low-Carbon Travel Behavior (B)BI usually use more low-carbon modes for travel. [7]
Table 3. The summary of demographic statistics.
VariablesItemsPercentageVariablesItemsPercentage
GenderMale62.58% (475)ResidenceZhenjiang city33.99% (258)
Female37.43% (284)Suzhou city33.07% (251)
Age<180.79% (6)Shanghai city32.94% (250)
19–2530.70% (233)Income
(RMB)
≤200017.13% (130)
26–3532.67% (248)2001–400028.19% (214)
36–4520.82% (158)4001–600030.43% (231)
46–5511.33% (86)6001–800014.89% (113)
>553.69% (28)≥80019.35% (71)
Schooling≤98.17% (62)KidsPreschooler15.55% (118)
1223.45% (178)Pupil17.26% (131)
1656.39% (428)Junior school student11.07% (84)
199.62% (73)Senior school student15.94% (121)
≥202.37% (18)None40.18% (305)
Note: frequency in parentheses.
Table 4. A comparison between PLS-SEM and CB-SEM.
CriteriaCB-SEMPLS-SEM
Research goalsParameter-orientedPrediction-oriented
Method Covariance-basedVariance-based
Data assumption Normal distribution None
Minimal sample size20030~100
Measurement modelMainly reflective constructs Reflective and formative constructs
ComplexityLess than 100 indicators100 constructs and 1000 indicators
Parametric estimated valueStandardized or non-standardizedStandardized
Implication Theory testingTheory development
The goodness of fit metricsMany One (GOF)
Note: the PLS-SEM means the partial least-square method of structural equation modeling. The CB-SEM means the covariance-based structural equation model.
Table 5. The convergence validity of constructs.
ConstructItemLoadingWeightSt. ErrorT Statistics
Attitude Towards Low-Carbon Travel (Reflective)
CR = 0.784
AVE = 0.550
Cronbach’s α = 0.599
AALT10.731 ***/0.02826.032
AALT20.646 ***/0.04315.065
AALT30.836 ***/0.01747.928
Behavior Intention (Reflective)
CR = 0.872
AVE = 0.695
Cronbach’s α = 0.780
BI10.841 ***/0.01362.929
BI20.853 ***/0.01367.915
BI30.806 ***/0.01747.939
Low-Carbon Transport Policy (Reflective)
CR = 0.841
AVE = 0.514
Cronbach’s α = 0.766
LTP10.709 ***/0.02529.018
LTP20.746 ***/0.02038.939
LTP30.692 ***/0.02529.704
LTP40.704 ***/0.02528.847
LTP50.730 ***/
Personal Norms (Reflective)
CR = 0.853
AVE = 0.743
Cronbach’s α = 0. 658
PN10.833 ***/0.02533.569
PN20.890 ***/0.01752.755
Subjective Norms (Reflective)
CR = 0.823
AVE = 0.642
Cronbach’s α = 0.679
SN10.763 ***/0.02530.440
SN20.830 ***/0.01652.698
SN30.810 ***/0.01554.045
Travel Habits (Formative)
VIF = 1.078TH1/0.597 ***0.0986.074
TH2/−0.352 ***0.1153.078
TH3/0.814 ***0.08110.075
Note: (1) CR is the composite reliability, AVE is the average variance extracted, and VIF is the variance inflation factor. *** p < 0.001. (2) Travel habits (TH) is a formative construct. (3) Low-carbon travel behavior is a single-item construct.
Table 6. The correlations between constructs with reflective constructs.
ConstructAVEAALTBBILTPPNSN
AALT0.5500.742
B1.0000.3331.000
BI0.6950.4880.4100.833
LTP0.5140.3850.3640.5940.717
PN0.7430.1930.2560.2330.3370.862
SN0.6420.3580.2850.5280.5040.2290.801
Table 7. The loadings and cross-loadings of reflective constructs.
AALTBBILTPPNSN
AALT10.7310.2450.3390.2590.1460.221
AALT20.6460.1900.2650.2350.1230.170
AALT30.8360.2930.4510.3460.1590.365
B0.3331.0000.4100.3640.2560.285
BI10.4300.3550.8410.5170.1730.457
BI20.4010.3620.8530.4810.1540.412
BI30.3890.3070.8060.4870.2580.450
LTP10.2940.3110.4430.7090.2640.405
LTP20.3060.3000.4590.7460.2190.322
LTP30.2030.1630.3290.6920.1900.276
LTP40.2210.2560.3560.7040.2080.319
LTP50.3210.2490.4990.7300.3000.445
PN10.1540.1610.2020.2880.8330.189
PN20.1780.2710.2010.2930.8900.205
SN10.2730.1980.3580.3330.0930.763
SN20.2880.2250.4390.3690.2430.830
SN30.2990.2550.4600.4910.2020.810
Note: (1) The diagonal elements (in bold) are the square roots of the average variance extracted. The elements below the diagonal are the correlations between constructs with reflective measures. (2) Low-carbon travel behavior is a single-item construct.
Table 8. The heterotrait–monotrait (HTMT) ratio of correlations of reflective constructs.
Construct AALT BBILTPPNSN
AALT/
B0.420
BI0.690 0.464
LTP0.540 0.4060.750
PN0.302 0.3090.3270.464
SN0.510 0.3310.6950.6490.323/
Table 9. Results of path coefficients and hypothesis testing.
HypothesesPath Coef.St. ErrorT Values95% CI f2Accept?
2.5%97.5%
H1: AALT→BI0.245 ***0.0317.8250.1830.3050.097Yes
H2: BI→B0.291 ***0.0456.5190.2030.3770.070Yes
H3: LTP→AALT0.275 ***0.0406.9050.1970.3520.068Yes
H4: SN→AALT0.220 ***0.0405.4490.1400.2980.044Yes
H5: LTP→BI0.350 ***0.03510.0510.2800.4170.169Yes
H6: SN→BI0.232 ***0.0327.2680.1710.2950.076Yes
H7: LTP→SN0.506 ***0.02619.0520.4540.5570.341Yes
H8: LTP→B0.144 ***0.0443.2750.0580.2270.016Yes
H9: LTP→PN0.337 ***0.0369.4030.2670.4080.128Yes
H10: PN→B0.141 ***0.0443.2020.0550.2260.022Yes
H11: TH→BI0.148 ***0.0304.8690.0880.2050.039Yes
Note: (1) Path Coef. are the standardized coefficients, and CI is the confidence interval. *** p < 0.001. (2) “f2” represents the effect size. Weak f2:0.02, moderate f2:0.15, strong f2:0.35 (Cohen, 1988).
Table 10. The validity of the structural model.
Construct AALTBBIPNSN
Adjusted R2 (coefficient of determination)0.1840.2080.4960.1130.254
Q2 (Predict Relevance)0.0960.1990.3390.0800.158
GOF (Goodness of Fit)0.416
Note: (1) Weak R2: 0.19, moderate R2: 0.33, strong R2: 0.67. (2) Exhibiting predictive relevance: Q2 > 0 [39]. (3) GOF small = 0.1, GOF medium = 0.25, GOF large = 0.36 [44].
Table 11. Results of multiple-group analysis in different cities.
PathCoef.1Coef.2Coef.3Diff.1Diff.2
AALT→BI0.299 ***0.219 ***0.212 ***0.080 *0.087 **
(0.000)(0.000)(0.000)(0.086)(0.044)
BI→B0.308 ***0.269 ***0.263 ***0.039 **0.045 **
(0.000)(0.001)(0.000)(0.026)(0.005)
LTP→B0.1130.1270.197 **−0.014−0.084 **
(0.141)(0.129)(0.006)(0.897)(0.018)
LTP→BI0.366 ***0.372 ***0.332 ***−0.007 **0.034 **
(0.000)(0.000)(0.000)(0.032)(0.009)
PN→B0.0760.1250.261 ***-0.049−0.184 *
(0.336)(0.122)(0.000)(0.670)(0.063)
SN→BI0.208 ***0.221 ***0.261 ***−0.013 ***−0.053 **
(0.000)(0.000)(0.000)(0.000)(0.002)
TH→BI0.152 **0.134 **0.138 **0.018 **0.014 *
(0.005)(0.014)(0.005)(0.020)(0.054)
Note: (1) The difference in path coefficients among other constructs are also calculated, but not reported. (2) “Coef.” denotes “coefficient,” and “Diff” is “difference.” Coef.1, Coef.2, and Coef.3 are from group 1 (Zhenjiang city, N = 258), group 2 (Suzhou city, N = 251), and group 3 (Shanghai city, N = 250), respectively. Difference1 is the difference between group 1 and group 2, and Difference2 is the difference between group 1 and group 3. (3) p-value in parentheses, *** p < 0.001, ** p < 0.05, * p < 0.1.
Table 12. The basic information of three cities.
CityZhenjiangSuzhouShanghai
Urban area (square kilometer)>3000>8000>6000
Resident population (million)>3>10>20
Car ownership (million)>1>4>4
Congestion delay index1.241.541.73
Bus lines<500500~1000>1000
Subway lines 0416
City sizeSmall Middle-sizedLarge
Questionnaires 258251250
Sources: “China Statistical Yearbook” (2019) and “Traffic Analysis Reports for Major Cities in China” (“Gaode” map, 2019).
Table 13. Results of multiple-group analysis in different generations.
PathCoef.1Coef.2Coef.3Coef.4Diff.1Diff.2Diff.3
AALT→BI0.251 ***0.212 ***0.361 ***0.170 **0.039 **−0.110 **0.081 *
(0.000)(0.000)(0.000)(0.008)(0.004)(0.002)(0.066)
BI→B0.225 **0.309 ***0.333 ***0.345 **−0.084 **−0.108 ***−0.120 **
(0.003)(0.000)(0.000)(0.007)(0.045)(0.000)(0.015)
LTP→B0.167 **0.1160.252 **0.0300.052−0.084 *0.137
(0.039)(0.138)(0.007)(0.795)(0.636)(0.096)(0.330)
LTP→BI0.388 ***0.287 ***0.257 ***0.436 ***0.101 **0.131 **−0.075 **
(0.000)(0.000)(0.001)(0.000)(0.008)(0.004)(0.020)
PN→B0.192 **0.156 **0.0310.1600.036 **0.1610.033
(0.010)(0.055)(0.713)(0.203)(0.043)(0.154)(0.877)
SN→BI0.182 **0.263 ***0.293 ***0.215 **−0.082 **−0.112 **−0.034 *
(0.003)(0.000)(0.000)(0.004)(0.033)(0.004)(0.073)
TH→BI0.151 **0.165 **0.135 **0.165 **−0.014 *0.016 *−0.014 *
(0.003)(0.010)(0.037)(0.029)(0.085)(0.086)(0.086)
Note: (1) The difference of path coefficient among other constructs is also calculated, but not reported. (2) “Coef.” denotes “coefficient,” and “Diff” is “difference.” Coef.1, Coef.2, Coef.3, and Coef.4 are from group 1 (19–25-year-olds, N = 233), group 2 (26–35-year-olds, N = 248), group 3 (36–45-year-olds, N = 158), and group 4 (46 years old and above, N = 114) respectively. Difference1, Difference2, and Difference3 represent the difference between group 1 and group 2, group 3, and group 4, respectively. (3) p-value in parentheses, *** p < 0.001, ** p < 0.05, * p < 0.1.
Publisher’s Note: MDPI stays neutral with regard to jurisdictional claims in published maps and institutional affiliations.

