Abstract
Among the common methods of quantifying household food waste, direct measurement is regarded as infeasible due to its prohibitive costs, and self-assessment methods tend to underestimate the actual values. This paper aims to propose a methodological approach to reach a compromise between feasibility and accuracy. Bread was studied, since it is a relatable example. The self-assessment method was used to survey 419 households in Shiraz, Iran, during 2019 to estimate household bread waste (BW) and to identify waste-causing consumption recipes (WCCR). These WCCRs were replicated in the lab, and the resulting BW was measured. The underestimation in the self-assessment method was revealed by comparing the survey results with the lab measurements. The underestimation ratio (UR) ranged between 1.24 and 1.80. The pattern of difference between these four bread types was similar among the survey and lab data. In conclusion, the lab measurements may estimate BW caused by the WCCRs more accurately. This suggests that URs can be applied to correct the underestimation in self-assessment surveys. Such an approach could provide the basis for further research on the development of cost-effective methods to quantify waste across a variety of food commodities.
1. Introduction
In recent years, increased attention has been paid to food loss and waste (FLW) at national and international levels [1,2,3,4]. The United Nations’ (UN) Sustainable Development Goal 12.3 requires all nations to cut their food waste at consumer level by half by 2030 and to mitigate food loss along production and supply chains [5]. Several countries passed laws and adopted plans aiming at FLW reduction. In Germany, for example, the Federal Ministry for Food and Agriculture [6] adopted a national strategy for the reduction of food waste, starting in 2019. Japan’s parliament even passed a law in 2019 for reducing FLW [7].
However, the success of such plans is highly dependent on thorough monitoring and evaluation of their progress. For this purpose, valid and reliable data on FLW play a crucial role, and quantifying FLW is a necessary prerequisite [8]. The availability of up-to-date primary comparable data on FLW remains a serious challenge [9]. The reason might be embedded in the lack of standard measuring methods or inhomogeneity in FLW definitions and recognitions [8,10]. In a systematic review, van der Werf and Gilliland [11] found high variability in FLW estimations (95.6–300.0 kg/capita/yr). They argued that, in addition to geographical factors, methodological and definitional differences could cause the high variation.
According to the report on Global Food Losses and Food Waste published by the Food and Agriculture Organization of the United Nations [12], food loss refers to food’s quantitative deduction from farms to market (pre-consumption stages), whereas food waste alludes to discarding food at retail and consumer levels (consumption stages). Hereafter, the terms “food loss” and “food waste” are used in conformation with these definitions.
Compared to food waste estimation, quantifying food loss seems to be less complex, with the use of food balance sheets [13] and analysis of the mass flow of certain food commodities at production, storage, transportation, processing, and distribution stages [12,14,15]. Expectedly, gaining access to robust data on food loss is easier in countries with well-developed food supply chains and transparent inventory [16]. For example, in the European Union (EU), the food traceability law, Article 18 of Regulation 178/2002, requires the member states to maintain precise records of food and feed products “at all stages of production, processing, and distribution” [17]. This law can facilitate the material flow analysis to quantify FLW throughout the food supply chains. To quantify potato loss in Switzerland, Willersinn et al. [2] first used secondary data from the governmental and institutional sources, then surveyed producers and stakeholders along the different segments of the supply chain to cover the missing data.
However, regarding food waste, establishing proper quantification methods to gain more precise estimations remains essential, especially considering the high contribution of consumption stages to the total FLW, which is approximately 6–20% in developing countries and 26–40% in developed countries [12]. Aside from the methods used to estimate waste in foodservice sectors that bear low ambiguity [18,19], limitations and complexity of household food waste estimation methods seem to remain crucial [2,16]. Therefore, food waste quantification at household level has become a central issue [16].
In spite of the attempts to establish one standard method for food waste estimation in households, such as the efforts within the FUSION [20] and REFRESH [21] projects, researchers still implement various approaches depending on data availability, context, and settings of their studies. Both of the projects mentioned aimed to develop unified definitional frameworks and standard quantification methods for FLW. However, these projects belong to the EU and focused on the food waste issue in the EU. Although the applicability of the methods developed within these projects was satisfactory for some European studies [8,22], implementation of such methods might be challenging in some non-European countries where sufficient research budgets are scarce, e.g., in developing countries. In general, the food waste data gap in developing countries is wider compared to high-income countries [16]. The reason might be that food waste quantification methods, especially for identifying domestic food waste, are costly. Therefore, in order to fill the data gap, it is critical to develop methodologies that are both accurate and affordable particularly in low-income countries [16,23,24].
Elimelech et al. [24] categorized previous methodologies of food waste evaluation for households into two approaches: (1) objective or “food waste direct measurement” that is based on physical analysis of domestic food waste and (2) subjective or ‘‘self-assessment” that includes using consumer diaries or recall questionnaires. Both of these approaches have limitations and advantages. Although direct measurements may yield more precise numbers [25], they are expensive and challenging to carry out [24]. In many study settings [26], it is difficult to achieve large enough sample sizes using direct measurement methods, due to the high costs and efforts involved. Although self-assessments may be more convenient to obtain larger sample sizes and cover more population segments, they bear high uncertainty and subjectivity [16,23,25,27], and so implementing them might be unjustified [24,26]. Few researchers have tried to increase the reliability of household food waste data by implementing hybrid methods consisting of both direct measurement and self-assessment surveys [24,26]. Elimelech et al. [24] compared objective and subjective methods by conducting food waste physical direct measurement and food expenditure survey as the objective methods and questionnaire survey as the subjective method simultaneously. Moreover, Quested et al. [26] compared direct measurement and food waste diary. Both of these studies concluded that direct measurement is more accurate than self-assessment. However, considering the impracticality of direct measurement in many contexts, improving self-assessment surveys seems to be more relevant.
The major flaw in self-assessment methods is considered to be underestimation [20,23,24,28,29,30]. The studies that implement diaries mostly understate the amount of waste [23,28,29], because respondents are more mindful about the matter [20,26,28]. Underestimation also occurs in the surveys using recall questionnaires, due to difficulty in remembering the waste amount or even lack of awareness regarding waste occurrence [30]. Some respondents’ lack of honesty and openness can also explain the inaccuracy in the results of both diary and questionnaire surveys [20].
Although previous self-assessment studies might have failed to provide accurate estimations of food waste amounts at household level [16], a considerable amount of literature has successfully identified the reasons behind food wastage at the household level [2,31,32,33,34,35]. These reasons can include attitudes to food shopping, storage management [34,35], personal preferences [36], beliefs, lifestyle, waste awareness, and perhaps, a particularly crucial point is food preparation/consumption methods [2,31,32,33], henceforth referred to as “consumption recipe” (CR).
Certain CRs could lead to avoidable food wastage due to the discarding of edible parts of food [37]. An example of such CRs is the consumption of citrus fruits as juice, or only pomace, or even pomace and zest, which generates various amounts of avoidable food waste [38]. Another example is that some athletes discard egg yolk before consumption [39]. More examples could be obtained in different geographical and cultural contexts, most of which could be replicated in a lab with possible practicality of measuring the resulting waste.
The goal of this paper is to propose a new methodological approach to reach a compromise between accuracy and feasibility by increasing the validity of self-assessment survey data while considering executive costs and complications. Accordingly, the study aimed to examine the feasibility of measuring avoidable food waste resulting from waste-causing CRs (WCCR) in the lab and to discuss the possibility of using the lab results to correct the underestimation of self-assessment surveys. The research focused on identifying the WCCRs that contribute to avoidable food waste that is measurable in a lab.
As previously mentioned, most studies on FLW have been conducted in developed countries [16]. Therefore, as a developing country with a dynamic young population and a transitional agri-food system, Iran was chosen as the target region. Bread was used as an example to test the method. The reason for choosing this food commodity lies in its importance as the main staple food in Iranian culture and cuisine [40]. Choosing bread facilitated reaching a relatively large number of households who could easily relate to the study’s topic. Shiraz was chosen as the target location, as it is the capital of the major wheat-producing province, Fars. Shiraz is also the fifth most populated city in the country, with about 1.87 million inhabitants [41], which provided favorable possibilities to conduct this study in an urban setting. The main focus of this study was solely on the methodology of household food waste measurement. The discussion of bread waste (BW) amount falls outside of the scope of this paper and will be provided in a separate article.
2. Materials and Methods
2.1. Overview
This section provides information on how the questionnaire survey and the lab measurements were conducted. Moreover, the statistical analysis methodology used to compare the survey outcome with the lab results is described. The final part of this section outlines the underestimation ratio (UR) calculation.
2.2. The Questionnaire Survey
A face-to-face questionnaire survey was conducted from December 2018 to August 2019 in Shiraz, Iran. A total of 419 households were studied. Each household was defined as one sampling unit, referring to a group of two or more individuals living in one house and sharing food and its costs. The study was carried out in conformity with the Declaration of Helsinki. The survey protocol was certified by the Ethical Committee of the Shiraz University of Medical Sciences, with the code IR.SUMS.REC.1397.595. In all cases, participants’ written consent was obtained before the onset of interviews.
The sample size was calculated based on the total number of households living in Shiraz and according to the following equation [42], while adding about a 10% buffer.
where n identifies the sample size;
- N is the population (households in Shiraz = 477,916 [41]);
- Z denotes the Z score based on the level of confidence (for a level of confidence of 95%, Z = 1.96);
- P stands for the expected prevalence or proportion (assumed to be 50%);
- E is an abbreviation for the margin of error (assumed to be 5%).
Final sample size = n + ~10% = 419
In order to achieve homogeneity in the geographical distribution of samples, the households were selected based on a three-stage selection approach consisting of, firstly, stratified sampling, secondly, cluster sampling, and finally, systematic sampling.
Data were gathered using a researcher-made questionnaire. In order to evaluate the respondents’ comprehension of the questions, the questionnaire was tested beforehand by interviewing 22 samples outside of the study population. The questionnaire included questions regarding bread purchase, wastage, and CRs of the households. The person responsible for food preparation and management in the household was interviewed.
The bread types included in this study were baguette, burger bun (hereafter referred to as bun), a baguette-like 20-cm bread locally known as sandwich bread, and a traditional Iranian flatbread called sangak. Each bread type was available in two categories at the food market in Shiraz, namely traditionally baked and machine-made for sangak, and fresh and packaged for the others. Packaged bread was defined as factory-produced bread with plastic packing and expiry date. For the sake of simplicity, each category of a bread type is referred to as bread item (e.g., fresh baguette). Further specifications of the studied bread can be found in Iranian National Standards Organization (INSO) [43,44] and Karizaki [40].
The respondents were asked to provide an estimation of the number of bread pieces usually purchased when typically shopping for the household, as well as the amount of waste of the same purchase, using specific portion sizes, namely a 7-cm piece for baguette and sandwich; half a piece for bun; and one palm as a scale for sangak. The definition of waste was explained to the respondents as parts of bread not used for human consumption. This means stale bread used for cooking was not considered as waste, but bread which was disposed of with household garbage or fed to animals was accounted for as waste. The reported purchased bread pieces and the respective waste amount values were converted to gram using the locally validated domestic guideline for food measures [45]. The waste was calculated based on the mass relation of the wasted amount compared to the purchased amount, expressed in percent. In addition, the respondents were asked to describe the CRs they apply for each bread item. A hypothetical example is given below for further clarification.
Interviewer: How many pieces of baguette would you typically purchase for the household without considering special occasions?Respondent: Two pieces.Interviewer: How much of these two pieces would be normally wasted in your house? Please express your estimation using a 7-cm baguette piece as an index.Respondent: Normally two 7-cm pieces would be wasted.Interviewer: How do you consume baguette? Do you consume the bread as a whole or do you discard some parts before consumption?Respondent: We normally discard the inner crumb before consumption.
In the given example, the amount of purchased baguette and the waste amount would have been calculated to be 310 and 70 g, respectively, given that a complete baguette piece weighs 155 g and each 7-cm piece is 35 g [45]. Accordingly, the baguette waste amount for this hypothetical household would be 22.6%. Moreover, inner crumb discarding would be identified as the WCCR for this household. Similar questions were also asked regarding the other bread types. In cases where the response did not conform to the validated portion sizes, a nutritionist converted the answers to gram using dietary assessment exchange lists. If the response was too subjective and conversion was not possible, the case was excluded from the analysis.
2.3. Lab Measurement
The WCCRs were identified using the survey outcome. Measuring the waste amount resulting from the WCCRs was carried out as follows: bread pieces were acquired from randomly selected bakeries and supermarkets in Shiraz, and the WCCRs for all bread types (except sangak) were replicated with the help of 10 randomly chosen untrained panelists. The bread pieces were weighted first intact—total mass of the whole bread—and then after replicating the WCCR and without the discarded parts, using a lab scale with an accuracy of two decimals. The difference indicating the waste was expressed as a percentage of the total mass. Sangak sampling and recipe replication were treated differently, because sangak’s WCCR is associated with bread quality. Further information about the WCCRs is provided in the results section.
A random selection of a total of 39 sangak pieces (three pieces per shop) was purchased from five traditional sangak bakeries and eight machine-made bakeries in Shiraz. Dough that was not adequately baked was removed from the perimeter of each sangak bread piece. For the other three bread types, 30 bread pieces of each bread item were randomly purchased from different bakeries and supermarkets and then pooled. Packaged baguette was not available at the time of the lab study due to seasonal scarcity. Ten randomly selected untrained panelists were asked to apply the WCCRs. Each panelist was given three bread pieces from each pool. This meant that each panelist applied WCCRs on three pieces of each bread item.
2.4. Statistical Analysis
The software used to analyze the data was SPSS Version 25 [46]. One-way ANOVA and Tukey’s post-hoc tests were conducted to compare the waste percentage mean of the four bread types from the same data source (i.e., lab measurement and questionnaire survey). A nominal p-value of 0.05 or lower was considered statistically significant.
The two-sample t-test was applied to compare the survey data with the lab measurement results, assuming unequal variances. Finally, the URs were calculated as the quotient of the mean values for waste amount measured in the lab and the mean values of the waste amount reported in the survey.
With the use of boxplots, all observations were thoroughly checked for outliers. Cases with a value of three interquartile range (IQR) or higher were recognized as extreme outliers, whereas values more than 1.5 and less than 3 IQR were identified as normal outliers [47]. No outlier was detected among the lab measurement data. However, in the survey datasets, one extreme outlier was found for sangak and baguette. The extreme outliers were excluded for the comparison with lab measurement results, because after referring to the questionnaires, it was revealed that these extreme outliers were the households that reportedly throw away, not only parts of the bread but also the whole bread, because if it is stale it is considered inedible. Such samples could not be used to represent the waste caused by WCCRs. Normal outliers remained in the data. The test was also run without the normal outliers for extra assurance, which did not change the significance in any of the comparisons. The extreme outliers were not excluded from the data used for presenting the total waste in the survey, because extreme high wastage due to the disposal of whole bread can be considered legitimate and must be included in the analysis.
3. Results
3.1. Overview
In this section the questionnaire survey outcomes are presented, followed by the results of the comparison between the survey and the lab measurement data.
3.2. Wheat BW of the Households
Based on the 873 responses from the 419 respondents to the question on the waste amount, the total wheat BW was estimated at 3.64% with a standard deviation (SD) of 6.83%, regardless of type and category. Table 1 shows the mean percentage values for BW, classified on the basis of bread type and category. It is apparent from this table that similar waste proportions were noted in the same categories of baguette, bun, and sandwich, while sangak reportedly had lower numbers. The Tukey test revealed significant differences between sangak waste and any other bread type from the same category (p-value < 0.001), while no significant difference was found among the other three bread types within the same category.

Table 1.
Mass-percentage mean (standard deviation) of total waste for different bread items.
3.3. Bread Purchasing Habits and the Ability to Recall Waste Amount and CRs
The questionnaire survey revealed that not all of the studied households typically purchase all eight bread items. Moreover, not all of the respondents of those households that purchase certain bread types were able to recall the waste amount or CRs. Table 2 shows the typical wheat bread purchasing habits in the households as well as the respondents’ ability to recall the waste amount and CRs. Overall, the respondents had less difficulty in remembering CRs than the waste amount, except in the case of sangak. A high rate of respondents of the households who typically purchase sangak (95.1% for traditionally baked and 98.8% for machine-made) were able to recall the waste amount, while this number ranged from 53.2% to 66.4% for fresh bun and fresh baguette, respectively. Contrarily, the ability to recall the CR was high for all bread items ranging from 91.5% to 93.5%. A small number of interviewees could recall the waste amount but were unable to recollect the CRs. Generally, the tendency towards purchasing fresh bread seems to be higher in comparison to packaged bread. Sangak seemed to be the most popular bread type among the bread types in this study, while bun was found to be the least popular.
Table 2.
Number (frequency) of households presented based on their typical bread purchase habits, and the respondents’ ability to recall waste amount and CR.
3.4. CRs
In response to the question “how do you normally consume bread in your household?”, three major responses were elicited: (1) consuming bread as a whole, (2) consuming bread after discarding the crumb (unbaked perimeter discarded in the case of sangak), and (3) unable to recall the CR. Crumb discard refers to removing the spongy inner texture of bread after cutting the longitudinal section of a bread piece such as baguette. Unbaked perimeter discard occurs when a consumer disposes unbaked or semi-baked dough from the outer perimeter of a flatbread piece such as sangak. However, consuming bread as a whole does not imply that consumers do not discard parts or the whole pieces of bread. The consumers who reported this CR might still throw away stale bread, non-specific parts, or leftovers, hence contributing to the waste percentages previously reported (see Table 1).
Figure 1 illustrates the frequency of the major CRs for the eight bread items among the surveyed households. Overall, the majority of the study population discarded the crumb before consuming baguette, bun, and sandwich bread, whereas most of the sangak consuming households reported that they consume this bread as a whole. Packaged baguette had the highest share of crumb discard (67%), whereas at least half of the households who consume other bread items (with the exception of sangak) also discard the crumb. In more than 80% of the households, there was a tendency to consume sangak without discarding any specific parts. Only a small share of respondents was unable to recollect the CRs, as previously indicated differently in Table 2.
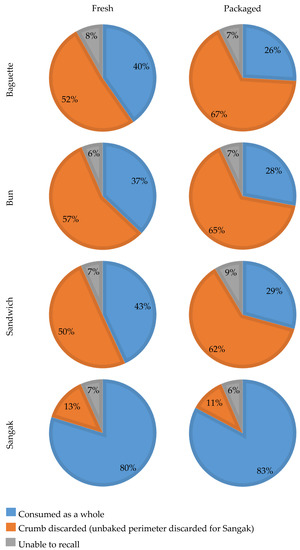
Figure 1.
Frequency of consumption recipes (CRs) among consumers of the eight bread items.
3.5. Survey and Lab Measurement Data Comparison
Discarding unbaked perimeter from sangak and discarding crumb from the other three bread types were identified as the main WCCRs that were to be replicated in the lab based on the methodology described in Section 2.3. Table 3 presents the mean percentage values of BW directly measured in the lab as well as the waste calculated based on the responses from the households in which the typical WCCR was unbaked perimeter discard for sangak and/or crumb discard for the others.
Table 3.
Comparison between survey and lab measurement waste percentage obtained from the data on discarding bread crumb (unbaked perimeter for sangak).
Moreover, Table 3 indicates the results of two-sample t-tests conducted to compare the waste of the same bread type measured in the lab and estimated in the survey. Additionally, this table lists the UR for each bread type, indicating the ratio of measured waste values measured in the lab to the waste values reported in the survey. The two-sample t-test revealed that the waste estimated based on the survey results was significantly lower than the waste measured in the lab for all bread types. The mean values calculated using the lab measurement data were 1.24–1.80 times higher than those estimated according to the questionnaires, which is another way of explaining what the UR represents.
A closer inspection of the results revealed a similar difference pattern among the mean percentage values for the waste of different bread types of the same data source. Figure 2 visualizes the difference patterns between the different bread types among the lab and the survey data. Looking at the lab measurement bar graph, it is clear that sandwich was the highest, closely followed by bun and baguette, while sangak has the lowest mean value. Similar pattern can be seen in the survey results. However, in the lab dataset, the waste values for bun and sandwich waste values were significantly higher compared to baguette and sangak. Additionally, analyzing the questionnaire survey waste data did not show any significant difference between sandwich, bun, and baguette, while sangak waste was significantly lower compared to the other three bread types.
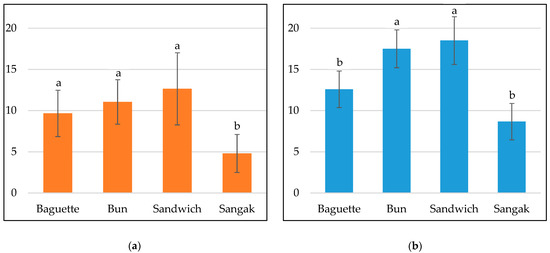
Figure 2.
Graphical representation of the waste percentage means for different bread types: (a) illustrates the waste percentage of the four bread types according to the self-assessment survey and (b) shows the waste mean values for different bread types measured in the lab. Different letters on top of bars with the same color indicate a significant difference within each graph at an alpha level of 0.05 according to Tukey’s post-hoc test.
4. Discussion
The inconsistency in the available data on household food waste is associated with the lack of standard quantification methods [48]. As explained in Section 1, among food waste quantification methods at household level, the implementation of objective approaches (physical measurement) might seem unjustified in large-scale settings due to their high cost and labor requirements [16,49]. On the other hand, the validity and accuracy of subjective methods (self-assessment) are uncertain, although their implementation may be more convenient [24].
Generally, in the self-assessment approach, the accuracy of the respondents’ waste estimates is still questionable [28,30]. Nonetheless, Elimelech et al. [24] argued based on Galton’s “the wisdom of the crowd” [50] that although individuals might underestimate food waste, the overall outcome could be “quite good”. However, they also made clear that using self-assessment methods to evaluate household food waste cannot be justified due to underestimation. Elimelech et al. [24], along with other researchers, proposed further investigations for improving such methods [26,30,51]. The fact that self-assessment surveys highly depend on the respondents’ ability to recall the amount of food waste undermines the accuracy of their outcome [16]. However, although recalling the waste amount is challenging for the respondents, they might remember the CRs of certain food commodities more simply.
As one of the study objectives was to identify the WCCRs that may lead to discarding parts of bread, the focus of this study was on the respondents’ ability to recall not only the waste amount but also the CRs. The results unveiled that the number of respondents who were able to recall the recipes were more than those able to recall the waste amount. Meanwhile, a small number of respondents were able to recall waste but not the recipe. This means respondents could remember the CRs easier than the waste amount. These findings are in good agreement with the work of Richter and Bokelmann [52], who found the self-assessment approach suitable for recollecting precise food waste behavior data. These results are also broadly consistent with the argumentation in Section 1 [2,31,32,33]. That behavioral information is easier to remember compared to the food waste amount could be explained by the differences in the individuals’ ability to recollect data of different natures [53]. Dex [53] explained that people’s ability to remember qualitative information is higher than their ability to recall information of quantitative nature.
As described in Section 1, different factors are associated with food wastage in households, with CR being an important one [2,31,32,33]. Therefore, in this study, the major CRs which could lead to discarding parts of bread pieces and consequently bread wastage were identified as WCCRs. The results showed that the major WCCRs among Shirazi households were discarding the inner crumb of baguette, bun, and sandwich bread, and discarding the unbaked perimeter of sangak. It is unclear why some consumers in Shiraz discard the inner crumb of bread. To the best of our knowledge, no scientific research has addressed this matter. However, it can be speculated that consumers discard the crumb due to cultural reasons, or low bread quality and palatability.
The households were grouped based on their CR, and the BW mean was calculated for the households in which the WCCRs were implemented. Predictably, the mean waste values caused by the WCCRs were higher than the overall calculated waste. All households may waste bread due to storage or purchasing mismanagement [2,31,32,33]. However, those households with the habit of discarding parts of bread contribute to more waste than the households that usually consume the bread as a whole. The main purpose of this study is to examine the possibility of measuring the waste resulted from the WCCRs. Therefore, we attempted to replicate the WCCRs in the lab and directly measure the waste amount.
The lab measurement results were significantly higher than the self-assessment estimations. This concurs well with previous studies that made comparisons between objective and subjective methods [23,24,26]. By “comparing diaries and waste compositional analysis” in a study on household waste of all food groups, Quested et al. [26] found the underestimation in the self-assessment method to be between 7% and 40% (URs of 1.08 to 1.67). Meanwhile, the URs in the present study ranged between 1.24 and 1.80. The concurrence of our results with the work of Quested et al. [26] could suggest that the objective measurement (lab measurement) used in the study resulted in more realistic estimations compared to the subjective method (survey).
Moreover, looking at the differences between the four bread types, it is clear that the difference pattern among BW mean values is similar in survey data and lab outcome. In the survey, sangak was found to have the least waste amount compared to the other three bread types. Lab measurement yielded similar results. This confirms previous findings by Irani and Yazdi-Samadi [54]. The lower waste of sangak can be explained by the fact that most of the households consume this bread type as a whole. Further examinations revealed a similar difference pattern among the survey results and the lab outcomes. In both datasets, sangak had the lowest waste, followed, respectively, by baguette, bun, and sandwich. Assuming the underestimation to be the only factor manipulating the survey results, it could be expected that the real BW mean values should have had the same difference pattern among them, but higher. Therefore, the rational assumption is that the real values are closer to the ones measured in the lab. This may provide additional support for the reliability of the lab measurement results in the present study.
An option for improving the subjective methods might be using URs to correct the underestimation in self-assessment data. Using under/overestimation ratios for correcting data is a well-known approach in data analysis. For example, in nutritional studies, under/over-reporting commonly occurs in recall-based dietary energy intake assessments [55,56,57]. Adjusting these data flaws by means of under/overestimation factors is a well-established method in nutritional sciences [58]. Similarly, using a UR as a tool for correcting the underreporting in household waste self-assessment data might provide a more realistic evaluation. For instance, the UR for bun was 1.58, while the overall waste for this bread—without taking the CRs into account—was estimated to be 5.17% based on the survey. Inflating this number by the factor of 1.58 results in a BW mean of 8.17%. The inflated value is more in agreement with the 13% BW reported by Edjabou et al. [59], who directly measured food waste mass in Danish households.
Based on the approach implemented by Xue et al. [16], we created Table 4 to present the strengths and weaknesses of the methods used for quantifying household food waste in contrast to a hybrid method that consists of self-assessment and lab measurement. As can be seen, the direct measurement method yields the most accurate results. However, this method could be irrelevant in many contexts, because it is cost- and labor-intensive [26]. Implementing a self-assessment method is more feasible, but it does not generate accurate results [24]. Based on our experience, replicating WCCRs and measuring the waste is feasible, and it can help to increase the accuracy of the self-assessment method. Both direct measurement and lab measurement are highly objective. Considering the uncertainty of self-assessment and the need to use objective and subjective hybrid methods [24], implementing a method similar to the one used in this study as an objective method would be a better alternative when compared with the costly method of direct measurement.
Table 4.
Description of strengths and weaknesses of the methods used for household food waste quantification.
Accordingly, the description of the method that this paper proposes can be discussed as follows:
- WCCR identification: The first step is to identify a particular food commodity with WCCR. The necessary information for this purpose could be captured by carrying out a pilot survey by means of a qualitative questionnaire. The criteria for identifying the WCCR are (a) a certain level of familiarity with the chosen food commodity has to exist among the target consumers (e.g., the food commodity is commonly consumed by the majority of the understudy households); (b) the WCCR has to be replicable and should commonly exist among the target consumers. For instance, bread in the context of the present study was commonly consumed among the surveyed households. Moreover, most of the consumers in Shiraz were familiar with the WCCR (e.g., discarding the inner crumb of baguette), which was also replicable in a lab. The main characteristic of the chosen WCCR could be that it contributes to avoidable food waste. Ideally, more than one food commodity with WCCR should be found among a population, which would help to ensure the calculation of a more reliable UR. We recommend choosing food commodities that are not too culturally potent. BW values in the present study were too low, which made data analysis challenging. The low values might be due to the fact that according to many Iranian people’s beliefs, bread is considered sacred in their culture, and wasting it is stigmatized [40]. Moreover, consumers’ perception of edible and inedible food, and thus of avoidable and unavoidable waste, might vary among different populations with different cultural, ethnic, or religious backgrounds [2,37,60]. For example, while potato peel might be considered as inedible and hence unavoidable waste in some cultures [61], others find it nutritious [62]. Therefore, it is essential that the researchers familiarize themselves with the cultural context of their target population.
- Household survey: After identifying the food commodities with WCCRs, a survey must be carried out to evaluate the household food waste using the self-assessment methods (diary or recall questionnaires). However, additional questions on the CRs of the food commodities identified in Step 1 are necessary to enable calculation of the waste amount for the identified food items in the households that implement the WCCRs, for example, “do you discard the inner crumb of baguette?”.
- Food waste measurement in lab: The third step is to randomly acquire samples of the food commodity identified in Step 1 and perform the WCCR. The replication of WCCR in the lab should be carried out by an untrained panel to reduce bias. Subtracting the mass of each food sample before WCCR execution from its mass after WCCR execution reveals the waste amount.
- Calculating the UR: In this step the surveyed households are grouped based on their CRs for the food commodity identified in Step 1. The mean waste is calculated separately for the group with WCCR being the typical consumption habit. The underestimation factor can be calculated based on the following equation.
If more than one food commodity is identified in Step 1, an average UR could be calculated for all of them.
- 5.
- Self-assessment survey underestimation correction: Finally, making use of the calculated UR, the survey waste results for all food items are inflated in order to correct the underestimation caused by respondents’ underreporting.
Study Limitations and Future Research Directions
A major drawback of the work was that the panel was chosen outside of the survey target population due to the research limitations. Therefore, finding correlations and regressing the results of the survey and the lab measurement was not possible. On the other hand, having paired data, as Elimelech et al. [24] had, allows the researcher to conduct more critical analysis and hence gain more accurate results. Therefore, random selection of panelists among the surveyed population can be recommended.
In general, complementing the self-assessment approach with objective methods, such as the one used in this study or direct measurement methods implemented by other researchers [24,26], does not suffice to improve the results. The adoption of food waste questionnaires in accordance with the context of the study is also necessary. One idea could be establishing locally standardized portions sizes for different types of food to facilitate responding to and analyzing questions. Referring back to nutritional science, locally validated dietary intake assessment questionnaires such as food frequency questionnaire (FFQ) provide the interviewees with multiple-choice options to select the portion size that is closer to the estimated intake of particular food items (e.g., one palm for flatbread or a matchbox for fresh cheese) [63]. This method has been well-established over time and yields acceptable data. A similar approach can be found in food waste valuation studies such as the European project REFRESH [21], in which particular portion sizes are defined for each food group. However, the portion sizes seem to be too generic (e.g., only using a serving spoon of potato or a slice of bread), and this may not be applicable in many geographical and cultural contexts, especially in developing countries.
Another suggestion for improving the reliability of food waste data could be clarifying the definitions of avoidable and unavoidable food waste [64] not only for the study objectives, but also for the survey participants. While conducting any types of self-assessment methods, whether it is a food waste diary or questionnaire survey, it is necessary to reach a mutual understanding with the respondents regarding what is considered as waste. Misunderstanding the food waste definition might result in high variance and low reliability of data.
5. Conclusions
In conclusion, this paper proposes the augmentation of self-assessment food waste surveys with lab measurements to obtain more reliable data on households’ food waste. Even though the direct measurement might yield more accurate results, the hybrid approach of self-assessment survey and lab measurement could achieve a compromise between accuracy and feasibility. In general, although the present paper’s BW results may be limited to specific geographical and cultural conditions, the methodological approach of this study could be applicable in a variety of research settings. It is likely to find specific CRs in different cultures, which may cause the wastage of certain food commodities. This will allow the researchers to replicate the CRs, and precisely measure the causing waste amount, which can be used to correct the underestimation in the results gained through self-assessment methods. This approach could facilitate the attainment of an acceptable sample size while adjusting the self-assessment method underestimation using the UR calculated based on lab measurement. Thus, adjustment could lead to a deeper understanding of the actual situation with regard to food waste. The proposed hybrid approach could be convenient for implementation in developing countries where research resources are particularly scarce. The outcome of the present paper could contribute to filling the household food waste data gap, which might be one major barrier in the obtainment of effective strategies to achieve sustainable and responsible consumption patterns. However, it is vital to test this approach in different settings and validate the methodology before implementing it in large-scale studies. Further research is needed to examine the possible ways to identify food commodities with WCCRs.
Author Contributions
Conceptualization: S.G., D.G., S.F., and R.D.; data curation: S.G.; formal analysis: S.G.; funding acquisition: S.G. and R.D.; investigation: S.G. and Y.R.R.; methodology: S.G. and D.G.; project administration: S.G. and S.F.; resources: S.F.; software: G.D.; supervision: D.G. and R.D.; validation: S.G. and D.G.; visualization: S.G.; writing—original draft: S.G.; writing—review and editing: S.G., D.G., S.F., and R.D. All authors have read and agreed to the published version of the manuscript.
Funding
This study was funded by the Food Security Center, University of Hohenheim in Stuttgart, Germany, within the DAAD program exceed with funds from the German Federal Ministry for Economic Cooperation and Development (BMZ) (grant number DAAD 57160040). The study was also financially supported by the Fiat Panis Foundation, Ulm, Germany.
Institutional Review Board Statement
The study was conducted according to the guidelines of the Declaration of Helsinki, and approved by the Ethics Committee of the Shiraz University of Medical Sciences on September 30, 2018, with the code IR.SUMS.REC1397.595.
Informed Consent Statement
Informed consent was obtained from all subjects involved in the study.
Data Availability Statement
The data presented in this study are available on request from the corresponding author.
Acknowledgments
This work was performed in cooperation with Shiraz University of Medical Sciences and Shahid Beheshti University of Medical Sciences. We thank Karsten Schweikert from Modul4: Data and Statistical Consulting of the Core Facility Hohenheim (CFH) (640), the University of Hohenheim, for his valuable support. We would like to express our gratitude to Samira Ghaziani, Julia Rietze, Andrew J. White, Nicole Schönleber, Heinrich Hagel, Azadeh Jamalian, Farhad Akbari Moqadam, Shabnam Mohabati, Mohamad Jalali, Zahra Mosalanezhad, Saba Khatapoush, Kiana Shayegh, and Aref Golshan.
Conflicts of Interest
The authors declare no conflict of interest. The funders had no role in the design of the study; in the collection, analyses, or interpretation of data; in the writing of the manuscript; or in the decision to publish the results.
References
- Tostivint, C.; de Veron, S.; Jan, O.; Lanctuit, H.; Hutton, Z.V.; Loubière, M. Measuring food waste in a dairy supply chain in Pakistan. J. Clean. Prod. 2017, 145, 221–231. [Google Scholar] [CrossRef]
- Willersinn, C.; Mack, G.; Mouron, P.; Keiser, A.; Siegrist, M. Quantity and quality of food losses along the Swiss potato supply chain: Stepwise investigation and the influence of quality standards on losses. Waste Manag. 2015, 46, 120–132. [Google Scholar] [CrossRef]
- Hartikainen, H.; Mogensen, L.; Svanes, E.; Franke, U. Food waste quantification in primary production—The Nordic countries as a case study. Waste Manag. 2018, 71, 502–511. [Google Scholar] [CrossRef]
- European Commission (EU). EU Platform on Food Losses and Food Waste Terms of Reference (ToR); European Commission Directorate-General for Health and Food Safety: Brussels, Belgium, 2016. [Google Scholar]
- Transforming Our World: The 2030 Agenda for Sustainable Development; United Nation’s General Assembly: New York, NY, USA, 2015.
- The Federal Ministry for Food and Agriculture (Bundesministerium für Ernährung und Landwirtschaft). Nationale Strategie zur Reduzierung der Lebensmittelverschwendung; The Federal Ministry for Food and Agriculture (Bundesministerium für Ernährung und Landwirtschaft): Berlin, Germany, 2019. [Google Scholar]
- Proposed Law on Reduction of Food Loss; National Diet of Japan: Tokyo, Japan, 2019.
- Corrado, S.; Caldeira, C.; Eriksson, M.; Hanssen, O.J.; Hauser, H.E.; van Holsteijn, F.; Liu, G.; Östergren, K.; Parry, A.; Secondi, L.; et al. Food waste accounting methodologies: Challenges, opportunities, and further advancements. Glob. Food Sec. 2019, 20. [Google Scholar] [CrossRef]
- Sakaguchi, L.; Pak, N.; Potts, M.D. Tackling the issue of food waste in restaurants: Options for measurement method, reduction and behavioral change. J. Clean. Prod. 2018, 180, 430–436. [Google Scholar] [CrossRef]
- Chaboud, G. Assessing food losses and waste with a methodological framework: Insights from a case study. Resour. Conserv. Recycl. 2017, 125, 188–197. [Google Scholar] [CrossRef]
- van der Werf, P.; Gilliland, J.A. A systematic review of food losses and food waste generation in developed countries. Proc. Inst. Civ. Eng. Waste Resour. Manag. 2017, 170, 66–77. [Google Scholar] [CrossRef]
- Global Food Losses and Food Waste—Extent, Causes and Prevention; Food and Agriculture Organization of the United Nations (FAO): Rome, Italy, 2011.
- Food Balance Sheets—A Handbook; Food and Agriculture Organization of the United Nations (FAO): Rome, Italy, 2001.
- Advancing Sustainable Materials Management: 2017 Fact Sheet Assessing Trends in Material Generation, Recycling, Composting, Combustion with Energy Recovery and Landfilling in the United States; Environmental Protection Agency (EPA): Washington, DC, USA, 2019.
- Caldeira, C.; De Laurentiis, V.; Corrado, S.; van Holsteijn, F.; Sala, S. Quantification of food waste per product group along the food supply chain in the European Union: A mass flow analysis. Resour. Conserv. Recycl. 2019, 149, 479–488. [Google Scholar] [CrossRef] [PubMed]
- Xue, L.; Liu, G.; Parfitt, J.; Liu, X.; Van Herpen, E.; Stenmarck, Å.; O’Connor, C.; Östergren, K.; Cheng, S. Missing food, missing data? A critical review of global food losses and food waste data. Environ. Sci. Technol. 2017, 51, 6618–6633. [Google Scholar] [CrossRef]
- Regulation (EC) No 178/2002 of the European Parliament and of the Council of 28 January 2002 Laying Down the General Principles and Requirements of Food Law, Establishing the European Food Safety Authority and Laying Down Procedures in Matters of Food Saf; European Commission (EC): Brussels, Belgium, 2002.
- Silvennoinen, K.; Heikkilä, L.; Katajajuuri, J.-M.; Reinikainen, A. Food waste volume and origin: Case studies in the Finnish food service sector. Waste Manag. 2015, 46, 140–145. [Google Scholar] [CrossRef] [PubMed]
- Betz, A.; Buchli, J.; Göbel, C.; Müller, C. Food waste in the Swiss food service industry—Magnitude and potential for reduction. Waste Manag. 2015, 35. [Google Scholar] [CrossRef] [PubMed]
- Møller, H.; Hanssen, O.J.; Gustavsson, J.; Östergren, K.; Stenmarck, Å.; Dekhtyar, P. Report on Review of (Food) Waste Reporting Methodology and Practice; FUSIONS EU Project: Wageningen UR, The Netherlands, 2014. [Google Scholar]
- van Herpen, E.; van der Lans, I.; Nijenhuis-de Vries, M.; Holthuysen, N.; Kremer, S. Best Practice Measurement of Household Level Food Waste: Milestone No. 2; Report of the EU Project REFRESH; EU: Brussels, Belgium, 2016. [Google Scholar]
- Kasza, G.; Dorkó, A.; Kunszabó, A.; Szakos, D. Quantification of household food waste in Hungary: A replication study using the fusions methodology. Sustainability 2020, 12, 3069. [Google Scholar] [CrossRef]
- Delley, M.; Brunner, T.A. Household food waste quantification: Comparison of two methods. Br. Food J. 2018, 120, 1504–1515. [Google Scholar] [CrossRef]
- Elimelech, E.; Ert, E.; Ayalon, O. Bridging the gap between self-assessments and measured household food waste: A hybrid valuaion approach. Waste Manag. 2019, 95, 259–270. [Google Scholar] [CrossRef]
- Elimelech, E.; Ert, E.; Ayalon, O. Exploring the drivers behind self-reported and measured food wastage. Sustainability 2019, 11, 5677. [Google Scholar] [CrossRef]
- Quested, T.E.; Palmer, G.; Moreno, L.C.; McDermott, C.; Schumacher, K. Comparing diaries and waste compositional analysis for measuring food waste in the home. J. Clean. Prod. 2020, 262. [Google Scholar] [CrossRef]
- Giordano, C.; Alboni, F.; Falasconi, L. Quantities, determinants, and awareness of households’ food waste in Italy: A comparison between diary and questionnaires quantities. Sustainability 2019, 11, 3381. [Google Scholar] [CrossRef]
- Abeliotis, K.; Lasaridi, K.; Boikou, K.; Chroni, C. Food waste volume and composition in households in Greece. Glob. Nest J. 2019, 21, 399–404. [Google Scholar] [CrossRef]
- Stuart, T. Waste—Uncovering the Global Food Scandal; Penguin Books: London, UK, 2009. [Google Scholar]
- Jörissen, J.; Priefer, C.; Bräutigam, K.R. Food waste generation at household level: Results of a survey among employees of two European research centers in Italy and Germany. Sustainability 2015, 7, 2695–2715. [Google Scholar] [CrossRef]
- Parizeau, K.; von Massow, M.; Martin, R. Household-level dynamics of food waste production and related beliefs, attitudes, and behaviours in Guelph, Ontario. Waste Manag. 2015, 35, 207–217. [Google Scholar] [CrossRef] [PubMed]
- Quested, T.E.; Marsh, E.; Stunell, D.; Parry, A.D. Spaghetti soup: The complex world of food waste behaviours. Resour. Conserv. Recycl. 2013, 79, 43–51. [Google Scholar] [CrossRef]
- Bravi, L.; Francioni, B.; Murmura, F.; Savelli, E. Factors affecting household food waste among young consumers and actions to prevent it. A comparison among UK, Spain and Italy. Resour. Conserv. Recycl. 2020, 153, 104586. [Google Scholar] [CrossRef]
- Jungowska, J.; Kulczyński, B.; Sidor, A.; Gramza-Michałowska, A. Assessment of factors affecting the amount of food waste in households run by polish women aware of well-being. Sustainability 2021, 13, 976. [Google Scholar] [CrossRef]
- Herzberg, R.; Schmidt, T.G.; Schneider, F. Characteristics and determinants of domestic food waste: A representative diary study across Germany. Sustainability 2020, 12, 4702. [Google Scholar] [CrossRef]
- Portugal, T.; Freitas, S.; Cunha, L.M.; Rocha, A.M.C.N. Evaluation of determinants of food waste in family households in the greater Porto area based on self-reported consumption practices. Sustainability 2020, 12, 8781. [Google Scholar] [CrossRef]
- Papargyropoulou, E.; Lozano, R.K.; Steinberger, J.; Wright, N.; Ujang, Z. Bin The food waste hierarchy as a framework for the management of food surplus and food waste. J. Clean. Prod. 2014, 76, 106–115. [Google Scholar] [CrossRef]
- Ghinea, C.; Apostol, L.C.; Prisacaru, A.E.; Leahu, A. Development of a model for food waste composting. Environ. Sci. Pollut. Res. 2019, 26, 4056–4069. [Google Scholar] [CrossRef]
- Hale, J. Should I Eat the Yolk? Separating Facts from Myths to Get You Lean, Fit, and Healthy; Ulysses Press: Berkeley, CA, USA, 2010. [Google Scholar]
- Karizaki, V.M. Ethnic and traditional Iranian breads: Different types, and historical and cultural aspects. J. Ethn. Foods 2017, 4, 8–14. [Google Scholar] [CrossRef]
- Statistical Centre of Iran General census of population and housing: Census results. Available online: https://www.amar.org.ir/english (accessed on 21 August 2019).
- Daniel, W.W. Biostatistics: A Foundation for Analysis in the Health Sciences, 7th ed.; John Wiley & Sons, Inc.: New York, NY, USA, 1999; ISBN 9781119571728. [Google Scholar]
- Bulk Bread-Specifications and Test Methods; Iranian National Standards Organization (INSO): Tehran, Iran, 2017.
- Traditional Bread-Specifications and Test Methods; Iranian National Standards Organization (INSO): Tehran, Iran, 2014.
- Ghafarpour, M.; Houshiar-Rad, A.; Kianfar, H.; Ghaffarpour, M. The Manual for Household Measures, Cooking Yields Factors and Edible Portion of Food; Publication of Agricultural Sciences: Tehran, Iran, 1999. [Google Scholar]
- IBM Corp. IBM SPSS Statistics for Windows, Version 25.0; IBM Corp: Armonk, NY, USA, 2017; Released 2017. [Google Scholar]
- Hoaglin, D.C.; Iglewicz, B. Fine-tuning some resistant rules for outlier labeling. J. Am. Stat. Assoc. 1987, 82, 1149. [Google Scholar] [CrossRef]
- Lebersorger, S.; Schneider, F. Discussion on the methodology for determining food waste in household waste composition studies. Waste Manag. 2011, 31, 1924–1933. [Google Scholar] [CrossRef]
- Visschers, V.H.M.; Wickli, N.; Siegrist, M. Sorting out food waste behaviour: A survey on the motivators and barriers of self-reported amounts of food waste in households. J. Environ. Psychol. 2016, 45, 66–78. [Google Scholar] [CrossRef]
- Galton, F. Vox populi. Nature 1907, 75, 450–451. [Google Scholar] [CrossRef]
- van Herpen, E.; van der Lans, I.A.; Holthuysen, N.; Nijenhuis-de Vries, M.; Quested, T.E. Comparing wasted apples and oranges: An assessment of methods to measure household food waste. Waste Manag. 2019, 88, 71–84. [Google Scholar] [CrossRef]
- Richter, B.; Bokelmann, W. Explorative study about the analysis of storing, purchasing and wasting food by using household diaries. Resour. Conserv. Recycl. 2017, 125, 181–187. [Google Scholar] [CrossRef]
- Dex, S. The reliability of recall data: A literature review. Bull. Sociol. Methodol. Méthodologie Sociol. 1995, 49, 58–89. [Google Scholar] [CrossRef]
- Irani, P.; Yazdi-Samadi, B. An investigation on the causes and the amount of flours and bread waste. In Proceedings of the Measurements for Preventing the Wastage of Natural Resources; Academy of Engineering Sciences: Tehran, Iran, 2004; pp. 217–228. [Google Scholar]
- Schebendach, J.E.; Porter, K.J.; Wolper, C.; Walsh, B.T.; Mayer, L.E.S. Accuracy of self-reported energy intake in weight-restored patients with anorexia nervosa compared with obese and normal weight individuals. Int. J. Eat. Disord. 2012, 45, 570–574. [Google Scholar] [CrossRef] [PubMed]
- Collins, C.; McNamara, A.E.; Brennan, L. Role of metabolomics in identification of biomarkers related to food intake. In Proceedings of the Nutrition Society; Cambridge University Press: Coleraine, Northern Ireland, 2019; Volume 78, pp. 189–196. [Google Scholar]
- Whybrow, S.; Stubbs, R.J.; Johnstone, A.M.; O’Reilly, L.M.; Fuller, Z.; Livingstone, M.B.E.; Horgan, G.W. Plausible self-reported dietary intakes in a residential facility are not necessarily reliable. Eur. J. Clin. Nutr. 2016, 70, 130–135. [Google Scholar] [CrossRef] [PubMed][Green Version]
- Goldberg, G.R.; Black, A.E.; Jebb, S.A.; Cole, T.J.; Murgatroyd, P.R.; Coward, W.A.; Prentice, A.M. Critical evaluation of energy intake data using fundamental principles of energy physiology: 1. Derivation of cut-off limits to identify under-recording. Eur. J. Clin. Nutr. 1991, 45, 569–581. [Google Scholar]
- Edjabou, M.E.; Petersen, C.; Scheutz, C.; Astrup, T.F. Food waste from Danish households: Generation and composition. Waste Manag. 2016, 52, 256–268. [Google Scholar] [CrossRef]
- Nicholes, M.J.; Quested, T.E.; Reynolds, C.; Gillick, S.; Parry, A.D. Surely you don’t eat parsnip skins? Categorising the edibility of food waste. Resour. Conserv. Recycl. 2019, 147, 179–188. [Google Scholar] [CrossRef]
- Camire, M.E.; Kubow, S.; Donnelly, D.J. Potatoes and human health. Crit. Rev. Food Sci. Nutr. 2009, 49, 823–840. [Google Scholar] [CrossRef] [PubMed]
- Arun, K.B.; Chandran, J.; Dhanya, R.; Krishna, P.; Jayamurthy, P.; Nisha, P. A comparative evaluation of antioxidant and antidiabetic potential of peel from young and matured potato. Food Biosci. 2015, 9, 36–46. [Google Scholar] [CrossRef]
- Esfahani, F.H.; Asghari, G.; Mirmiran, P.; Azizi, F. Reproducibility and relative validity of food group intake in a food frequency questionnaire developed for the Tehran lipid and glucose study. J. Epidemiol. 2010, 20, 150–158. [Google Scholar] [CrossRef] [PubMed]
- Corrado, S.; Ardente, F. Modelling of food loss within life cycle assessment: From current practice towards a systematisation. J. Clean. Prod. 2017, 140, 847–859. [Google Scholar] [CrossRef]


Publisher’s Note: MDPI stays neutral with regard to jurisdictional claims in published maps and institutional affiliations. |
© 2021 by the authors. Licensee MDPI, Basel, Switzerland. This article is an open access article distributed under the terms and conditions of the Creative Commons Attribution (CC BY) license (http://creativecommons.org/licenses/by/4.0/).