Article

Determination of Changes in the Quality of Surface Water in the River—Reservoir System

by
Łukasz Gruss
1,*,
Mirosław Wiatkowski
1,
Krzysztof Pulikowski
1 and
Andrzej Kłos
2
1
Institute of Environmental Engineering, Wrocław University of Environmental and Life Sciences, pl. Grunwaldzki 24, 50-363 Wrocław, Poland
2
The Institute of Environmental Engineering and Biotechnology, Opole University, ul. Kardynała Kominka 6, 6a, 45-032 Opole, Poland
*
Author to whom correspondence should be addressed.
Sustainability 2021, 13(6), 3457; https://doi.org/10.3390/su13063457
Submission received: 26 February 2021 / Revised: 16 March 2021 / Accepted: 18 March 2021 / Published: 20 March 2021
(This article belongs to the Special Issue Advances and Challenges in the Sustainable Water Management)

Abstract

:
Assessing the changing parameters of water quality at different points in the river–reservoir system can help prevent river pollution and implement remedial policies. It is also crucial in modeling water resources. Multivariate statistical analysis is useful for the analysis of changes in surface water quality. It helps to identify indicators that may be responsible for the eutrophication process of a reservoir. Additionally, the analysis of the water quality profile and the water quality index (WQI) is useful in assessing water pollution. These tools can support and verify the results of a multivariate statistical analysis. In this study, changes in water quality parameters of the Turawa reservoir (TR), and the Mała Panew river at the point below the Turawa reservoir (bTR) and above the Turawa reservoir (aTR), were analyzed. The analyzed period was from 2019 to 2020 (360 samples were analyzed). It was found that TN, NO2-N, and NO3-N decreased after passing through the Turawa reservoir. Nevertheless, principal component analysis (PCA) and redundancy analysis (RDA) showed that NO2-N and NO3-N contribute to the observed variability of the water quality in the river-reservoir system. PCA showed that pH and PO4-P had a lower impact on the water quality in the reservoir than nitrogen compounds. Additionally, RDA proved that the values of the NO3-N and NO2-N indicators obtained the highest values at the aTR point, PO4-P at the bTR, and pH at the TR. This allows the conclusion that the Turawa reservoir reduced the concentration of NO2-N and NO3-N in comparison with the concentration of these compounds flowing into the reservoir. PCA and RDA showed that both parameters (NO2-N and NO3-N) may be responsible for the eutrophication process of the Turawa reservoir. The analysis of short-term changes in water quality data may reveal additional sources of water pollution. High temperatures and alkaline reaction may cause the release of nitrogen and phosphorus compounds from sediments, which indicates an increased concentration of TP, PO4-P, and Norg in the waters at the TR point, and TP, PO4-P, and NH4-N concentrations at the bTR point. The water quality profile combined with PCA and RDA allows more effective monitoring for the needs of water management in the reservoir catchment area. The analyzed WQI for water below the reservoir (bTR) was lower than that of the reservoir water (TR), which indicates an improvement in water after passing through the reservoir.

1. Introduction

Intensive land use management, such as that undertaken by agriculture, industrial, and urban activities, significantly impact catchment areas, and particularly river valleys. Furthermore, land use management changes the quality and quantity of surface waters [1,2]. Particularly important is the nutrient increase (such as nitrogen and phosphorus), which poses a threat to the aquatic ecosystems of the downstream sections of rivers [1,2,3,4]. The sources of nutrients are mainly runoff from agricultural areas or point pollution of domestic wastewater [5]. The increase in nutrients in the water may lead to eutrophication [3,5,6], excessive algae growth, increased toxicity, and other adverse effects on aquatic fish and invertebrate communities [7,8,9].
In many cases, dam construction results in the retention of the phosphorus fraction [10,11] and nitrogen fraction in reservoir sediments [12,13]. However, due to seasonal changes, in the summer, the reservoir sediments may act as a source of surface water pollution [12,14,15]. In addition, high water pollution is observed during dry periods and intensive rainfall [16]. During dry periods there is low dilution of pollutants [2,16,17,18], whereas intensive rainfall causes surface runoff of pollutants [16].
According to Malik and Hashmi [6], surface water is used for various purposes, such as drinking water supply and irrigating farmland; hence, water quality is also closely related to public health. Therefore, monitoring of water quality parameters should be carried out at various points in a river network to prevent river pollution and apply remedial policies [1,19]. The monitoring of water quality is also important in modelling water resources [20] and the distribution of pollutants, source location, and health hazards, in addition to protecting water resources and controlling water pollution [21]. As reported by Rinke et al. [22], it is very important to monitor short-term physico-chemical parameters at the catchment scale. The authors note that high-frequency data provide deeper insights into the dynamics of the river–reservoir ecosystem. Effective management of surface waters is based primarily on a range of consistent data relating to their quality [3,23]. The water quality index (WQI) is the basic tool for rapid transfer of information to water resource managers. It is simple and robust, and scientifically based [24,25]. This index describes the quality of water at a specific point in time and at a specific place [7,26,27]. The WQI has been used to determine the water quality of reservoirs [26,28], rivers [7,27,29], and channels [25].
Wiatkowski and Czerniawska-Kusza [30] and Wiatkowski et al. [31] point out that water quality assessment can be supported by a water quality profile. As they note, this profile can be helpful to visualize water quality parameters, locate a water reservoir, support water pollution forecasting, and make appropriate economic decisions in the catchment of the designed reservoir in terms of retention, use, and protection of water in the reservoir.
Many scientists have researched water quality changes in river–reservoir systems using multivariate statistical methods [2,3,32,33]. In this case, the research at points below the reservoir, in the reservoir, and above the reservoir are relevant. Other researchers determined water quality in the river network [5,6,7,29,34,35]. Furthermore, Mazur [36] determined water quality in reservoirs. According to Ling et al. [5], monitoring the quality of the surface water in large river basins can generate a large data set. Therefore, a form of multivariate statistical analysis, such as principal component analysis (PCA), is useful for the assessment of the water quality variations in a river. According to Ling et al. [5], multivariate statistical analysis can determine important factors responsible for most of the variance in the water quality of a river. It can also be usefully combined with other kinds of analyses. For instance, Ling et al. [5] and Zeinalzadeh and Rezaei [2] used a combination of PCA and the WQI, and Jabbar and Grote [7] used the surface water quality index and the biotic index in the assessment of seasonal changes, in addition to PCA to assess the variability of water quality indicators over time. The influence of independent variables, such as location, sample points, and seasons, on water quality parameters was also determined using redundancy analysis (RDA) [29,34,37,38,39].
In this study, changes of the water quality at three points of Mała Panew river were analyzed: below (bTR), in (TR), and above the Turawa reservoir (aTR). It is assumed that the Turawa reservoir reduces the concentration of nitrate nitrogen and nitrite nitrogen compared to the concentration of these compounds flowing into the reservoir. Moreover, it is assumed that nitrogen compounds, are responsible for the eutrophication of the waters of the Turawa reservoir. To confirm this, PCA, RDA, and analysis of water quality profile was undertaken. The combination of these analyses will allow us to determine the factors responsible for the eutrophication process of the Turawa reservoir. Additionally, the WQI will assess how the water quality changes in the analyzed river–reservoir system.

2. Materials and Methods

2.1. Study Area and Sampling Points

The Turawa reservoir (50°43′25″ N 18°07′13″ E) is located on the Mała Panew river in the south-western part of Poland, in Central Europe, in the Upper Odra river basin (Figure 1).
This reservoir was built during 1933–1939. It is a multipurpose reservoir. Its main tasks include flood protection, water supply to the power plant, provision of water for shipping purposes on the Odra river, fishing, and recreation [33]. Table 1 presents the parameters of the Turawa reservoir. The bottom of the reservoir contains about 4 million m3 of sapropelic mud and less-contaminated sandy sediments [40]. According to Latała and Wierzba [41], the bottom sediment is in the form of dark grey fine-grained mud consisting of mineral and organic matter. The organic matter content comprises from 20% to 25% of the total mass of the bottom sediment. The bottom sediment is involved in the circulation of matter in the Turawa reservoir [30] and, consequently, has a significant impact on water quality [11,12]. The important aspect in the water quality assessment of the water reservoir is the microbiological characteristic [42,43].
The catchment area of the reservoir is 1423 km2. It is dominated by a forest area, which accounts for 59%. Arable land covers an area of 23%. Urban buildings, meadows, and pastures cover 5% of the area. The remaining use covers 8% of the catchment area.
The average gradient of the Mała Panew valley is 1.58‰. The average temperature is 8.4 °C [33]. The average annual rainfall during the period 1986–2019 was 652 mm.
The average sum of the rainfall during the analyzed period was 684 mm. The highest amount of precipitation in the period from June 2019 to June 2020 was recorded in June 2020 (219 mm), and the lowest in April 2020 (6 mm) (Table 2). The standardized precipitation index (SPI) for the analyzed period, from June 2019 to June 2020, indicates a normal period (SPI = 0.3).
The analysis of the SPI index showed that the normal period in 2019 occurred only in three months (September, October, and December), and in 2020 it was characteristic only for March. The dry period occurred in four months: June 2019, July 2019, November 2019, and January 2020 (Table 2). In addition, the wet period occurred in three months (August 2019, February 2020, and May 2020), and the very dry and extremely wet periods each occurred on one occasion, in April 2020 and June 2020, respectively (Table 2).

2.2. Physico-Chemical Analyses

The 17 water quality parameters were measured twice per month from June 2019 to June 2020 in the mentioned stations of the Mała Panew river and Turawa reservoir. Measurements were taken at 13 points of the Turawa reservoir and one point each below and above the reservoir (Figure 1). A total of 360 samples were analyzed. Selection of water uptake was associated with the variability of the analyzed parameters in a river–reservoir system [33]. Temperature (Tw) and reaction (pH) were measured in situ, whereas dissolved oxygen (DO), biochemical oxygen demand (BOD5), chemical oxygen demand (CODMn), ammonium nitrogen (NH4-N), dissolved substances (DSS), total suspended solids (TSS), nitrate nitrogen (NO3-N), nitrite nitrogen (NO2-N), organic nitrogen, total nitrogen (TN), phosphates (PO4-P), total phosphorus (TP), Zn, Cu, and Cr were determined in the laboratory (Table 3). Tw and pH were measured with Ezodo 7200. The time of the day affects the dissolved oxygen level. Water samples were measured and collected in the morning hours. The following equipment was used in the spectrophotometric methods: Thermo Scientific, Evolution 220 UV-Visible Spectrophotometer (for the determination of: NH4-N, NO2-N, NO3-N, PO4-P, TP, Kjeldahl nitrogen), DKL 12 Automatic Digestion Unit (for the determination of: TP, Kjeldahl nitrogen), UDK 139 Semi-Automatic Kjeldahl Distillation Unit (for the determination of Kjeldahl nitrogen). Kjeldahl nitrogen was needed to calculate total nitrogen (TN). The following measurement wavelengths were used: λNH4 = 655 nm, λNO2 = 540 nm, λNO3 = 410 nm, λPO4 = 880 nm, λTP = 880 nm. The cuvette test was not performed as the applicable standards did not require it. For AAS Thermo Scientific iCE3000 Series AAS was used. The method uses a flame in the conditions of compressed air and acetylene. The measuring wavelengths are as follows: λZn = 213.9 nm, λCu = 324.7 nm, λCr = 357.9 nm. A three-point calibration mode was used. A certified standard solution was used in calibration. The standard curve was checked with ICP multi-element standard solution IV. Each sample was measured three times. The mean was taken as the final value.

2.3. SPI Analyses

The source of the precipitation data for the period of 1986—2020 is the Institute of Meteorology and Water Management–National Research Institute (IMWM-NRI). These data have been processed.

2.4. Statistical Study

All analyzes were performed in R software version 3.6.3. For the analyzed water quality indicators, basic statistics were calculated, such as maximum and minimum value, mean, standard deviation, and coefficient of variation.
The normality of 17 physico-chemical parameters was tested using the Shapiro–Wilk test for each parameter, which is standard procedure in water quality data assessment [2,33]. The water quality parameters with non-normal distribution were logarithmically transformed using log (x + 1).
One-way analysis of variance (one-way ANOVA), with a significance level of 5%, was performed to compare differences in water quality parameters (dependent variable) at different sampling sites (independent variable). One-way ANOVA calculations were made using the “stats” package. For PCA and RDA, only the data were used for which one-way ANOVA showed significant differences. For PCA and RDA, the “vegan” package was used [29]. For RDA, site one-way ANOVA was the independent variable. The significance of the axis was checked using the one-way ANOVA.
The assumption of the water quality profile of the indicator changes is that the points of the analyzed places are marked on the horizontal axis, and the concentrations of the parameters are marked on the vertical axis [11]. The plot contains two pieces of information: boxplot (information on the minimum value, lower quantile, median, upper quantile, and maximum value) and the water quality profile along the watercourse [31].

2.5. Water Quality Index

In this study, the method for determining the WQI was provided by [24,26,27]. The WQI was calculated using the following mathematical expression:
WQI = W i · q i W i ,
where Wi is the unit weight for the ith water quality parameter, i represents the number of the parameters taken into consideration, and qi represents the rating for the ith water quality parameter. The WQI has a value between 0 and 100 (it can exceed 100 if the area is heavily polluted); qi was calculated using the following equation:
q i = 100 · V i V 0 S i V 0 ,
where Vi represents the measured value of the ith parameter; V0 represents the ideal value of that parameter (it is 0 for all the parameters, with the exception of DO, for which the value is 14.6 mg dm−3); Si represents the value legally accepted for the water category in which the water sample was included. Si depends on the number of indicators required in the legal regulations for determining water quality classes in a given country. Si was determined based on [45] for the following indicators: DO, BOD5, NH4-N, NO3-N, PO4-P, TN, and TP.
Wi represents a factor which was calculated using the following formula:
W i = K S i ,
where K is a relative constant calculated by the formula:
K = 1 ( 1 S i )

3. Results and Discussion

3.1. Summary Statistics of Water Quality Parameters

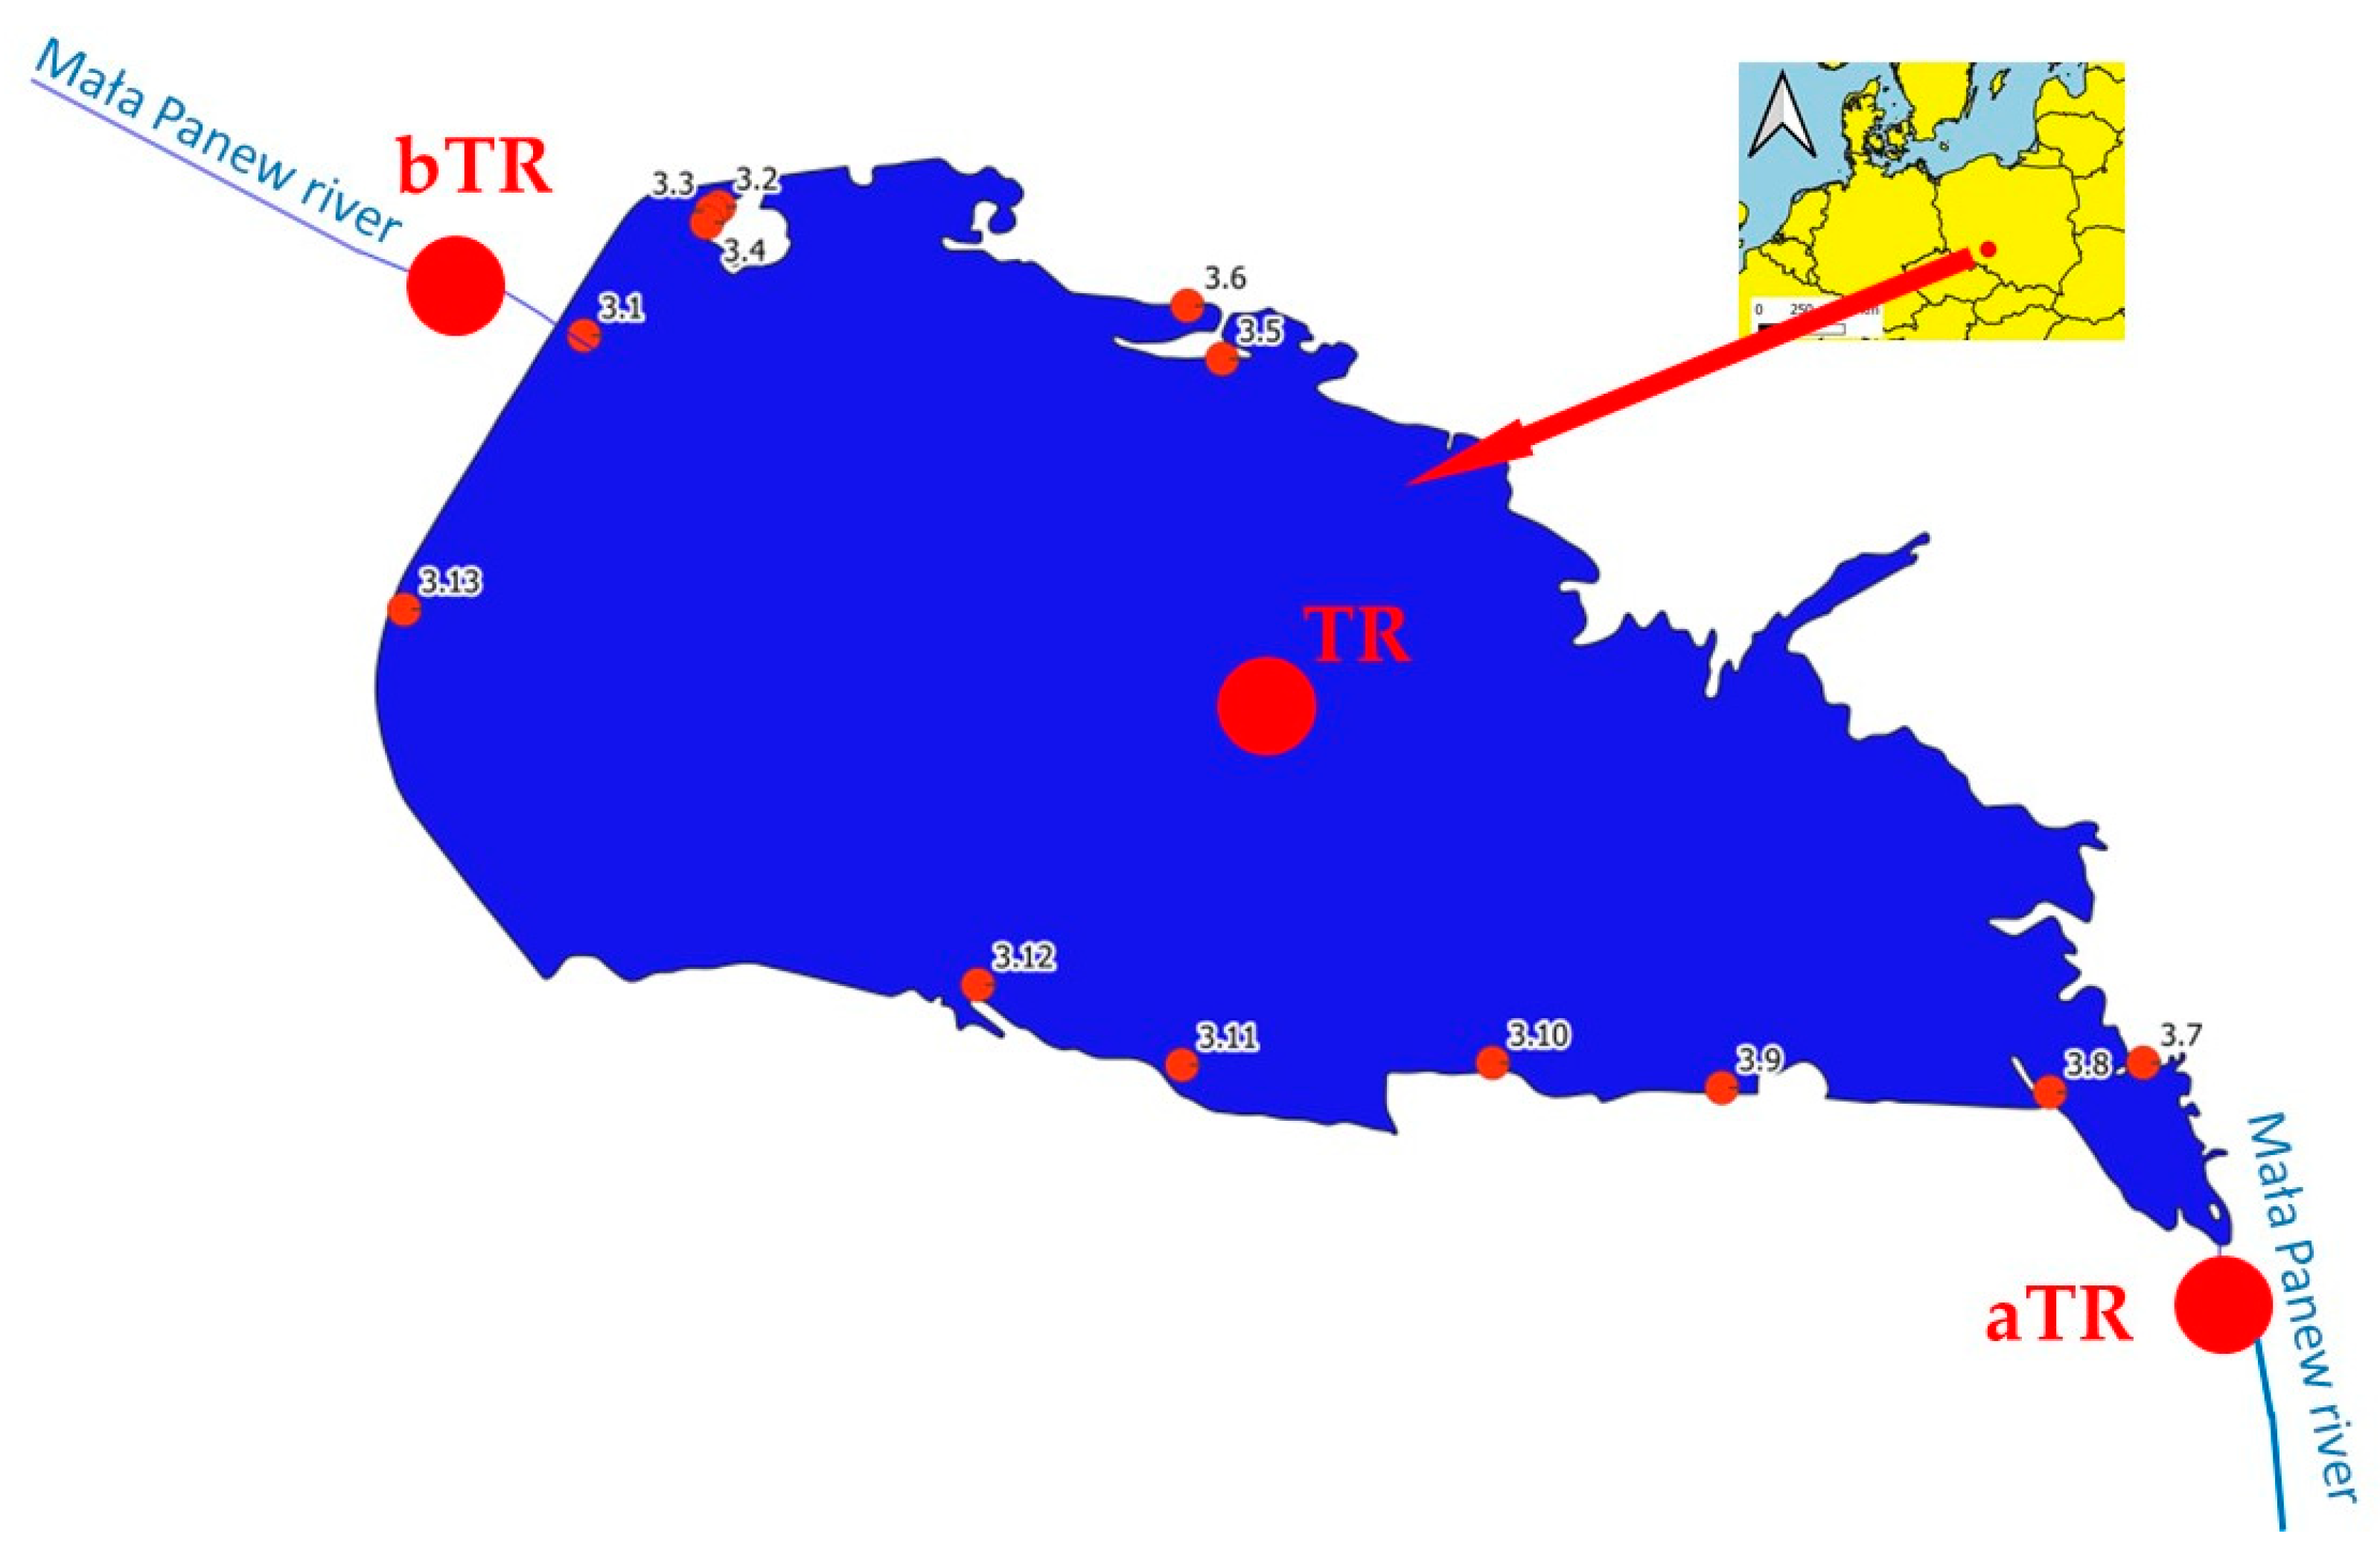
Water samples were measured and collected at the bTR, TR, and aTR points (Figure 1). The one-way ANOVA results showed that among the 17 parameters of water quality, significant statistical differences were noted for pH, NO3-N, NO2-N, and PO4-P (Table 4).
A higher standard deviation (SD) suggested greater differentiation of individual indicators. The SDs in all points were the highest for DSS and TSS and the lowest for heavy metals (Cu and Cr), and NO2-N (Table 4). SDs of NO2-N, NH4-N, and PO4-P were <1 mg∙dm−3, and SDs of TN and DO, BOD5, and CODMn were >1 mg∙dm−3 at all points. The SDs of certain parameters differed between points. The SD of NO3-N was less than 1 mg∙dm−3 only at bTR and TR, whereas the SDs of Norg and TP were less than 1 mg∙dm−3 only at the bTR and aTR points.
It was found that the coefficient of variation (CV) of Cu at bTR and aTR, in addition to BOD5, CODMn, TSS, Cr, and TP at TR, exceeded 100%. The remaining physico-chemical parameters showed smaller temporal changes (Table 4). The CV coefficient also made it possible to evaluate the homogeneity of the analyzed indicators. Two indicators, pH and DSS at all points, in addition to Zn at bTR and DO at aTR, were more concentrated around the mean value, which made this coefficient much lower than for other indicators.
An investigation of water quality at three points in the Turawa Reservoir, (W_res), and below (Out_res) and above (In_res) this reservoir, covered the years 1998–2009, 2011, 2014, and 2016, indicated that the lowest SD value was obtained for the biogenic factor, in this case NO2, and the highest for TSS. These results were consistent with the present study. Wiatkowski and Wiatkowska [33] showed that the CV for TSS, (W-res), NO2 (In_res), and PO4 (Out_res) were characterized by large temporal changes. The number of samples in this study was greater; hence, the CV coefficients did not exceed 130%, as in the case of the present study in which the temporal changes in parameters were more visible [33].
Physico-chemical parameters, such as DSS, NO3-N, NO2-N, TN, and Zn, obtained the highest mean concentrations in the water flowing into the reservoir (aTR point) (Table 4). The highest mean concentrations of Tw, pH, DO, BOD5, CODMn, TSS, and TP were recorded in the water stored in the reservoir (TR) (Table 4). This is consistent with the results of Wiatkowski and Wiatkowska [33]. The highest mean concentrations of NO3, NO2, TN, and DSS and additionally NH4, PO4, and TP were recorded in the water flowing into the reservoir (In_res). Moreover, the highest mean concentrations of Tw, TSS, pH, and DO occurred in the water stored in the reservoir (W-res). The explanation could be that water reservoirs break the river continuum and disrupt the transport of organic matter and metals in the river system, and ultimately affect the chemical and biological properties of the river ecosystem [46,47].
The mean concentrations of trace elements in the Turawa reservoir can be arranged in descending order: Zn > Cu > Cr. Similar results for these concentrations were obtained by Siepak and Sojka [32]. They studied trace elements in two reservoirs: Kowalskie and Stare Miasto. However, the order below (bTR) and above (aTR) the Turawa reservoir is different: Zn > Cr > Cu.
The lowest water temperature (Tw) in the reservoir occurred in January 2020 (3.6 °C). Tw in the reservoir above 24 °C occurred in the months of June 2019 and August 2019. The investigation carried out in the period from June 2019 to June 2020 covered the normal period (SPI = 0.30), although 2019 was classified as a dry year (SPI = −0.8). In addition, dry and extremely dry periods were recorded in five months: June 2019, July 2019, November 2019, January 2020, and April 2020. Monthly periods in which measurements were performed had an impact on changes in water quality parameters in the river–reservoir system. The pH value recorded in the reservoir (TR) was above neutral—the lowest pH value was recorded in July 2019 (7.5 pH) and the highest in August 2019 (8.6 pH). The conditions were similar to those found in the research conducted by Hu et al. [12] and Wiatkowski and Czerniawska-Kusza [30]. This may be the cause of phosphorus release from sapropel sediments of the Turawa reservoir, which indicates an increased concentration of TP and PO4-P in the reservoir waters (TR) and at the point below the reservoir (bTR). According to Hu et al. [12], as a result of the mineralization of sedimentary organic matter and of the long-term accumulation of pollutants, the concentrations of nutrients in sediments are many times greater than those in water. When the external environment changed due to the increase in air temperature in summer and autumn, TP and NH4-N were released from the sediment into the water, which would lead to excessive algae bloom and water quality degradation. Thus, the sediments act as a source of water pollution. The water analyzed in the Turawa reservoir, due to rising temperatures (25–27 °C) and elevated pH (8.12–9.95 pH), was characterized by the release of phosphorus from deeper sediment layers into the surface water [30]. Wang et al. [11] reported that both water temperature (25.3 °C in July) and pH (8.00–8.73 pH) significantly influenced the rate of phosphorus release from the sediment, but the effect of water temperature was more significant. In addition, Bartoszek et al. [15] noted that the water in the reservoir does not have to be alkaline. As further emphasized by Wang et al. [11], acid–base conditions favored the release of phosphorus from sediments, whereas the neutral environment did not. The mean NH4-N concentration had the lowest value in the reservoir water (TR, 0.17 mg∙dm−3), and the highest value at bTR (0.32 mg∙dm−3) (Table 4). By comparison, the mean concentration of Norg had the lowest value in the inflow to the reservoir (1.34 mg∙dm−3) and the highest in the reservoir (TR, 2.66 mg∙dm−3) (Table 4). At the point below the reservoir (bTR), the mean concentration of Norg was lower than in the reservoir (1.62 mg∙dm−3), but still higher than at the inflow to the reservoir (Table 4). This is in line with the research by Hu et al. [12]—when Tw increased at alkaline pH, Norg was transformed into ammonium nitrogen in the sediments, which promoted NH4+-N to be released from sediments. In addition, the reduced oxygen caused by the intensifying mineralization of the sediments hindered the nitrification reaction in the sediments.
Wei et al. [47] report that the Tw in the reservoir is often high and leads to a decrease in the amount of dissolved oxygen (DO) and a decrease in the rate of pollutant decomposition. However, the research of the Turawa reservoir (TR) showed that the mean value of Tw in the reservoir (TR) was higher than Tw in the Mała Panew river at the inflow (aTR) and at the outflow from the reservoir (bTR) and DO concentration in the TR had a higher value than in the river water. Nevertheless, the dissolved oxygen consumption in the reservoir (TR) was higher than that in the river, which indicates the mean value of BOD5 and CODMn (Table 4). Both indicators—BOD5 and CODMn—as clearly indicate anthropogenic pollution [28]. In addition, Maavara et al. [10] report that damming modifies the ecological function of river systems. This indicates that the reservoir takes up nutrients and thus limits nutrient transfer downstream to flood plains. As reported by Wiatkowski [13], depending on the depth of the reservoir and water retention, time, and the incoming load, up to 90% of all of the influencing matter in the water reservoir may be periodically retained.
Additionally, Kanownik et al. [16] showed that in the waters of the Wisłoka river during the period of 2004–2013, the maximum values of most of the analyzed nutrients were recorded in June (TKN = 5.90 mg∙dm−3, TN = 7.40 mg∙dm−3, PO4-P = 0.10 mg∙dm−3, and TP = 0.76 mg∙dm−3) and July (NO2-N = 0.13 mg∙dm−3). The opposite situation was recorded in the mountain river of Raba, where the highest average NO3-N (2.71 mg∙dm−3) concentrations occurred above the Dobczyce reservoir in the winter season. In turn, the highest average PO4-P concentration was recorded below the reservoir (0.05 mg∙dm−3) and the lowest concentration in the reservoir (0.03 mg∙dm−3) [23]. The NH4-N concentration was highest in the inflow to the reservoir (0.98 mg∙dm−3) and lowest in the outflow from the reservoir (0.14 mg∙dm−3), which, according to Kijowska-Strugała et al. [23], was caused by the absorption by autotrophs of ammonia in the reservoir because it is the main source of nutrients for phytoplankton. The investigation of the Rzeszów reservoir conducted by Bartoszek et al. [14] during the summer season of 2013 showed that the reaction is alkaline; the values of Tw and PO4-P were similar to the values in the current study (in summer), whereas the concentrations of TN and TP were lower. Zeinalzadeh and Rezaei [2] obtained different results, finding that changes in water quality above and below the Shahr Chai reservoir in Iran did not show a significant difference. Furthermore, Rinke et al. [22] provided information on data logging, at intervals of 15 min, for the following physico-chemical parameters: pH, conductivity, Tw, dissolved organic carbon (DOC), oxygen, TSS, NO3, and chlorophyll. They showed that observations of the inflow water to the reservoirs over several months documented the highly temporal fluctuations which were caused by changes in water discharge.

3.2. Principal Component Analysis

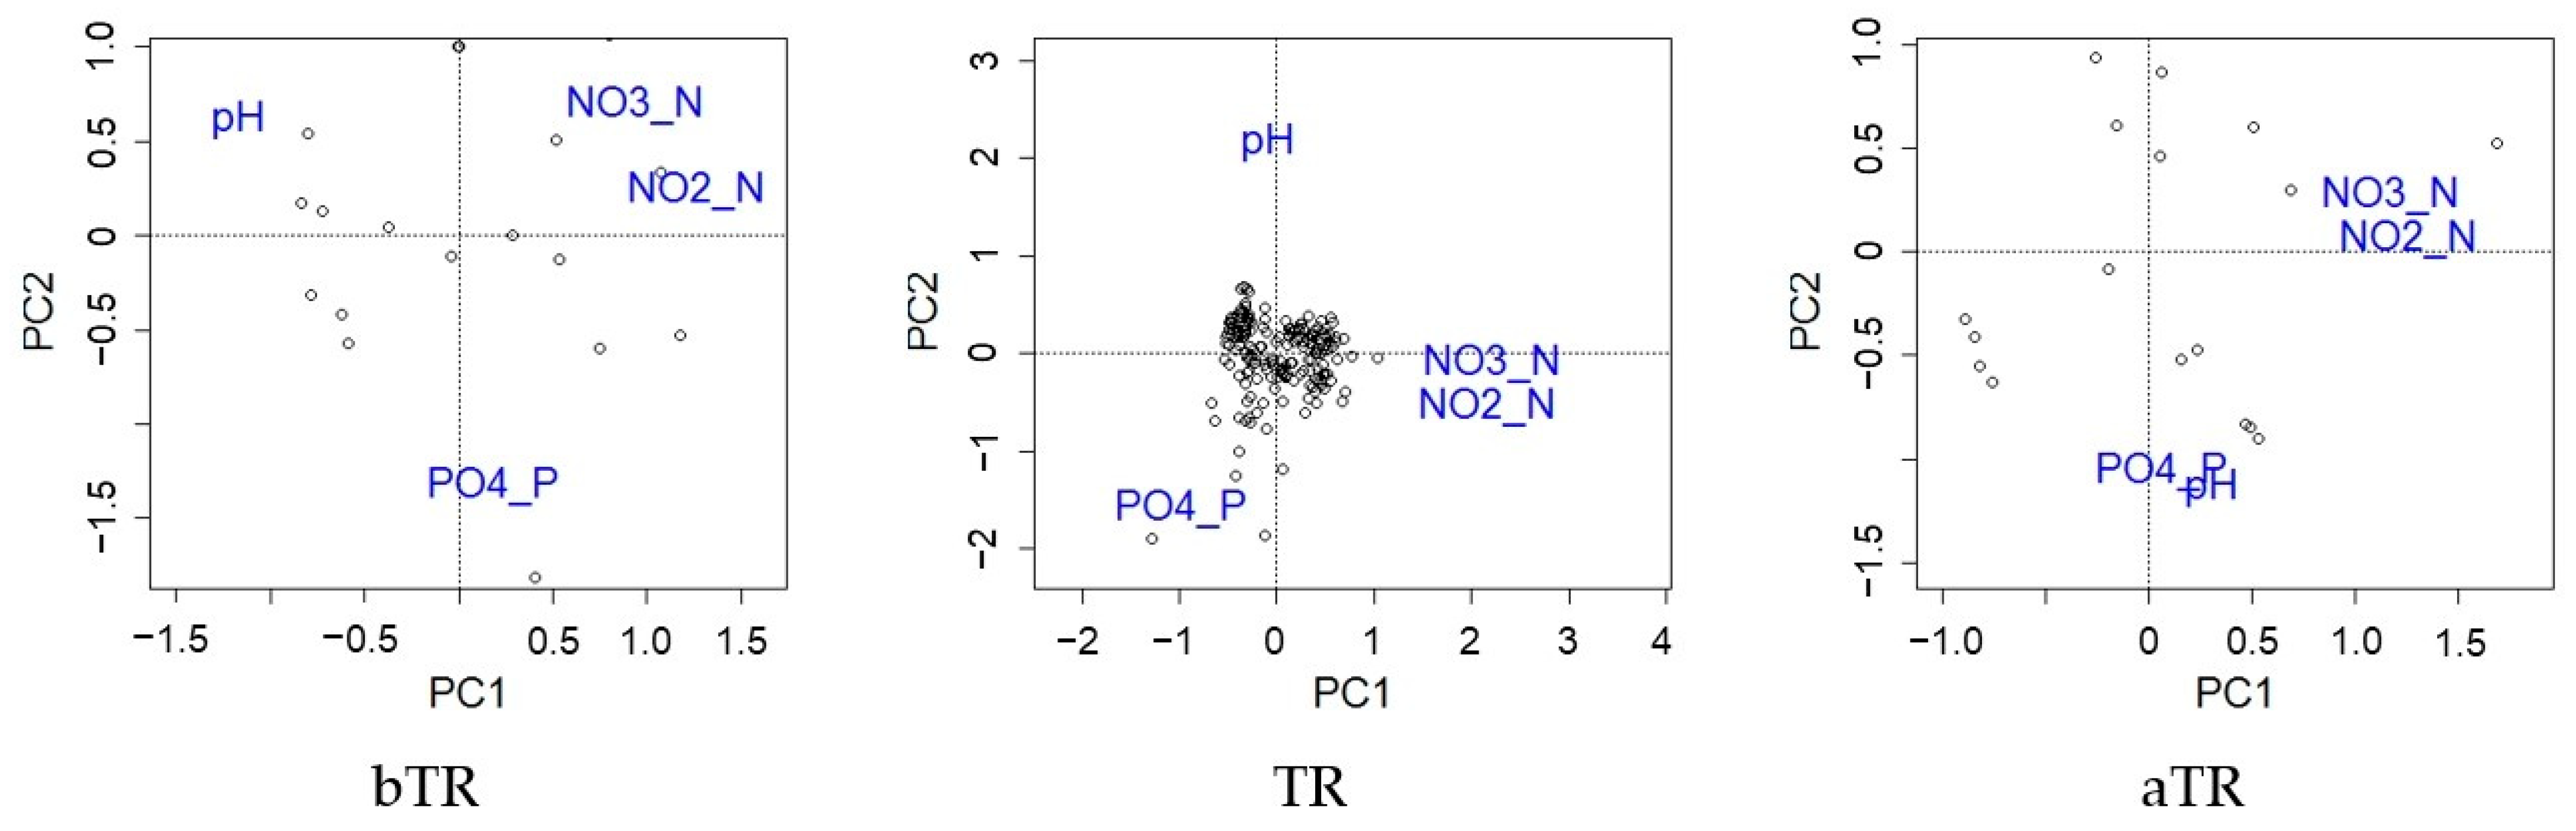
Two principal components were obtained with eigenvalues >1, which accounted for 77.26% of the total variance in the bTR point and 66.86% in the TR point (Table 5). Table 6 presents the strength of the correlation for individual parameters, and Figure 2 illustrates the first two principal components for each of these points.
At the bTR point, the first principal component (PC1) correlated the most highly with pH, NO2-N, and NO3-N, and weaklier with PO4-P (Table 6, Figure 2). The NO2-N and NO3-N components appeared to have the lowest concentrations after transit through the reservoir (Table 4). The nitrification and denitrification processes, which occur in the aquatic ecosystem are linked to microbial quantity and function [48]. In the study on Chen et al. [49] in Lake Taihu the cyanobacterial bloom promoted the efficacy of nitrogen removal in aquatic ecosystem. Therefore, the nitrogen concentration could be lower in the reservoir with the high degree of euthrofization [49,50]. It can be assumed, that in the Turawa reservoir occur similar processes, which could be confirmed in further studies. The second principal component (PC2) correlated most highly with PO4-P (Table 6, Figure 2). As reported by Hu et al. [12], the increased concentration of PO4-P may be affected by bottom sediment of the reservoir (Table 4). At the TR point, parameters were more correlated with PC1 and PC2, than with bTR and aTR points. At the TR point, the PC1 correlated most highly with NO2-N and NO3-N, whereas PC2 correlated most highly with pH, and PC3 correlated most highly with PO4-P. Both NO2-N and NO3-N had lower concentrations at the TR point than in the water flowing into the reservoir (aTR), hence their strong correlation (Table 6, Figure 2). By comparison, pH and PO4-P were not correlated with each other at the TR point (Table 6, Figure 2). This may indicate that the pH has no significant influence on the higher concentration of PO4-P in the waters of the TR reservoir. At the aTR point, pH and PO4-P were negatively correlated with each other, which indicates that they did not have such an impact on the water quality in the reservoir as nitrogen compounds (Table 6, Figure 2). The correlation between NO2-N and NO3-N at all points may indicate that they had the greatest effect on water quality at the analyzed points (Figure 2).
The PCA analysis showed similar results of the PC1 and PC2 factors between the three analyzed points to those found in the study of Wiatkowski and Wiatkowska [33]. Several parameters that influenced the variability of the water quality at the aTR point were the same as those observed by other researchers. As reported by Wiatkowski and Wiatkowska [33], the first principal component (PC1) correlated most highly with NO3 below, in, and above the Turawa reservoir. This indicator, like other nutrients, had the greatest impact on the qualitative differentiation of water in the Turawa reservoir. In addition, at the inflow and outflow from the reservoir, indicators such as pH and PO4 were not concentrated around the PC1 axis, which indicates that they had a smaller impact on water quality at the analyzed points.
In the PCA presented by Zeinalzadeh and Rezaei [2], the first four PCs had eigenvalues close to one. The eigenvalues accounted for 78.6%, 74.7%, 70.8%, and 80% of the total variability of the information contained in the original data set in spring, summer, autumn, and winter, respectively. From their study, it appears that changes in water quality at points above the reservoir and in the reservoir showed no significant difference. The point below the reservoir showed considerably worse water quality only in spring due to the dynamic development of the inhabitants and their commercial activities. In another study, water samples from four dam lakes: Grodzisk Duży, Karwacz, Łoje, and Wykrot, located in north-eastern Poland, from 2007 to 2013 were analyzed [28]. This investigation showed that the parameters of the highest positive eigenvectors associated with PC1 included BOD5 and COD. Negative relationships were found for SO4 and NO3. Cl and EC were negatively related to PC2, whereas DO and pH were positively related. In addition, in an investigation of 10 Polish reservoirs, Mazur et al. [36] showed that, in the case of physico-chemical factors, first principal component (PC1) correlated most highly with TOC and TP. They found a significant association between TN and PC2, and EC and DO with PC3.
Similar studies using the PCA method can be found in the literature. However, this approach does not analyze the impact of reservoirs on water quality and flow, but rather studies the river systems. They are important because planning to build a reservoir can be associated with adequate water quality in the river. PCA is widely used to determine how different river points contribute to the overall pollution load [7,35,51,52]. Nazeer et al. [3] showed that the most influential parameters for PC1 were PO4, EC, salinity, Ca, Mg, K, pH, and DO. They studied the waters of the Soan River in Pakistan. In another study, of the Chillán river and in its tributaries, due to point pollutants, the first principal component (PC1) correlated with NH4, PO4, EC, COD, and DO (negatively correlated), and BOD5. PC2 was highly influenced by the levels of NO3 and NO2 (both positively correlated) and PC3 Tw and pH (both positively correlated) [1]. Siepak and Sojka [32] used PCA, cluster analysis (CA), and discriminant analysis (DA) to assess the temporal and spatial variability in the investigated reservoirs. In the Kowalskie reservoir, Siepak i Sojka [32] found that PC1 was most influenced by Cu, Zn, and Cd, which may indicate the natural origin of these components in water. They also showed that in the Old Town reservoir, PC1 was strongly positively correlated with the concentrations of Cr, Ni, Cu, and Cd.

3.3. Redundancy Analysis

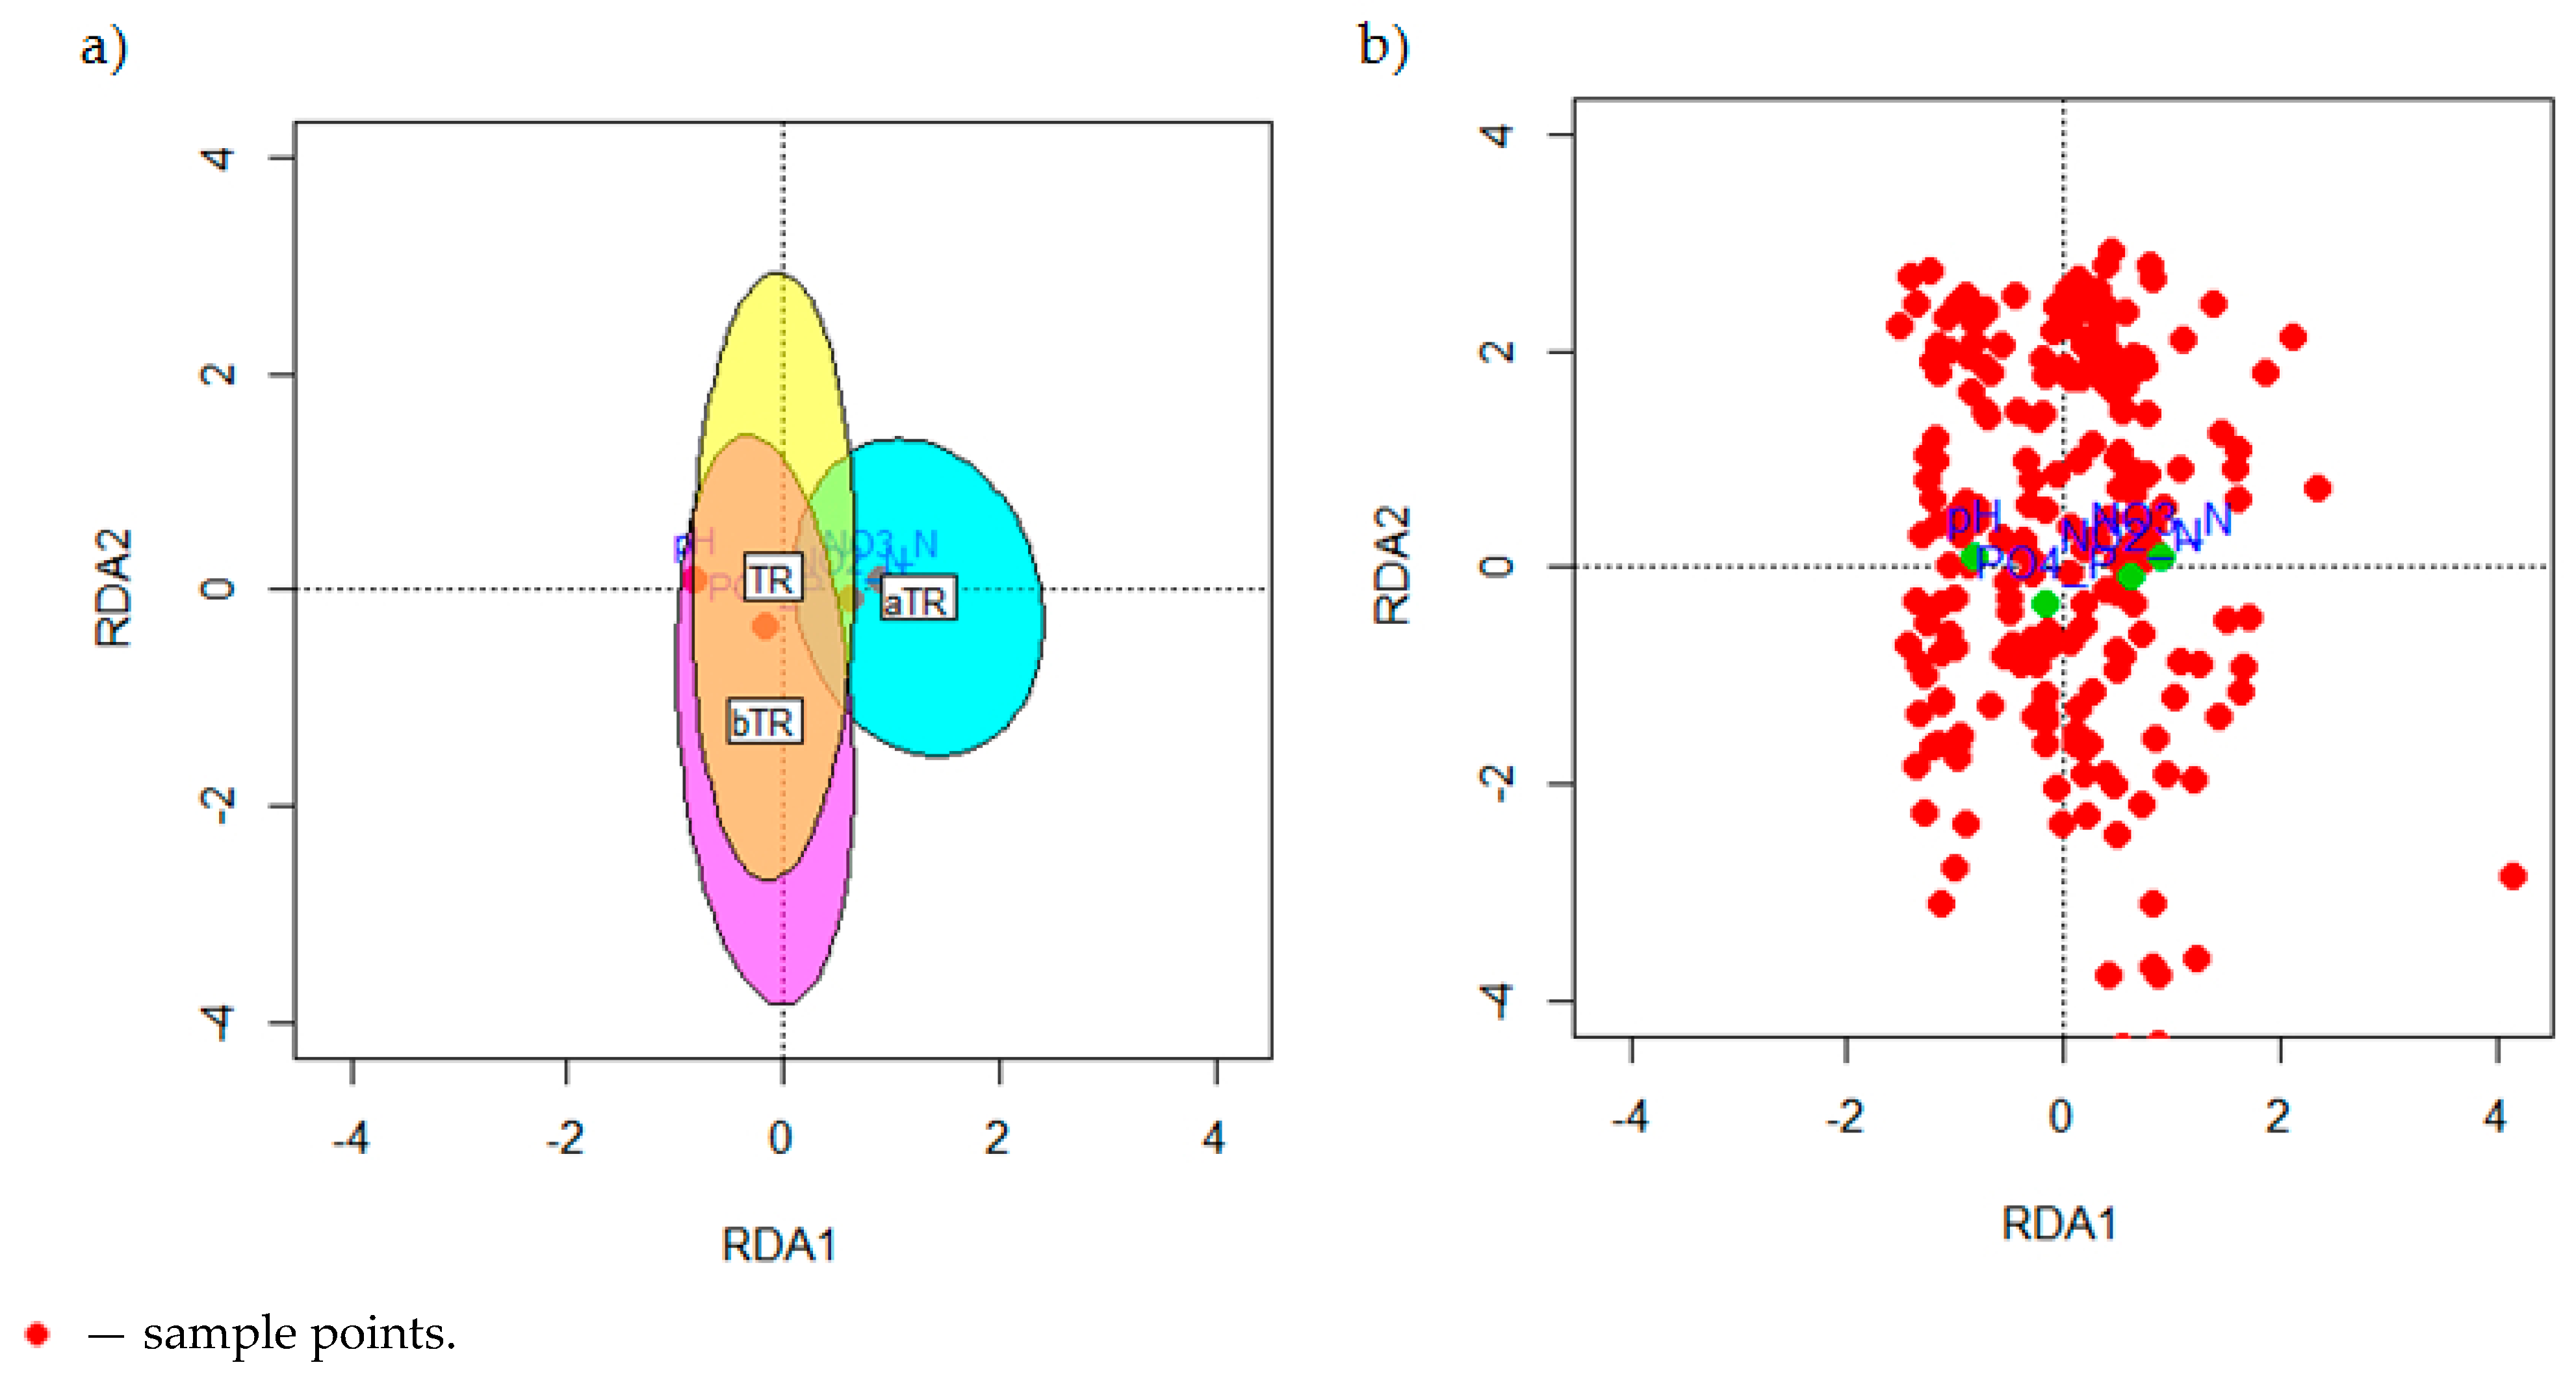
The proportion of the variance explained was 26.94%; the first axis was 6% and was significant according to the RDA model (formula = data ~ site) (p = 0.001) (Table 7). The highest parameter scores of RDA1 were assigned to pH, NO3-N, and NO2-N (Figure 3, Table 8). Similar values of the variants were obtained by Zhou et al. [39], who found that RDA could explain 20.13% of microbial community changes, with the contributions of RDA1 and RDA2 being 11.94% and 8.19%, respectively. Zhou et al. [39] performed RDA and proved that physical (temperature, DO) and chemical (CHl-a, TOC, TN) parameters are the key factors that influence changes in the microbial community in the reservoir water.
The performed redundancy analysis showed that the distribution of parameters at the analyzed points (sites) (Figure 3) was a grouping variable (the ellipsoid was defined by the 95% confidence interval), thus indicating the highest values of physicochemical parameters at a given site. The values of the NO3-N and NO2-N indicators followed the same trend and obtained the highest values at the same site (aTR). In addition, NO2-N and NO3-N concentrations were closely related to the proportions of aTR. At the bTR point, the highest values were obtained for PO4-P. pH was closely related to the proportions of TR. For similar purposes, RDA was used by Palmer et al. [38], Nazeer et al. [3], and Bo [34]. Palmer et al. [38] analyzed water from Ontario lakes (Canada) and showed that lake development and road maintenance were associated with higher concentrations of Na and Cl ions and decreased conductivity in lake waters. The second axis of the RDA was positively correlated with the volume of the lake, runoff, and distance from the road [38]. Nazeer et al. [3] indicated that RDA analysis can be used to identify sources of pollution in river ecosystems because high scores correspond to high influence of the parameter at the sites. Bo et al. [34] presented results of RDA analysis covering land use and water quality parameters. They found that the concentrations of COD and NH4-N were closely related to the proportions of urban green areas and impermeable land, and BOD was closely related to the concentration of COD and the share of forests in the catchment area. However, ten years later, forest area was no longer in the group of dominant areas, and only COD and NH4-N were closely related to urban green areas and impermeable land.
Other applications of RDA were presented by many scientists [29,37]. For example, Kowalczewska-Madura et al. [37] performed RDA for P sedimented in bottom sediment and P released from bottom sediment of the eutrophic Durowskie Lake located in West Poland. This analysis showed that in lake water P was most negatively correlated with DO. Their investigation showed that the release of P depends partly on the N content in the sediment [37]. On the basis of RDA, Ortiz-Vera et al. [29] showed that the variability of physico-chemical parameters depended on the seasons. In the dry season, DO, NO3, and pH concentrations appeared to be predictors of community structure, whereas in the rainy season temperature was also a predictor. Moreover, they observed greater differences in the composition of fungi communities in the dry season than in the rainy season [29].
RDA showed that the RDA1 axis was the most positively correlated with NO2-N and NO3-N, and the most negatively correlated with pH, whereas RDA2 was the most negatively correlated with PO4-P (Table 8).
The results of this study were similar to those of the research conducted by Stendera and Johnson [53], which show that TP determined in streams and lakes was negatively strongly associated with pastures and arable land.

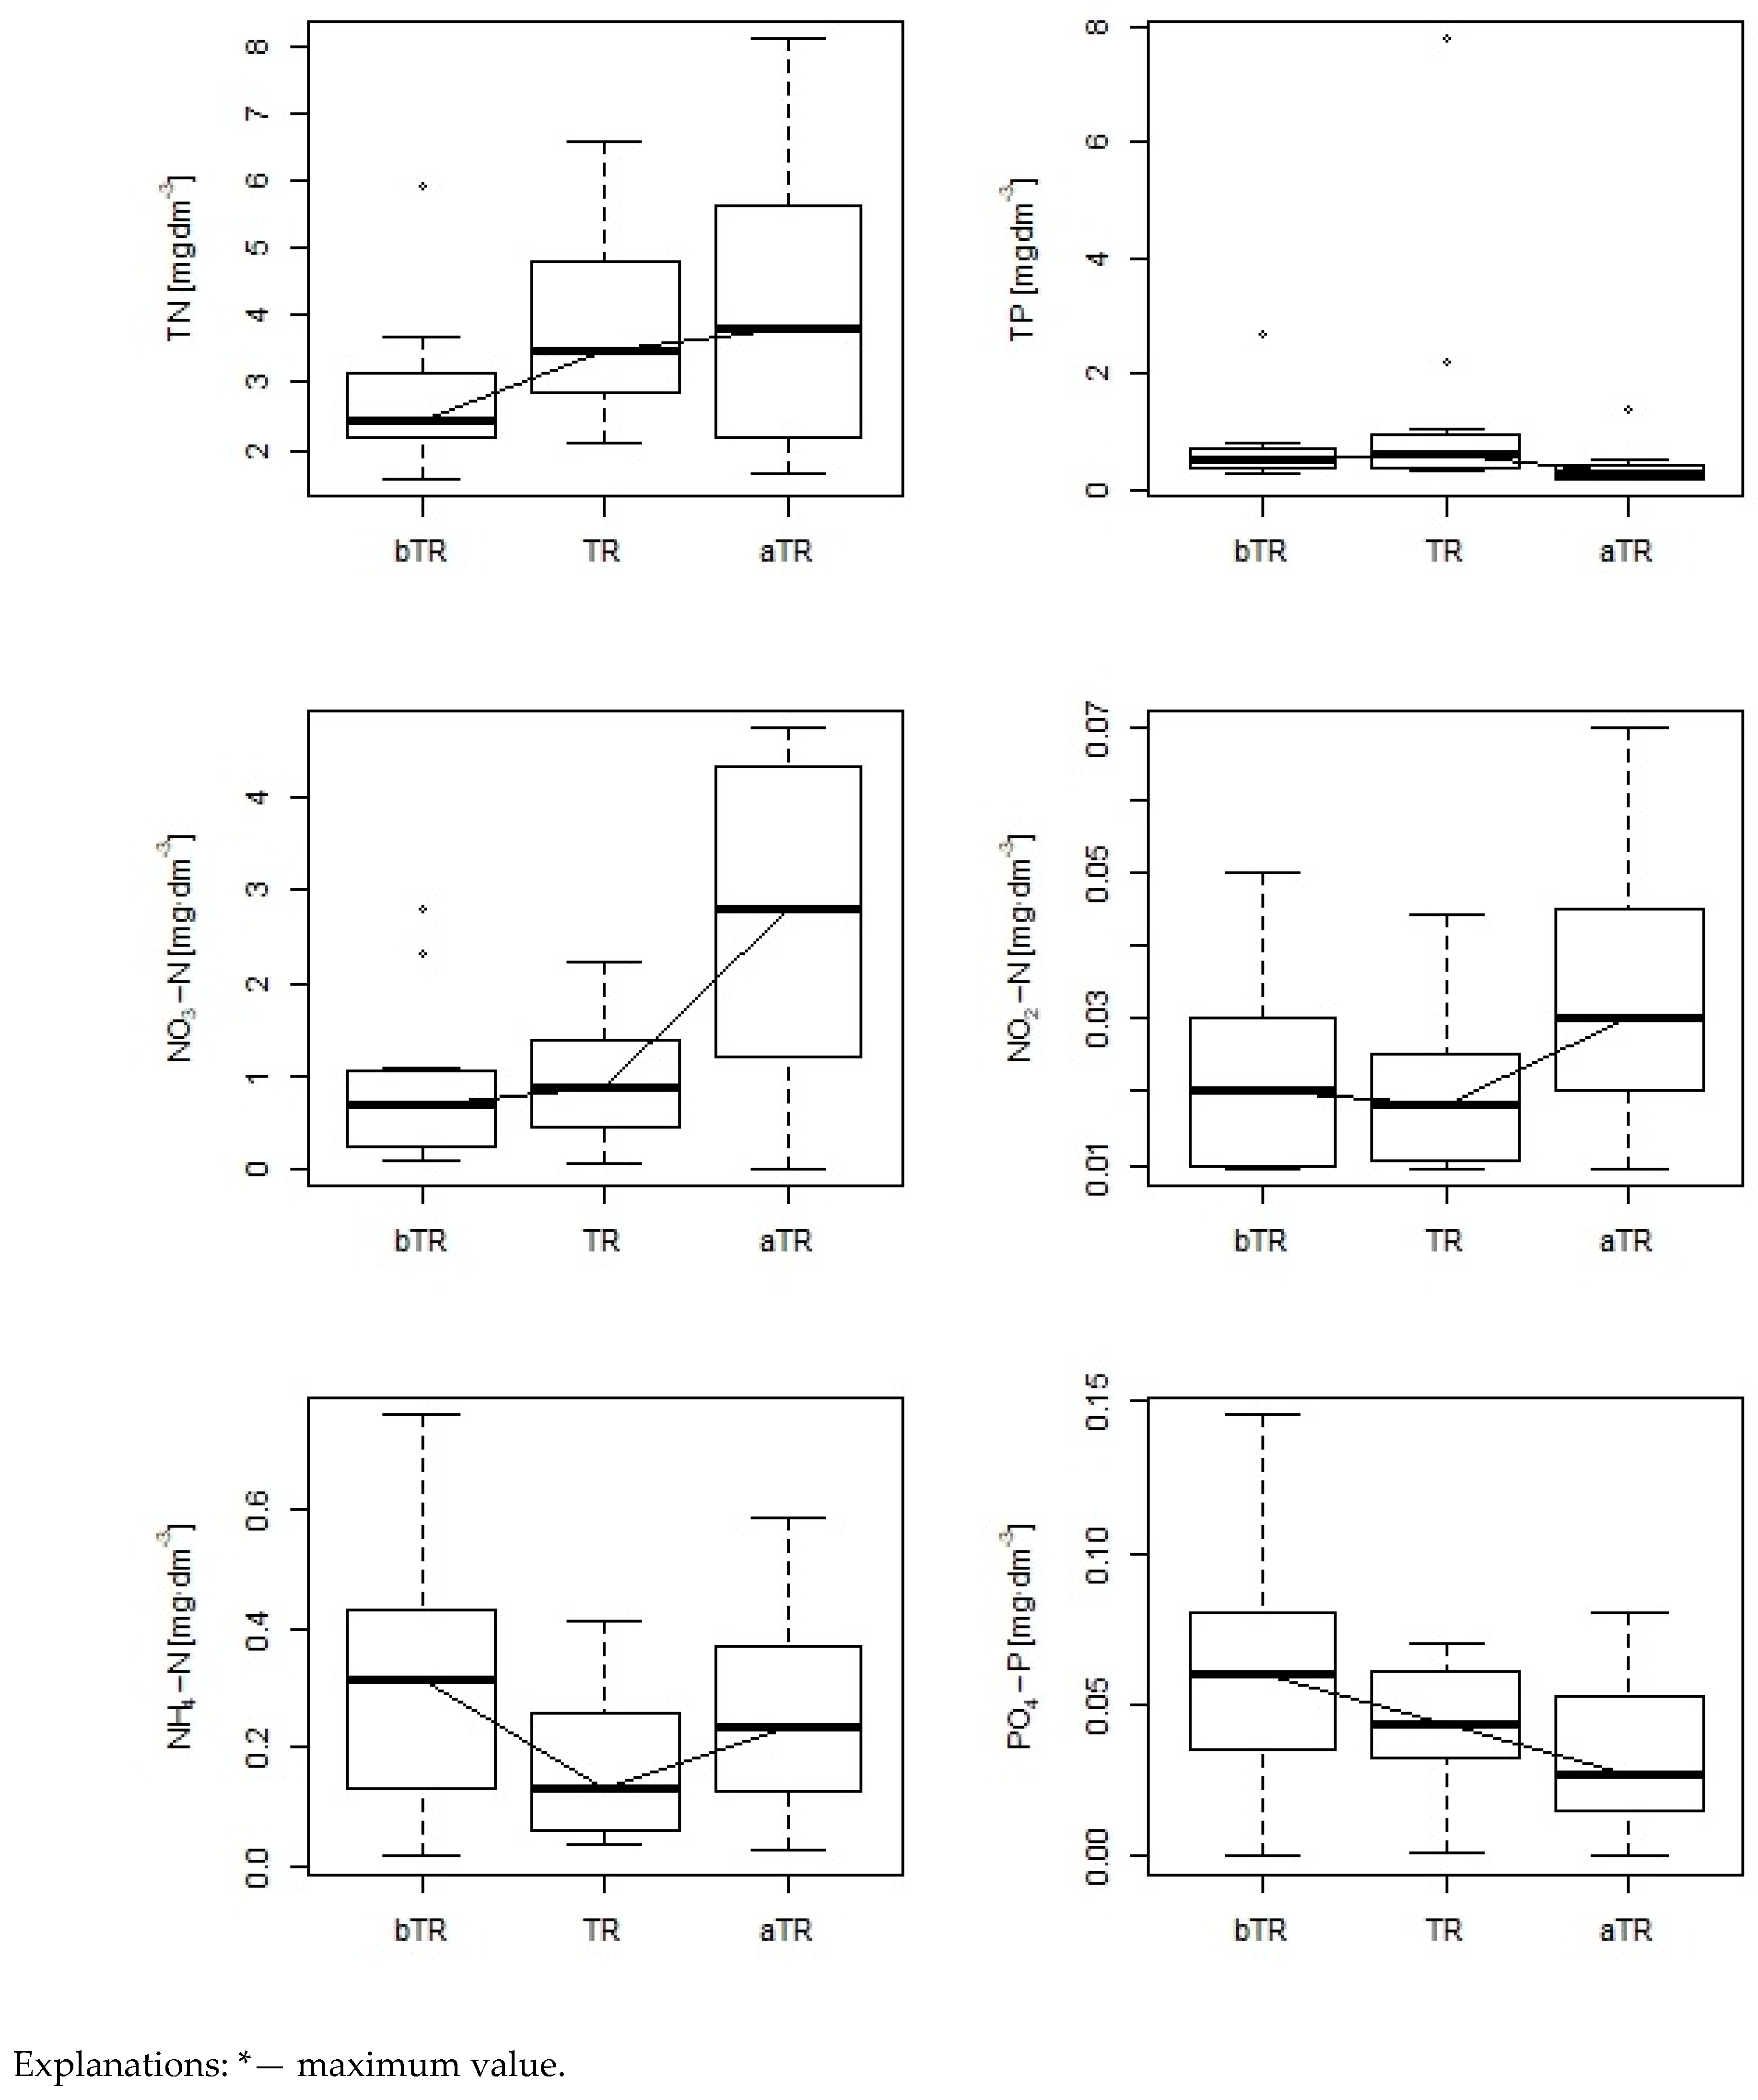
3.4. Water Quality Profile of the Indicator Changes

Changes in the concentrations of the water quality parameters (TN, TP, NO3-N, NO2-N, NH4-N, and PO4-P) of the Mała Panew river at all analyzed points (bTR, TR, and aTR) are shown in Figure 4. The analysis of this profile showed that the highest values of mean concentrations of TN and NO3-N were recorded at the aTR station and the lowest at the bTR station.
The highest values of the median TP were recorded at the TR station, and the lowest values at the aTR station (Figure 4). In addition, the lowest values NO2-N and NH4-N were recorded at the TR station, and the highest at the aTR and bTR stations, respectively (Figure 4). The highest value of the median PO4-P concentration was found at the bTR station and the lowest at the aTR station (Figure 4). The profiles showed clearly that the concentrations of TN, NO3-N, and NO2-N decrease after passing through the Turawa reservoir. After the waters passed through the Turawa reservoir, the median concentrations of TP and NH4-N, PO4-P increased (Figure 4). The water quality profile of the river–reservoir system, including the monitoring of the physico-chemical parameters, shows the influence of the reservoir on water quality during the analyzed period. This was also confirmed by Wiatkowski et al. [31] in the research on the water quality of the Stobrawa river. Their investigation was performed before the construction of the Kluczbork reservoir.
Many scientists also indicated that the creation of a source profile of various factors helps to identify contaminated areas in a catchment, which may be useful in assessing the quality of waters in the catchment [3,11,54]. Yan et al. [54] provided a spatial diagram of polluted and risky sensitive zones in the basin based on the pollution index. Other researchers provided descriptive statistics according to seasonal changes [7]. Debels et al. [1] presented selected descriptive statistics in tabular form according to measuring stations. In the present study, the results of profile analysis are in line with those of the RDA. However, in our opinion, profile analysis is more suitable for analysis of the parameters at the sampling points. By comparison, RDA enables the correlations between the sampling points and parameters to be shown simultaneously. Therefore, profile analysis can be used to support the interpretation of RDA.

3.5. Water Quality Index

The WQI was determined for the period from June 2019 to June 2020 for three points: bTR, TR, and aTR. The index reached its minimum at aTR (WQI = 88), which indicates very poor water quality (Table 9). The waters of the Mała Panew river at the point below the Turawa reservoir (bTR) and in the reservoir (TR) were classified as very polluted. The index peaked at TR. The WQI value at this point was the highest (WQI = 194) (Table 9). However, at the point bTR, the value was WQI = 139 (Table 9).
This was confirmed by the analyses of the average concentrations of water quality parameters at these three research points. The highest concentrations of TP, DO, and BOD5 occurred in the waters of the Turawa reservoir, which may be caused by the release of pollutants from sediment. Despite this, the WQI indicates that the analyzed index for waters below the reservoir (bTR) was lower than the index for waters in the reservoir (TR).
The WQI values of the points at the dam (3.1, 3.13, Figure 1) are as follows: WQI3.1 = 153 i WQI3.13 = 158 (Table 1). Moreover, the WQI values at points above the reservoir are twice as high and amount to WQI3.7 = 253 i WQI3.8 = 221 (Table 10). This indicates that the WQI values determined from the water of the reservoir at the inlet and outlet are consistent with the values presented in the points aTR and bTR. The highest values were determined in the following bays: WQI3.2 = 658, WQI3.3 = 250 i WQI3.12 = 529 (Table 10). WQI determined for sample points on the left and right edges range from 100–200 (Figure 1, Table 10).
The WQI analysis provided by Imneisi and Aydin [26] and Iticescu et al. [27] concerned research of seasonal changes at the analyzed places. Imneisi and Aydin [26] showed that the WQI index was the worst in January (poor water quality) and the best in September (excellent water quality), and good water quality was found in other months. According to Iticescu et al. [27], the highest WQI index was in summer 2015 (WQI above 80), and the lowest in winter 2014 (WQI below 50). Tomczyk et al. [19] emphasized that, in the assessment of water quality in a river–reservoir system, the physico-chemical properties are important in assessing the degree of water pollution.

4. Conclusions

The water quality profile showed that TN, NO2-N, and NO3-N decreased after passing through the reservoir, whereas the values of phosphorus compounds (TP and PO4-P) increased. Despite this, the use of PCA and RDA showed that only NO2-N and NO3-N contributed to the observed variability in water quality in the river–reservoir system. Moreover, these analyzes showed that pH and PO4-P did not have the same influence on the water quality in the reservoir as the nitrogen compounds. In addition, the use of RDA indicated that the analyzed points in the river–reservoir system were of significant importance, showing that the values of the NO2-N and NO3-N indicators obtained the highest values at the aTR point, PO4-P at the bTR point, and pH at the TR point.
The investigation also showed that during the summer season in the dry months, high temperatures and alkaline reaction may cause the release of nitrogen and phosphorus compounds from sediment, which indicates an increased concentration of TP, PO4-P, and Norg in the waters at the TR point and TP, PO4-P, and NH4-N concentrations at the bTR point. This finding is important in the analysis of the physico-chemical processes at the catchment scale and could be overlooked in conventional long-term analyses.
The WQI of the analyzed points indicated that the water of the Mała Panew river improved its properties after passing through the reservoir. The Si parameter was used to determine the WQI based on the DO, BOD5, NH4-N, NO3-N, PO4-P, TN, and TP indices.
The main finding is that both parameters (NO2-N and NO3-N) could be responsible for the eutrophication process. It is also evident that the Turawa reservoir reduces the concentration of nitrate nitrogen and nitrite nitrogen compared to the concentration of these compounds flowing into the reservoir.
This study has several practical implications: (1) the short-term sampling period may affect the correlations between the water quality in the inflow, in the reservoir, and in the outflow of the reservoir, and (2) the water quality profile combined with multidimensional PCA and RDA exploration techniques allows more effective monitoring to be implemented and improves the allocation of resources for the needs of water management at the catchment scale.

Author Contributions

Conceptualization, M.W. and Ł.G.; methodology, M.W. and Ł.G.; Software, Ł.G.; validation, M.W. and K.P.; formal analysis, Ł.G. and A.K.; investigation, Ł.G.; resources, M.W. and Ł.G.; data curation, Ł.G. and M.W.; writing—original draft preparation, Ł.G. and M.W.; writing—review and editing, M.W. and K.P.; visualization, Ł.G.; supervision, M.W., K.P. and A.K.; project administration, M.W.; funding acquisition, M.W. and K.P. All authors have read and agreed to the published version of the manuscript.

Funding

This research was funded by The National Centre for Research and Development, grant number BIOSTRATEG3/343733/15/NCBR/2018.

Institutional Review Board Statement

Not applicable.

Informed Consent Statement

Not applicable

Data Availability Statement

The data presented in this study are available on request from the corresponding author.

Acknowledgments

The authors would like to express their sincere gratitude to the Institute of Meteorology and Water Management–National Research Institute for the release of the precipitation data. The data of the Institute of Meteorology and Water Management–National Research Institute have been processed.

Conflicts of Interest

The authors declare no conflict of interest.

References

  1. Debels, P.; Figueroa, R.; Urrutia, R.; Barra, R.; Niell, X. Evaluation of water quality in the Chillan River (Central Chile) using physicochemical parameters and a modified water quality index. Environ. Monit. Assess. 2005, 110, 301–322. [Google Scholar] [CrossRef]
  2. Zeinalzadeh, K.; Rezaei, E. Determining spatial and temporal changes of surface water quality using principal component analysis. J. Hydrol. Reg. Stud. 2017, 13, 1–10. [Google Scholar] [CrossRef]
  3. Nazeer, S.; Ali, Z.; Malik, R.N. Water quality assessment of river Soan (Pakistan) and source apportionment of pollution sources through receptor modeling. Arch. Environ. Contam. Toxicol. 2016, 71, 97–112. [Google Scholar] [CrossRef] [PubMed]
  4. Ndungu, J.; Augustijn, D.C.M.; Hulscher, S.J.M.H.; Fulando, B.; Kitaka, N.; Mathooko, J.M. A multivariate analysis of water quality in Lake Naivasha, Kenya. Mar. Freshw. Res. 2014, 66, 177–186. [Google Scholar] [CrossRef]
  5. Ling, T.-Y.; Soo, C.-L.; Liew, J.-J.; Nyanti, L.; Sim, S.-F.; Grinang, J. Application of multivariate statistical analysis in evaluation of surface river water quality of a tropical river. J. Chem. 2017, 2017, 5737452. [Google Scholar] [CrossRef] [Green Version]
  6. Malik, R.N.; Hashmi, M.Z. Multivariate statistical techniques for the evaluation of surface water quality of the Himalayan foothills streams, Pakistan. Appl. Water Sci. 2017, 7, 2817–2830. [Google Scholar] [CrossRef]
  7. Jabbar, F.K.; Grote, K. Statistical assessment of nonpoint source pollution in agricultural watersheds in the Lower Grand River watershed, MO, USA. Environ. Sci. Pollut. Res. 2019, 26, 1487–1506. [Google Scholar] [CrossRef] [PubMed] [Green Version]
  8. Xu, M.; Wang, Z.; Duan, X.; Pan, B. Effects of pollution on macroinvertebrates and water quality bio-assessment. Hydrobiologia 2013, 729, 247–259. [Google Scholar] [CrossRef]
  9. Wang, X.; Tan, X. Macroinvertebrate community in relation to water quality and riparian land use in a substropical mountain stream, China. Environ. Sci. Pollut. Res. 2017, 24, 14682–14689. [Google Scholar] [CrossRef]
  10. Maavara, T.; Parsons, C.T.; Ridenour, C.; Stojanovic, S.; Dürr, H.H.; Powley, H.R.; van Cappellen, P. Global phosphorus retention by river damming. Proc. Natl. Acad. Sci. USA 2015, 112, 15603–15608. [Google Scholar] [CrossRef] [PubMed] [Green Version]
  11. Wang, Y.; Li, K.; Liang, R.; Han, S.; Li, Y. Distribution and release characteristics of phosphorus in a reservoir in Southwest China. Int. J. Environ. Res. Public Health 2019, 16, 303. [Google Scholar] [CrossRef] [PubMed] [Green Version]
  12. Hu, S.D.; Wang, T.X.; Xu, S.G.; Ma, L.X.; Sun, X.G. Seasonal release potential of sediments in reservoirs and its impact on water quality assessment. Int. J. Environ. Res. Public Health 2019, 16, 3303. [Google Scholar] [CrossRef] [Green Version]
  13. Wiatkowski, M. Influence of Słup dam reservoir on flow and quality of water in the Nysa Szalona river. Pol. J. Environ. Stud. 2011, 20, 467–476. [Google Scholar]
  14. Bartoszek, L.; Koszelnik, P.; Zamorska, J.; Gruca-Rokosz, R.; Zdeb, M. A preliminary study into the possibility of δ13C being used as a sensitive indicator of the trophic and hydrobiological status of aquatic ecosystems. J. Ecol. Eng. 2018, 19, 191–198. [Google Scholar] [CrossRef]
  15. Bartoszek, L.; Miąsik, M.; Koszelnik, P. Trophic degradation predispositions and intensity in a high-flow, silted reservoir. PeerJ 2020, 8, 18. [Google Scholar] [CrossRef]
  16. Kanownik, W.; Policht-Latawiec, A.; Fudała, W. Nutrient pollutants in surface water—Assessing trends in drinking water resource quality for a regional city in Central Europe. Sustainability 2019, 11, 1988. [Google Scholar] [CrossRef] [Green Version]
  17. Ou, Y.; Wang, X.; Wang, L.; Rousseau, A.N. Landscape influences on water quality in riparian buffer zone of drinking water source area, Northern China. Environ. Earth Sci. 2016, 75, 114. [Google Scholar] [CrossRef]
  18. Topa, M.C.; Timofti, M.; Burada, A.; Iticescu, C.; Georgescu, L.P. Danube water quality during and after flood near an urban agglomeration. J. Environ. Prot. Ecol. 2015, 16, 1255–1261. [Google Scholar]
  19. Tomczyk, P.; Wiatkowski, M.; Gruss, Ł. Application of macrophytes to the assessment and classification of ecological status above and below the barrage with hydroelectric buildings. Water 2019, 11, 1028. [Google Scholar] [CrossRef] [Green Version]
  20. Massoud, M.A. Assessment of water quality along a recreational section of the Damour River in Lebanon using the water quality index. Environ. Monit. Assess. 2012, 184, 4151–4160. [Google Scholar] [CrossRef]
  21. Hong, Z.; Zhao, Q.; Chang, J.; Peng, L.; Wang, S.; Hong, Y.; Liu, G.; Ding, S. Evaluation of water quality and heavy metals in wetlands along the yellow river in henan province. Sustainability 2020, 12, 1300. [Google Scholar] [CrossRef] [Green Version]
  22. Rinke, K.; Kuehn, B.; Bocaniov, S.; Wendt-Potthoff, K.; Buettner, O.; Tittel, J.; Schultze, M.; Herzsprung, P.; Roenicke, H.; Rink, K.; et al. Reservoirs as sentinels of catchments: The rappbode reservoir observatory (Harz Mountains, Germany). Environ. Earth Sci. 2013, 69, 523–536. [Google Scholar] [CrossRef]
  23. Kijowska-Strugała, M.; Wiejaczka, Ł.; Kozłowski, R. Influence of reservoirs on the concentration of nutrients in the water of mountain rivers. Ecol. Chem. Eng. S 2016, 23, 413–424. [Google Scholar] [CrossRef] [Green Version]
  24. Kaurish, F.W.; Younos, T. Developing a standardized water quality index for evaluating surface water quality. J. Am. Water Resour. Assoc. 2007, 3, 533–545. [Google Scholar] [CrossRef]
  25. Qian, Y.; Migliaccio, K.W.; Wan, Y.; Li, Y. Surface water quality evaluation using multivariate methods and a new water quality index in the Indian River Lagoon, Florida. Water Resour. Res. 2007, 43, 199–212. [Google Scholar] [CrossRef] [Green Version]
  26. Imneisi, I.B.; Aydin, M. Water quality index (WQI) for main source of drinking water (Karaçomak Dam) in Kastamonu city, Turkey. Imneisi Aydin J. Environ. Anal. Toxicol. 2016, 6, 1–8. [Google Scholar] [CrossRef]
  27. Iticescu, C.; Georgescu, L.P.; Murariu, G.; Topa, C.; Timofti, M.; Pintilie, V.; Arseni, M. Lower danube water quality quantified through WQI and multivariate analysis. Water 2019, 11, 1305. [Google Scholar] [CrossRef] [Green Version]
  28. Cymes, I.; Glińska-Lewczuk, K. The use of water quality indices (wqi and sar) for multipurpose assessment of water in dam reservoirs. J. Elem. 2016, 21, 1211–1224. [Google Scholar] [CrossRef]
  29. Ortiz-Vera, M.P.; Olchanheski, L.R.; Da Silva, E.G.; De Lima, F.R.; Martinez, L.R.D.P.R.; Sato, M.I.Z.; Jaffe, R.; Alves, R.; Ichiwaki, S.; Padilla, G.; et al. Influence of water quality on diversity and composition of fungal communities in a tropical river. Sci. Rep. 2018, 8, 14799. [Google Scholar] [CrossRef]
  30. Wiatkowski, M.; Czerniawska-Kusza, I. Use of the preliminary Jedlice Reservoir for water protection in the Turawa Reservoir on the Mała Panew River. Oceanol. Hydrobiol. Stud. 2009, 38, 83–91. [Google Scholar] [CrossRef]
  31. Wiatkowski, M.; Rosik-Dulewska, C.; Gruss, Ł. Profile of water quality indicators changes in Stobrawa river. Infrastruct. Ecol. Rural Areas 2012, 3, 21–35. [Google Scholar]
  32. Siepak, M.; Sojka, M. Application of multivariate statistical approach to identify trace elements sources in surface waters: A case study of Kowalskie and Stare Miasto reservoirs, Poland. Environ. Monit. Assess. 2017, 189, 364. [Google Scholar] [CrossRef] [Green Version]
  33. Wiatkowski, M.; Wiatkowska, B. Changes in the flow and quality of water in the dam reservoir of the Mała Panew catchment (South Poland) characterized by multidimensional data analysis. Arch. Environ. Prot. 2019, 45, 26–41. [Google Scholar]
  34. Bo, W.; Wang, X.; Zhang, Q.; Xiao, Y.; Ouyang, Z. Influence of land use and point source pollution on water quality in a developed region: A case study in Shunde, China. Int. J. Environ. Res. Public Health 2018, 15, 51. [Google Scholar] [CrossRef] [PubMed] [Green Version]
  35. Olsen, R.L.; Rick, W.; Chappell, R.W.; Loftis, J.C. Water quality sample collection, data treatment and results presentation for principal components analysis a literature review and Illinois River watershed case study. Water Res. 2012, 46, 3110–3122. [Google Scholar] [CrossRef]
  36. Mazur, R.; Szoszkiewicz, K.; Nowak, A.; Pietruczuk, K.; Christ, J. Ecological classification of artificial reservoirs in polish lowlands according to water framework directive requirements. Pol. J. Environ. Stud. 2017, 26, 205–210. [Google Scholar] [CrossRef]
  37. Kowalczewska-Madura, K.; Dondajewska, R.; Gołdyn, R.; Kozak, A.; Messyasz, B. Internal phosphorus loading from the bottom sediments of a dimictic lake during its sustainable restoration. Water Air Soil Pollut. 2018, 229, 1–18. [Google Scholar] [CrossRef] [Green Version]
  38. Palmer, M.E.; Norman, Y.D.; Paterson, A.M.; Girard, R.E. Water quality changes in south-central Ontario lakes and the role of local factors in regulating lake response to regional stressors. Can. J. Fish. Aquat. Sci. 2011, 68, 1038–1050. [Google Scholar] [CrossRef]
  39. Zhou, Z.; Huang, T.; Gong, W.; Li, Y.; Liu, Y.; Zhou, S. Field research on mixing aeration in a drinking water reservoir: Performance and microbial community structure. Int. J. Environ. Res. Public Health 2019, 16, 4221. [Google Scholar] [CrossRef] [Green Version]
  40. Rajfur, M.; Kłos, A.; Wacławek, M. Algae utilization in assessment of the large Turawa Lake (Poland) pollution with heavy metals. J. Environ. Sci. Health A 2016, 46, 1401–1408. [Google Scholar] [CrossRef] [PubMed]
  41. Latała, A.; Wierzba, S. Biodegradation of bottom sediments of Turawa Lake. Pol. J. Chem. Tech. 2007, 9, 73–77. [Google Scholar] [CrossRef] [Green Version]
  42. Luo, X.; Xiang, X.; Huang, G.; Song, X.; Wang, P.; Fu, K. Bacterial abundance and physicochemical characteristics of water and sediment associated with hydroelectric dam on the lancang river China. Int. J. Environ. Res. Public Health 2019, 16, 2031. [Google Scholar] [CrossRef] [Green Version]
  43. Rodrigues, C.; Cunha, M.Â. Assessment of the microbiological quality of recreational waters: Indicators and methods. EuroMediterr. J. Environ. Integr. 2017, 2, 25. [Google Scholar] [CrossRef] [Green Version]
  44. Łabędzki, L. Agricultural droughts. An outline of problems and methods of monitoring and classification. Woda Sr. Obsz. Wiej. Rozpr. Nauk. Monogr. 2006, 17, 1–107. [Google Scholar]
  45. Regulation of the Minister of Maritime Economy and Inland Navigation dated 11 October 2019 on the Classification of Ecological Status, Ecological Potential and Chemical Status and the Method of Classification of the State of Surface Water Bodies, and Environmental Quality Standards for Priority Substances (Journal of Laws of 2019, Item 2149). 2019. Available online: https://isap.sejm.gov.pl/isap.nsf/DocDetails.xsp?id=WDU20190002149 (accessed on 22 December 2020).
  46. Szarek-Gwiazda, E.; Mazurkiewicz-Boroń, G. Deposition of copper in the eutrophic, submontane Dobczyce dam reservoir (Southern Poland)—Role of speciation. Water Air Soil Pollut. 2002, 140, 203–218. [Google Scholar] [CrossRef]
  47. Wei, G.; Yang, Z.; Cui, B.; Li, B.; Chen, H.; Bai, J.; Dong, S. Impact of dam construction on water quality and water self-purification capacity of the Lancang River, China. Water Resour. Manag. 2009, 23, 1763–1780. [Google Scholar] [CrossRef]
  48. Zhang, Y.; Song, C.; Zhou, Z.; Cao, X.; Zhou, Y. Coupling between nitrification and denitrification as well as its effect on phosphorus release in sediments of Chinese Shallow Lakes. Water 2019, 11, 1809. [Google Scholar] [CrossRef] [Green Version]
  49. Chen, X.; Jiang, H.; Sun, X.; Zhu, Y.; Yang, L. Nitrification and denitrification by algae-attached and free-living microorganisms during a cyanobacterial bloom in Lake Taihu, a shallow Eutrophic Lake in China. Biogeochemistry 2016, 131, 135–146. [Google Scholar] [CrossRef]
  50. Chen, X.; Yang, L.; Xiao, L.; Miao, A.; Xi, B. Nitrogen removal by denitrification during cyanobacterial bloom in Lake Taihu. J. Freshw. Ecol. 2012, 27, 243–258. [Google Scholar] [CrossRef]
  51. Kannel, P.R.; Lee, S.; Lee, Y.S.; Kanel, S.R.; Khan, S.P. Application of water quality indices and dissolved oxygen as indicators for river water classification and urban impact assessment. Environ. Monit. Assess. 2007, 132, 93–110. [Google Scholar] [CrossRef]
  52. Bu, H.; Tan, X.; Li, S.; Zhang, Q. Temporal and spatial variations of water quality in the Jinshui River of the South Qinling Mountains, China. EcoToxicol. Environ. Saf. 2010, 73, 907–913. [Google Scholar] [CrossRef] [PubMed]
  53. Stendera, S.; Johnson, R.K. Multiscale drivers of water chemistry of boreal lakes and streams. Environ Manag. 2006, 38, 760–770. [Google Scholar] [CrossRef] [PubMed] [Green Version]
  54. Yan, C.A.; Zhang, W.; Zhang, Z.; Liu, Y.; Deng, C.; Nie, N. Assessment of water quality and identification of polluted risky regions based on field observations and GIS in the Honghe River Watershed, China. PLoS ONE 2015, 10. [Google Scholar] [CrossRef] [PubMed]
Figure 1. Location of the study area and sampling points, Poland, Central Europe.
Sustainability 13 03457 g001
Figure 2. Principal component analysis (PCA) biplots of water quality indicators for below the Turawa reservoir (bTR), in the reservoir (TR), and above the reservoir (aTR) based on the first two PCs.
Sustainability 13 03457 g002
Figure 3. (a) Redundancy analysis showing the distribution of the investigation parameters in the analyzed points and (b) the values of the tested indicators correlated with the measurement points.
Sustainability 13 03457 g003
Figure 4. Water quality profile of the indicator changes at three analysis points—below the reservoir (bTR), Turawa reservoir (TR), above the reservoir (aTR); period from June 2019 to June 2020.
Sustainability 13 03457 g004
Table 1. Selected parameters of the Turawa reservoir.
PointsParametersUnitsValue
1Normal Pool Elevation in the reservoirm a.s.l. [NN]175.80
2Maximum Pool Elevation in the reservoirm a.s.l. [NN]176.50
3Surface area at Normal Pool Level in the reservoirkm218.29
4Surface area at Maximum Pool Level in the reservoirkm219.41
Source: [33].
Table 2. Monthly value of the sum of precipitation and the standardized precipitation index (SPI) index.
YearMonthsPrecipitation [mm]SPIPeriod
2019617−0.9Dry
2019722−0.6Dry
20198610.5Wet
20199600.4normal
20191029−0.4normal
20191125−0.5Dry
201912450.1normal
2020125−0.5Dry
20202830.9Wet
2020327−0.4normal
202046−1.6very dry
20205650.5Wet
202062192.5extremely wet
Own work based on IMWM-NRI 2020 and [44].
Table 3. Environmental variables used for analyses (principal component and redundancy analyses) and their corresponding abbreviations.
No.ParametersAbbreviationUnitAnalytical MethodsNorm
1Water temperatureTw°CInstrumental-
2Potential of HydrogenpH-Potentiometric methodPN-90/C-04540.01
3Chemical oxygen demandCODMnmg∙dm−3TitrimetricPN ISO 15705:2005
4Biochemical oxygen demandBOD5mg∙dm−35-days incubation, 20 °C PN-EN 1899-1:2002
5Dissolved oxygen DOmg∙dm−3Iodometric methodISO 5813:1983
6Nitrate nitrogen NO3-Nmg∙dm−3SpectrophotometricPN-C-04576-08:1982
7Nitrite nitrogen NO2-Nmg∙dm−3SpectrophotometricPN-EN 26777:1999
8Ammonia nitrogen NH4-Nmg∙dm−3SpectrophotometricPN-ISO 7150:2002
9Organic nitrogen-mg∙dm−3Calculation method-
10Total nitrogenTNmg∙dm−3Calculation method-
11Total phosphorus TPmg∙dm−3SpectrophotometricPN-EN 1189-2000
PN-EN ISO 6878:2006
12PhosphatesPO4-Pmg∙dm−3SpectrophotometricPN-ISO 6878:2006
13Total Suspension SolidsTSSmg∙dm−3Weight methodPN-EN 872:2007
14Dissolved substancesDSSmg∙dm−3Calculation methodPN-C-04616/01
15Concentrations of the:
Zn, Cu, Cr
Zn, Cu, Crmg∙dm−3Atomic absorption spectrometry (AAS)PN-C-04570-02:1992
Table 4. Summary of basic statistic.
SideUnitbTRTRaTRp-Value
Param. MinMaxMeanSDCVMinMaxMeanSDCVMinMaxMeanSDCV
Tw 3.621.611.96.353.13.624.213.57.756.73.423.012.76.954.70.852
pH 6.98.78.00.56.27.58.68.10.34.26.88.37.50.56.60.005 *
DOmg∙dm−34.414.19.62.829.56.913.410.02.222.17.712.89.91.515.50.527
BOD5mg∙dm−32.29.94.02.152.22.941.99.211.5124.71.37.93.52.367.10.492
CODMnmg∙dm−34.614.68.54.148.00.8131.034.748.5139.93.916.77.23.954.40.741
DSSmg∙dm−32203302633212218319263321216034527146170.722
TSSmg∙dm−3578432660181053223322145131305143850.842
Znmg∙dm−30.1970.3610.2730.050180.0000.4220.1760.142810.1420.4650.2860.103360.847
Cumg∙dm−30.0100.0700.0180.0321810.0100.0560.0230.020890.0100.0700.0180.0321811
Crmg∙dm−30.0010.0550.0260.021790.0010.0120.0040.0051240.0010.0640.0250.022880.929
NO3-Nmg∙dm−30.092.790.880.8698.240.062.240.970.7071.730.004.772.591.7266.640.004 *
NO2-Nmg∙dm−30.010.050.020.0157.500.010.040.020.0151.990.010.070.030.0260.460.050 *
NH4-Nmg∙dm−30.020.760.320.2373.970.040.410.170.1271.310.030.590.260.1868.990.503
Organic nitrogenmg∙dm−30.952.771.620.5332.411.265.612.661.5558.110.713.061.340.6649.090.360
TNmg∙dm−31.565.922.801.1440.592.116.603.901.3634.911.638.124.102.1151.560.080
TPmg∙dm−30.292.690.700.6593.740.317.791.312.11160.910.181.400.400.3384.120.290
PO4-Pmg∙dm−30.010.150.060.0465.540.010.070.040.0248.170.010.080.030.0382.050.041 *
Explanations: Mean—mean concentration; SD—standard deviation of all values; CV—coefficient of variation of all values [%]; p-value—results of one-way ANOVA model, *—values with p-value ≤ 0.05.
Table 5. Summary of basic statistics.
SidebTRTRaTR
AxesPC1PC2PC1PC2PC3PC1PC2
Eigenvalue1.82451.26581.50911.07890.87531.47741.197
Proportion Explained0.45610.31650.37730.26970.21880.36940.2992
Cumulative Proportion0.45610.77260.37730.6470.86580.36940.6686
Table 6. Factor loading values of water quality indicators.
SidebTRTRaTR
AxesPC1PC2PC1PC2PC3PC1PC2
pH−1.17230.6211−0.093332.17668−1.48080.30596−1.12906
NO3_N0.93910.70152.20569−0.08932−0.49791.171960.28036
PO4_P0.1823−1.3215−0.98006−1.58276−1.87290.06526−1.05339
NO2_N1.25730.24672.16853−0.53079−0.40371.254750.06824
Table 7. Importance of redundancy analysis (RDA) model components.
DfVarianceCumul. Variance ExplainedFPr (>F)
RDA110.25160.251615.5090.001 *
RDA210.01780.26941.09620.335
Residual2303.7307
Explanations: *—values with p-value ≤ 0.05.
Table 8. Factor loading values of water quality indicators.
AxisRDA1RDA2
pH scores−1.6250.3747
NO3-N scores1.8390.32
PO4-P scores−0.307−1.3015
NO2-N scores1.234−0.3069
Table 9. The water quality index (WQI) in the river–reservoir system.
bTRTRaTR
13919488
Table 10. WQI for sampling points in TR.
No.WQI
3.1153
3.2658
3.3250
3.4172
3.5189
3.6167
3.7253
3.8221
3.9137
3.10137
3.11212
3.12529
3.13158
Publisher’s Note: MDPI stays neutral with regard to jurisdictional claims in published maps and institutional affiliations.

