1. Introduction
In a globalised world with an increasing division of labour, the competition for highly skilled individuals—regardless of their origin—is growing, as is the value of such individuals for national economies. Yet the majority of studies analysing the economic integration of immigrants shows that those who are highly skilled also have substantial hurdles to overcome: their employment rates and salaries are lower and they face a higher education-to-occupation mismatch compared to highly skilled natives.
While the literature on immigrants’ labour-market integration in Sweden has focused on explanations of the differences in employment and income by country of origin or entry route to the country, there is a paucity of studies on the employment patterns of highly skilled immigrants to Sweden. The majority of those that exist are policy papers that analyse the effect of changes in Swedish legislation concerning highly skilled immigration (see, for example, [
1,
2,
3]). As an exception, Osanami Törngren and Holbrow [
4] complement their comparative policy analysis of Sweden and Japan with a qualitative study that analyses the employment experiences of highly skilled labour migrants in the two countries. They conclude that there is a gap in each country’s intention to attract highly skilled migrants which they explain by self-reported difficulties experienced by the interviewees in both Sweden and Japan, such as the slow or stagnant career mobility, language barriers, prejudice and difficulties in social integration.
Furthermore, the international literature on the labour market integration of highly skilled migrants is often focused on economic migrants while less attention has been paid to the experiences of highly educated refugees or family-reunion migrants. To our knowledge, there are no studies that combine both goals of including the skill level and entry route or type of migration when studying the employment situation of international migrants.
This paper aims to fill this gap in the literature by providing an overview of highly skilled immigrants’ labour-market integration and by correlating their employment outcomes to a set of key independent variables, including type of migration, in Sweden. We use register data to describe the labour-market participation—by entry route, place of birth and citizenship—of highly educated men and women. We also look at the quality of their employment, as measured by income and occupational skill level. Immigrants with lower education and natives classified by educational level are included in the analysis as comparison groups. Furthermore, we run a series of regression analyses for the outcome variables employment, income and occupational level of skilled migrants. Among the questions addressed in the paper are: What is the socio-demographic profile of highly skilled migrants to Sweden? Where do they come from and how do they enter the country? Are there differences in highly educated immigrants’ employment rates by citizenship status, migration entry route and place of birth? How do the salaries of highly educated men and women compare between immigrants and natives? What is the education-to-job match for them? How do occupational mobility patterns compare for highly educated immigrants versus those with lower education? Are there differences in occupational skill level for highly educated migrants by entry route? Finally, what are some of the key factors associated to these outcomes and does education pay the same role for immigrants by type of migration? We expect that highly skilled migrants will have better employment outcomes as compared to migrants with lower skills but worse outcomes than highly skilled natives. Moreover, highly skilled labour migrants are expected to have better results than those who moved for other reasons.
Highly skilled immigrants can be defined in different ways. Based on Iredale’s [
5] work, we describe them as those with university education. While Iredale’s definition also includes immigrants with extensive professional experience, due to data limitations, this paper focuses on highly educated immigrants whose professional experience before migration is unknown. Therefore, in this paper, the concepts of ‘highly skilled’ and ‘highly educated’ are used interchangeably.
Most studies on immigrant economic integration are still conducted in line with Becker’s [
6] human capital model but over the most recent decades, social capital propositions, as well as institutional factors like admission status and discrimination, are included in explanatory models of immigrant labour-market integration (see, among others, [
7,
8,
9,
10]). In standard labour-market supply studies, it is hypothesized that the probability of employment, higher earnings and job-match is determined by the level of human capital [
11]. This includes formal education, labour-market experience and skills acquired at work. However, when it comes to migration, education and skills may not be perfectly transferable between countries. These skills could be labour-market information, destination-language proficiency and occupational licences, certifications or credentials, as well as more narrowly defined task-specific skills [
12,
13].
Whereas the effect of formal education on immigrants’ employment, earnings and job-match has been positive, especially if some of this education is obtained in Sweden [
14], differences in formal education do not completely explain the employment, earnings and job-match differential between native and foreign-born workers [
15]. Bevelander [
16] suggests that the ‘type of migration’ of the total immigrant group is an important factor that can explain the native–immigrant employment gap in Sweden.
In fact, it is important to remember that our definition of highly skilled migrants is based on their education level and not on specific skill migration programs that are less common in Europe than they are in other countries like Canada or Australia. Furthermore, most international migrants to Sweden are non-economic migrants, that is, refugees and family reunion migrants, who base their migration decision on a different set of intentions and are therefore less-positively selected for labour-market inclusion [
17,
18]. Problems with skill and credential transferability are often magnified in the case of refugees, who cannot always produce the certificates that proof their educational attainments. These and other factors result in differences in integration between admission categories [
19,
20].
In addition to immigrants’ human capital and their migration path to the receiving country, discrimination in the labour market and social networks are other important factors associated with the labour-market integration of immigrants in Sweden (see [
21,
22,
23]). According to Lemaiître [
22], two-thirds of jobs in the Swedish labour market are filled through informal recruitment methods. He concludes that, even in the absence of discrimination, this kind of recruitment channel favours individuals with a network of local connections, which immigrants could develop over time but perhaps not to the same extent as the native-born. Behtoui [
24] confirms that immigrants are less likely than natives to be able to find jobs through informal methods.
By type of migration, family migrants often have access to kinship networks in the host country to a larger extent than labour migrants and refugees. This can facilitate their access to crucial information regarding the labour market and may initiate investments in human capital prior to arrival that are valued in the host-country labour market. These types of network may also help them overcome barriers in the labour market through job contacts or a better knowledge of processes leading to the recognition of credentials [
9]. However, Behtoui [
24] also finds that jobs obtained through informal methods do not pay as well for immigrants as they do for natives. His results are applicable to immigrants with different educational levels, including the highly skilled.
Regarding the quality of employment and occupational match or mismatch, there is a consensus in the literature that foreign-born individuals are more often overeducated than the native-born [
25,
26,
27]. Dahlstedt [
25] finds that migrants with vocational training are more likely to work in occupations that match their educational level in Sweden than migrants who have a university education. He also reports that the native-born population is over-represented among those who are working on occupations above their educational level. Looking at geographical patterns of education-to-job match among refugees and family reunion migrants in Sweden, Vogiazides et al. [
27] conclude that there is a moderate effect of the regional context for migrants’ probability of finding jobs that correspond to their level of education. They explain that after eight years of residency in Sweden, migrants living in the capital region of Stockholm are the most likely to find a job in line with their qualifications while those living in the less prosperous region of Malmö are the least likely.
Finally, previous studies show that migrants’ (including skilled migrants) earnings largely depend on their education-to-job match or mismatch. Based on an extensive literature review on skilled migrants’ employment in host countries, Shirmohammadi et al. [
28] conclude that skilled migrants’ qualification-matched employment leads to similar or higher earnings than those of natives. They report that these higher earnings have been attributed to skilled migrants’ higher productivity [
29,
30], their representation in highly-paid disciplines [
31], their residence in high-income regions [
27,
32] and more years of schooling than natives [
33]. On the contrary, a mismatch between migrants’ educational and occupational levels has a negative correlation with their job income [
34]. Furthermore, skilled migrants who start working in low-paid jobs cannot catch up with the wages of their counterpart natives [
35] and often feel professionally de-skilled [
36,
37]. In sum, these studies show the importance not only of finding employment for highly skilled migrants but also of finding employment that matches their education in the short and long-term.
2. Materials and Methods
Register data (STATIV) from 2011, provided by Statistics Sweden, were used to provide an overview of highly skilled immigrants to Sweden. STATIV is a longitudinal database for integration studies which contains information on all individuals registered in Sweden and is updated every year. Our sample includes 4,259,707 natives and foreign-born individuals who are between 25 and 60 years old and have been living in Sweden for more than five years (an exception to this rule was made in Tables 3 and 5 and Figures 3 and 5, where we included all immigrants in order to follow their employment rates and upward occupational mobility over time). In order to make the sample of immigrants as comparable as possible to that of natives in terms of language skills, other country-specific human capital and social networks, we decided to exclude immigrants who, in 2011, had been living in Sweden for less than five years [
38]. The foreign-born represent 19% of the sample and the presence of highly educated individuals is the same among the foreign-born and among natives: 40%.
The main characteristics of the highly educated immigrants included in our sample (of working age and with five years or more of residency in Sweden) are as follows: 55% of them are women and the mean age is 42. These numbers are similar to those of highly educated natives, while women’s presence in this group is higher than for immigrants with lower education. About 74% of them are Swedish citizens.
Immigrants have only been classified by entry route or type of migration since 1997. Therefore, our data have a large number of missing values for this variable. Refugees who have been classified as such represent 24% of our sample, family reunion immigrants are the second-largest group with a representation of 19% and labour migrants are a minority group with about 3% of working-age classified immigrants who have been in Sweden for at least five years. Labour migrants (which include non-EU but also EU migrants who moved to Sweden for employment) are over-represented among highly skilled immigrants, whereas refugees are slightly under-represented.
By place of birth, highly educated immigrants from five world regions—the Middle East, EU countries (excluding Denmark, Finland and Sweden), Nordic countries, the rest of Europe and Asia—represent over 80% of all highly skilled immigrants living in Sweden. Immigrants from EU countries have a higher representation among this group than among immigrants with lower education, while the opposite is true for those coming from the rest of Europe.
2.1. Methods
In addition to reporting descriptive statistics, we run a series of logistic and OLS regression analyses on three outcome variables: being employed or not, income and occupational level of skilled migrants. Binomial logistic regression is used to analyse the likelihood of being employed and that of having a highly skilled occupation, while OLS is employed to predict income. We apply these regressions on different samples: first on the entire population of migrant and native individuals aged 25–60, where we include interaction variables by skill level and origin among our independent variables to analyse the correlation between employment outcomes and being a highly skilled migrant. We then run the same regressions on our main group of interest, that is, highly skilled migrants, where we add interaction terms with education and type of migration to compare potential differences in the role of education for labour migrants, family-reunion migrants and refugees. We run all the regressions separately for women and men.
2.2. Variables
Our three outcome variables are defined as follows: “Employed” is a binary variable defined as one if the person was gainfully employed (and this includes the self-employed) the third week of November. “Income” measures the yearly job income before taxes of employed individuals as reported in the tax declaration form. A natural logarithm of this variable is used in the regressions. Finally, “High-skilled occupation” is also a binary variable recoded from the original variable STATIV variable “SSYK4” which indicates the occupation of those who are gainfully employed. This is a national adaption of the International Standard Classification of Occupations (ISCO-88). These occupations are then recoded, based on the ISCO classification of occupations, into a new variable including three different skill levels: low, middle and high. Our outcome variable is equal to one for people who work in highly skilled occupations, that is, managers, professionals, and technicians and associates.
Our independent variables include human capital (education and years since migration), socio-demographic (age, gender, marital status and number of children below 16), migration-related factors (reasons for migration and country or world region of origin) and environmental factors (municipality of residence). For the income analysis, we also control for occupational level.
3. Results
In the next subsection we present the employment rates of highly educated migrants by citizenship, entry route, major origin country and year of migration; whereas
Section 3.2. describes the quality of employment for highly educated immigrants, as explained by income and occupational skill level, in combination with other key variables such as entry route and year of migration; in the last subsection we include and discuss the results of our regression analyses.
3.1. Highly Educated Migrants’ Access to Employment: Who Gets in?
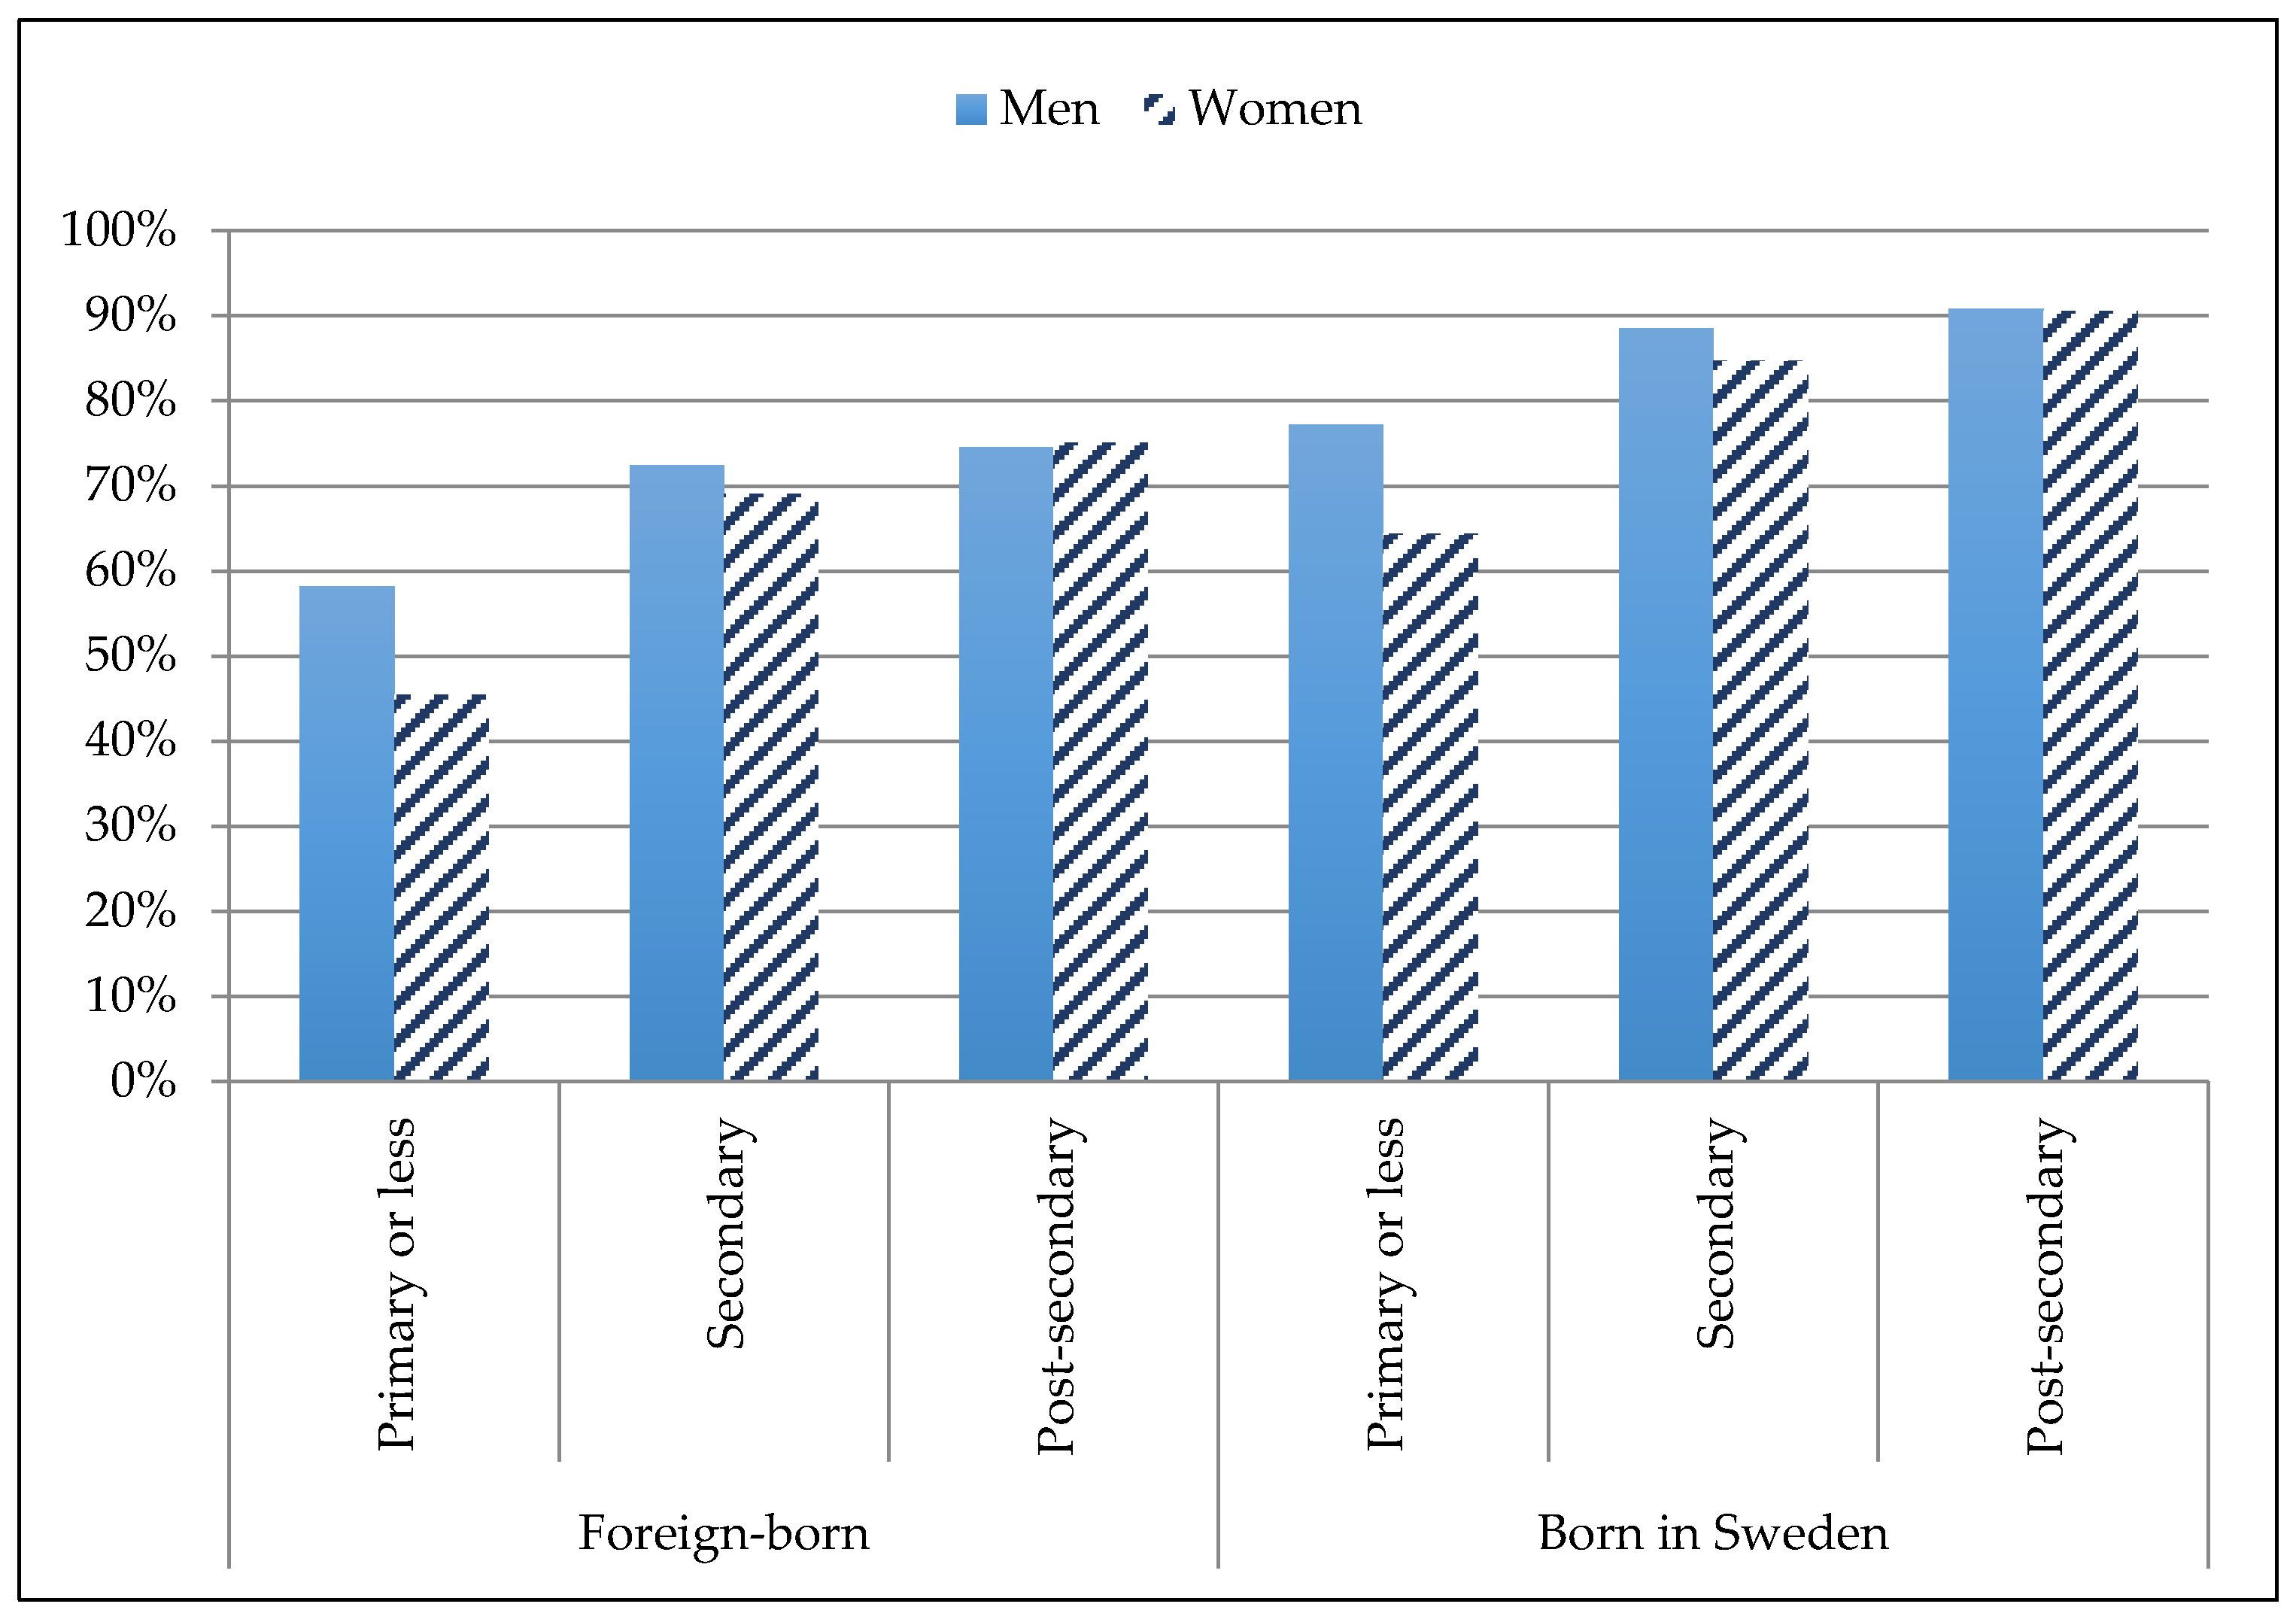
Figure 1 shows the employment rates of immigrants and natives by level of education and in line with the theoretical propositions of human-capital theory: the higher the educational level, the greater the employment rates among both groups of immigrants and natives. However, this proposition only applies if we look at these two groups separately: not only is the relative number of highly educated employed natives higher than that of their immigrant counterparts but the employment rate is also slightly higher among native men with the lowest level of education than among highly educated immigrants. A similar gender gap is visible in
Figure 1 for immigrants and natives, where the gap decreases (and almost disappears) with higher education.
According to the literature (see, for example, [
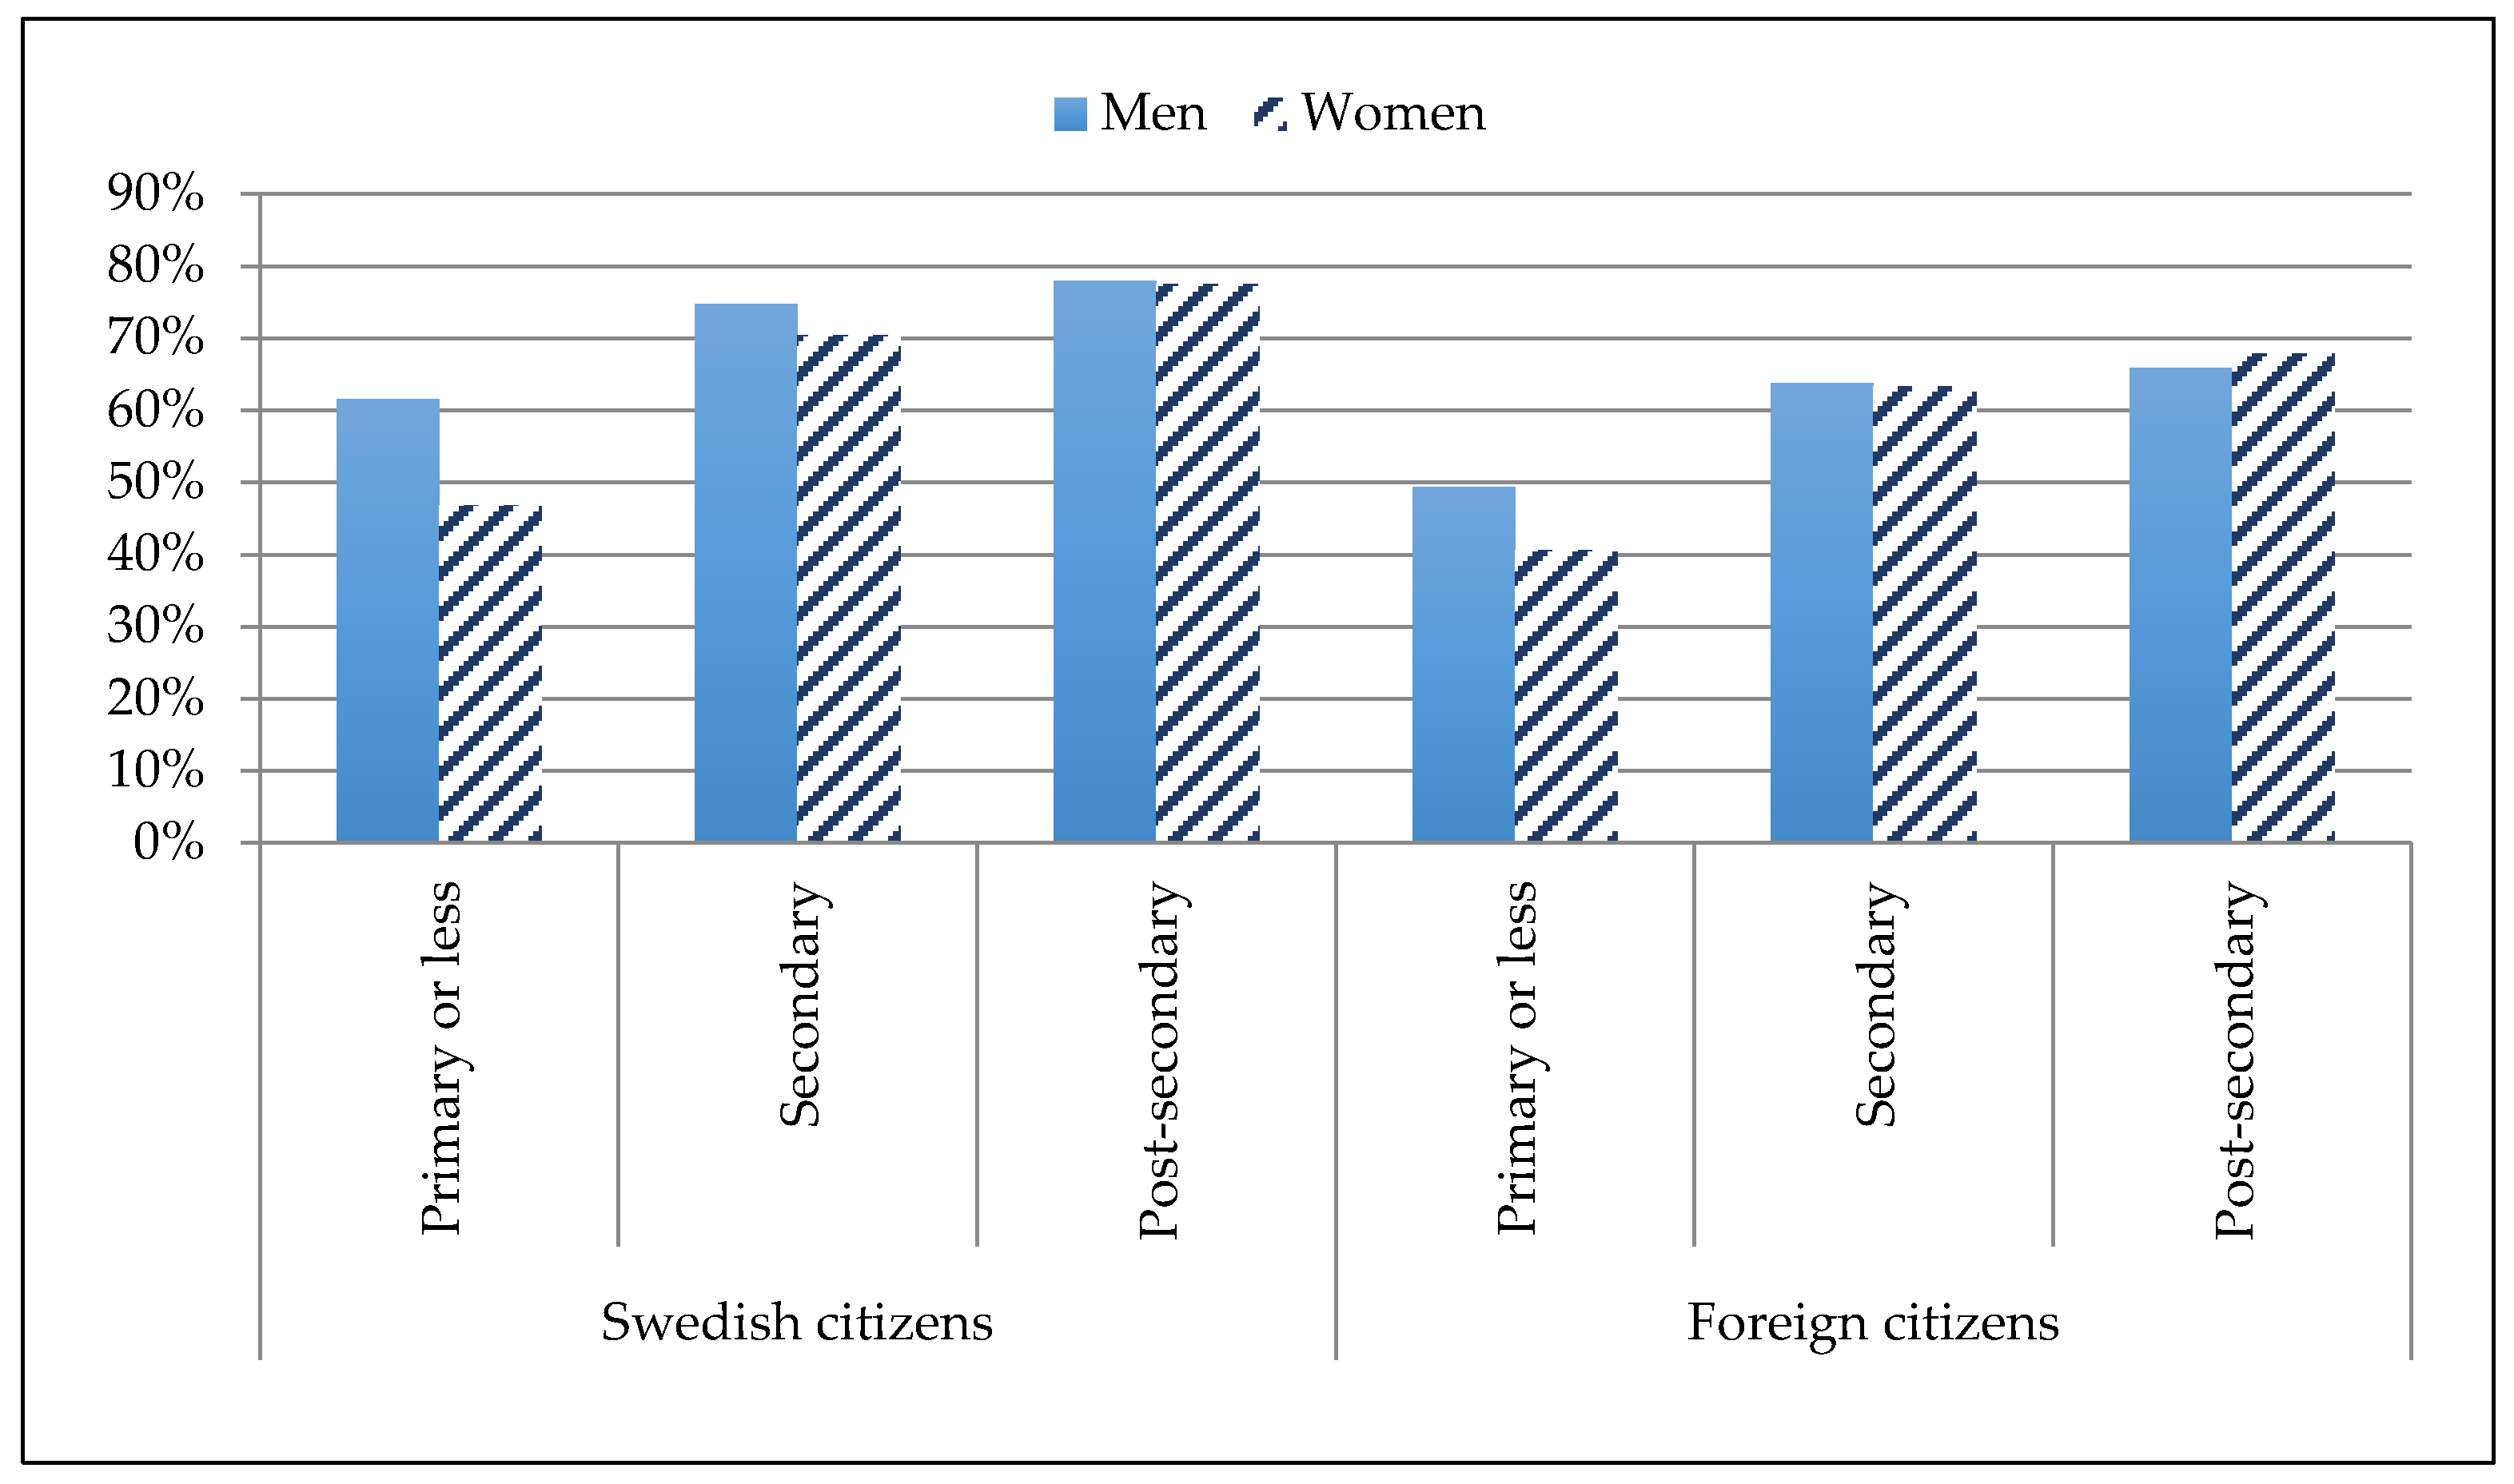
39]), naturalised immigrants have better labour-market outcomes than those with foreign citizenship. Our descriptive statistics on the employment rates of immigrants by education and citizenship, as reported in
Figure 2, confirm these findings for immigrants with all three educational levels. The gap is slightly wider among men, while the gender gap is the greatest for both citizen and non-citizen immigrants with primary education.
Studies on immigrants’ labour-market integration also show that labour migrants have better employment opportunities and outcomes than refugees and family migrants [
9].
Table 1 shows and confirms this pattern. Whereas employment rates are the highest among the highly educated for the three immigrant groups, the employment gap among them is similar for immigrants with secondary and university studies, and higher for immigrants with lower education. The gender gap decreases with higher education for the three groups analysed.
Next, we present the employment rates of highly educated immigrants classified by world region of origin.
Table 2 shows that immigrants from Nordic countries have the highest employment for immigrants with any level of education, which is not surprising considering that they have been in Sweden for longer, they speak similar languages (with the exception of non-Swedish-speaking Finns) and they are phenotypically and culturally more similar to Swedes than immigrants from other regions. The most disadvantaged groups are also the same, regardless of their level of education—namely immigrants from Africa and the Middle East, most of whom enter Sweden as asylum-seekers.
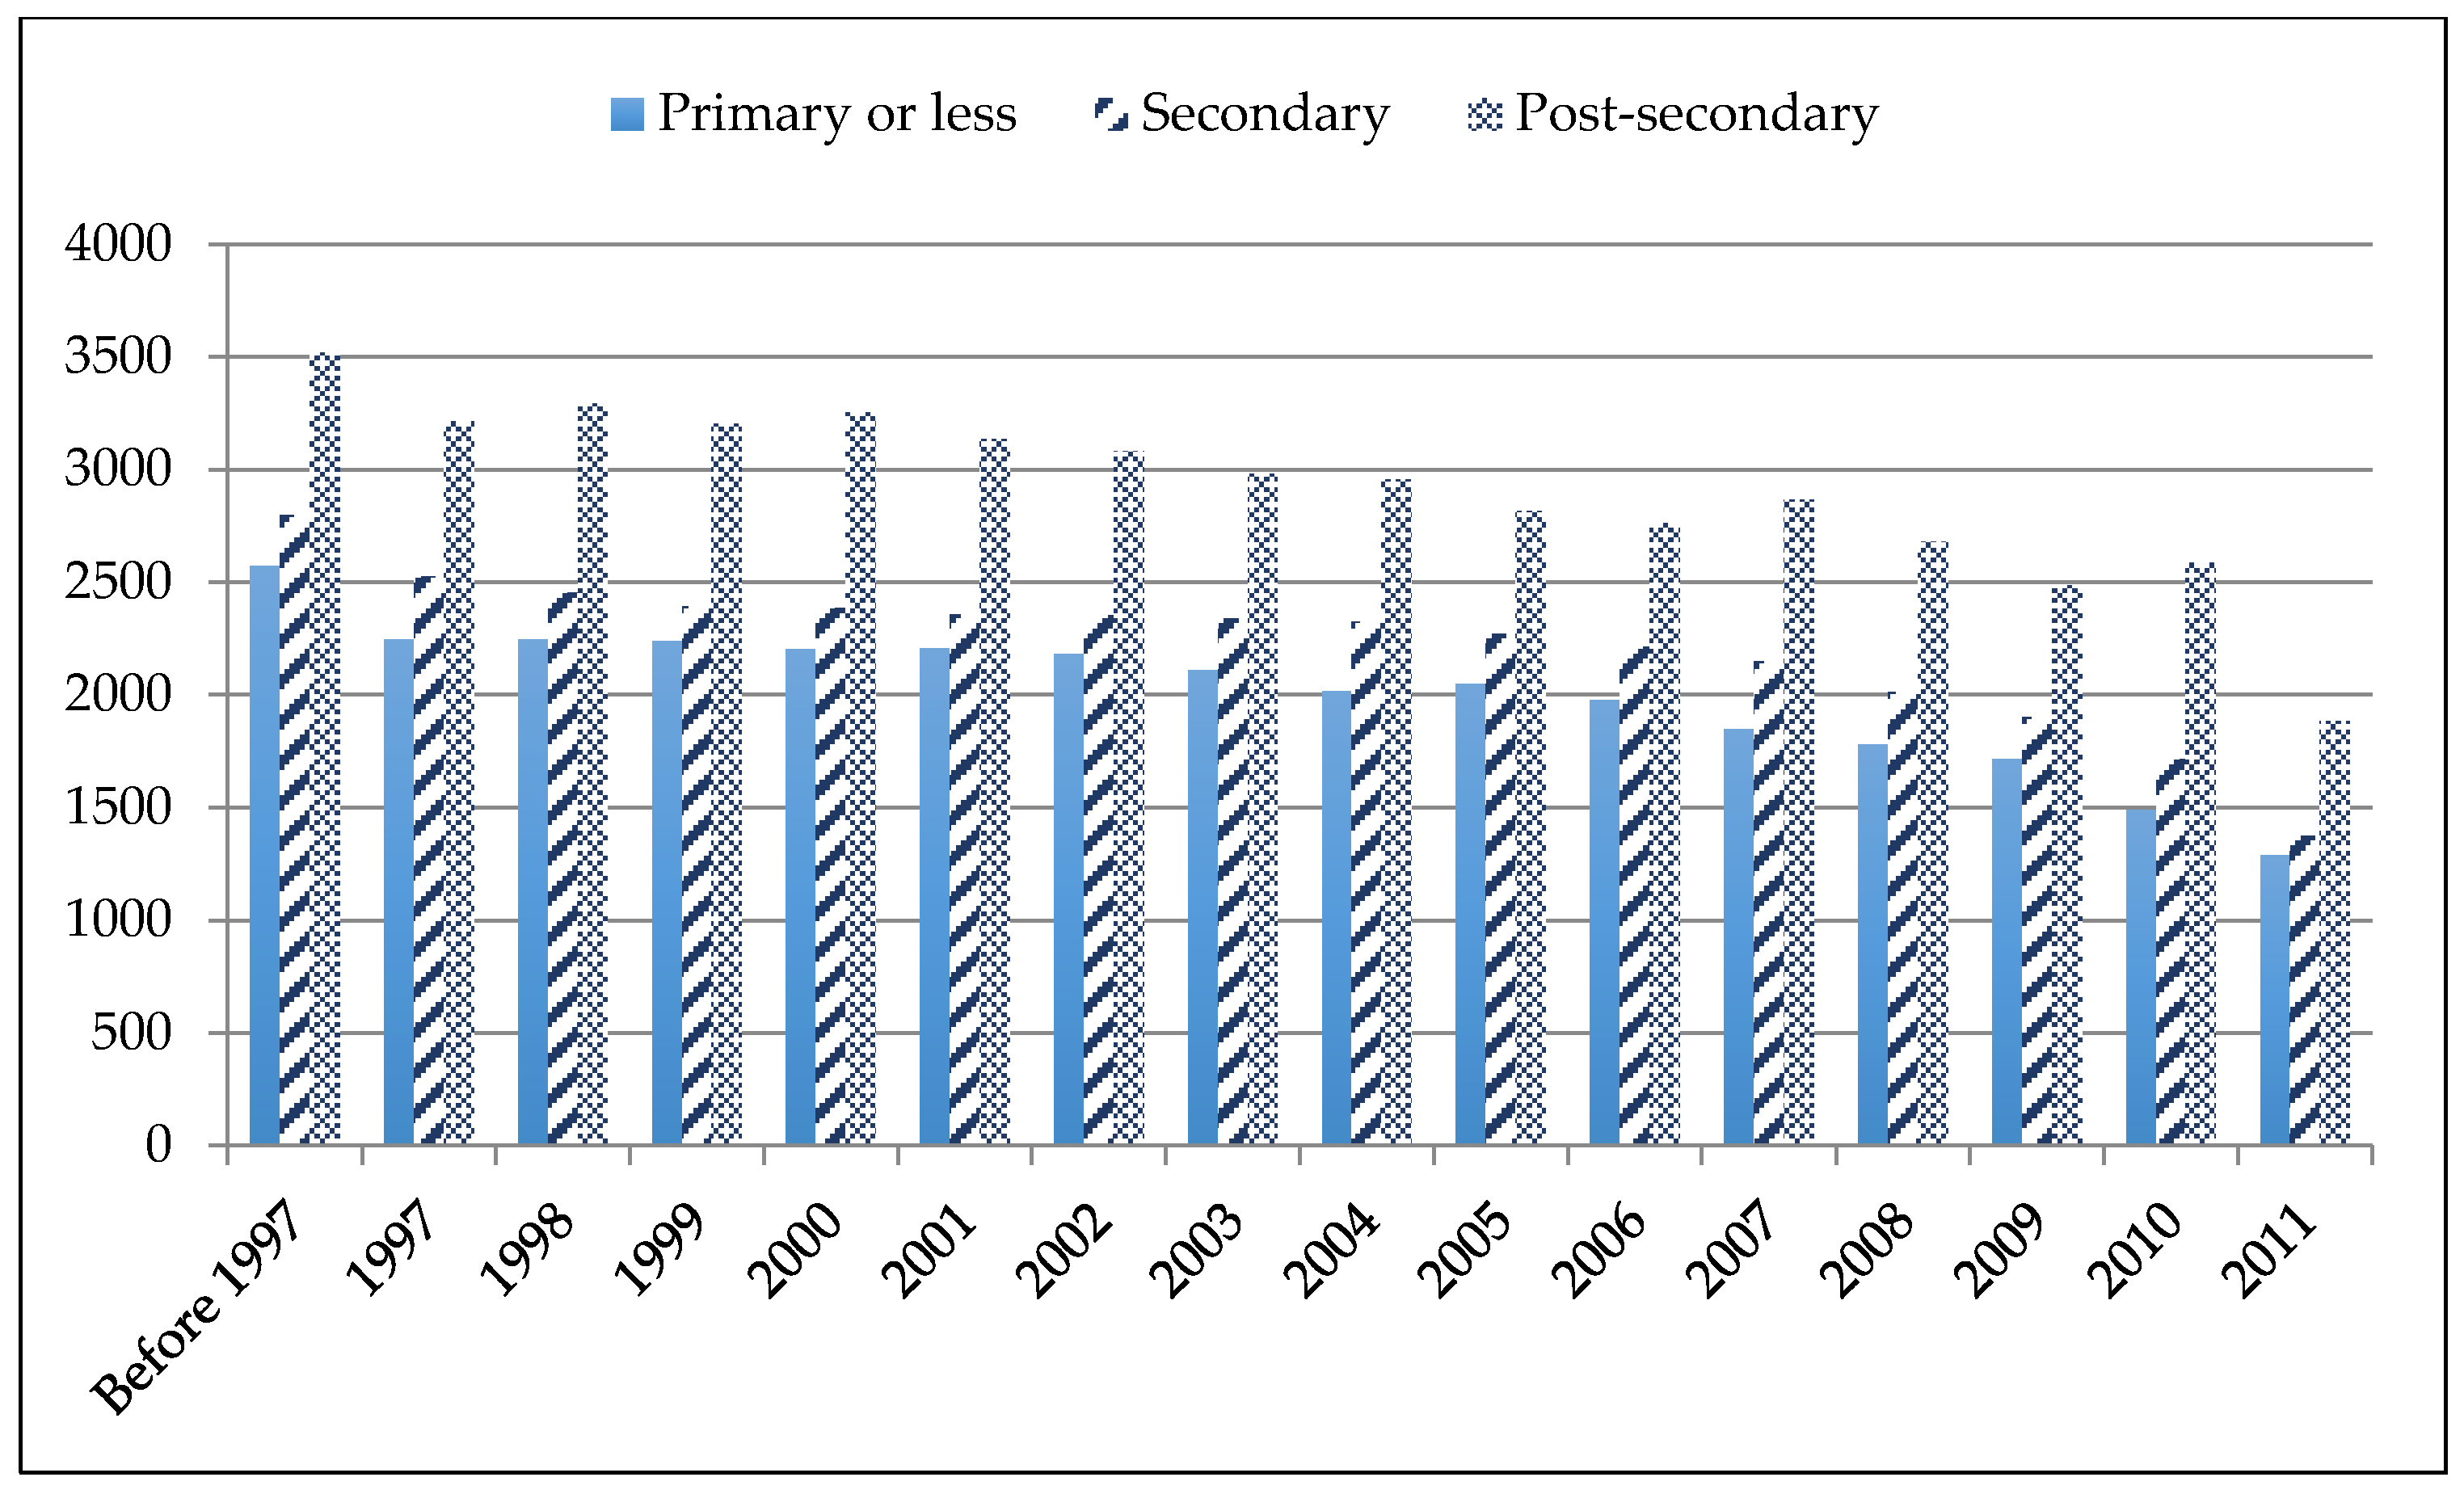
Time of residency in the host country constitutes another key factor in the labour-market integration of immigrants. Some authors only select immigrants who have been living in the host country for five years or more when they look at this subject (see, for example, [
38]). Most immigrants not only need to learn the language of the host country but also lack the other country-specific human and social capital that would facilitate their access to employment.
Table 3 reports the employment rates of immigrants by educational level and year of migration—starting from 1997—in 2011. We decided to include those who had arrived five years prior to the year of analysis because we were able to classify them by year of arrival and, hence, they will not blur the overall picture. This period (2007–2011) is highlighted in
Table 3. As shown in the table, nearly half of the immigrants with secondary and university studies who arrived in 2007 were employed five years later, whereas this number was even lower (about 30%) for those with primary education.
We also highlighted the period 2010–2011 as the time when most asylum immigrants and their reunited spouses would still be participating in introduction programmes in order to learn the language and prepare themselves for entering the Swedish job market. The number of employed immigrants who arrived in 2010 was below 34% for the three groups compared in the table and, again, especially low—at 17%—for those with primary education. It is interesting to see that, in both cases—i.e., for newly arrived immigrants, regardless of their gender—those with secondary schooling show higher employment rates than do the university graduates. One possible explanation for this trend could be that the more-educated immigrants have higher expectations than the former and, therefore, spend more time investing in further training instead of accepting the first job opportunity they could get.
However, if we focus our attention on immigrants with more than five years of residency in Sweden, the overall picture looks different. The employment rates of immigrants with secondary and university education become almost equal after eight years of residency and only become higher among the highly educated after nine years of stay in the country. Immigrants who arrived in Sweden in 1997 present employment rates lower than 76 percent (52% for those with primary education). Whereas the initial gap between men and women almost disappears over time for the highly educated foreign-born and for those with secondary studies, it remains higher than 10 perceptual points for immigrants with lower education and 14 years of residency in Sweden.
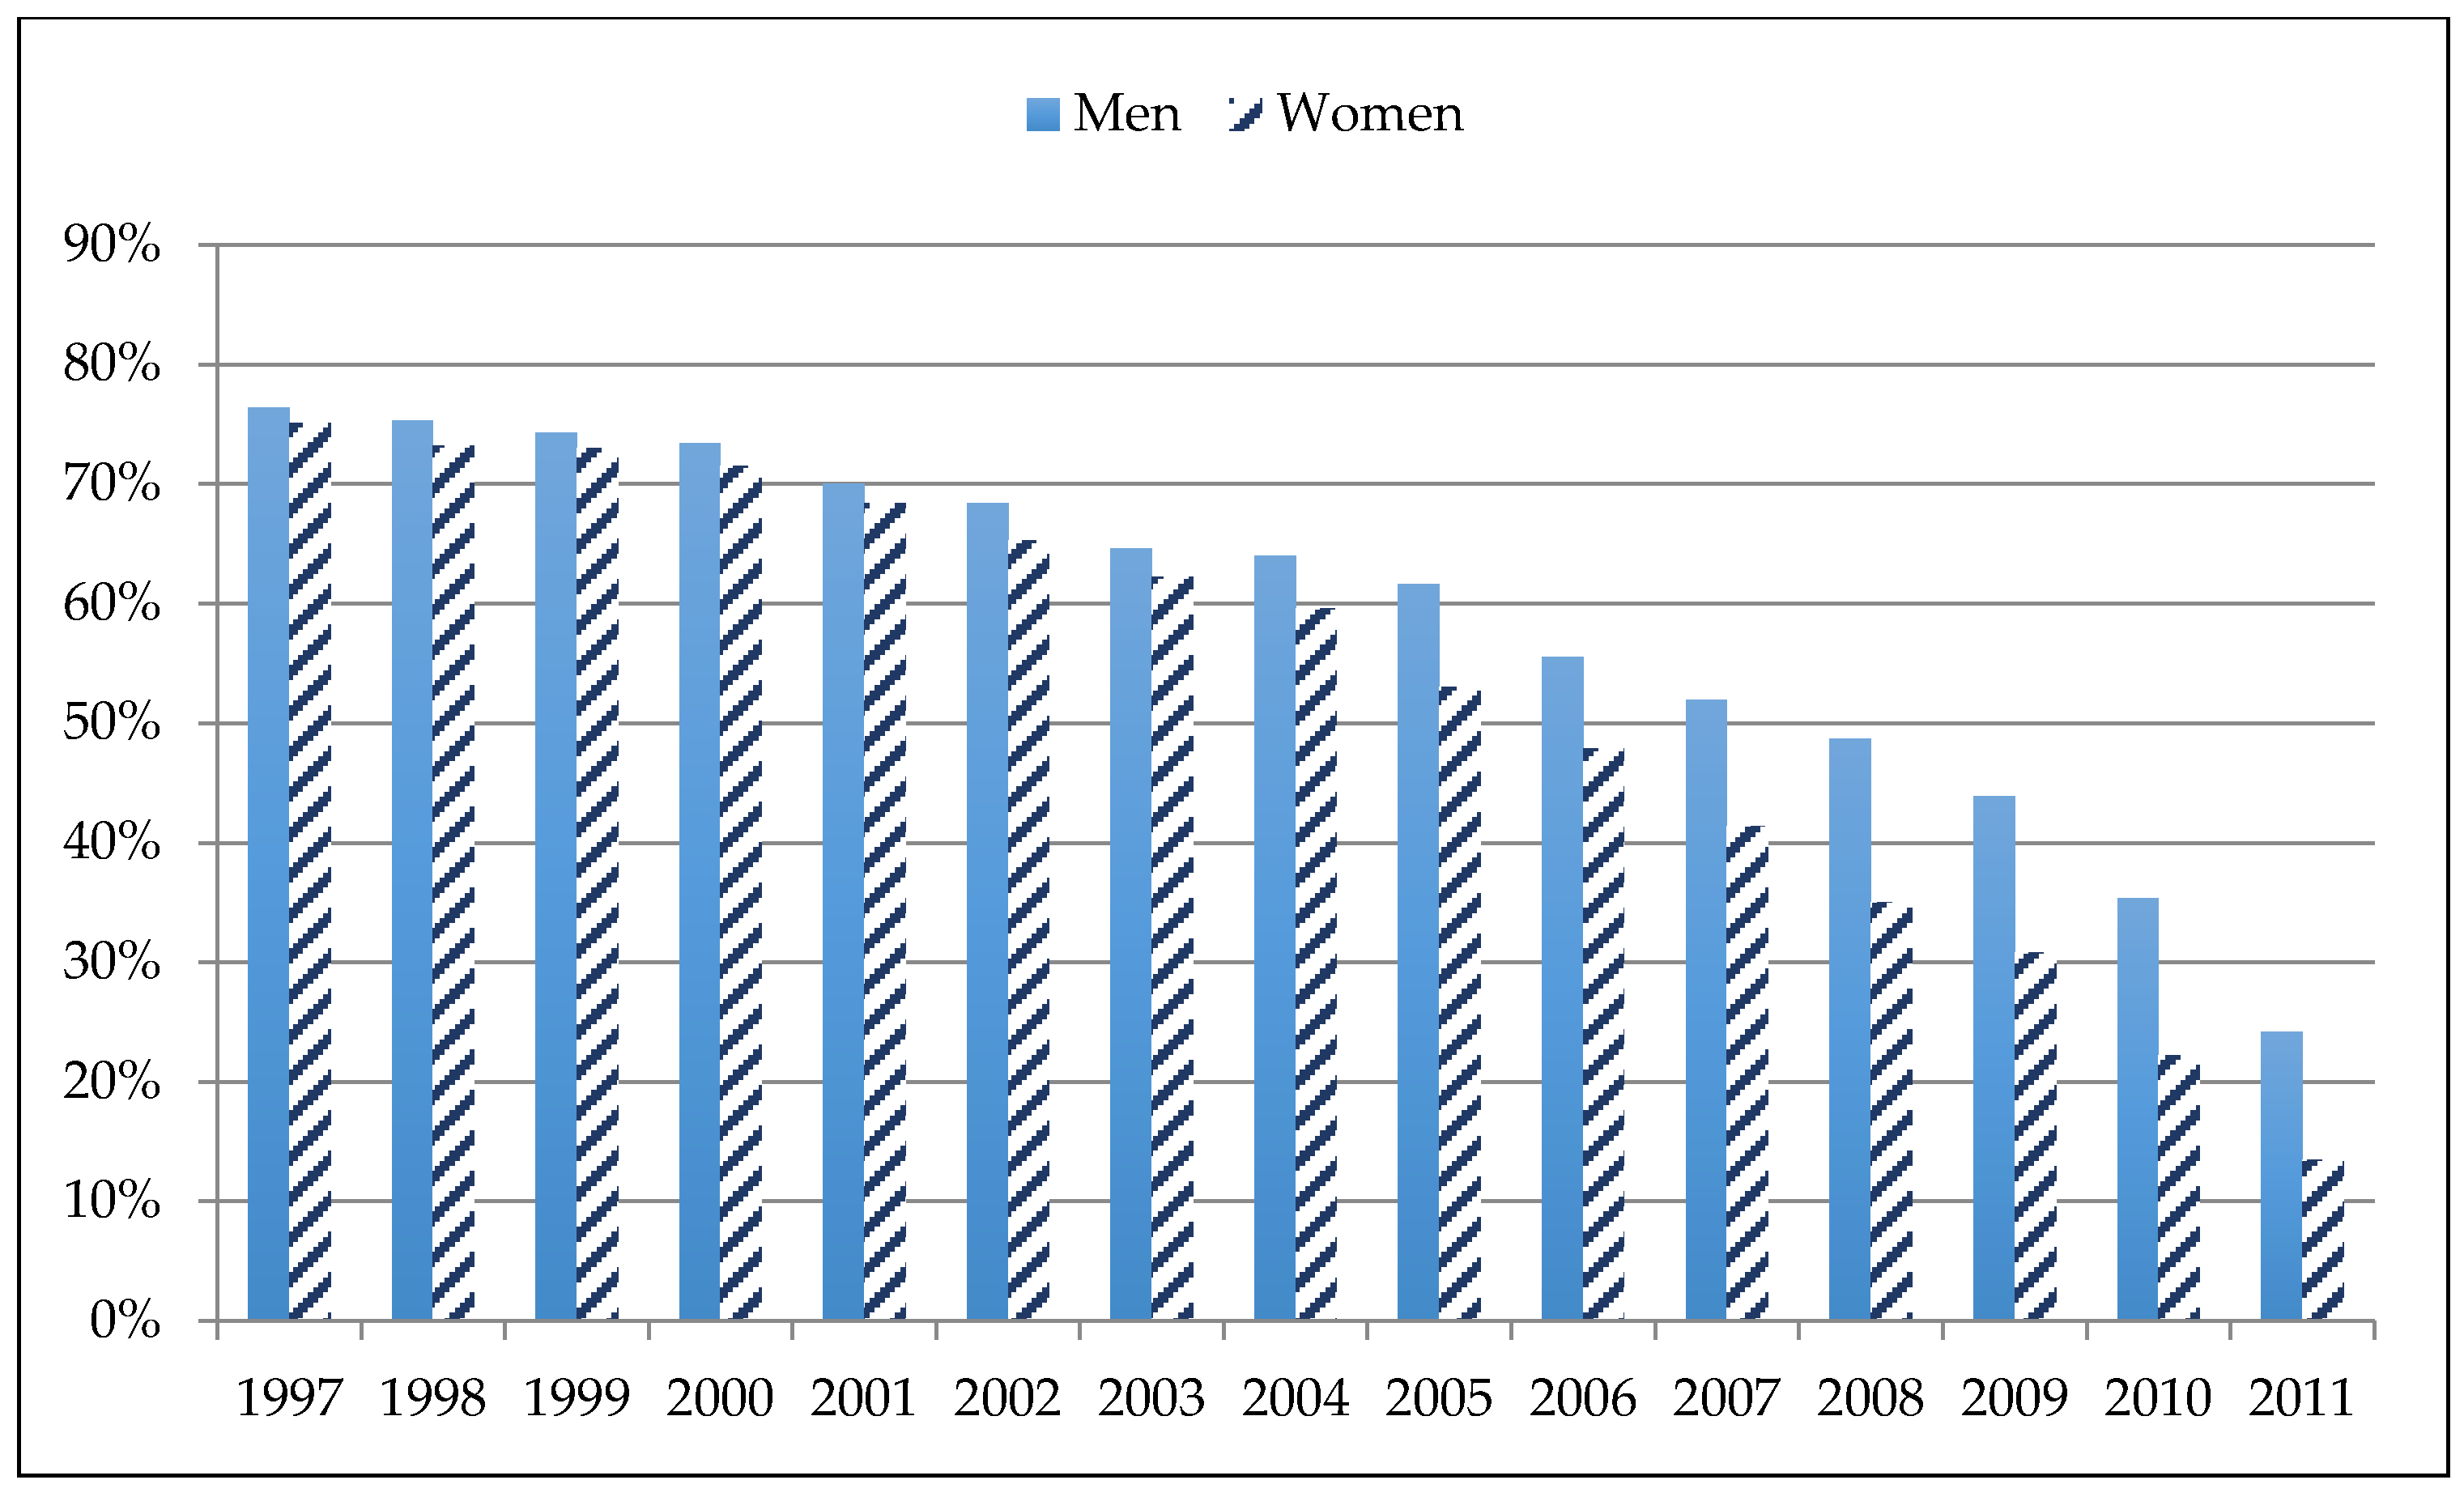
In
Figure 3 we show employment rates by year of migration and gender only for highly educated immigrants. The positive linear correlation between number years in Sweden and employment, as well as the equalising effect of time in the initial employment gap between men over women mentioned above, become clearer in the graph which, furthermore, shows that getting into the Swedish labour market as a newly arrived immigrant is also challenging for the highly educated.
In sum, the employment rates of highly educated immigrants to Sweden are higher than those of immigrants with lower education but lower than those for natives. This is still the case for highly educated immigrants who, in 2011, had been living in Sweden for over 10 years. The number of employed individuals is greater among highly educated Swedish citizens and labour migrants than among their counterparts. The gender gap in employment decreases with higher education and even reverses for university graduates, among whom more women than men are employed in relative terms. Female immigrants from Nordic countries and male immigrants from non-Nordic EU and other European countries show the highest employment rates, whereas African and Middle Eastern immigrants, regardless of gender, have the lowest.
3.2. Highly Skilled Migrants in the Labour Market: How Do They Do?
In this section we present data on the quality of employment of highly educated immigrants as measured by income, occupational skill level and education-to-job match. Based on the International Standard Classification of Occupations (ISCO) we grouped professions in three groups: those for which Skill Level 1 is required were recoded as low-skilled occupations; professions requiring Skill Levels 2 and 3 were classified as middle-skilled, whereas jobs associated with Skill Level 4—including the first group of managers, etc. as defined by ISCO—were defined as highly skilled (for more information on ISCO, see:
http://www.ilo.org/public/english/bureau/stat/isco/press1.htm, accessed on 15 March 2021). The same data is provided for immigrants with lower education and for natives.
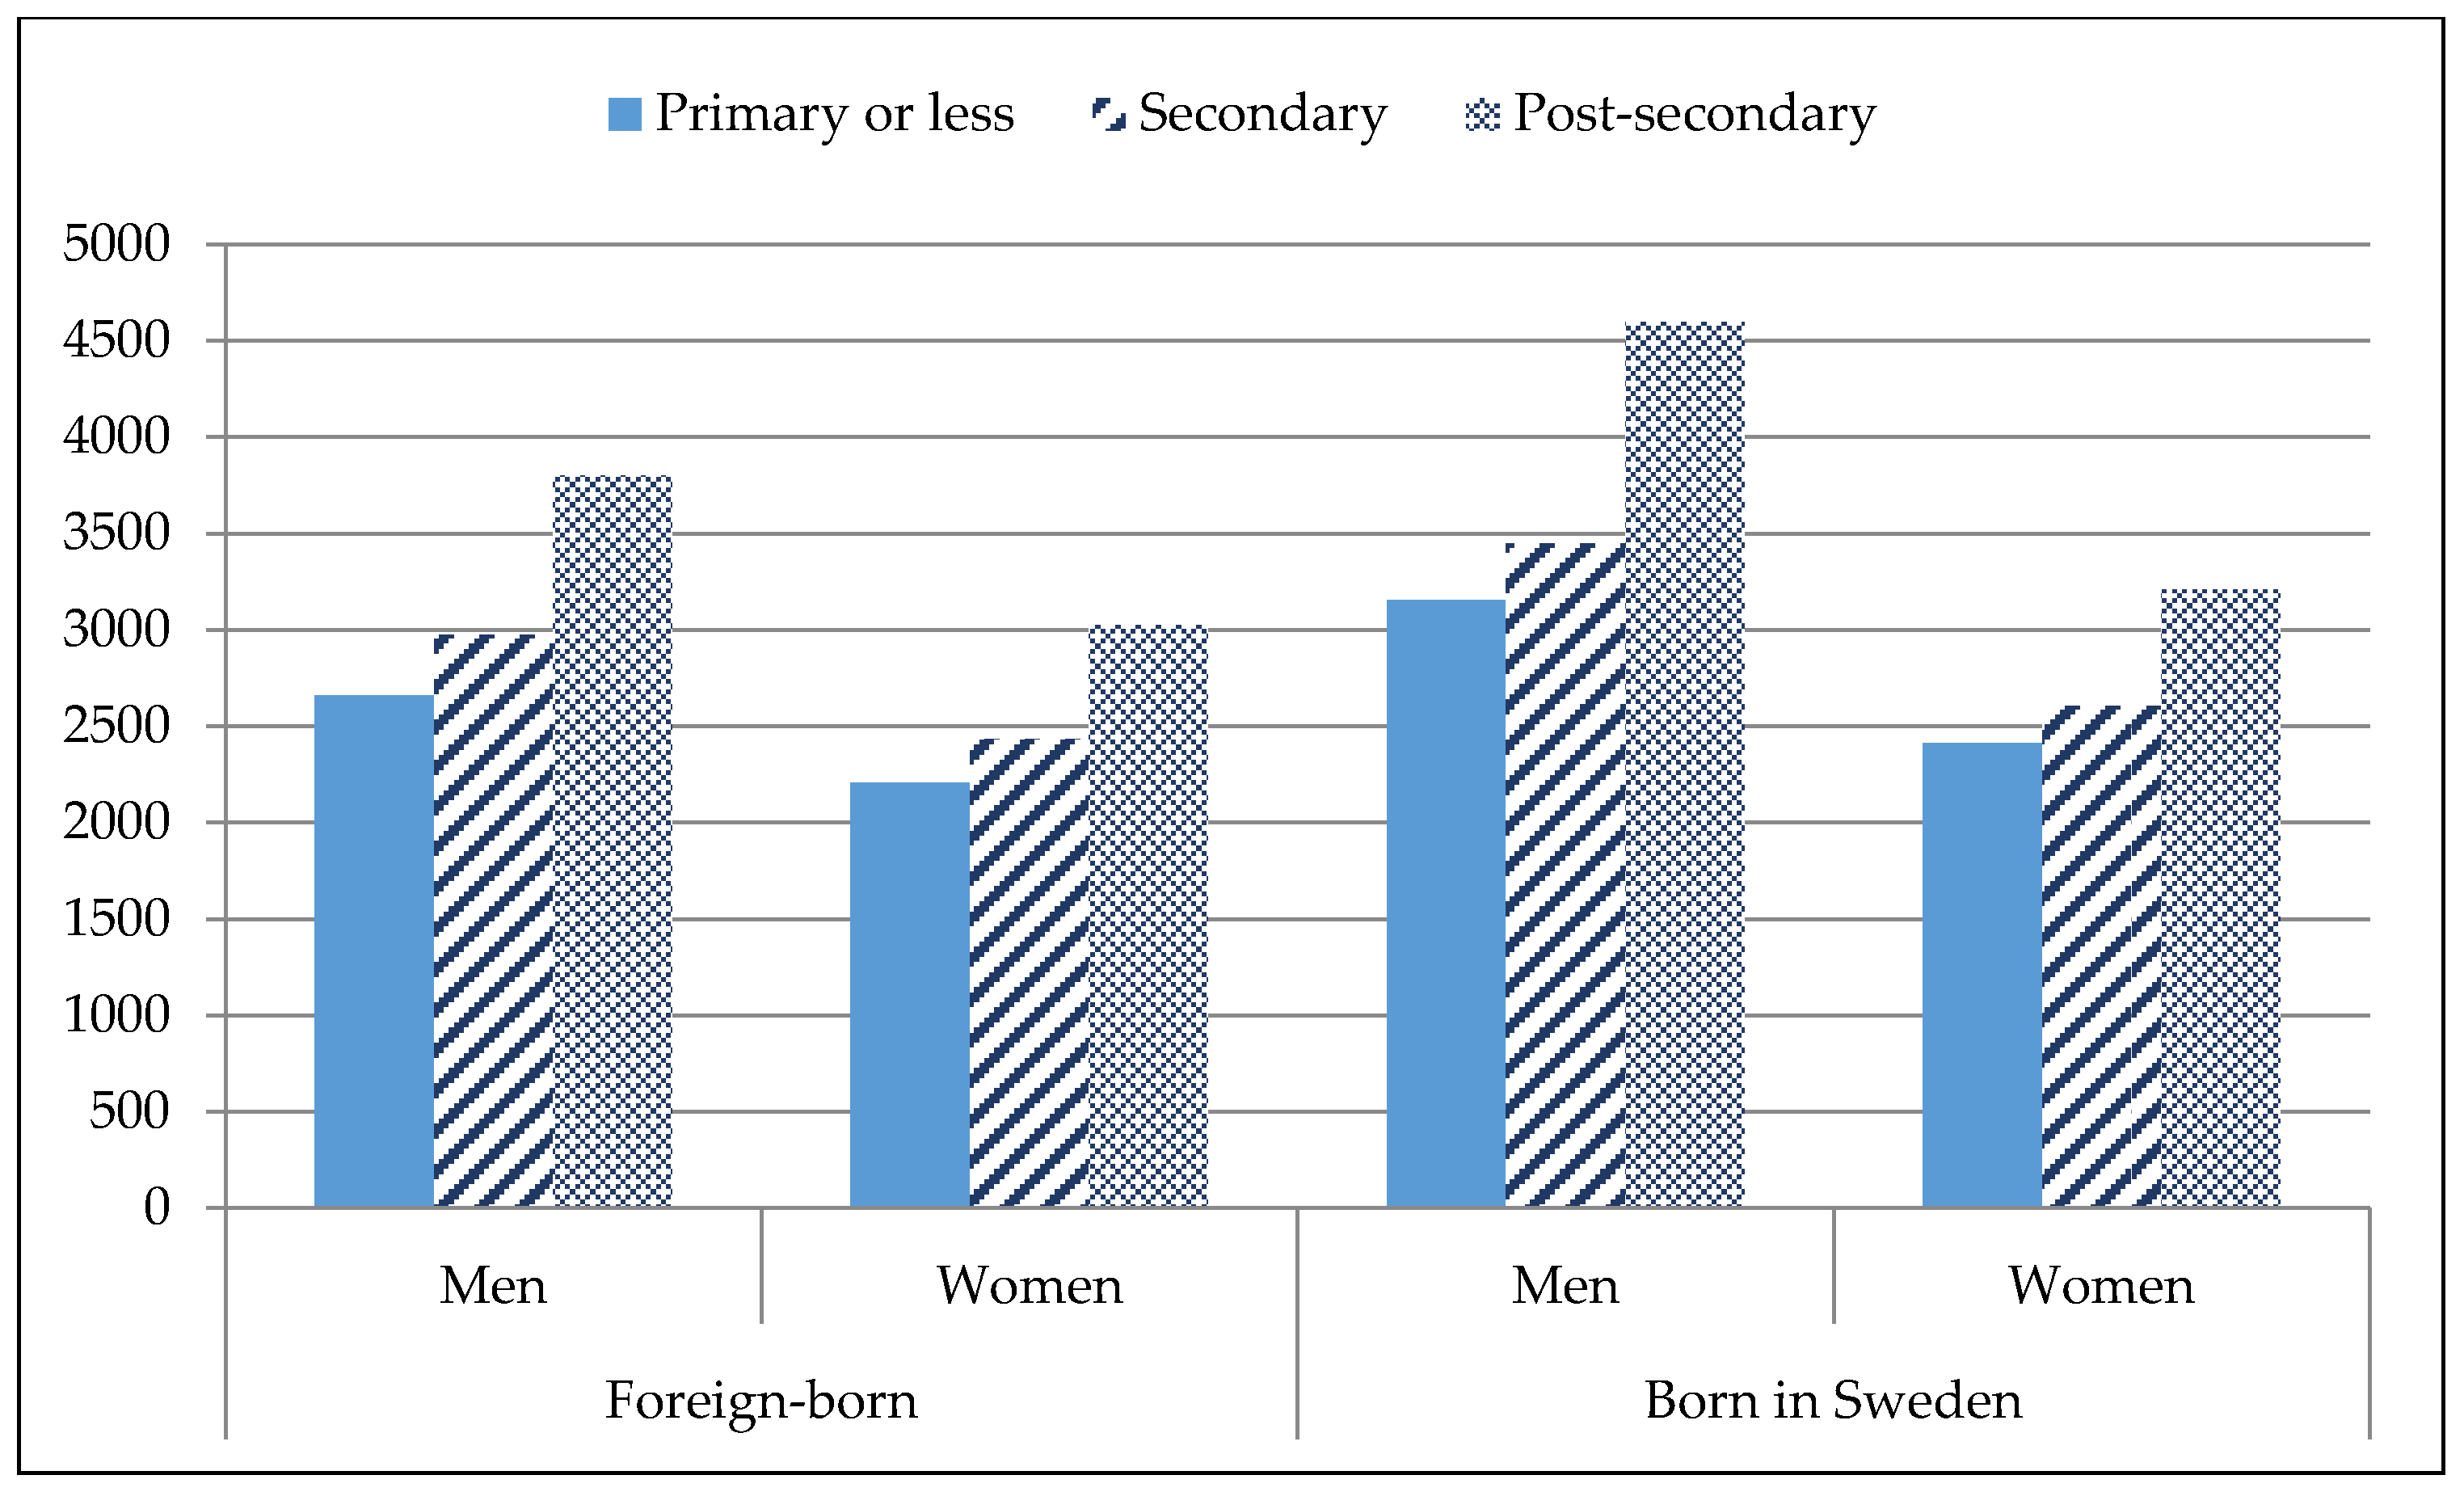
Figure 4 gives the annual job income of employed immigrants with at least five years of residency in Sweden by educational level and gender. As expected, the earnings of the foreign-born, regardless of education or gender, were lower than those of natives. The income gap between highly educated immigrants and natives was similar compared to individuals with primary education but higher than those with secondary education.
Interestingly, the income gap between highly educated men and women is lower among the foreign-born than among the native population. Despite the fact that our data do not register the number of hours worked, we explain this difference—based on our own observation and understanding of the Swedish labour market—by the fact that many native women only work part-time while they have children of young age. This is probably not that common among the foreign-born, who may have a greater need for women to contribute to a lower household income. The same pattern is observable among individuals with lower education. Perhaps, also, for the same reason as that given above, the difference in yearly income between the foreign-born versus natives is higher among men than among women.
We expect that most foreign-born and native employed men work full-time in Sweden and therefore, in the absence of data describing the annual number of hours worked, the comparison between these two groups is more reliable. If we focus our attention on these two groups,
Figure 4 suggests that the returns to education are higher for natives than for immigrants. In order to draw further conclusions about the possible reasons behind this gap, we need to look at internal differences in income among the foreign-born by year of migration (
Figure 5) and the occupational level of highly educated immigrants versus that of natives (
Figure 6).
An overview of immigrants’ earnings by educational level and year of migration is presented in
Table 4, whereas
Figure 5 shows the same information only for highly educated immigrants. The data presented in
Table 4 concerning highly educated immigrants who arrived before 1997 confirm that there is an income gap between natives and the foreign-born who are long-term residents of Sweden. The same pattern is observed for immigrants with lower education. Although the gap is minor in the case of women, the potential difference in the number of hours worked may be the reason behind the similar income levels between foreign-born and native women.
Furthermore, the data also show that the income gap between male immigrants with primary education versus those with university education who moved to Sweden before 1997 is lower than it is for native men. In fact, the income gap by level of education is not higher for long-term foreign-born residents of Sweden, which could be interpreted as a sign that the foreign-born have lower returns on education.
For the same reasons as in
Table 3, where we reported employment rates for the foreign-born by year of migration to Sweden, in
Table 4 we have highlighted two periods (2010–2011 and 2007–2011) representing the job income of newly arrived immigrants in general and those who may be participating in introduction programmes in the first period. Interestingly, the income gap between newly arrived highly educated immigrants who moved to Sweden in 2007 and those who arrived in 2011 is higher than that between those who moved in 2006 and those who did so before 1997, both for men and women. This is also the case for immigrants with lower education, with the exception of women with secondary schooling.
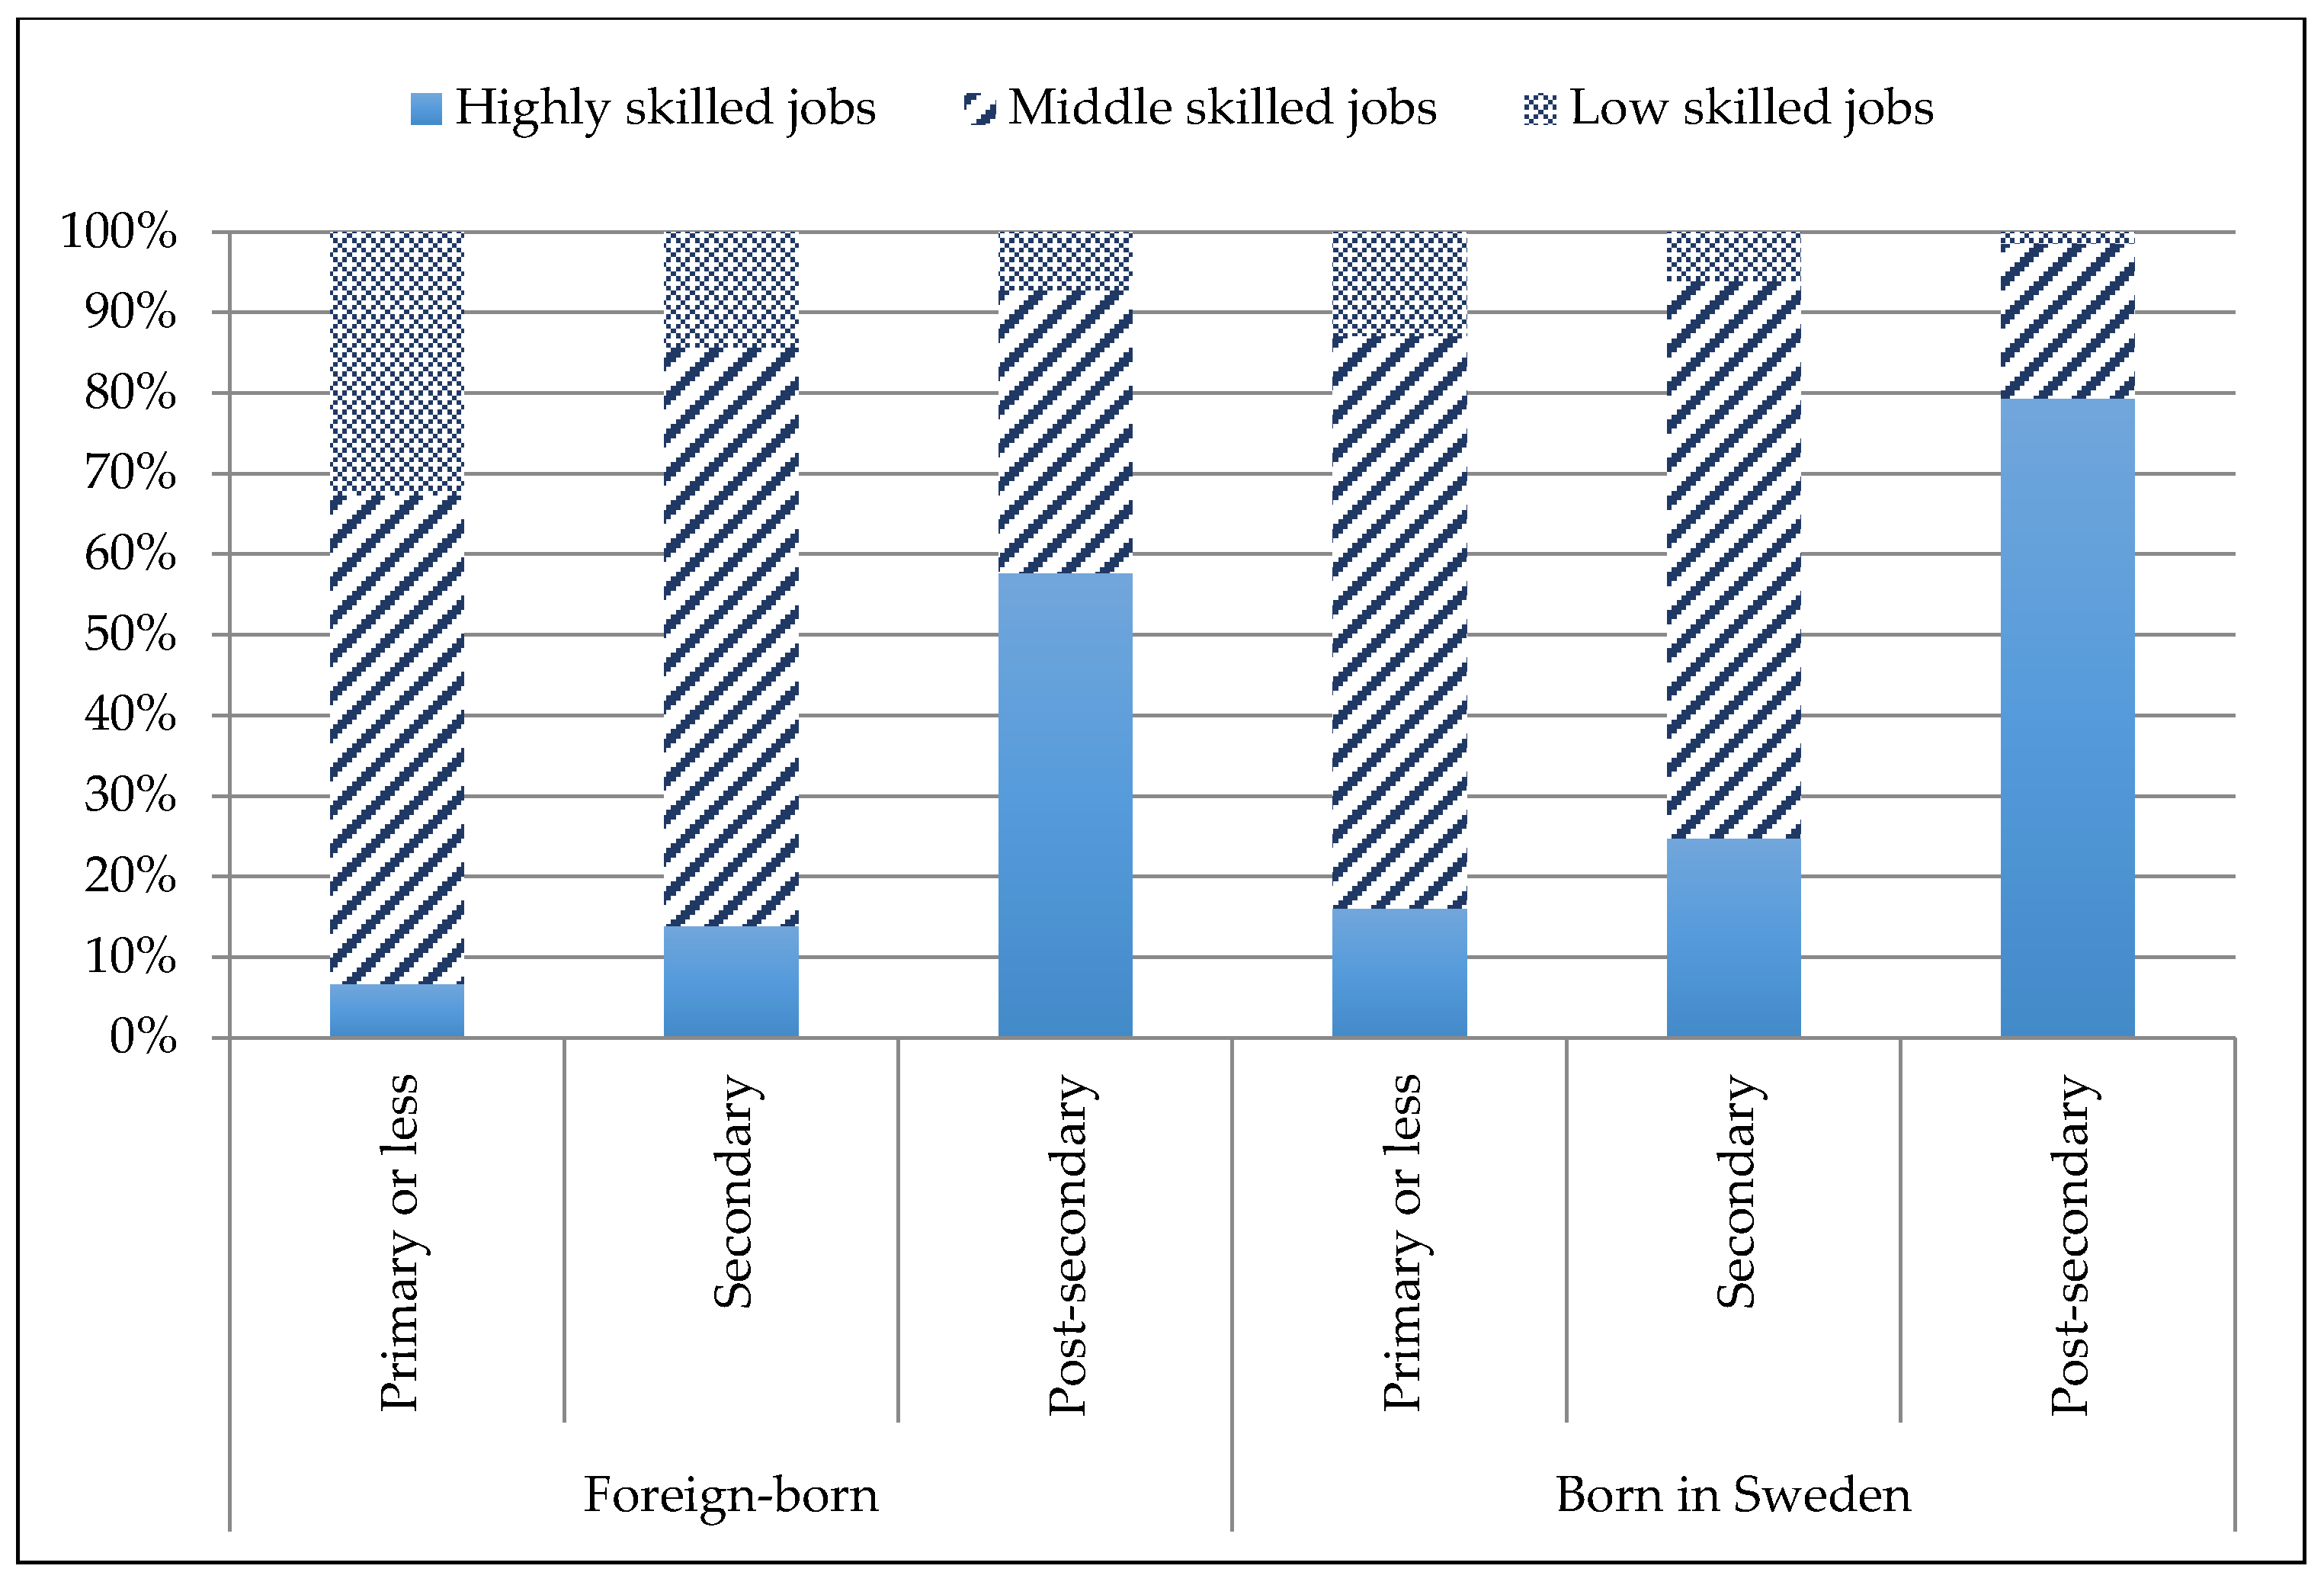
As we indicated in the introduction to this article, the quality of employment can also be described by looking at how a person’s education matches the skill requirements of his or her job. We present these data for immigrant and native men and women in
Table 5. The overall results for immigrants and natives are also represented in
Figure 6.
The most visible graphical differences between the two groups are found at the two extremes of
Figure 6 and can be summarised as follows: the proportion of highly educated individuals working in highly skilled jobs is greater among natives, whereas the number of individuals with primary education working in elementary occupations is higher among immigrants. In general, immigrants’ representation in lower-skilled jobs is higher for all three educational groups, with the opposite being true for natives—i.e., the latter are over-represented in highly skilled jobs in comparison to immigrants.
Furthermore, the relative number of natives with primary education working in highly skilled jobs is higher than the number of immigrants with secondary education working at the same occupational level. Likewise, in relative terms, there are more immigrants with secondary education than there are natives with basic education working in elementary occupations.
The main differences between immigrant men and women are as follows: there are more highly educated women than men working in highly skilled jobs, and more women than men with lower education working in elementary employment, with this difference being greater than the former.
Based on the results reported thus far in this section, we have stated that the return on education may be less for immigrants living and working in Sweden than it is for natives. The usual arguments found in the literature to explain such disparity could also be applied to this study—namely differences in language skills and other country-specific human and social capital between immigrants and natives, and discrimination towards the foreign-born [
7,
8,
10].
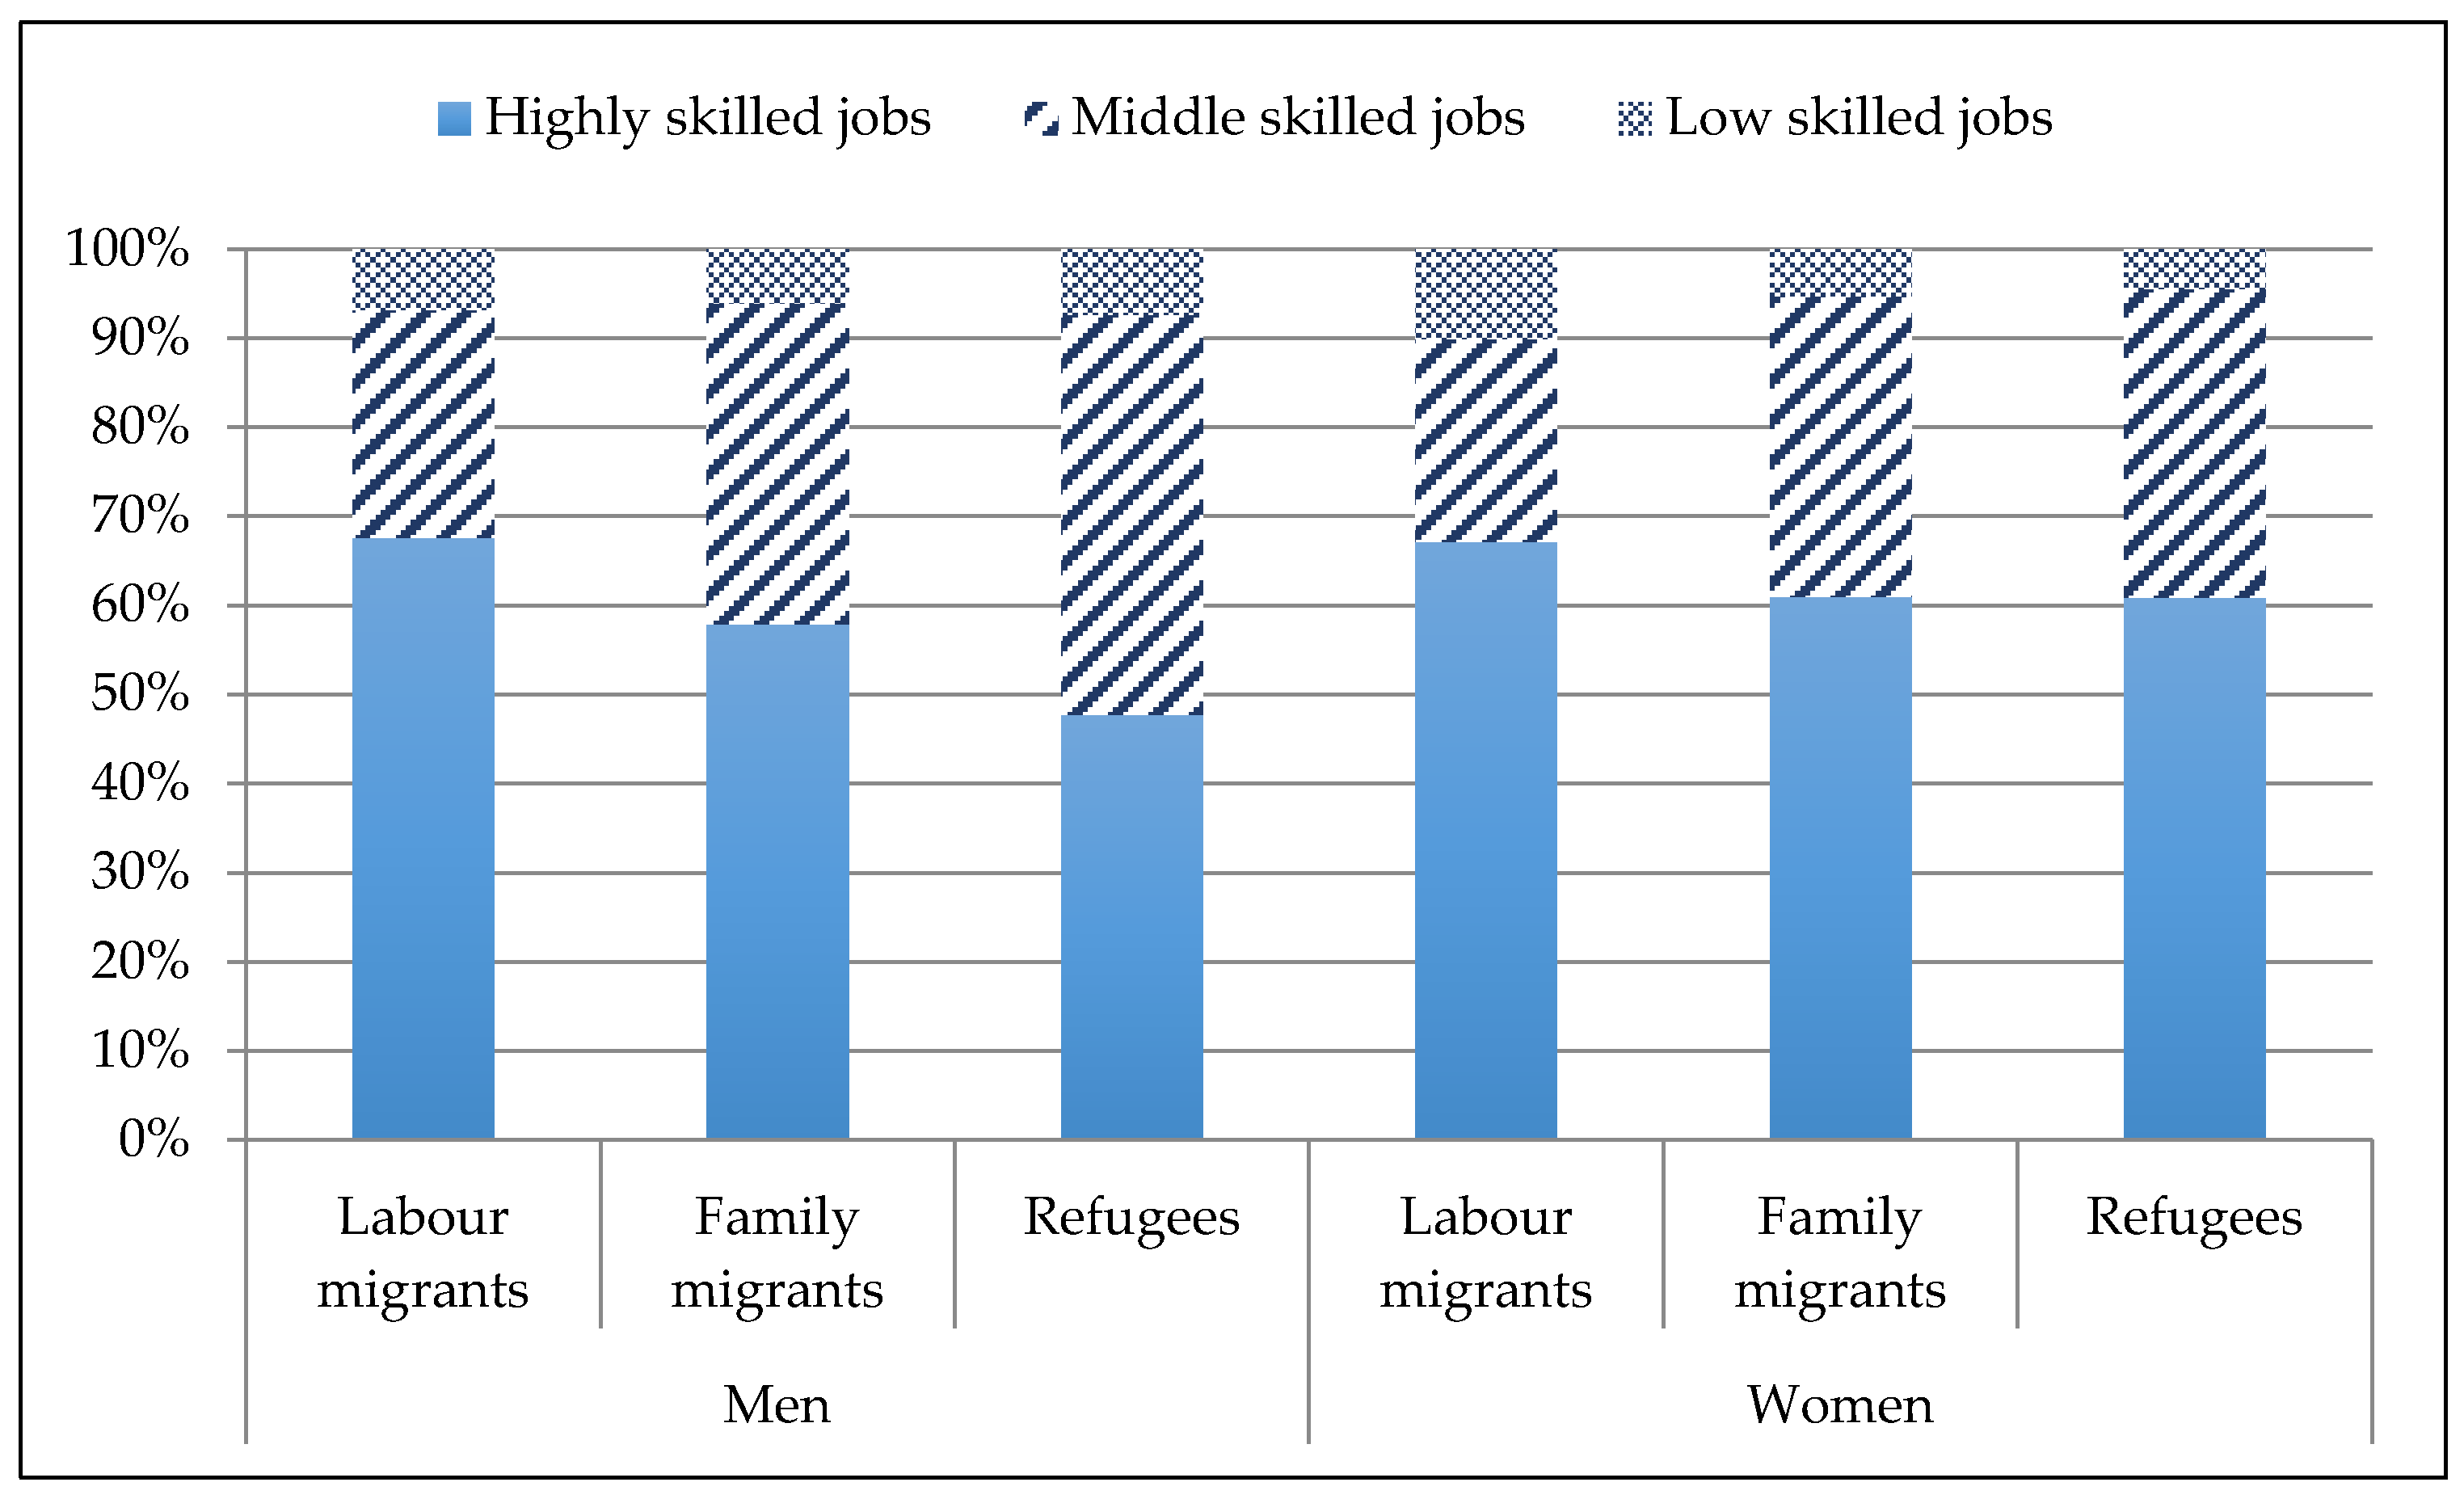
Finally, the reasons for migration, the route of entry into the host country and the consequences of all these also influence the employment opportunities for immigrants [
40]. We conclude our descriptive analysis on the quality of employment of highly educated immigrants by looking at the skill level of their jobs by entry route and gender (see
Figure 7).
As expected, the proportion of people working in highly skilled jobs is greater among labour migrants than among family and asylum migrants, while there are more family and asylum migrants working in middle-skilled jobs than there are labour migrants. It is clear from the graph that the percentage of highly skilled family migrants and refugees working in highly skilled occupations is greater among women than among men. There are also slightly fewer female family migrants and refugees but more labour migrants employed in elementary occupations, compared to men.
3.3. Predictors of Labour Market Outcomes for Highly Skilled Migrants
The results of our regressions analyses confirm that in Sweden women have a lower probability to be employed than men (both in general and in highly skilled occupations) and that are not likely to earn as much as men. These analyses were omitted from the text due to limitations of space but are available from the authors upon request. Previous research also shows that certain factors associated to the employment of highly skilled migrants work differently for women and men [
28]. In order to capture these differences, we run all our models separately by gender.
In order to analyse the correlation between being a highly skilled migrant and our three outcome variables (the probability of being employed and to have a job that matches their education, and income), we run our first set of regressions on the entire population of working age men and women in Sweden.
Table 6 shows that our main variable of interest (being a highly educated migrant) is a statistically significant predictor of the probability of employment and of having a high-skilled occupation. Highly skilled migrants are less likely to be employed and to work in a high-skilled occupation than natives with the same educational level. The low significance of this variable in the income regressions is explained by the fact that we included variables describing occupational skill levels in the same model, which are the main predictors of income in Sweden as in many other countries. Not surprisingly, people who work in middle- and low-skilled jobs do not earn as much as those who work in high-skilled occupations. The correlations between the rest of our control variables and the outcome variables are as expected and do not require further explanation.
Next, we select a subsample comprised of highly skilled labour migrants, family reunion migrants and refugees, and we run similar analyses for them with additional migration-related variables (We selected these three groups for being the main immigrant categories in Sweden and the most comparable among them.). The results of the first regressions that we ran on subsamples comprised of highly educated migrant men and women also show that women have a lower probability to be employed but a higher probability to have a highly skilled occupation than men. Women are not likely to earn as much as men (These analyses were also omitted from the text due to limitations of space but are equally available from the authors upon request.).
Once again, this lead us to run separate analyses for foreign-born highly educated men and women, the results of which are presented in
Table 7. Our primary variables of interest in these models are those describing reasons for migration or migrant category, namely, labour migrants, family reunion migrants and refugees. Being a labour migrant is the strongest predictor of the probability to be employed and to work in a high-skilled occupation. Compare to refugees, labour migrants are above four times more likely to be employed and twice as likely to have a high-skilled occupation.
The results for family reunion migrants, who are a more heterogeneous group, are mixed. The two statistically significant correlations are as follows: women are slightly less likely to be employed than refugee women and men are slightly more likely to have a highly skilled job than refugee men. The group of family reunion migrants in Sweden includes direct family members (spouses and children) of any other migrant category and the native-born population. Women are particularly overrepresented as relatives of refugees and non-EU labour migrants. Among the latter, between 2009 and 2011 over 80 percent of them were women [
41]. While the highly educated reunited spouses of refugees and non-EU labour migrants might share some of the challenges that many migrants experience when looking for a job in Sweden such as the lack of country-specific human capital, limited social-capital and discrimination, relatives of non-EU labour migrants might also choose not to work and live on their husbands’ salaries.
If women are overrepresented as relatives of non-EU labour migrants and refugees, it is the opposite for men. Hence, we can assume that men who moved to Sweden under the family reunion scheme did so to join an EU labour migrant or a Swedish citizen. Unlike the former two groups of family reunion migrant women discussed above, these men – in particular those with Swedish spouses—are more likely to have local networks that would help them understand the Swedish system and facilitate their inclusion in the skilled labour market. This could explain their slightly higher probability for working in high-skill occupations compared to refugees. A more detailed analysis disentangling this group in connection to the type or residency and migration status of their partners is needed to provide a more informed explanation to these findings.
Similarly to the findings presented in
Table 6, the strongest predictors of the job income for highly skilled migrant men and women are their occupational skill levels and therefore, the correlation between the variables describing reasons for migration and the three outcome variables is low (like in the case of labour migrants) or statistically not significant (for family reunion migrants).
As expected, based on Human Capital theory, the number of years of residency in Sweden is positively correlated to the three outcome variables and so are some of the variables describing highly skilled migrants’ country or world region of origin. Women and men who come from EU countries are more likely to be employed than those who come from other regions, with South American men and women, and North American women being the least likely to have a job. At the same time, among those who are employed, North American and Oceanian men and women are the most likely to work in high-skilled jobs among all the groups included in the analyses, while those who come from Asia (plus South America in the case of men and non-EU European countries in the case of women) are the least likely. Finally, correlations between the country of origin and income are very low and only statistically significant for men: coming from the EU increases income while coming from lower income regions such as the Soviet Union, Asia, Africa and South America decreases it.
The correlation between the number of children and income among highly skilled women is statistically significant and negative, as it is for the entire sample of immigrant and native women. In the absence of data on the number of hours worked, it is difficult to make conclusions on the extent to which this can be explained by the fact that more women than men have part-time jobs and how much it is due to other factors.
In line with previous studies conducted in Sweden (see, for example, [
27], living in Stockholm (relative to living in other municipalities) is positively associated to the three outcome variables, while leaving in Malmö and Gothenburg are negatively correlated to the probability of employment and income for highly skilled men and women. Being a rather centralized country, the headquarters of most administrative agencies and private companies are located in Stockholm and the municipalities around it. The income coefficients are very small for the three cities.
Finally, our findings regarding the correlation between education-matched employment and income are also in line with previous studies [
28], with highly skilled men and women who are employed in middle and low-skilled occupations having lower salaries than those working in high-skilled occupations.
4. Discussion
This paper describes the labour-market integration of male and female immigrants in Sweden in 2011. We focus on highly skilled immigrants and compare their labour-market integration to that of highly educated natives and immigrants with lower education. Labour-market integration is measured by three indicators: employment, earnings and education-to-occupation match.
The results of our descriptive analyses show that highly skilled immigrants have higher employment levels, relative earnings and education-to-job match compared to lesser-educated immigrants. However, these outcomes are significantly lower than those for highly educated natives. In fact, native men with low education have higher employment levels than highly educated immigrants. Furthermore, while years of residency in Sweden improve highly educated immigrants’ employment rates and earnings, they never catch up with those of natives. The time elapsed since migration seems to have a more positive effect on highly educated immigrant women than men, as the employment gap found between newly arrived immigrants is almost non-existent between the long-term residents of the country. This could be explained by the fact that more women than men stay at home or work reduced hours when they have small children. As expected, highly educated, naturalised immigrants, labour migrants and those coming from Nordic and other EU countries perform better in the Swedish job market than their counterparts.
Our regression analyses confirm that highly skilled migrants are less likely to be employed and to work in high-skilled occupations than natives with the same educational level. Being a labour migrant is the strongest predictor of the probability to be employed and to work in a high-skilled occupation for highly educated migrants, whereas the main factors associated to job income for both samples (the entire population of working age individuals and highly skilled migrants) is their occupational skill level. As a result, the correlation between variables describing reasons for migration—and other variables that were significant predictors of employment—and the three outcome variables is low or statistically not significant.
While most of our findings are in line with previous studies on immigrants’ and highly skilled immigrants’ labour-market integration, as presented in the literature section, perhaps the most striking results are that (i) immigrants never catch up with natives and, furthermore, (ii) that the employment rates of highly skilled immigrants who have been living in Sweden for 10 years or more are lower than those of less-educated natives. These findings do not support assimilation theory, according to which immigrants’ earnings tend to converge with those of natives as they accumulate country-specific human capital over time (see, for example, [
12]).
The main limitation of this study is the cross-sectional use of register data. As pointed out by Borjas [
42], cross-sectional data are not as suitable as longitudinal data in the study of immigrants’ labour-market integration over time. However, the purpose of this paper was to give an overview—which was missing from the literature—of the labour-market situation of highly skilled immigrants in Sweden, rather than conducting more complex analyses of immigrant integration over time. Longitudinal cohort and qualitative studies are needed to get a deeper understanding and explanation of the role of social capital and discrimination in the Swedish labour market for highly educated immigrants.
The employment situation of highly skilled migrants is often considered to be non-problematic compared to the situation of migrants with lower education. Furthermore, most of the literature on highly skilled migration focuses on labour migrants who move to countries that have skilled migration programs like Canada and Australia. However, these programs are not as common in Europe where highly educated migrants are a less homogeneous group and often face a different reality. In Sweden, refugees and family reunion migrants, who base their migration decision on non-economic reasons and are therefore less-positively selected in the labour market, constitute the majority of international migrants and this is also the case among the highly skilled. Furthermore, along with other additional challenges, refugees and their reunited family members tend to have higher difficulties in credential recognition since they cannot always produce certificates that proof their educational attainments. Our findings confirm that, far from being a homogeneous group, highly skilled migrants have different employment outcomes based on their admission category and country of origin. The heterogeneity within this group should be considered in future studies and policy making.


