
Investigating the Impact of Integration the Saudi Code of Energy Conservation with the Solar PV Systems in Residential Buildings


Abstract
1. Introduction
2. Literature Review
3. Research Methodology
- The investigation was carried out through the energy analysis process using OpenStudio Software. The prices of equipment and labor are adapted from the current prices in the Saudi market.
- The study was done for the three climate zones in KSA as per SBC-602.
- RETscreen 6.1 software was used to design a PV system.
- The economic feasibility was determined using the life cycle analysis method and the payback time method for both thermal insulation and PV system.
- The environmental impact was evaluated from the energy saved and utilization of green energy for a sustainable building.
- The building was not insulated (existing and relatively old buildings).
- It meets the construction specifications required by the Saudi Electricity Company (SEC) to connect it to the electrical grid.
- It fulfills the thermal insulation conditions in the building code SBC-602.
3.1. Case Study
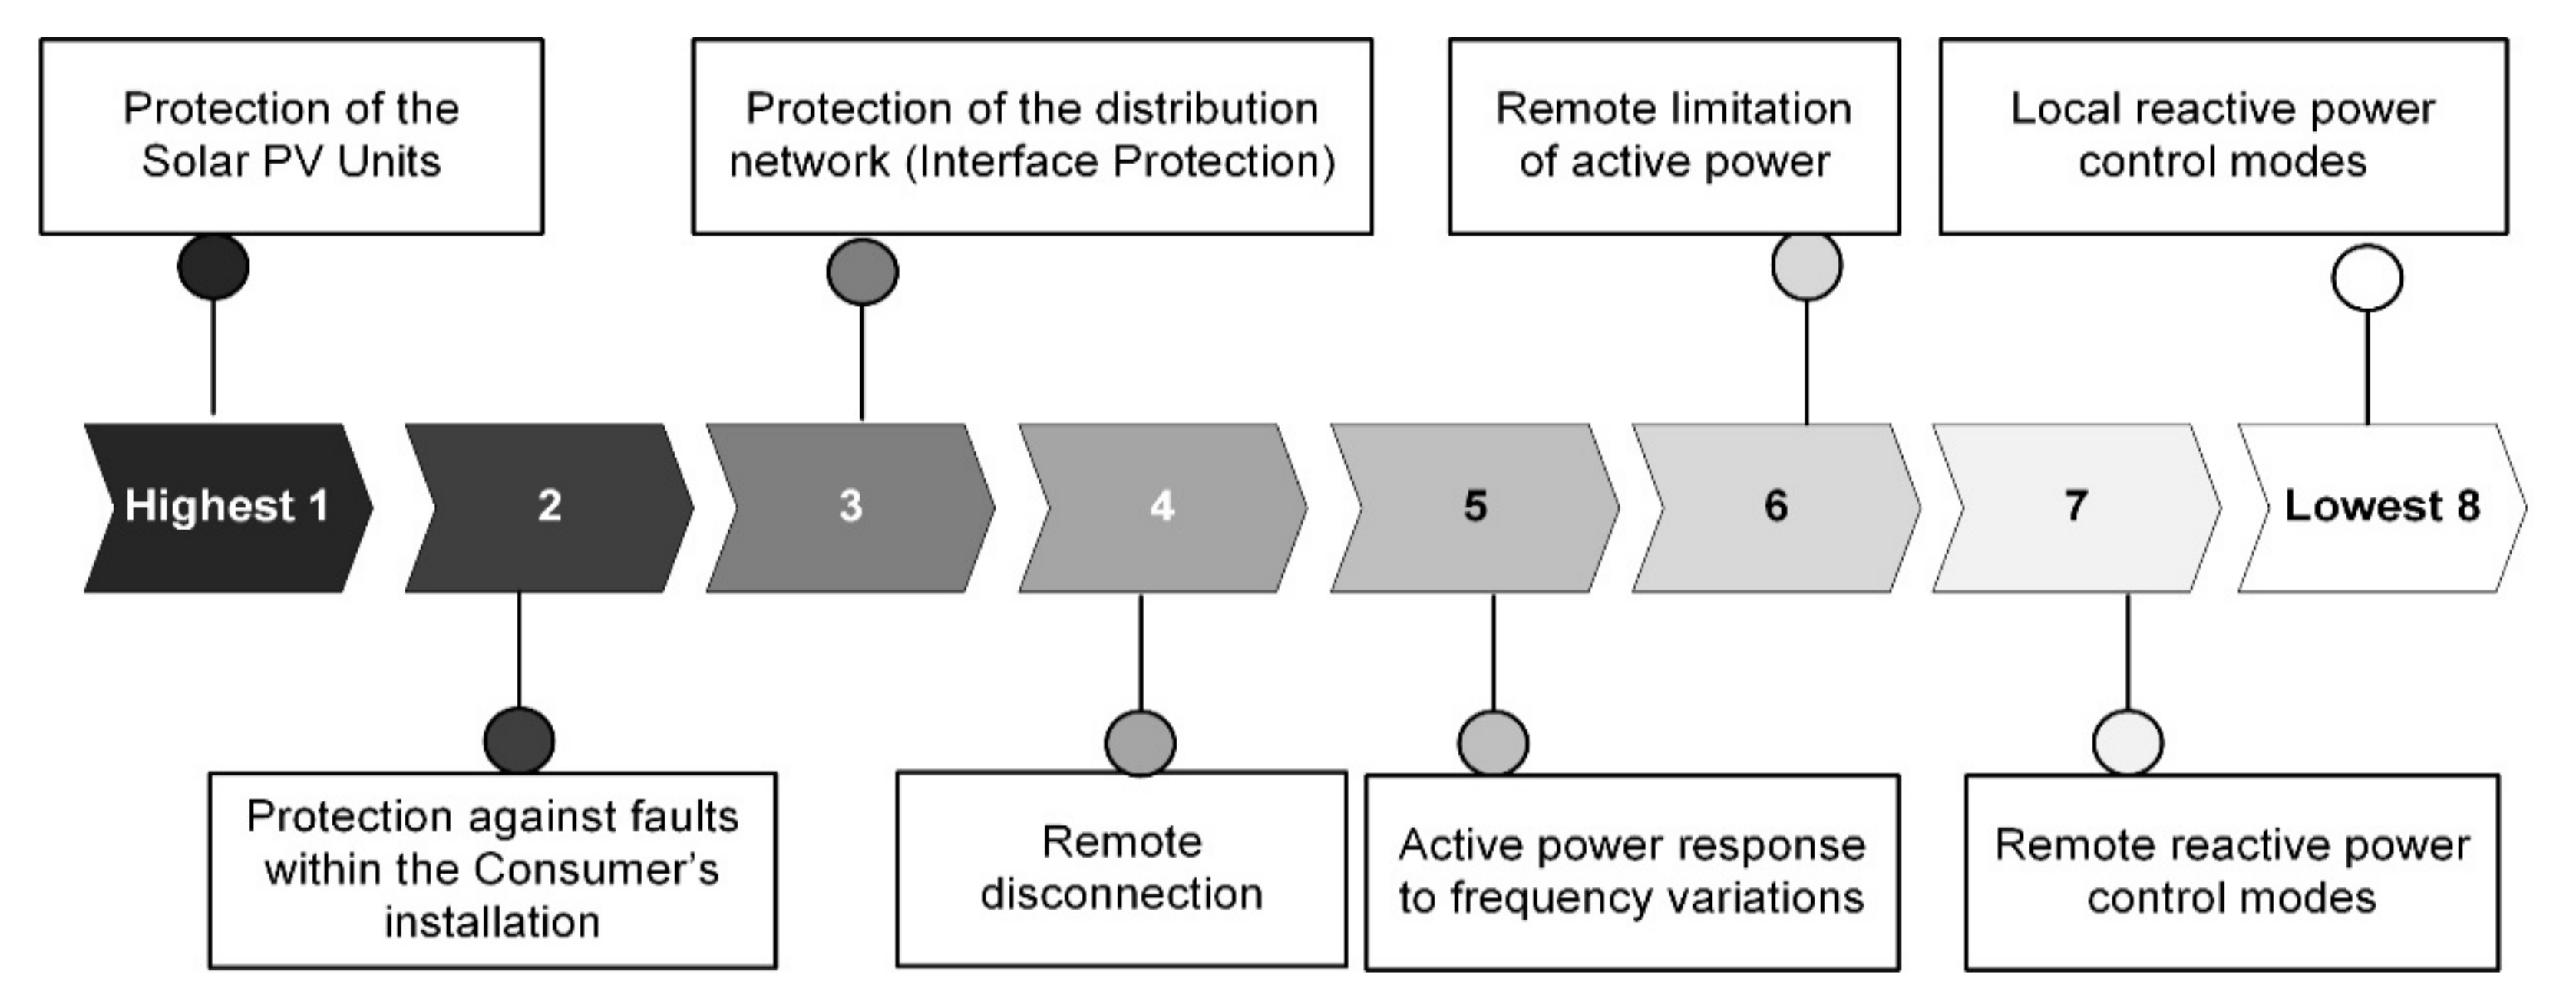
3.2. General Requirements for Connecting a Small-Scale PV System
3.3. System Analysis
3.4. Performance Indicators
3.5. Financial Indicators
3.6. Materials Price Estimation of the Thermal Insulation
3.7. Materials Price Estimation of the PV System
4. Results and Discussion
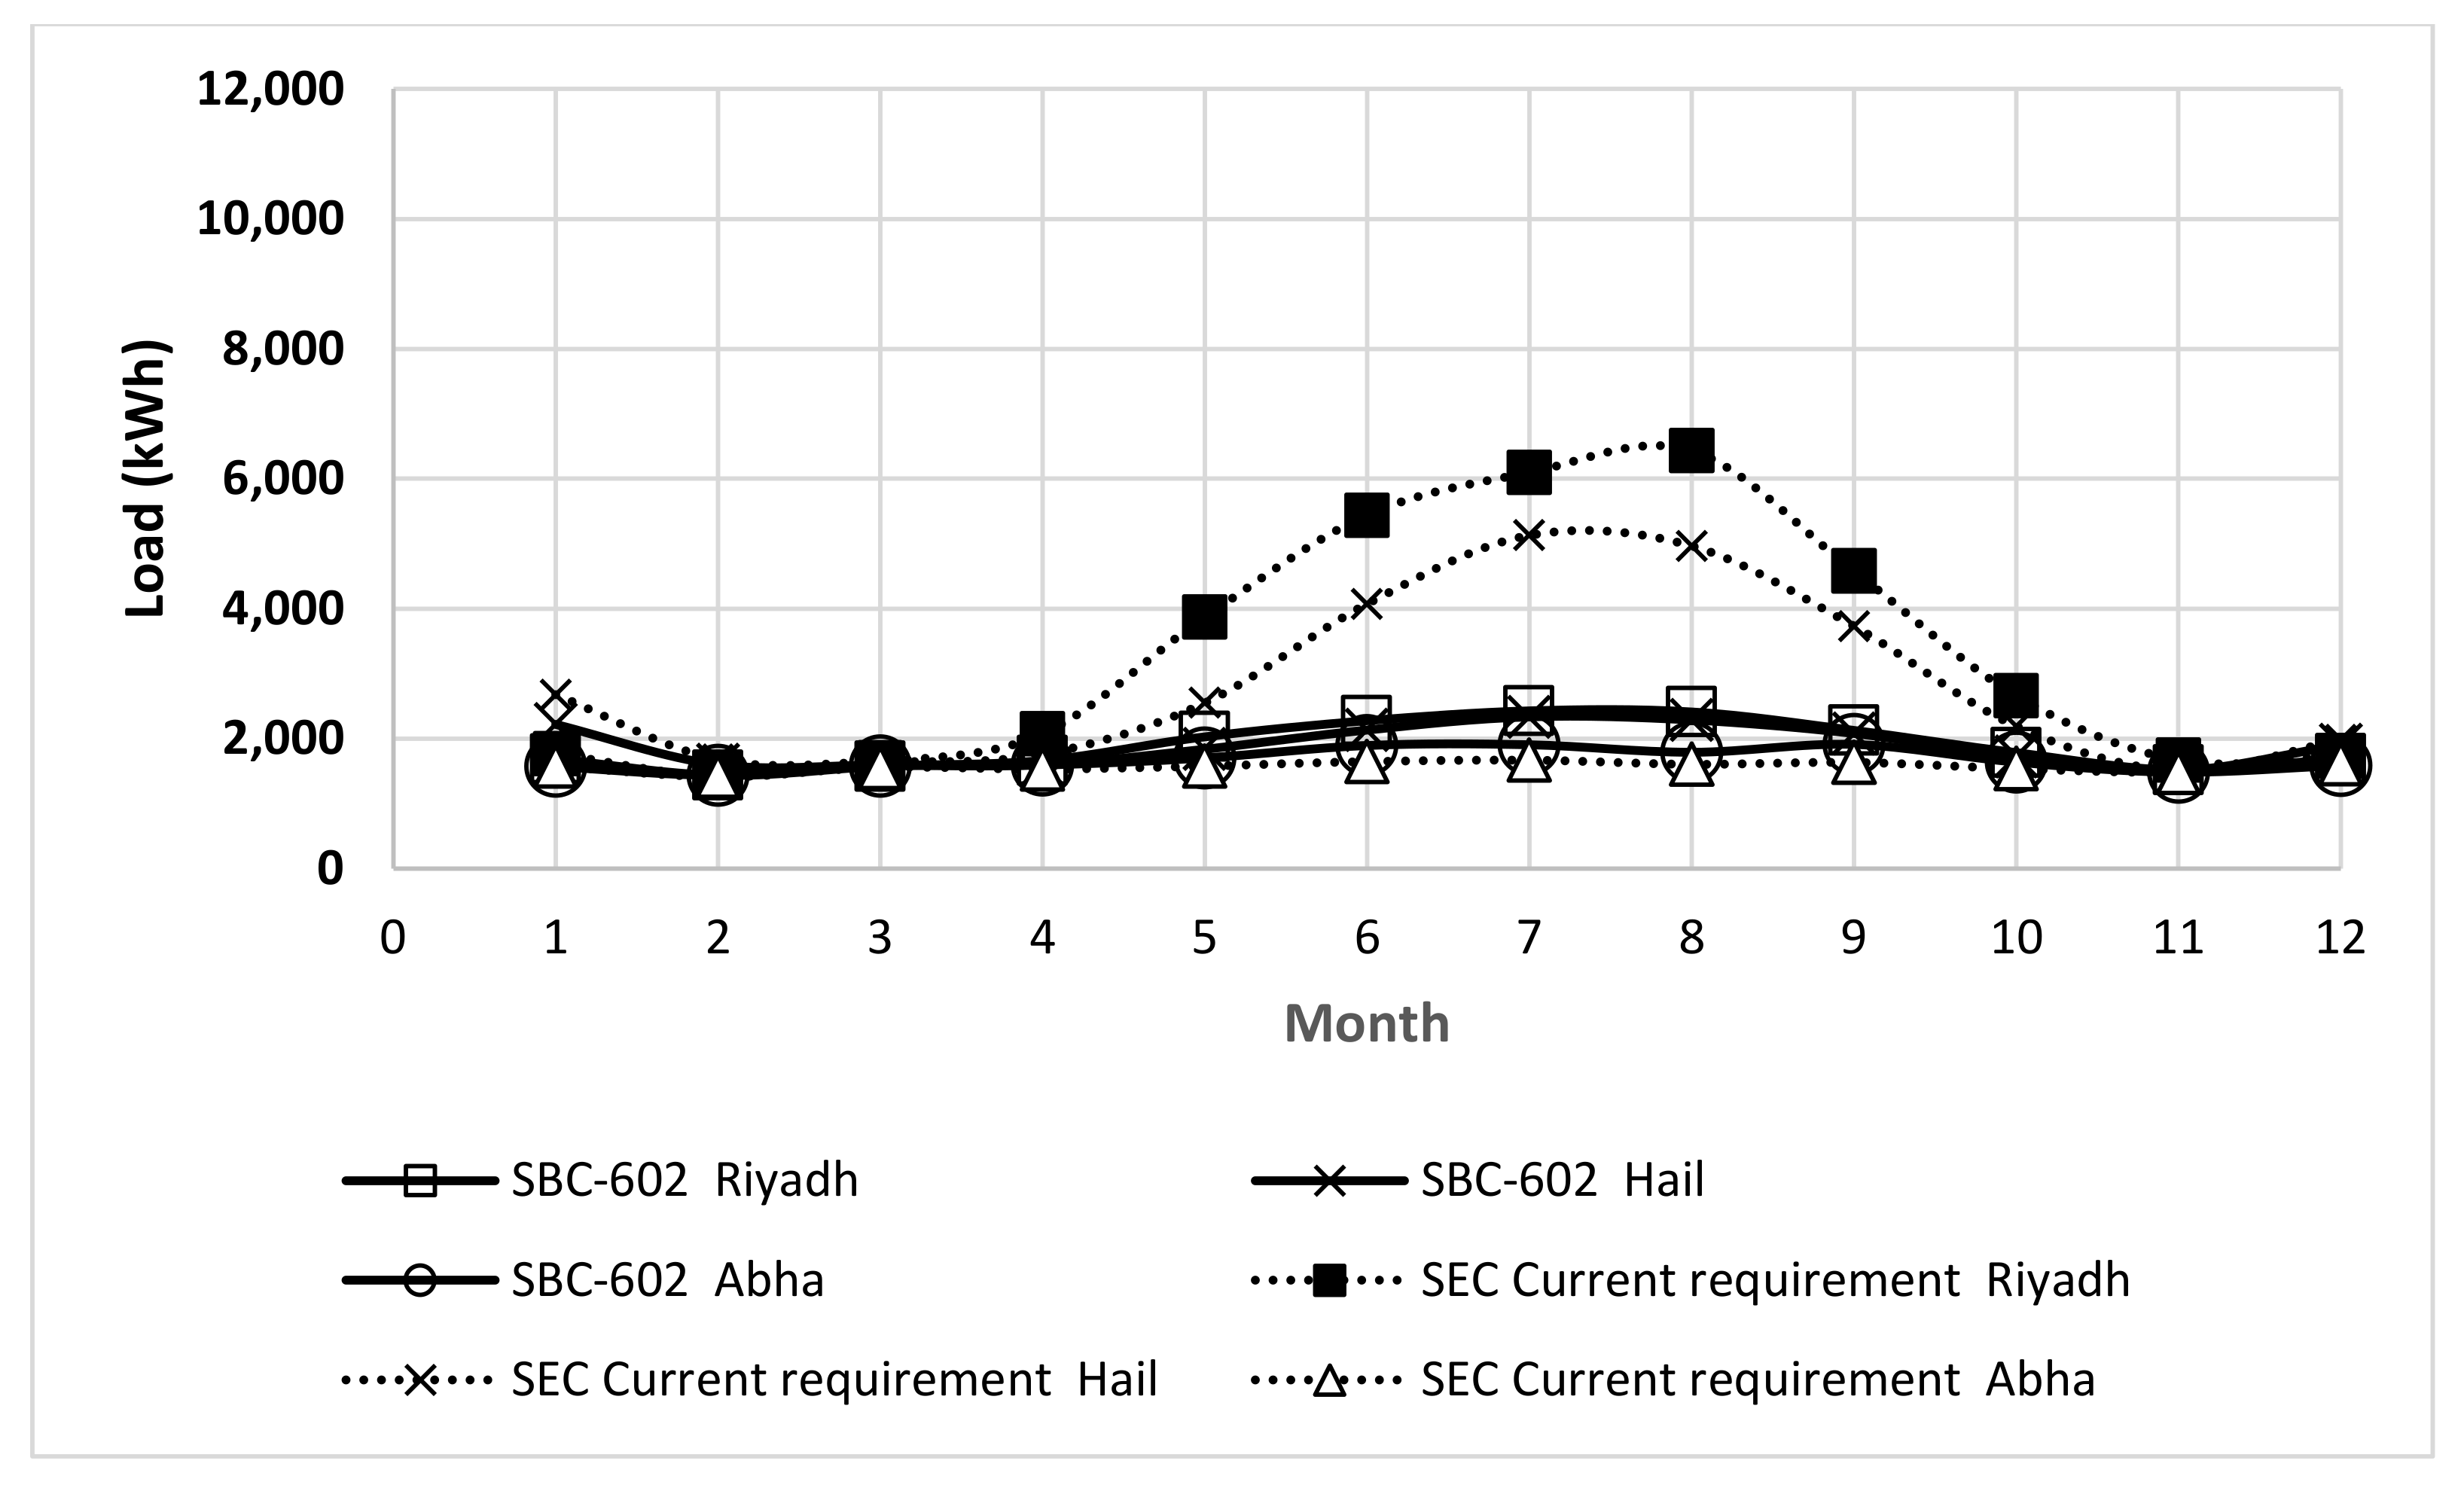
4.1. Electrical Energy Consumption
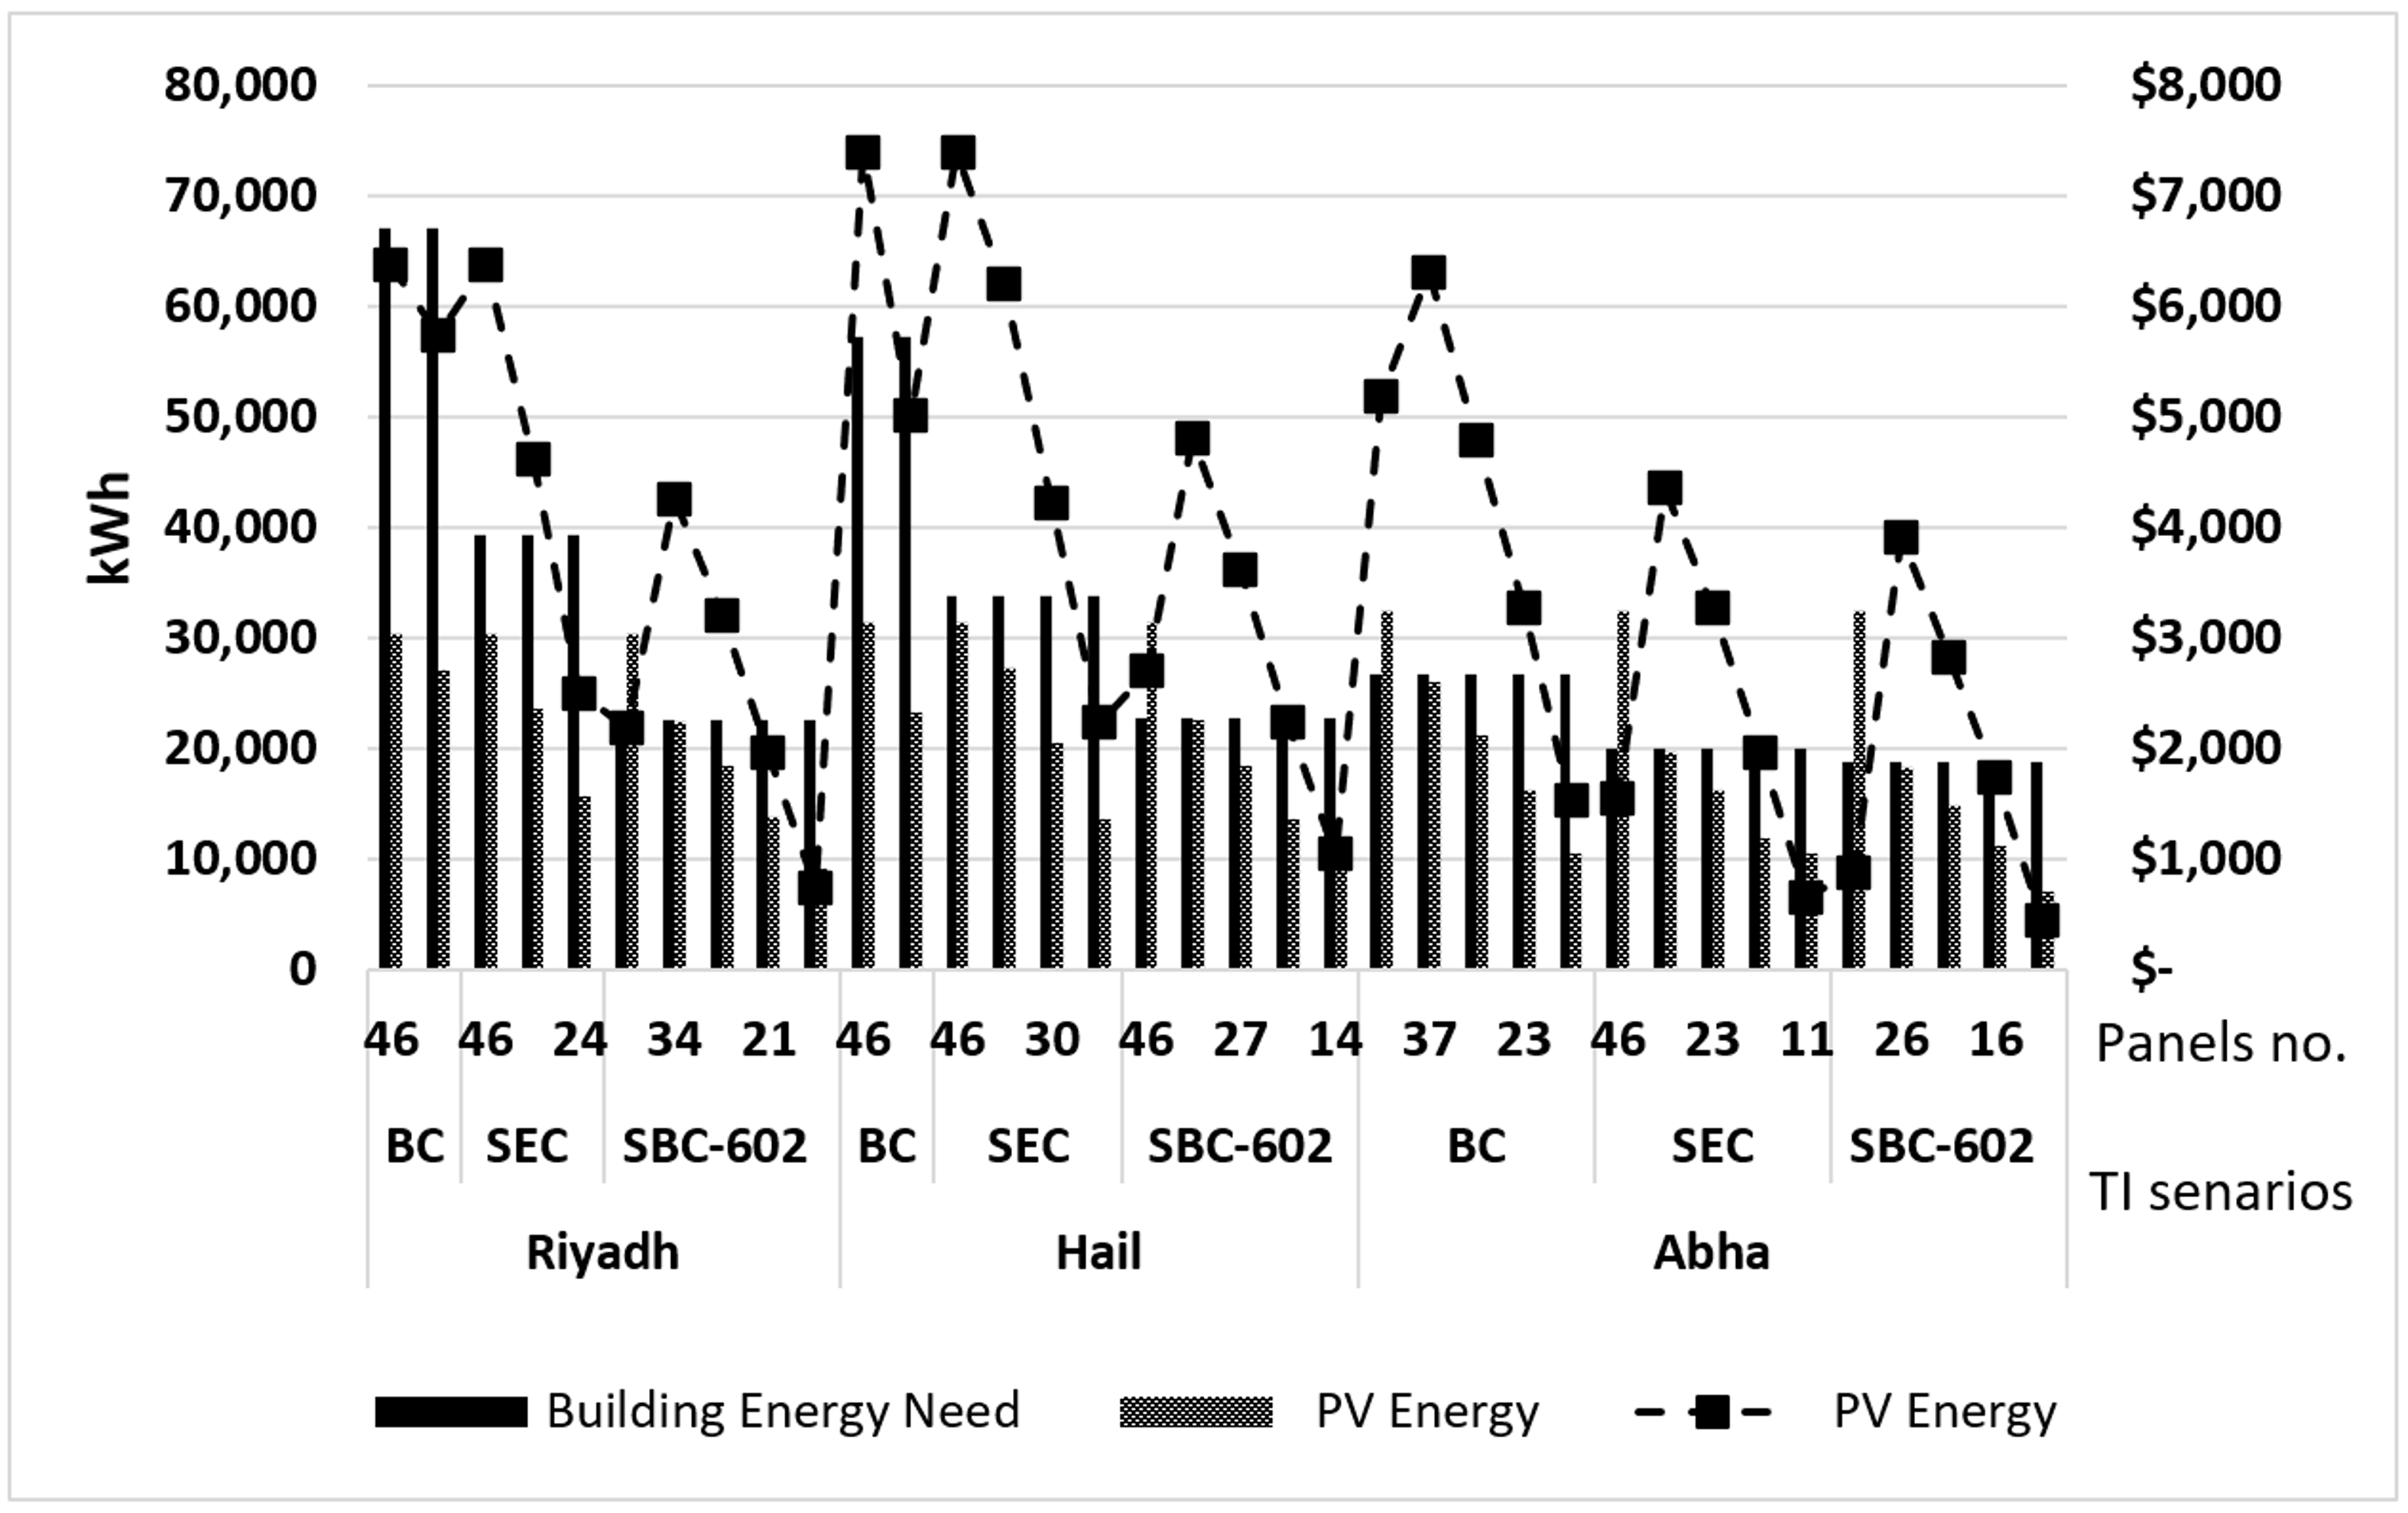
4.2. PV Energy System
4.3. Performance Indicators
4.4. Saved and Generated Energy
4.5. Financial Indicators
4.6. Environmental Analysis
5. Conclusions and Recommendations
- The annual electrical energy consumption of the building base case in Riyadh city was the highest 67,095 kWh, while for the Hail, it was 57,373 kWh and Abha 26,799 kWh.
- In Riyadh city, 69% of the total energy was used for cooling and heating for the basic case-building, and by applying the SBC-602 requirement, it will be only 19%.
- The NPV of SEC thermal insulation requirement in Riyadh city was the highest $18,953, and Hail was $15,044, while for Abha, it was negative −$384.1.
- The NPV of SBC-602 thermal insulation requirement in Riyadh city was the highest $20,443, and Hail was $12,375, while for Abha, it was negative −$12,098.
- The cumulative NPV of SEC thermal insulation requirement with unified PV was $25,334, $22,437, and $1177 for Riyadh, Hail, and Abha, respectively.
- The cumulative NPV of SBC-602 thermal insulation requirement with unified PV was $22,643, $15,077, and −$11,214 for Riyadh, Hail, and Abha, respectively.
- The best NPV results were when combined SEC thermal insulation requirement with a PV system covering 75–100% of the required load.
- In Riyadh, the capital cost of the PV system covering 80% of the base caseload was around $24,260. When the SEC thermal insulation requirement was applied, it could decrease up to 170%, and when the SBC-602 thermal insulation requirement was applied, it could decrease up to 296%.
- In Hail, the capital cost of the PV system covering 80% of the base caseload was $19,973; when the SEC thermal insulation requirement was applied, it could decrease up to 169%, and when SBC-602 thermal insulation requirement applied, it could decrease up to 251%.
- In Abha, the capital cost of the PV system covering 80% of the base caseload cost around $9048; when the SEC thermal insulation requirement applied, it could decrease up to 133%, and when SBC-602 thermal insulation requirement applied, it could decrease up to 142%.
- The instructions of the SBC-602 Code must be applied entirely in a new building in zones 1 and 2 and granting owners of old buildings interest-free loans to implement the required conditions in zone 1 and 2.
- Reduce the required conditions of the SBC-602 Code in the climatic zone 3.
- Implement government support programs to perform more research and development to take advantage of the available RE for water heating and solar thermal and electrical cooling in KSA.
- Carry out qualitative and quantitative research to study human behavior towards energy use in residential areas.
Author Contributions
Funding
Institutional Review Board Statement
Informed Consent Statement
Data Availability Statement
Acknowledgments
Conflicts of Interest
Nomenclature
| AC | Alternating Current |
| A/C | Air Conditioning |
| BOS | Balance of system |
| CDD | Cooling Degree-Days |
| CF | Capacity factor |
| COP | Coefficient of Performance |
| ECRA | Electricity and Co-Generation Regulatory Authority |
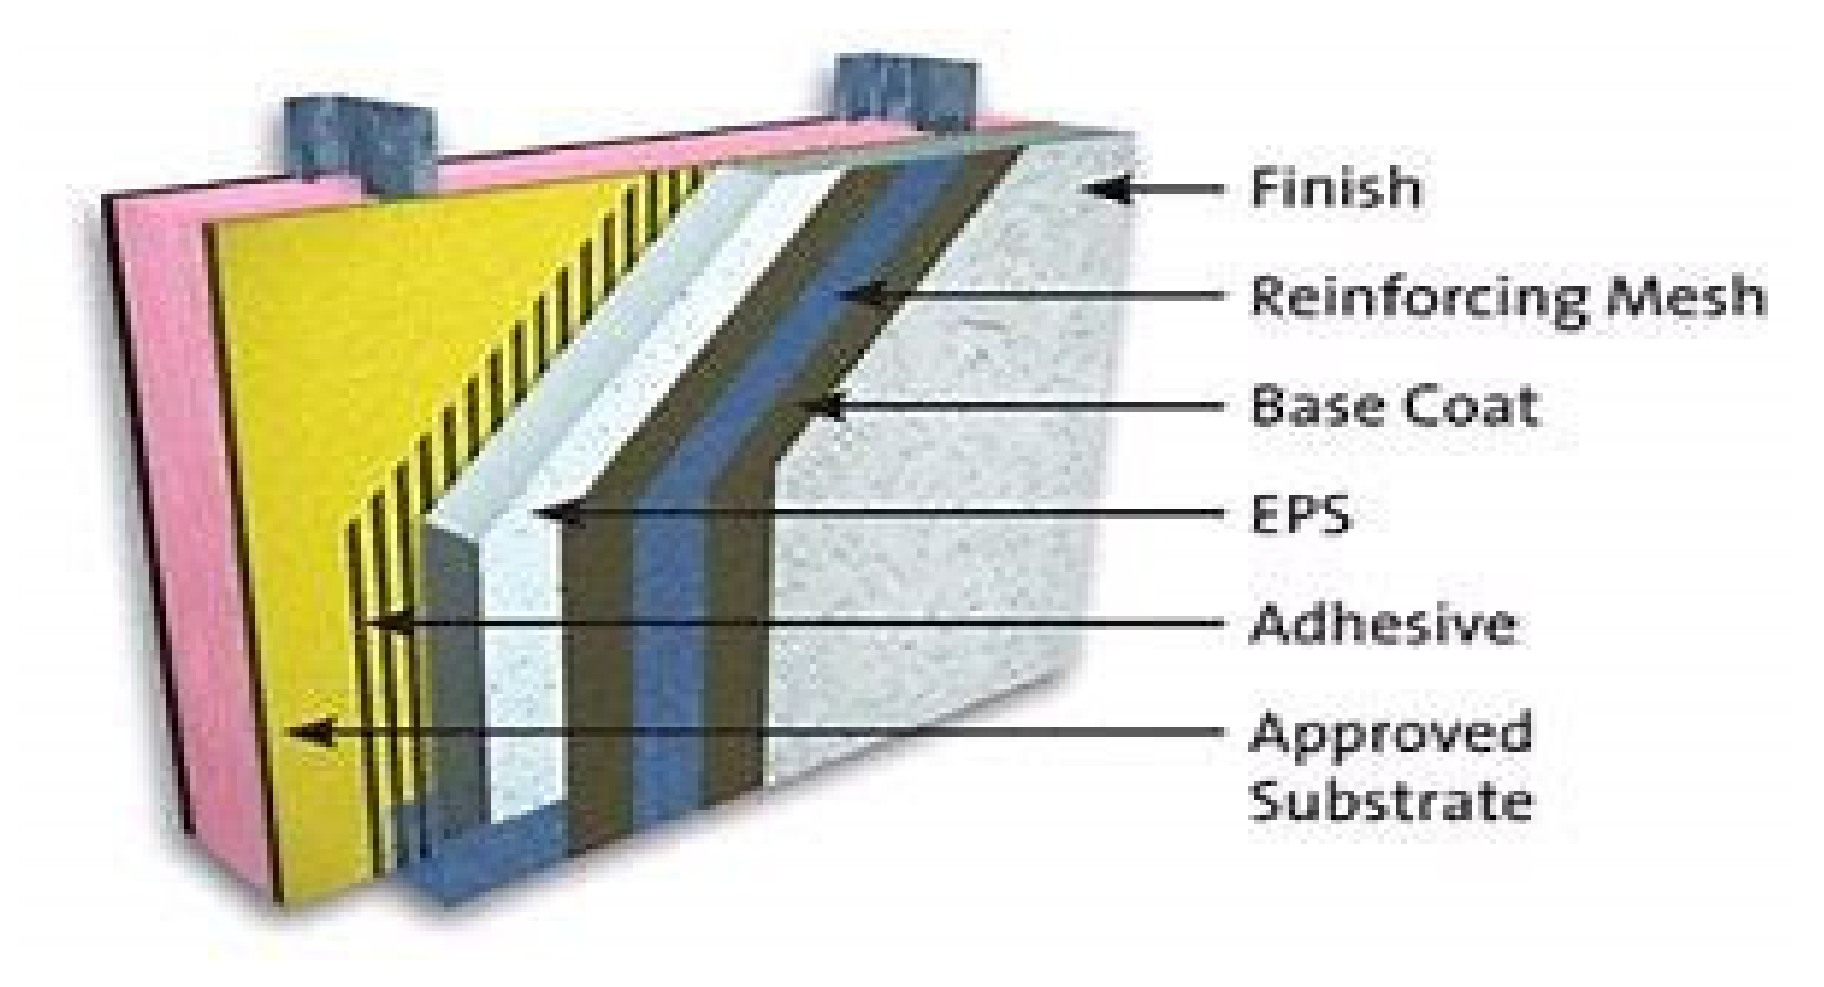
| EIFS | Exterior insulation finishing system |
| EE | Energy Efficiency |
| EUI | Energy Used Intensity |
| FIT | Feed-in tariff |
| GCC | Gulf Cooperation Council |
| GHG | Greenhouse Gases |
| GHI | Global Horizontal Irradiance |
| GRC | Ground Coverage Ratio |
| HCB | Hollow Concrete Blocks |
| HDD | Heating Degree-Days |
| IEA | International Energy Agency |
| KSA | Kingdom of Saudi Arabia |
| LCC | Life cycle cost |
| LCOE | Levelized cost of energy |
| LCSE | Levelized cost of saved energy |
| MPPT | Maximum Power Point Tracking |
| NDPBT | |
| NPV | Net present value |
| NZEB | net-zero energy building |
| PV | Photovoltaic |
| RE | Renewable Energy |
| SBC | Saudi Building Code |
| SEC | Saudi Electricity company |
| SPBT | Simple payback time |
| SPD | Surge protection device |
| STC | Standard test conditions |
| U-value | Heat transfer coefficient |
| V | Voltage |
| W | Watt |
| Wh | Watthour |
| YF | Yield factor |
Appendix A

| Month | Air Temperature (°C) | Relative Humidity (%) | Precipitation (mm) | Daily Solar Radiation Horizontal (kWh/m2/d) | Atmospheric Pressure (kPa) | Wind Speed * (m/s) | Earth Temperature (°C) |
|---|---|---|---|---|---|---|---|
| January | 14.0 | 46.2 | 18.75 | 3.50 | 94.7 | 0.5 | 15.9 |
| February | 16.4 | 36.4 | 8.70 | 4.60 | 94.5 | 0.6 | 18.9 |
| March | 21.1 | 33.7 | 16.86 | 5.10 | 94.2 | 0.6 | 23.4 |
| April | 25.7 | 28.5 | 16.87 | 5.50 | 93.9 | 0.5 | 29.8 |
| May | 31.5 | 17.1 | 1.21 | 5.60 | 93.6 | 0.5 | 35.8 |
| June | 34.2 | 10.4 | 0.08 | 6.10 | 93.1 | 0.6 | 38.1 |
| July | 35.0 | 9.9 | 0.04 | 6.10 | 92.8 | 0.6 | 39.8 |
| August | 35.1 | 11.9 | 0.22 | 5.90 | 93.0 | 0.6 | 39.5 |
| September | 31.9 | 13.5 | 0.27 | 5.70 | 93.5 | 0.4 | 36.1 |
| October | 26.8 | 20.3 | 1.52 | 5.30 | 94.1 | 0.3 | 30.3 |
| November | 20.7 | 36.2 | 14.38 | 4.50 | 94.5 | 0.3 | 23.7 |
| December | 15.4 | 47.5 | 14.15 | 3.60 | 94.7 | 0.3 | 18.0 |
| Annual | 25.7 | 25.9 | 93.05 | 5.13 | 93.9 | 0.5 | 29.2 |
| Source | Ground | Ground | NASA | Ground | Ground | Ground | NASA |
| Month | Air Temperature (°C) | Relative Humidity (%) | Precipitation (mm) | Daily Solar Radiation Horizontal (kWh/m2/d) | Atmospheric Pressure (kPa) | Wind Speed * (m/s) | Earth Temperature (°C) |
|---|---|---|---|---|---|---|---|
| January | 10.4 | 53.3 | 18.28 | 3.46 | 90.8 | 3.2 | 11.8 |
| February | 12.4 | 43.3 | 8.92 | 4.45 | 90.7 | 3.4 | 15.0 |
| March | 16.3 | 38.6 | 11.82 | 5.23 | 90.5 | 3.7 | 20.0 |
| April | 22.1 | 33.4 | 6.12 | 6.19 | 90.5 | 3.8 | 26.7 |
| May | 27.4 | 24.0 | 5.35 | 6.42 | 90.4 | 3.7 | 32.9 |
| June | 31.2 | 16.0 | 0.21 | 6.79 | 90.2 | 3.3 | 36.1 |
| July | 32.5 | 15.9 | 0.36 | 6.60 | 89.9 | 3.2 | 38.6 |
| August | 32.8 | 17.0 | 0.46 | 6.22 | 90.0 | 2.9 | 38.8 |
| September | 30.2 | 18.2 | 0.22 | 5.63 | 90.4 | 2.7 | 35.4 |
| October | 24.5 | 27.3 | 5.64 | 4.82 | 90.7 | 3.0 | 28.5 |
| November | 17.0 | 46.9 | 14.21 | 3.66 | 90.9 | 2.9 | 19.7 |
| December | 12.0 | 53.1 | 13.25 | 3.36 | 90.9 | 2.9 | 13.6 |
| Annual | 22.5 | 32.2 | 84.84 | 5.24 | 90.5 | 3.2 | 26.5 |
| Source | Ground | Ground | NASA | Ground | Ground | Ground | NASA |
| Month | Air Temperature (°C) | Relative Humidity (%) | Precipitation (mm) | Daily Solar Radiation Horizontal (kWh/m2/d) | Atmospheric Pressure (kPa) | Wind Speed * (m/s) | Earth Temperature (°C) |
|---|---|---|---|---|---|---|---|
| January | 13.2 | 70.2 | 10.78 | 4.74 | 79.8 | 3.8 | 20.7 |
| February | 14.6 | 67.8 | 1.00 | 4.60 | 79.8 | 4.4 | 22.9 |
| March | 16.5 | 64.4 | 16.34 | 5.37 | 79.7 | 4.2 | 25.2 |
| April | 18.3 | 60.8 | 27.23 | 5.62 | 79.7 | 3.3 | 28.0 |
| May | 21.1 | 50.6 | 26.47 | 5.89 | 79.8 | 2.7 | 32.3 |
| June | 23.3 | 39.1 | 7.59 | 6.01 | 79.6 | 2.7 | 33.3 |
| July | 23.2 | 44.4 | 4.63 | 5.52 | 79.5 | 3.0 | 30.0 |
| August | 22.6 | 51.7 | 13.25 | 5.30 | 79.6 | 2.8 | 28.4 |
| September | 21.9 | 38.9 | 6.74 | 5.73 | 79.7 | 2.9 | 31.0 |
| October | 18.5 | 43.6 | 15.00 | 6.02 | 79.9 | 2.5 | 28.8 |
| November | 15.6 | 61.0 | 16.30 | 5.50 | 79.9 | 2.4 | 24.3 |
| December | 13.8 | 67.1 | 13.74 | 4.81 | 79.9 | 3.0 | 21.4 |
| Annual | 18.6 | 54.9 | 159.07 | 5.43 | 79.7 | 3.1 | 27.2 |
| Source | Ground | Ground | NASA | Ground | Ground | Ground | NASA |
References
- Looney, B. Full Report–BP Statistical Review of World Energy 2020; BP Plc: London, UK, 2020. [Google Scholar]
- IEA. Global Energy Review. 2020. Available online: https://webstore.iea.org/download/direct/2995 (accessed on 20 July 2020).
- Friess, W.A.; Rakhshan, K. A review of passive envelope measures for improved building energy efficiency in the UAE. Renew. Sustain. Energy Rev. 2017, 72, 485–496. [Google Scholar] [CrossRef]
- Nurunnabi, M. Transformation from an oil-based economy to a knowledge-based economy in Saudi Arabia: The direction of Saudi vision 2030. J. Knowl. Econ. 2017, 8, 536–564. [Google Scholar] [CrossRef]
- Alfaraidy, F.A.; Azzam, S. Residential Buildings Thermal Performance to Comply With the Energy Conservation Code of Saudi Arabia. Eng. Technol. Appl. Sci. Res. 2019, 9, 3949–3954. [Google Scholar] [CrossRef]
- Saudi Building Energy Conservation Code-Residential SBC 602; KSA: Riyadh, Saudi Arabia, 2018; p. 64. Available online: https://www.sbc.gov.sa/En/BuildingCode/Pages/SBC_602E.aspx (accessed on 2 March 2020).
- Krarti, M.; Dubey, K.; Howarth, N. Evaluation of building energy efficiency investment options for the Kingdom of Saudi Arabia. Energy 2017, 134, 595–610. [Google Scholar] [CrossRef]
- Zell, E.; Gasim, S.; Wilcox, S.; Katamoura, S.; Stoffel, T.; Shibli, H.; Engel-Cox, J.; Al Subie, M. Assessment of solar radiation resources in Saudi Arabia. Sol. Energy 2015, 119, 422–438. [Google Scholar] [CrossRef]
- Leng, G.J. RETScreen™ international: A decision support and capacity building tool for assessing potential renewable energy projects. Ind. Environ. Paris 2000, 23, 22–23. [Google Scholar]
- Saudi Arabia Balance, IEA. Available online: https://www.iea.org/sankey/#?c=Saudi%20Arabia&s=Balance2020 (accessed on 28 May 2020).
- Annual Statistical Booklet for Electricity and Seawater Desalination Industries. 2019; p. 164. Available online: https://ecra.gov.sa/en-us/MediaCenter/DocLib2/Lists/SubCategory_Library/ecra%20sat_book_16.pdf (accessed on 20 November 2020).
- Alghamdi, A.S. Potential for Rooftop-Mounted PV Power Generation to Meet Domestic Electrical Demand in Saudi Arabia: Case Study of a Villa in Jeddah. Energies 2019, 12, 4411. [Google Scholar] [CrossRef]
- Felimban, A.; Prieto, A.; Knaack, U.; Klein, T.; Qaffas, Y. Assessment of Current Energy Consumption in Residential Buildings in Jeddah, Saudi Arabia. Buildings 2019, 9, 163. [Google Scholar] [CrossRef]
- Dincer, I. Renewable energy and sustainable development: A crucial review. Renew. Sustain. Energy Rev. 2000, 4, 157–175. [Google Scholar] [CrossRef]
- Irena, I. Renewable Power Generation Costs in 2017; Report; International Renewable Energy Agency: Abu Dhabi, United Arab Emirates, 2018. [Google Scholar]
- Balabel, A.; Alwetaishi, M. Towards Sustainable Residential Buildings in Saudi Arabia According to the Conceptual Framework of “Mostadam” Rating System and Vision 2030. Sustainability 2021, 13, 793. [Google Scholar] [CrossRef]
- Krarti, M.; Ihm, P. Evaluation of net-zero energy residential buildings in the MENA region. Sustain. Cities Soc. 2016, 22, 116–125. [Google Scholar] [CrossRef]
- Krarti, M.; Dubey, K.; Howarth, N. Energy productivity analysis framework for buildings: A case study of GCC region. Energy 2019, 167, 1251–1265. [Google Scholar] [CrossRef]
- Krarti, M.; Dubey, K. Benefits of energy efficiency programs for residential buildings in Bahrain. J. Build. Eng. 2018, 18, 40–50. [Google Scholar] [CrossRef]
- Ahmed, W.; Asif, M.; Alrashed, F. Application of Building Performance Simulation to Design Energy-Efficient Homes: Case Study from Saudi Arabia. Sustainability 2019, 11, 6048. [Google Scholar] [CrossRef]
- Alaidroos, A.; Krarti, M. Optimal design of residential building envelope systems in the Kingdom of Saudi Arabia. Energy Build. 2015, 86, 104–117. [Google Scholar] [CrossRef]
- Ahmad, A. Energy simulation for a typical house built with different types of masonry building materials. Arab. J. Sci. Eng. 2004, 29, 113–126. [Google Scholar]
- Taleb, H.M.; Sharples, S. Developing sustainable residential buildings in Saudi Arabia: A case study. Appl. Energy 2011, 88, 383–391. [Google Scholar] [CrossRef]
- Aldossary, N.A.; Rezgui, Y.; Kwan, A. Establishing domestic low energy consumption reference levels for Saudi Arabia and the Wider Middle Eastern Region. Sustain. Cities Soc. 2017, 28, 265–276. [Google Scholar] [CrossRef]
- Krarti, M. Evaluation of occupancy-based temperature controls on energy performance of KSA residential buildings. Energy Build. 2020, 220, 110047. [Google Scholar] [CrossRef]
- Alardhi, A.; Alaboodi, A.S.; Almasri, R. Impact of the new Saudi energy conservation code on Saudi Arabia residential buildings. Aust. J. Mech. Eng. 2020, 1–15. [Google Scholar] [CrossRef]
- Almushaikah, A.S.; A Almasri, R. Evaluating the potential energy savings of residential buildings and utilizing solar energy in the middle region of Saudi Arabia—Case study. Energy Explor. Exploit. 2020. [Google Scholar] [CrossRef]
- Esmaeil, K.K.; Alshitawi, M.S.; Almasri, R.A. Analysis of energy consumption pattern in Saudi Arabia’s residential buildings with specific reference to Qassim region. Energy Effic. 2019, 12, 2123–2145. [Google Scholar] [CrossRef]
- Almasri, R.A.; Almarshoud, A.F.; Omar, H.M.; Esmaeil, K.K.; Alshitawi, M. Exergy and Economic Analysis of Energy Consumption in the Residential Sector of the Qassim Region in the Kingdom of Saudi Arabia. Sustainability 2020, 12, 2606. [Google Scholar] [CrossRef]
- Annual Statistical Booklet for Electricity and Seawater Desalination Industries. 2017. p. 162. Available online: https://www.ecra.gov.sa/en-us/MediaCenter/doclib2/Pages/SubCategoryList.aspx?categoryID=5 (accessed on 13 October 2019).
- Krarti, M.; Aldubyan, M.; Williams, E. Residential building stock model for evaluating energy retrofit programs in Saudi Arabia. Energy 2020, 195, 116980. [Google Scholar] [CrossRef]
- Alrashed, F.; Asif, M. Trends in Residential Energy Consumption in Saudi Arabia with Particular Reference to the Eastern Province. J. Sustain. Dev. Energy Water Environ. Syst. 2014, 2, 376–387. [Google Scholar] [CrossRef]
- Electricity Consumption by Sectors. 2018. Available online: https://datasource.kapsarc.org/explore/dataset/electricity-consumption-by-sectors/information/?disjunctive.region&disjunctive.type_of_consumption (accessed on 22 May 2020).
- Annual Statistical Booklet for Electricity and Seawater Desalination Industries. 2018; p. 164. Available online: https://www.ecra.gov.sa/en-us/MediaCenter/doclib2/Pages/SubCategoryList.aspx?categoryID=5 (accessed on 11 May 2020).
- Dehwah, A.H.; Asif, M.; Rahman, M.T. Prospects of PV application in unregulated building rooftops in developing countries: A perspective from Saudi Arabia. Energy Build. 2018, 171, 76–87. [Google Scholar] [CrossRef]
- Asif, M. Urban scale application of solar PV to improve sustainability in the building and the energy sectors of KSA. Sustainability 2016, 8, 1127. [Google Scholar] [CrossRef]
- Imam, A.A.; Al-Turki, Y.A.; Kumar, R.S. Techno-Economic Feasibility Assessment of Grid-Connected PV Systems for Residential Buildings in Saudi Arabia—A Case Study. Sustainability 2019, 12, 262. [Google Scholar] [CrossRef]
- Almarshoud, A.F. Technical and Economic Performance of 1MW Grid-connected PV system in Saudi Arabia. Int. J. Eng. Res. Appl. 2017, 7, 9–17. [Google Scholar] [CrossRef]
- Akter, M.; Mahmud, M.; Oo, A.M. Comprehensive economic evaluations of a residential building with solar photovoltaic and battery energy storage systems: An Australian case study. Energy Build. 2017, 138, 332–346. [Google Scholar] [CrossRef]
- Sagani, A.; Mihelis, J.; Dedoussis, V. Techno-economic analysis and life-cycle environmental impacts of small-scale building-integrated PV systems in Greece. Energy Build. 2017, 139, 277–290. [Google Scholar] [CrossRef]
- Hajiah, A.; Khatib, T.; Sopian, K.; Sebzali, M. Performance of grid-connected photovoltaic system in two sites in Kuwait. Int. J. Photoenergy 2012, 2012, 1–7. [Google Scholar] [CrossRef]
- Kazem, H.A.; Khatib, T. Techno-economical assessment of grid connected photovoltaic power systems productivity in Sohar, Oman. Sustain. Energy Technol. Assess. 2013, 3, 61–65. [Google Scholar] [CrossRef]
- Kazem, H.A.; Albadi, M.; Al-Waeli, A.H.; Al-Busaidi, A.H.; Chaichan, M.T. Techno-economic feasibility analysis of 1 MW photovoltaic grid connected system in Oman. Case Stud. Therm. Eng. 2017, 10, 131–141. [Google Scholar] [CrossRef]
- Allouhi, A.; Saadani, R.; Kousksou, T.; Saidur, R.; Jamil, A.; Rahmoune, M. Grid-connected PV systems installed on institutional buildings: Technology comparison, energy analysis and economic performance. Energy Build. 2016, 130, 188–201. [Google Scholar] [CrossRef]
- Emziane, M.; Al Ali, M. Performance assessment of rooftop PV systems in Abu Dhabi. Energy Build. 2015, 108, 101–105. [Google Scholar] [CrossRef]
- Omar, M.A.; Mahmoud, M.M. Grid connected PV- home systems in Palestine: A review on technical performance, effects and economic feasibility. Renew. Sustain. Energy Rev. 2018, 82, 2490–2497. [Google Scholar] [CrossRef]
- Regulatory Framework for SmallScale Solar PV Systems. Available online: https://www.ecra.gov.sa/en-us/Advertisements/Pages/Regulatory-framework-for-Small-Scale-Solar-PV-Systems.pdf (accessed on 14 December 2020).
- Sustainable Integration of Renewable Energy Sources (Solar PV) with SEC Distribution Network Low Voltage and Medium Voltage. Available online: https://www.se.com.sa/en-us/Lists/Requirements_pre_qualification/Attachments/8/systems.pdf (accessed on 20 December 2020).
- Basit, M.A.; Dilshad, S.; Badar, R.; Rehman, S.M.S.U. Limitations, challenges, and solution approaches in grid-connected renewable energy systems. Int. J. Energy Res. 2020, 44, 4132–4162. [Google Scholar] [CrossRef]
- Ganoe, R.D.; Stackhouse, P.W., Jr.; DeYoung, R.J. RETScreen Plus Software Tutorial. 2014. Available online: https://scholar.google.com/scholar?hl=ar&as_sdt=0%2C5&q=50.%09Ganoe%2C+R.D.%3B+Stackhouse%2C+P.W.%2C+Jr.%3B+DeYoung%2C+R.J.+RETScreen+Plus+Software+Tutorial%3B+2014.&btnG= (accessed on 10 December 2019).
- Kalogirou, S.A. Solar Energy Engineering: Processes and Systems; Academic Press: Cambridge, MA, USA, 2013. [Google Scholar]
- SAMA Inflation Reports. Available online: http://www.sama.gov.sa/en-US/EconomicReports/Pages/InflationReport.aspx (accessed on 19 May 2020).
- Al-Mumin, A.; Khattab, O.; Sridhar, G. Occupants’ behavior and activity patterns influencing the energy consumption in the Kuwaiti residences. Energy Build. 2003, 35, 549–559. [Google Scholar] [CrossRef]
- United Nations. 7. d Paris Agreement, Status of Treaties. 2016. Available online: https://treaties.un.org/pages/ViewDetails.aspx?src=TREATY&mtdsg_no=XXVII-7-d&chapter=27&clang=_en (accessed on 16 May 2020).
- Treaties. The Montreal Protocol on Substances that Deplete the Ozone Layer. 1993. Available online: https://ozone.unep.org/treaties/montreal-protocol/meetings/twenty-second-meeting-parties/decisions/decision-xxii15-non?source=decisions_by_article_topic_relation&args%5B0%5D=127&parent=2251&nextParent=2252 (accessed on 16 May 2020).
- Kyoto Protocol (KP). Clean Development Mechanism. 2005. Available online: https://www.cdmdna.gov.sa/p/kyoto-protocol-kp/16#:~:text=The%20Kingdom%20of%20Saudi%20Arabia,Protocol%20on%2031%20January%202005.&text=The%20Protocol’s%20first%20commitment%20period%20started%20in%202008%20and%20ended%20in%202012.&text=As%20of%2021%20September%202017,the%20acceptances%20of%20144%20state (accessed on 15 May 2020).
- Dilshad, S.; Kalair, A.R.; Khan, N. Review of carbon dioxide (CO 2) based heating and cooling technologies: Past, present, and future outlook. Int. J. Energy Res. 2019, 44, 1408–1463. [Google Scholar] [CrossRef]
- Mancini, F.; Nastasi, B. Solar Energy Data Analytics: PV Deployment and Land Use. Energies 2020, 13, 417. [Google Scholar] [CrossRef]
- Zhang, X.; Feng, S.; Zhang, H.; Yuan, J. Developing Distributed PV in Beijing: Deployment Potential and Economics. Front. Energy Res. 2020, 7. [Google Scholar] [CrossRef]
- Nastasi, B.; Di Matteo, U. Solar Energy Technologies in Sustainable Energy Action Plans of Italian Big Cities. Energy Procedia 2016, 101, 1064–1071. [Google Scholar] [CrossRef]


| Sectors | Energy Consumption and the Percentage by Applications | |
|---|---|---|
| Mtoe | % | |
| Industry | 47.2 | 33.5 |
| Transport | 41.8 | 29.7 |
| Other | 22.6 | 16.1 |
| Non-energy use | 29.1 | 20.7 |
| Total energy consumption by use | 140.7 | 100 |
| Region or City | Climate Zone | The Annual Average Electrical Energy Consumed per Dwelling kWh/Dwelling | The Annual Average Energy Use Intensity kWh/m2 | Method | Building Type/Consumer | Date of Collection Data and Reference |
|---|---|---|---|---|---|---|
| Riyadh | 1 | 103,000–139,000 | 229–309 | simulation | Villa | Krarti [25] |
| Riyadh | 1 | 119,700 | 228 | simulation | Villa | Alaidroos and Krarti [21] |
| Tobuk | 2 | 96,000 | 183 | simulation | Villa | Alaidroos and Krarti [21] |
| Abha | 3 | 67,000 | 127.6 | simulation | Villa | Alaidroos and Krarti [21] |
| Qassim | 1 | 30,031 (max 82,500) | 92.6 | electricity bills and survey | dwelling | 2012–2014 Esmaeil et al. [28] |
| The middle zone of KSA | 1 | 49,690–52,250 | 131–138 | simulation | Villa | Almushaikah and Almasri [27] |
| KSA | 1, 2, 3 | 26,799–67,095 | 128.2–144.1 | simulation | Villa | Alardhi et al. [26] |
| KSA | 1, 2, 3 | 28,143 | - | statistical analysis | dwelling | 2017, [30] |
| KSA | 1, 2, 3 | - | 149.6 | statistical analysis | dwelling | 2017 Krarti et al. [31] |
| Dhahran | 1 | 52,500 | 150 | electricity bills and survey | Villa | 2012 Alrashed and Asif [32] |
| Dhahran | 1 | 35,300 | 176.5 | electricity bills and survey | dwelling | 2012 Alrashed and Asif [32] |
| Dhahran | 1 | 64,000 | 148.8 (72.5) * | simulation | Villa | Ahmed et al. [20] |
| Qassim | 1 | 29,155–34,448 | 50–60 | electricity bills and survey | dwelling | 2015–2018 Almasri et al. [29] |
| The central region of KSA | 1 | 22,000 | - | statistical analysis | consumer | 2017 [30] |
| 18,800–21,900 | - | statistical analysis | dwelling | 2017 and 2018 [33] | ||
| 19,000 | statistical analysis | consumer | 2018 [34] |
| Location | System Size kWp | Annual Yield Factor kWh/kWp/Year | Annual Capacity Factor % | LCOE $/kWh | Payback Years | Reference |
|---|---|---|---|---|---|---|
| Kuwait—Al-Wafra | 100 | 1922.7 | 21.6 | 0.1 | 15 | Hajiah et al. [41] |
| Kuwait—Mutla | 100 | 1861 | 22.25 | 0.1 | 15 | Hajiah et al. [41] |
| KSA—Qassim | 1000 | 2024.7 | 23.1 | 0.036 | 13.7 | Almarshoud [38] |
| KSA—Riyadh | 11.2 | 1890.9 | 21.5 | 0.0281 | 13.4 | Almushaikah and Almasri [27] |
| Oman | - | 1696.6 | 19.46 | 0.16 | - | Kazem and Khatib [42] |
| Oman | 1000 | 1875.1 | 22.37 | 0.23 | 10 | Kazem et al. [43] |
| Meknes—Morocco | 2.04 | - | 20.20–20.52 | 0.073–0.082 | 11.1–12.69 | Allouhi et al. [44] |
| UAE—Abu Dhabi | 111.4 | 1522 | 16.5 | - | 4.7 | Emziane and Al Ali [45] |
| UAE—Abu Dhabi | 50.4 | 1802 | 20 | - | 3.9 | |
| UAE—Abu Dhabi | 215.7 | 1325 | 14 | - | - | |
| UAE—Abu Dhabi | 994 | 1438 | 16 | - | 5.2 | |
| Palestine | 5 | 1756 | - | 0.13 | 4.9 | Omar and Mahmoud [46] |
| No. of Stories | 2 |
| U = 3.9 W/m2 K and U = 2.75 W/(m2 K) ( U = 2 time) | |
| Total Height | 9 |
| Ground Floor area | 245 m2 |
| First Floor area | 255 m2 |
| The total roof area | 233 m2 |
| Window area | 2.82% of the gross wall area |
| Glass type | Single-layer 5.8 W/(m2 K) |
| External wall | 2 cm external Plaster + 20 cm Hollow concrete block +2 cm internal plaster, Uwall = 3.9 W/(m2 K) |
| Roof | 5 cm Tiles + 20 cm concrete roof slab + 5 cm internal plaster, Uroof = 2.75 W/(m2 K) |
| Number of occupants | 9 |
| Thermal Insulation | Zone | U Values (W/m2 K) | |||
|---|---|---|---|---|---|
| Wall | Roof | Window | Door | ||
| SBC-602 | Zone-1 | 0.342 | 0.202 | 2.668 | 2.839 |
| Zone-2 | 0.397 | 0.238 | 2.668 | 2.839 | |
| Zone-3 | 0.453 | 0.273 | 2.668 | 2.839 | |
| SEC | All KSA | 1.75 | 0.6 | 2.9 | 5 |
| Base case | 3.9 | 2.75 | 5.8 | 5 | |
| Sector | FI ($/kWh) |
|---|---|
| Residential sector | 0.019 |
| Other Sectors | Determined by ECRA |
| Stage | System Size (kW) | Cost ($) |
|---|---|---|
| Initial inquiry | ≤50 | 40 |
| ≥50 | 133 | |
| Connection | ≤50 | 147 |
| ≥50 | 480 | |
| Total | ≤50 | 187 |
| ≥50 | 613 |
| Total Roof Area (m2) | Module Area (m2) | NO# of Panels | PV System Area (m2) | GRC (%) | System Capacity (kWp) |
|---|---|---|---|---|---|
| 233 | 2.2 | 46 | 101 | 43.3 | 18.4 |
| Thermal Insulation Requirements | Details of the System | U Values (W/m2 K) | Unit | QTY | Increment Unit Price $ | Sub-Total $ | Source |
|---|---|---|---|---|---|---|---|
| SEC | 20 cm insulated Hollow concrete block + Two side Plaster (walls) | 1.75 | m2 | 627 | 4 | 2508 | Local Suppliers |
| 5 cm polystyrene with the concrete (Roof) | 0.6 | m2 | 233 | 7 | 1631 | Local Suppliers | |
| Double Glazed (Windows) | 2.668 | m2 | 51 | 47 | 2397 | Local Suppliers | |
| Total of SEC ($) | 6536 | ||||||
| SBC-602 | 20 HCB + 8 CM EIFS + One Side plaster (walls) | 0.31 | m2 | 627 | 23 | 14,421 | Jotun Paints |
| 10 cm polystyrene with the concrete (Roof) | 0.2 | m2 | 233 | 11 | 2563 | Local Suppliers | |
| Double Glazed (Windows) | 2.668 | m2 | 51 | 47 | 2397 | Local Suppliers | |
| Total of SBC-602 ($) | 19,381 | ||||||
| Side | Walls Area (m2) | Windows Area (m2) |
|---|---|---|
| East | 208 | 14 |
| South | 115 | 10 |
| West | 188 | 15 |
| North | 120 | 12 |
| Item | Unit | QTY. | Unit Price $ | Total Price $ |
|---|---|---|---|---|
| PV module Type: Canadian Solar HiKu CS3W-400P | No. | 46 | 120 | 5520 |
| The mounting structure for 46 Modules including concrete blocks | L.S. | 1 | 1333 | 1333 |
| Grid-Inverter Type: Fronius Primo 5.0-1 | No. | 3 | 1707 | 5121 |
| Double pole DC Fuse holder with fuse rating 20/32 A 1000 Vdc | No. | 6 | 18 | 108 |
| DC surge protection device (SPD) Type 2, 1000 Vdc/40 KA | No. | 6 | 27 | 162 |
| Miniature circuit breaker 1 × 25 A | No. | 3 | 5 | 15 |
| Miniature circuit breaker 2 × 63 A | No. | 1 | 27 | 27 |
| AC SPD Type-2, 40 KA | No. | 1 | 27 | 27 |
| IP65 External Galvanized steel box size 30 × 40 cm | No. | 3 | 53 | 162 |
| AC Panel size 40 × 60, including busbars, ducts, terminals, wires … etc. | No. | 1 | 179 | 179 |
| DC wire 0.9/1.8 KVDC 6 sq.mm | M | 250 | 1.3 | 325 |
| PVC conduit 2 inch | M | 25 | 1.3 | 32.5 |
| XLPE cable 0.6/1 KVAC 3 × 6 sq.mm | M | 5 | 1.3 | 6.5 |
| XLPE cable 0.6/1 KVAC 3 × 16 sq.mm | M | 20 | 2.7 | 58 |
| MC4 connectors (male and female) | No. | 8 | 7 | 56 |
| Earthling system | L.S. | 1 | 180 | 180 |
| Installation | L.S. | 1 | 394 | 394 |
| Total Price of PV (capital Cost) $ | 13,707 | |||
| City | Thermal Insulation | Load Coverage Percentage % | NO# of Panels | System Capacity (kWp) | Panels Cost $ | Structure Cost $ | Inverter Cost $ | Electrical & BOS $ | Capital Cost $ |
|---|---|---|---|---|---|---|---|---|---|
| Riyadh | Base case | 45.2 | 46 | 18.4 | 5520 | 1333 | 5120 | 1733 | 13,707 |
| 40.3 | 41 | 16.4 | 4920 | 1185 | 4561 | 1544 | 12,210 | ||
| SEC | 77.0 | 46 | 18.4 | 5520 | 1333 | 5120 | 1733 | 13,707 | |
| 60.3 | 36 | 14.4 | 4320 | 1041 | 4005 | 1356 | 10,721 | ||
| 40.2 | 24 | 9.6 | 2880 | 694 | 2670 | 904 | 7148 | ||
| SBC-602 | 134.0 | 46 | 18.4 | 5520 | 1333 | 5120 | 1733 | 13,707 | |
| 99.0 | 34 | 13.6 | 4080 | 983 | 3783 | 1280 | 10,126 | ||
| 81.5 | 28 | 11.2 | 3360 | 809 | 3115 | 1054 | 8339 | ||
| 61.2 | 21 | 8.4 | 2520 | 607 | 2336 | 791 | 6254 | ||
| 40.8 | 14 | 5.6 | 1680 | 405 | 1558 | 527 | 4169 | ||
| Hail | Base case | 54.9 | 46 | 18.4 | 5520 | 1333 | 5120 | 1733 | 13,707 |
| 40.6 | 34 | 13.6 | 4080 | 983 | 3783 | 1280 | 10,126 | ||
| SEC | 93.0 | 46 | 18.4 | 5520 | 1333 | 5120 | 1733 | 13,707 | |
| 80.8 | 40 | 16 | 4800 | 1156 | 4450 | 1506 | 11,913 | ||
| 60.6 | 30 | 12 | 3600 | 867 | 3338 | 1130 | 8934 | ||
| 40.4 | 20 | 8 | 2400 | 578 | 2225 | 753 | 5956 | ||
| SBC-602 | 137.8 | 46 | 18.4 | 5520 | 1333 | 5120 | 1733 | 13,707 | |
| 98.8 | 33 | 13.2 | 3960 | 954 | 3671 | 1243 | 9828 | ||
| 80.9 | 27 | 10.8 | 3240 | 780 | 3004 | 1017 | 8041 | ||
| 59.9 | 20 | 8.5 | 2400 | 614 | 2364 | 800 | 6179 | ||
| 41.9 | 14 | 5.6 | 1680 | 405 | 1558 | 527 | 4169 | ||
| Abha | Base case | 121.2 | 46 | 18.4 | 5520 | 1333 | 5120 | 1733 | 13,707 |
| 97.5 | 37 | 14.8 | 4440 | 1070 | 4116 | 1393 | 11,019 | ||
| 79.0 | 30 | 12 | 3600 | 867 | 3338 | 1130 | 8934 | ||
| 60.6 | 23 | 9.2 | 2760 | 665 | 2559 | 866 | 6850 | ||
| 39.5 | 15 | 6 | 1800 | 434 | 1669 | 565 | 4467 | ||
| SEC | 161.4 | 46 | 18.4 | 5520 | 1333 | 5120 | 1733 | 13,707 | |
| 98.3 | 28 | 11.2 | 3360 | 809 | 3115 | 1054 | 8339 | ||
| 80.7 | 23 | 9.2 | 2760 | 665 | 2559 | 866 | 6850 | ||
| 59.7 | 17 | 6.8 | 2040 | 491 | 1891 | 640 | 5063 | ||
| 52.6 | 11 | 4.4 | 1320 | 318 | 1224 | 414 | 3276 | ||
| SBC-602 | 172.1 | 46 | 18.4 | 5520 | 1333 | 5120 | 1733 | 13,707 | |
| 97.3 | 26 | 10.4 | 3120 | 752 | 2893 | 979 | 7743 | ||
| 78.6 | 21 | 8.4 | 2520 | 607 | 2336 | 791 | 6254 | ||
| 59.9 | 16 | 6.4 | 1920 | 463 | 1780 | 602 | 4765 | ||
| 37.4 | 10 | 4 | 1200 | 289 | 1113 | 377 | 2978 |
| Base Case | SEC | SBC-602 | |
|---|---|---|---|
| Riyadh | 69% | 51% | 18% |
| Hail | 64% | 43% | 19% |
| Abha | 30% | 8% | 3% |
| City | Load Scenario | Building Energy Need kWh | PV Energy kWh | Load Coverage Percentage % | NO# of Panels | System Capacity (kWp) | PV System Area m2 | GRC % |
|---|---|---|---|---|---|---|---|---|
| Riyadh | Base case (23 °C) | 67,095 | 30,348 | 45.2 | 46 | 18.4 | 101.2 | 43.4 |
| 27,049 | 40.3 | 41 | 16.4 | 90.2 | 38.7 | |||
| SEC (23 °C) | 39,390 | 30,348 | 77.0 | 46 | 18.4 | 101.2 | 43.4 | |
| 23,750 | 60.3 | 36 | 14.4 | 79.2 | 34.0 | |||
| 15,833 | 40.2 | 24 | 9.6 | 52.8 | 22.7 | |||
| SBC-602 (23 °C) | 22,654 | 30,348 | 134.0 | 46 | 18.4 | 101.2 | 43.4 | |
| 22,430 | 99.0 | 34 | 13.6 | 74.8 | 32.1 | |||
| 18,472 | 81.5 | 28 | 11.2 | 61.6 | 26.4 | |||
| 13,854 | 61.2 | 21 | 8.4 | 46.2 | 19.8 | |||
| 9236 | 40.8 | 14 | 5.6 | 30.8 | 13.2 | |||
| Hail | Base case (23 °C) | 57,373 | 31,485 | 54.9 | 46 | 18.4 | 101.2 | 43.4 |
| 23,272 | 40.6 | 34 | 13.6 | 74.8 | 32.1 | |||
| SEC (23 °C) | 33,907 | 31,485 | 54.9 | 46 | 18.4 | 101.2 | 43.4 | |
| 27,379 | 80.8 | 40 | 16 | 88 | 37.8 | |||
| 20,534 | 60.6 | 30 | 12 | 66 | 28.3 | |||
| 13,689 | 40.4 | 20 | 8 | 44 | 18.9 | |||
| SBC-602 (23 °C) | 22,854 | 31,485 | 137.8 | 46 | 18.4 | 101.2 | 43.4 | |
| 22,587 | 98.8 | 33 | 13.2 | 72.6 | 31.2 | |||
| 18,481 | 80.9 | 27 | 10.8 | 59.4 | 25.5 | |||
| 13,689 | 59.9 | 20 | 8.5 | 44 | 18.9 | |||
| 9583 | 41.9 | 14 | 5.6 | 30.8 | 13.2 | |||
| Abha | Base case (23 °C) | 26,799 | 32,476 | 121.2 | 46 | 18.4 | 101.2 | 43.4 |
| 26,122 | 97.5 | 37 | 14.8 | 81.4 | 34.9 | |||
| 21,180 | 79.0 | 30 | 12 | 66 | 28.3 | |||
| 16,238 | 60.6 | 23 | 9.2 | 50.6 | 21.7 | |||
| 10,590 | 39.5 | 15 | 6 | 33 | 14.2 | |||
| SEC (23 °C) | 20,120 | 32,476 | 161.4 | 46 | 18.4 | 101.2 | 43.4 | |
| 19,768 | 98.3 | 28 | 11.2 | 61.6 | 26.4 | |||
| 16,238 | 80.7 | 23 | 9.2 | 50.6 | 21.7 | |||
| 12,002 | 59.7 | 17 | 6.8 | 37.4 | 16.1 | |||
| 10,590 | 52.6 | 11 | 4.4 | 24.2 | 10.4 | |||
| SBC-602 (23 °C) | 18,874 | 32,476 | 172.1 | 46 | 18.4 | 101.2 | 43.4 | |
| 18,356 | 97.3 | 26 | 10.4 | 57.2 | 24.6 | |||
| 14,826 | 78.6 | 21 | 8.4 | 46.2 | 19.8 | |||
| 11,296 | 59.9 | 16 | 6.4 | 35.2 | 15.1 | |||
| 7060 | 37.4 | 10 | 4 | 22 | 9.4 |
| Riyadh | Hail | Abha | |
|---|---|---|---|
| Annual Yield factor (kWh/kWp/year) | 1649 | 1711 | 1765 |
| Annual Capacity factor (CF) (%) | 18.8 | 19.5 | 20.1 |
| City | System Capacity kWp | Jan | Feb | Mar | Apr | May | Jun | Jul | Aug | Sep | Oct | Nov | Dec | Average |
|---|---|---|---|---|---|---|---|---|---|---|---|---|---|---|
| Riyadh | 18.4 | 2213 | 2423 | 2651 | 2501 | 2430 | 2444 | 2544 | 2584 | 2641 | 2881 | 2686 | 2349 | 2529 |
| Hail | 2301 | 2439 | 2823 | 2880 | 2830 | 2754 | 2791 | 2776 | 2667 | 2687 | 2240 | 2297 | 2624 | |
| Abha | 2906 | 2319 | 2752 | 2563 | 2583 | 2442 | 2379 | 2406 | 2687 | 3253 | 3208 | 2977 | 2706 |
| Thermal Insulation | Riyadh (Zone 1) | Hail (Zone 2) | Abha (Zone 3) | |||||
|---|---|---|---|---|---|---|---|---|
| Saved Energy kWh/Year | Unified PV Energy kWh/Year | En kWh/Year | Saved Energy kWh/Year | Unified PV Energy kWh/Year | En kWh/Year | Saved Energy kWh/Year | Unified PV Energy kWh/Year | |
| Base Case | 0 | 30,348 | 57,373 | 0 | 31,485 | 26,799 | 0 | 32,476 |
| SEC | 27,705 | 33,907 | 23,466 | 20,120 | 6679 | |||
| SBC-602 | 43,283 | 22,854 | 34,519 | 18,874 | 7925 | |||
| City | Thermal Insulation | PV Production | Surplus Energy | Used Energy (0.048 $/kWh) | FIT 0.019 $/kWh | First-Year Saving $ | ||
|---|---|---|---|---|---|---|---|---|
| Energy kWh | Money-Saving $ | Energy kWh | Money-Saving $ | |||||
| Riyadh | Base case | 30,348 | 0 | 30,348 | 1457 | 0 | 0 | 1457 |
| SEC | 0 | 30,348 | 1457 | 0 | 0 | 1457 | ||
| SBC-602 | 6535 | 23,812 | 1143 | 6535 | 124 | 1267 | ||
| Hail | Base case | 31,485 | 0 | 31,485 | 1511 | 0 | 0 | 1511 |
| SEC | 0 | 31,485 | 1511 | 0 | 0 | 1511 | ||
| SBC-602 | 8631 | 22,854 | 1097 | 8631 | 164 | 1261 | ||
| Abha | Base case | 32,476 | 5677 | 26,799 | 1286 | 5677 | 108 | 1394 |
| SEC | 12,356 | 20,120 | 966 | 12,356 | 235 | 1201 | ||
| SBC-602 | 13,602 | 18,874 | 906 | 13,602 | 258 | 1164 | ||
| City | Thermal Insulation Requirements at (23 °C) | Saved Energy from Building Energy Need in the Base Case (kWh/Year) | First-Year Saving $ |
|---|---|---|---|
| Riyadh | SEC | 27,705 | 1330 |
| SBC-602 | 43,283 | 2078 | |
| Hail | SEC | 23,466 | 1126 |
| SBC-602 | 34,519 | 1657 | |
| Abha | SEC | 6679 | 321 |
| SBC-602 | 7925 | 380 |
| City | System Thermal Insulation | NPV $ |
|---|---|---|
| Riyadh | SEC | 18,953 |
| SBC-602 | 20,443 | |
| Hail | SEC | 15,044 |
| SBC-602 | 12,375 | |
| Abha | SEC | −384.1 |
| SBC-602 | −12,098 |
| City | GHG Emissions Reduction (tCO2) | ||
|---|---|---|---|
| SEC | SBC-602 | Unified PV Systems | |
| Riyadh | 19.6 | 31.4 | 22.9 |
| Hail | 16.6 | 24.4 | 23.8 |
| Abha | 4.7 | 5.6 | 24.5 |
Publisher’s Note: MDPI stays neutral with regard to jurisdictional claims in published maps and institutional affiliations. |
© 2021 by the authors. Licensee MDPI, Basel, Switzerland. This article is an open access article distributed under the terms and conditions of the Creative Commons Attribution (CC BY) license (http://creativecommons.org/licenses/by/4.0/).
Share and Cite
Almasri, R.A.; Alardhi, A.A.; Dilshad, S. Investigating the Impact of Integration the Saudi Code of Energy Conservation with the Solar PV Systems in Residential Buildings. Sustainability 2021, 13, 3384. https://doi.org/10.3390/su13063384
Almasri RA, Alardhi AA, Dilshad S. Investigating the Impact of Integration the Saudi Code of Energy Conservation with the Solar PV Systems in Residential Buildings. Sustainability. 2021; 13(6):3384. https://doi.org/10.3390/su13063384
Chicago/Turabian StyleAlmasri, Radwan A., Abdullah A. Alardhi, and Saad Dilshad. 2021. "Investigating the Impact of Integration the Saudi Code of Energy Conservation with the Solar PV Systems in Residential Buildings" Sustainability 13, no. 6: 3384. https://doi.org/10.3390/su13063384
APA StyleAlmasri, R. A., Alardhi, A. A., & Dilshad, S. (2021). Investigating the Impact of Integration the Saudi Code of Energy Conservation with the Solar PV Systems in Residential Buildings. Sustainability, 13(6), 3384. https://doi.org/10.3390/su13063384