Abstract
The contradiction between population and cultivated land has always been an urgent global problem, and one that is particularly prominent in China. Based on the spatial–temporal evolution of cultivated land, this paper discusses the human–land contradiction and its development trend. Then, according to the threshold of human–land contradiction and different protection objectives, the priority protection area of cultivated land was simulated. The results showed that: (1) the cellular automata (CA)–Markov model is suitable for the study area. The cultivated land in the study area increased at a rate of 4.40 sq km per year; (2) the spatial and temporal change in the cultivated land in Songpan was the largest. The center of gravity of cultivated land is moving to the northeast, and the moving rate is increasing year on year; (3) 90% of the study area was in the human–land coordination and the change in the ratio of accumulation and cultivation in some areas (such as Songpan) is increasing, making the human–land contradiction worse; (4) under a protection target of 25–100%, the priority protection area of cultivated land increased from 2.05 × 10³ km2 to 3.46 × 10³ km2, and the patch aggregation degree was strengthened. This study was of great significance for optimizing the distribution of cultivated land and promoting the sustainable development of land resources.
1. Introduction
In 2015 (the thirteenth Five-Year Plan), President Xi Jinping set the goal of eradicating poverty in China by 2020. The key areas of poverty alleviation and development in China are rural areas, especially in remote mountainous areas. Mountainous areas are rich in mineral resources, animal and plant resources, water resources, land resources and other natural resources, but the utilization rate of these resources is relatively low because their geographical location makes the material exchange between local villagers and the outside world difficult. Hence, most villagers remain in a state of self-sufficiency [1]. After the target of poverty alleviation was determined, these areas vigorously adopted new urban construction, developed tourism resources, and set up factories and other measures to promote local economic development. [2]. At present, many millions of China’s rural poor (as many as 55.75 million) have been lifted out of poverty, officially achieving the economic development goal of building a moderately prosperous society in an all-round way (The Fourteenth Five-Year Plan). The promotion of urbanization and industrialization has played a positive role in the economic development of mountainous environments, but these large-scale livelihood measures have inevitably caused an unreasonable allocation of land resources and the destruction of the ecological environment, as well as other negative effects, especially related to land resources [3].
The protection of land resources, especially cultivated land, is vital to sustainable development in China because land resources are non-renewable [4]. The contradiction between the population and the cultivated land has always been an urgent global problem, but it is particularly prominent in China where the population base is huge and per capita cultivated land is far lower than the world average [5,6]. As Chen [7] point out, “China only cultivates 7% of the world’s arable land but feeds 21% of the world’s population.” Hence, the security of land resources is an increasingly serious problem in China [8]. The problem involves contradiction between the supply and demand of cultivated land, shortages of reserve resources, the imbalance of land use, the natural degradation of cultivated land, environmental pollution, and reduced land capacity [9,10,11,12]. Especially in recent years—due to the increase in population, urban construction and ecological transformation and other factors—China’s cultivated land area is decreasing and the contradiction between people and land is becoming more urgent. Even in mountainous areas with abundant cultivated land resources, there is a contradiction between people and land.
The main problem of cultivated land resources in rural areas resources is the coordination of economic development and cultivated land protection. On the one hand, the promotion of urbanization of rural areas will lead to less cultivated land to a certain extent. The increase in construction land and population means China’s cultivated land crisis has become increasingly serious. The per capita cultivated land area has increased from 1.59 hectares in 1996 to 1.47 hectares in 2016. As a traditional agricultural country, China’s per capita cultivated land area is only 1/2 of the world average (3.38 hectares) [13]. The total cultivated land area has approached the national red line of 120 million hectares [14]. On the other hand, the distribution of cultivated land is uneven. Most of it is distributed in rural areas, which are rich in cultivated land resources. The cultivated land is scattered in mountainous areas and the distribution of cultivated land is high above sea level. To eradicate poverty, China has sacrificed cultivated land resources for economic growth, which has meant that cultivated land has not received due attention [13]. Therefore, it is of great strategic significance to carry out farmland protection swiftly and accurately.
Most of the research studies on cultivated land have concentrated on plain and typical agricultural areas, such as the Yangtze River economic belt [15], the Huang Huai Plain [16], the Three Gorges Reservoir area [17], and the Songnen Plain [18]. However, there is still a lack of research on cultivated land in mountainous areas. Furthermore, the research on cultivated land mainly focuses on the transformation of cultivated land, the output efficiency of cultivated land resources [19], the ecosystem service value [20], soil texture [21], degradation of cultivated land [22], the driving mechanism of cultivated land-utilization [23,24], etc., and less on the protection of cultivated land in mountainous areas.
In general, there is a lack of research on rural cultivated land in mountainous areas, especially on the contradiction between people and land in circumstances of affluence, and the protection of cultivated land in mountainous areas. Therefore, the objective analysis of the use of cultivated land in the process of poverty alleviation in mountainous areas, the contradiction between people and land caused by the changes in cultivated land, and the reasonable protection of cultivated land are important issues to promote urbanization, achieve an all-round well-off society, and ensure sustainable development. The Fourteenth Five-Year Plan puts forward such plans as “giving priority to the development of agriculture and rural areas, comprehensively promoting rural revitalization”, “optimizing the land spatial layout, promoting regional coordinated development and new urbanization”, “promoting green development, and promoting the harmonious coexistence of human and nature”. On the basis of sustainable development, the purpose is to maximize the benefit with the least resources and improve the living standard of the people. Therefore, the use and protection of cultivated land resources is more cautious.
Given this, it is very important to understand the changes in cultivated land, the protection of the human–land relationship, and the ecology of mountainous areas. In this context, our research objectives are (1) to simulate and predict the future development trend of land use based on the current land-use situation; (2) to explore the temporal and spatial evolution of cultivated land; (3) to analyze the contradiction between people and land in the face of changes in cultivated land; (4) to build a model of cultivated land priority protection according to human–land contradiction, and to explore the priority protection areas of cultivated land under different protection objectives. The research results will be helpful to deepen and improve the theoretical basis of this research field and to provide quantitative guidance for the optimal allocation and rational utilization of cultivated land resources in mountainous areas.
2. Materials and Methods
2.1. Study Area
The upper reaches of the Minjiang River (Figure 1) are located in the northwest of Sichuan, connecting the Chengdu Plain and the Qinghai Tibet Plateau. It is not only a transitional zone between Han and Tibet but also an important transportation corridor and hub between Sichuan and Tibet. The terrain inclines from northwest to southeast, and the relative height of the ridges and valleys is 1500–3000 m. The highest elevation in the area is Mount Siguniang (6250 m); the lowest the southeastern Xuankou area (780 m). The geological structure of this area—which mainly developed as a result of its position on the Longmen Mountains NE, Barkam NW, and Minjiang NS tectonic—is complex and consists of a large number of folds and faults. Through internal and external forces and extreme weather, geological hazards are easily induced [25]. The upper reaches of the Minjiang River, in the region of a plateau-type monsoon climate, have obvious dry and wet seasons, large daily temperature differences, and small annual temperature differences. Under the combined influence of atmospheric circulation and alpine gorge topography, this area exhibits dual characteristics (horizontal and vertical zonality) [26]. Soil with high-erosion intensity and serious degradation significantly restricts developments in agriculture [27].
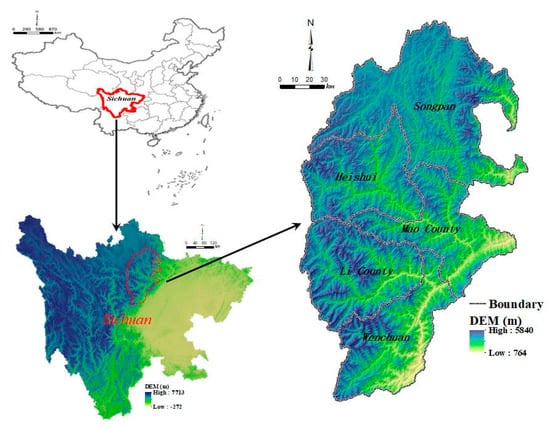
Figure 1.
Location of the study site.
The geographical environment of high mountains and deep valleys, the characteristics of rich climate and vegetation, and the cultural phenomenon of a multi-ethnic community living together give this area a unique and magical settlement landscape, while the remote and closed geographical and traffic environment challenges it with great poverty. Therefore, the research area has always been a key area of poverty alleviation in China. In 2018, Mao County, Li County, and Wenchuan were officially withdrawn from the list of poverty-stricken counties. Songpan was withdrawn in 2019. Since then, due to faulty leadership in Li County and unreasonable land use, problems have emerged in the local economy [28]. Therefore, it is necessary to study and protect the land resources in the study area.
2.2. Method
Our purpose was to understand the development of existing cultivated land, infer its development trend according to the current situation of cultivated land, and analyze the contradiction between man and land under the spatiotemporal evolution of cultivated land. Then, according to the contradiction between human and land, the cultivated land protection model was constructed, and the priority protection areas of cultivated land under different protection objectives were discussed.
2.2.1. Predicting the Future Distribution of Cultivated Land
Wang [29] pointed out that the transformation in the use of cultivated land must balance ecology and economy and pay attention to the coupling and coordination of humans and land. To analyze the temporal and spatial changes of cultivated land, the first the understanding of the transformation and development trend between cultivated land and other land types is required. Based on changes in land use in the past, trends in land use into the future can be predicted [30]. At present, the prediction of land use change mainly uses quantitative prediction model and spatial prediction model. [31]. In simulating the spatial–dynamic evolution, the cellular automata (CA) model has obvious advantages in simulating the complex state and spatial–temporal evolution of the region, while the Markov model has obvious advantages in the simulation and prediction of the evolution quantity of land-use types [32]. Therefore, the combination of the CA and Markov models enables the full utilization of their respective advantages and ensures the precision and credibility of the simulation and prediction regarding land-use types [33]. In the current study, the CA–Markov model systematically produced a set of suitability maps to express the probability of a land parcel (pixel) of a given land-use class in changing to the targeted land-use class [34]. Two transition probability matrices were built using the Markov chain model to estimate the magnitude of land expansion for 2015 (by the interpretation of changes from 1995 to 2005 (calibration phase)) and 2025 (by implementing the 1995 and 2015 as the earlier and later land use maps, respectively (prediction phase)).
2.2.2. Spatial–Temporal Evolution of Cultivated Land
The spatial–temporal evolution of cultivated land mainly adopts the standard deviational ellipse (SDE) algorithm [35]. The SDE algorithm was proposed by D. Welty Lefever, Professor of Sociology at the University of Southern California, in 1926. This algorithm can reveal the spatial distribution characteristics and evolution process of research objects from the perspectives of the gravity center, distribution range, density, direction, and shape [36]. To account for changes in the mean center over the whole study period, the SDE method was employed. SDE gives a quantitative assessment of changes in the trajectories of the changes in cultivated land over the study period. Statistically, for each study period, SDE calculates the standard deviation of any location, represented in x and y coordinates, from the mean center of the location, illustrating these deviations in an ellipse with a diameter up to one standard deviation. This ellipse has a directional axis, expressed in degrees, which defines the spatial orientation of cultivated land changes for this specific period. This method allows us to quantitatively define changes in the trajectory of the main change center of the cultivated land between the different periods. These ellipses also give a visual inspection of changes in the trajectories of cultivated land that have changed over time.
The first step in this process is to determine the center of the circle. The distribution of the center of the ellipse is directly calculated by the following formula:
where SDEx and SDEy are the center of the ellipse finally calculated. Xi and Yi are the spatial position coordinates of each element, and , are the arithmetic mean centers. n is the total number of elements. Then, the direction of the ellipse is determined. Taking the x axis as the reference, the due north (12 o’clock direction) is 0 degree, and rotate clockwise. The calculation formula is as follows:
where , are the differences between the average center and the X, Y coordinate. Finally, the length of the x axis () and y axis () are determined:
2.2.3. Analysis Method of Contradiction between Man and Land
Luo [37] thinks that slope farmland is the result of coupling and a coordinated evolution of humans and land in mountainous areas. Against the backdrop of different historical conditions, a landscape pattern with obvious temporal and spatial differences has formed [38]. To understand the coordination relationship between humans and land, the spatial coupling between settlement and cultivated land is analyzed based on a grid—that is, the ratio of the settlement area and cultivated land area falling into each grid:
where K is the spatial index of the ratio of the grid to the cultivated land; Ssettlement is the settlement area in the cell net; Scultivatedland is the cultivated land area in the cell net. The larger the K-value is, the larger the settlement area, the less cultivated the land resources, and the more prominent the contradiction between people and land; the smaller the K-value is, the more abundant the cultivated land resources and the more harmonious the contradiction between people and land.
K indicates the relationship between the population and cultivated land. The study area was divided into a 1 km × 1 km grid; the cultivated land area and settlement area of each grid were counted, and the K of each grid unit was calculated. The ratio of the world’s per capita construction land area (83 sq m) to the world’s per capita cultivated land area (1920 sq m) was set as the human–land coordination threshold of 0.04. According to the World Food and Agriculture Organization’s per capita cultivated land warning line (533.3 sq m) and the rural per capita construction land scope (150 sq m) of China’s new urbanization construction, the human–land contradiction threshold is 0.28. When K < 0.04, there are fewer people and more land, and the contradiction between people and land is minimal or even non-existent. When 0.04 ≤ K < 0.28, a human–land coordination type exists and the relationship between humans and land is relatively balanced; when K ≥ 0.28, there are more people with fewer lands and the contradiction between people and land is prominent.
2.2.4. Optimal Protection of Cultivated Land
China has a population of 1.4 billion. Stabilizing the quantity and quality of cultivated land is the basis of ensuring food security, which is very important to the national economy and people’s lives [39]. Consequently, the protection of cultivated land is the basis of ensuring national food security and livelihood [40]. The Marxan model, which is a systematic conservation model, uses a minimum-set approach to identify the protected areas of planning units that achieve conservation targets at a near-minimal cost [41]. The Marxan model can be used to design new locations for systematic nature protection planning [42]. Therefore, the Marxan model was used as an effective tool to construct priority conservation areas for cultivated land based on the spatial distribution of the K-index in the upper reaches of the Min River, China. The objective function in Marxan is designed so that the lower the value the better; Marxan’s objective function calculates the total cost associated with a set of planning units as
where PUs refers to planning units and Cost is economic cost, which can be replaced by socio–economic factors. BLM refers to boundary length modifier. The BLM is a weight used to control the spatial aggregation of planning units, and boundary is the length boundary surrounding the reserve system. Penalty refers to punishment for failure to achieve protection objectives, SPF to conservation feature penalty factor. The SPF weighs the cost associated with the failure to meet the representation target of each conservation feature specified, the conservation feature in this study was the cultivated land.
The parameter BLM plays an important role in the spatial configuration of systematic conservation for cultivated land. Priority conservation areas for a vegetation habitat with a shorter total boundary will be easier and less expensive to manage [43]. With the strengthening of human activities and social and economic development, the use of cultivated land has gradually changed from the traditional small-scale cultivated land to large-scale intensive management. Under the multiple pressures of food security, economic development and ecological protection, the centralized management and utilization of cultivated land has become an inevitable choice for human land use. Therefore, according to the actual situation, the cultivated land with an area of more than 5 sq km must be set as the patch that must be protected. According to the site selection of cultivated land and the operability of later protection, the cost is constructed by the distance from road and water system and the relative elevation (Table 1). Therefore, we calculated the optimal BLM (BLM = 0.003 in this study) and the optimal number of iterations (iterations = 17) by R, then analyzed the priority protected areas of cultivated land under different protection objectives.

Table 1.
Cost data.
2.3. Data Sources
In this study, land-use data, meteorological data, geological map, statistical yearbooks, and a digital elevation model (DEM) were selected after considering the regional scope, object, and content of the study (Table 2). China’s Center for Resources Satellite Data and Applications (CRESDA) provided the remote sensing datasets of the GF-1 in 2015. The well-classified landscape dataset of the study areas in 1995, 2010, and 2015 was provided by RESDC (Chinese Academy of Science). The land-use types included six primary types and 25 secondary types, with a resolution of 10 m. This study selected the precipitation observation daily data from 11 meteorological stations in the research region from 1999 to 2016. The data were provided by the Aba Meteorological Bureau. Topographic maps and the digital elevation model (DEM) were mainly used to extract the river, road, and elevation data, and to calculate the cost of protecting cultivated land. This study also contains information obtained from field research.

Table 2.
Data sources.
3. Result and Discussion
3.1. Forecast Results of Land Use
With the employment of a land use map, the transition probability area matrix of probable land change between 1995 and 2005, the predefined 5×5 contiguity filter and the 2005 map as the initial land-cover map, the CA–Markov model was executed to simulate the changes in the land in 2015. The resultant land use map was compared with reference land areas (Resources and Environmental Sciences and Data Center, China) to evaluate the performance of the model in the simulation of the land change. The prediction phase was also performed to predict land expansion up to 2025 based on the corresponding transition probability area matrices derived from both CA–Markov analysis and the 2015 map as the initial land-cover map. Accordingly, all maps obtained overall accuracy (OA) and the Kappa coefficients (KC) reached 0.883 and 0.865, respectively, indicating an acceptable level of accuracy regarding the image classification procedure (Figure 2).
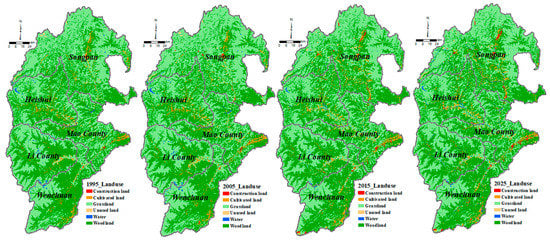
Figure 2.
Spatial–temporal evolution of land.
It can be seen from the figure that grassland and woodland are the dominant patches in the study area, and they are widely distributed. Cultivated land is mainly scattered along the river. Further analysis (Figure 3) showed that grassland decreased at the rate of 18.44 sq km per year, and the reduced grassland was converted into other types of land. The average growth rate of the water system was 5.81 sq km per year, and the increased amount was 174.45 sq km; the growth rate of the forest land was the slowest, which was 1.94 sq km per year. Cultivated land was the third-largest component of the study area, and its growth rate was next only to forest land, which was 4.40 sq km per year.
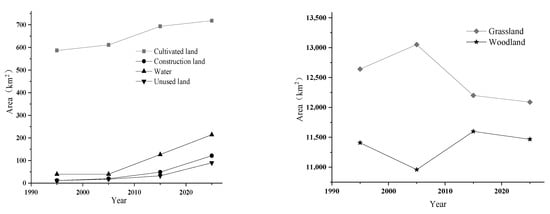
Figure 3.
Area evolution of the different land types.
On the whole, in recent years, the change of cultivated land in these areas was small, showing a relatively stable trend, and even the trend of increasing cultivated land in some areas. There is a close relationship between the change of cultivated land and the current level of economic development in these areas. The sustainable livelihoods framework proposed by the United Kingdom’s Department for International Development reflects the importance of livelihoods [44]. Hao’s research proves that livelihood capital is the key driving factor for changes in the use of cultivated land [45]. The study area is not only a fragile ecological environment but also an economically backward area with serious environmental problems. Therefore, to improve the livelihood of farmers and promote economic development, it is necessary to formulate effective farmland use and environmental protection policies [46].
3.2. Analysis of Spatial–Temporal Evolution of Cultivated Land
The SDE method can reflect the spatial distribution of cultivated land from many aspects. By comparing the area of standard deviation ellipse, the change in cultivated land spatial distribution can be seen [17]. The major axis and minor axis of the standard deviation ellipse represent the major and minor trend direction of cultivated land distribution, respectively. The standard deviation ratio of the short axis to the long axis can reflect the spatial shape of a cultivated land distribution. The change direction of cultivated land can reflect the main azimuth.
The distribution of cultivated land in each direction (Figure A1, see Appendix A) can be obtained by superposing the cultivated land patches and directional elements every year (Figure 4). The cultivated land of Heishui is mainly distributed in the east and northeast, and its area is more than 80% of the total area. The cultivated land of Li County is mainly distributed in the northeast direction, accounting for more than half of the total area, and a few are distributed in the northwest and north direction. The cultivated land in Mao County was mainly distributed in the northwest and the northeast, accounting for more than 50% of the total area. A small part of the cultivated land is distributed in the north. The cultivated land in Songpan is widely distributed in almost every direction, but mainly in the south, southeast, north and west. The cultivated land in Wenchuan is mainly distributed in the southwest and south direction, and there is almost no distribution in other directions. In general, the distribution direction of cultivated land in Li County and Mao County has almost no change, while Heishui and Wenchuan have gradually increased based on the original; Songpan has the biggest change, and the cultivated land in all directions has changed.
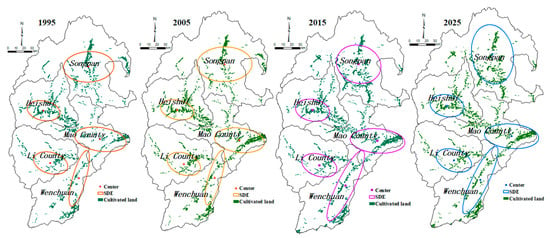
Figure 4.
Spatial–temporal evolution of cultivated land.
From the trajectory of the gravity center (Figure 5), Songpan has changed the most, followed by Wenchuan and Mao County. Heishui and Li County have changed little. From 1995 to 2005, the center of gravity of cultivated land in Songpan moved 2.58 km to the northeast. By 2015, its center of gravity had moved 6.2 km to the northwest. After 2015, its center of gravity moved westward, and its moving distance reached 13.96 km. On the whole, the gravity center of cultivated land in Songpan moved to the northeast, and the moving rate is increasing year on year. The change in the cultivated land gravity center in Wenchuan is second only to Songpan, and the whole is moving to the northeast. The center of gravity of cultivated land in Wenchuan moved westward from 1995 to 2005, with a moving distance of 2.15 km. From 2005 to 2015, the center of gravity of cultivated land changed greatly, moving eastward by 12.4 km, and the moving rate was six times that of the previous 10 years. After 2015, the transfer rate of the cultivated land gravity center in Wenchuan slowed down, only moving 1.6 km to the west. The center of gravity of cultivated land in Mao County moved southward as a whole. As a whole, the change in the cultivated land gravity center in Li County and Heishui was the smallest. The gravity center of the cultivated land in Li County moved southward from 1995 to 2005, at a relatively fast speed of 1.01 km in 10 years. After 2005, it moved northward and the speed was slow. It moved 0.72 km between 2005 and 2015, and only 0.31 km between 2015 and 2025. On the whole, after 2025, the cultivated land gravity center of Li County will move in the same direction as 1995, and the two are not far apart. Although the center of gravity of Heishui has not changed as much as that of Li County, Heishui is moving westward as a whole.
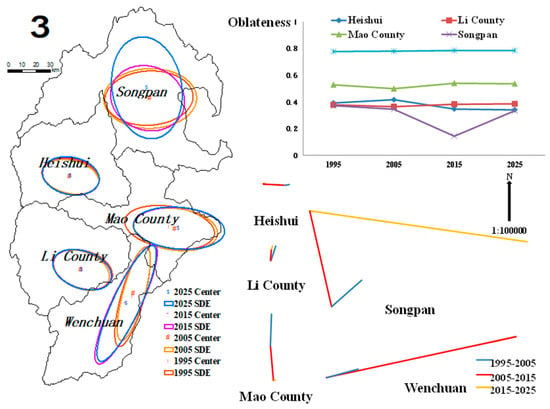
Figure 5.
Evolution of the cultivated land gravity center.
3.3. Analysis of the Contradiction between Man and Land
According to the statistical data, the K-value of the study area in 2015 was 0.070137, indicating that the cultivated land was very rich. Because of the fragile ecological environment in the study area, the government carried out ecological protection measures such as returning farmland to forest and grassland, resulting in a large loss of cultivated land. Based on the above coupling model and coordination threshold, as well as the spatial distribution map of K (Figure 6) and grid statistics (Table 3) according to the threshold, it can be seen that:
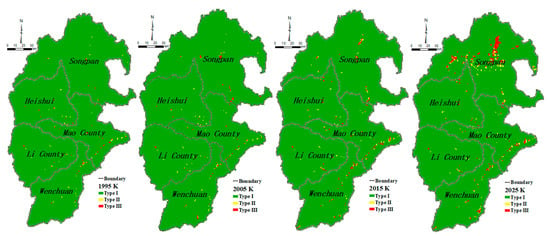
Figure 6.
The evolution of K.

Table 3.
The changes of K in different periods.
(1) There is a close relationship between the spatial distribution of settlements and cultivated land in the study area, and the spatial distribution of the ratio of accumulation to cultivated land is higher in the north and lower in the south. Type I accounted for more than 95%, which was a typical type of “fewer people and more land.” On the whole, Heishui and Li County have the highest degree of human–land coordination, followed by Mao County and Wenchuan, while Songpan has the largest change in the ratio of accumulation and cultivation, and the contradiction between humans and land is gradually becoming prominent.
(2) In Songpan, Type I decreased slowly, and the decreasing speed was increasing year on year. The area base of Type II and Type III is small, but the highest growth rate is four and five times that of the previous period, respectively. In recent years, the focus of the government work mainly lies in the solid promotion of major ecological-protection projects, such as the construction of the “Baili Shan Gallery,” comprehensive management of the Minjiang River Basin, large-scale greening of the whole county, and strengthening the protection and construction of the Minjiang River source, the National Wetland Park. Songpan is striving for the goal of a “plateau ecological home, international tourist resort.” Under these measures, a large number of limited cultivated lands are being converted into other land types, thus aggravating the human–land contradiction.
(3) The areas with a serious contradiction between humans and land are mainly distributed along roads, especially in Mao County and Wenchuan. Wenchuan is one of the most poverty-stricken areas in China and there are 88 poverty-stricken counties in Sichuan Province. The 12 May 2018 Wenchuan earthquake caused great losses in Wenchuan. The roads in the country, province, and countryside were all cut off, and the infrastructure (communication, water supply, power supply, etc.) was paralyzed, which made recovery more difficult. Later, to eradicate poverty, the Wenchuan government made great efforts to develop the economy and improve people’s incomes. It is understood that 90.5% of the economic income of Wenchuan comes from secondary and tertiary industries, and most of these industries are located in areas with convenient transportation. The construction of industries is bound to be at the expense of cultivated land. Mao County is the core area of Qiang nationality in China. The government is committed to accelerating the development of the tertiary industry to increase the income of rural residents. By the end of 2019, 80% of the county’s economic income came from tertiary industries. Wenchuan has also ignored the need to protect cultivated land while developing the economy, which has aggravated the human–land contradiction.
In the short run, the implementation of a strict farmland protection policy is still effective. At the same time, land-management departments should establish a scientific and effective farmland economic and ecological early warning system. In the long run, it is an urgent strategic problem to pay attention to the equilibrium between economic growth and changes in cultivated land resources at different stages of economic development, to master the causality and change trend, and to make timely adjustments to the land policy to meet the requirements of economic growth [14].
3.4. Results of Optimized Protection of Cultivated Land
Until now, the conservation targets for cultivated land have not been clear in the upper reaches of the Min River. In this study, different percentages of a cultivated land area in the whole basin were selected as the potential protection objectives of the priority-protection planning of cultivated land, based on the minimum demand of cultivated land when k = 0.28. The spatial priority of cultivated land in the watershed, from 25% to 100% of the total (Figure A2, see Appendix A), was simulated. The determined objectives reflect the spatial characteristics of priority-protected areas, especially to bring more suitable cultivated land into the basin-protection network. The selected target can also be used as a protection threshold to prevent fragmenting cultivated land and to ensure its high compactness. The priority conservation areas identified for cultivated land under different percentages of the total amount of cultivated land area (25% to 100%) (Figure 7) ranged from 57.37% to 96.97% of the landscape area with the boundary length effect. The number of conservation area patches increased as conservation targets increased from 2.05 × 10³ km2 to 3.46 × 10³ km2 target levels, and as the priority conservation areas for cultivated land became more extensive; the height also increased.
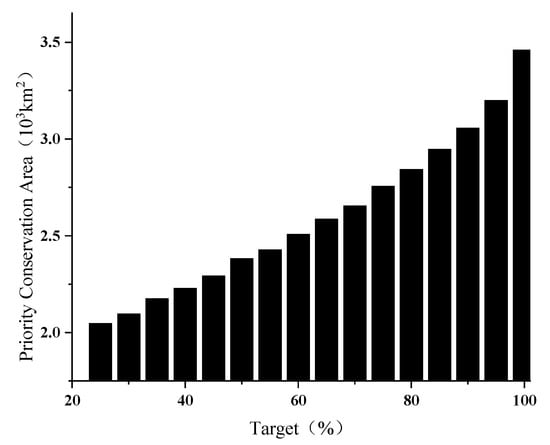
Figure 7.
Area of priority cultivated land under different protection objectives.
This may have been due to the configuration of the cultivated land map (Figure 8) and the inherent challenge of the optimization method to find the lowest-cost solution while meeting the conservation targets of cultivated land. However, the number of conservation patches increased from 60% to 100% conservation targets and the spatial structure of the priority conservation areas became more aggregated. In this study, the cost of the planning unit was assumed to only be affected by three factors. Further research is needed to investigate the effect of other socio-economic factors on priority conservation areas. For example, the impact of population growth and relevant government decisions could be considered. It is important to deal with the relationship between protecting cultivated land and making farmers rich. In future work, sustainable development-oriented cultivated land targets can be based on environmental protection knowledge and thresholds (e.g., threshold for grain demand) or other factors (e.g., government planning).
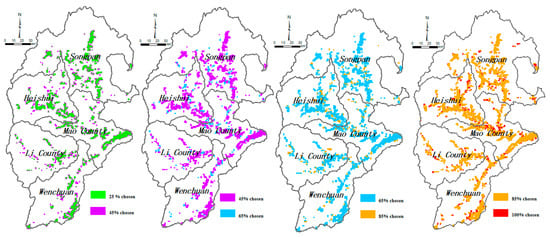
Figure 8.
Priority protection of cultivated land under different objectives.
China has adopted the measures of cultivated land renovation and land reclamation to realize the intensive use of land resources [47]. As well, China has begun to invest in farmland overseas to help ease the pressure of urbanization on its resources and alleviate the pressure related to food security [48]. The study area is rich in natural and human resources. In addition to protecting the production and ecological functions of cultivated land, we can also pay attention to the value of cultural diversity and choice. We can build and develop sightseeing agriculture and leisure agriculture, organize various agricultural activities, encourage tourists to participate in and experience agriculture, so as to enhance the understanding and support between tourists and farmers, improve the vitality of agriculture, and change the income mode of agriculture. At the same time, it also helps to improve the public’s understanding and support of rural natural landscape protection and farmland protection.
4. Conclusions
Here, the CA–Markov model was used to simulate the spatial and temporal distribution of land use in the upper reaches of the Minjiang River in Sichuan Province. Then, the contradiction between humans and land brought about by the changes in cultivated land was analyzed. Finally, according to the threshold of contradiction between humans and land and different protection objectives, the spatial priority protection area of cultivated land was simulated. Our major findings are as follows.
(1) Based on the data of 1995 and 2005, land use in 2015 was simulated. According to the accuracy test, the OA and KC were 0.883 and 0.865, respectively. The high simulation accuracy of the model indicates that the CA–Markov model is suitable for land-use simulation research in the study area. Then, land use in 2025 was simulated and predicted according to the data in 2005 and 2015. It was found that the grassland area decreased and the cultivated land and construction land increased, which affected the relationship between humans and cultivated land. As well, only the land-use transfer probability was used for simulation prediction, and so the influence of other factors needs to be further explored in the future.
(2) The spatial distribution of K is higher in the north and lower in the south. Songpan has the biggest change in the ratio of accumulation and cultivation, and the contradiction between people and land will intensify in the future. In future economic development, researchers should pay attention to the protection of cultivated land and reduce the contradiction between people and land. It is very important to strengthen the research of cultivated land area change and put forward constructive protection suggestions. The research conclusions will provide a reference value for mountain planning and government economic decision-making.
(3) Taking k = 0.28 as the threshold, the optimal protection of cultivated land under different protection objectives was simulated. The spatial priority conservation areas extended from the bottom of the mountain to the top of the mountain, and the larger percentage of total conservation areas was the continuous farmland.
To sum up, under the current trend, although the cultivated land in the study area is abundant, the contradiction between humans and land is becoming increasingly prominent. Under the conditions of more people and less land, the protection of cultivated land should be strengthened. It must not be neglected just because abundant cultivated land exists in some areas. The sustainable development of cultivated land should be guaranteed according to the specific local conditions while considering economic development.
Author Contributions
Q.W. conceived and designed the research method; L.C. completed the rest of the work. All authors have read and agreed to the published version of the manuscript.
Funding
This study was supported by Key Research and Development Projects of Sichuan Science and Technology Plan (No. 2019YFS0057), and National Natural Science Foundation of China (No. 41601088).
Institutional Review Board Statement
Not applicable.
Informed Consent Statement
Not applicable.
Data Availability Statement
The data presented in this study are available on request from the corresponding author.
Acknowledgments
The authors are grateful to the anonymous reviewers for their insightful and helpful comments that helped improve the manuscript.
Conflicts of Interest
The authors declare no conflict of interest.
Appendix A
Full details are given in Appendix.
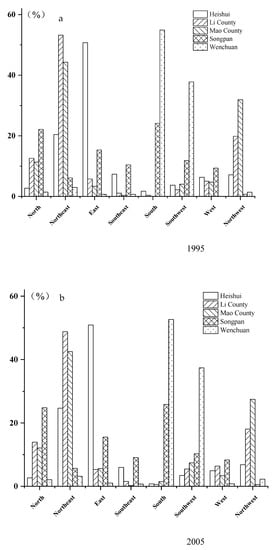
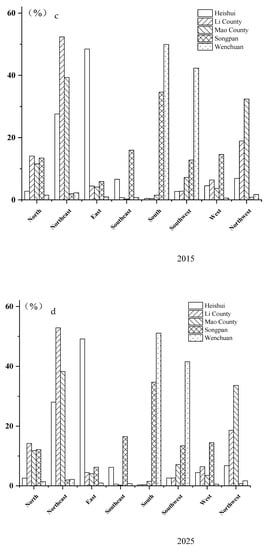
Figure A1.
Spatial distributions of cultivated land in the Upper Reaches of the Min River. (a): the distributions of cultivated land in each direction in 1995; (b): the distributions of cultivated land in each direction in 2005; (c): the distributions of cultivated land in each direction in 2015; (d): the distributions of cultivated land in each direction in 2025.
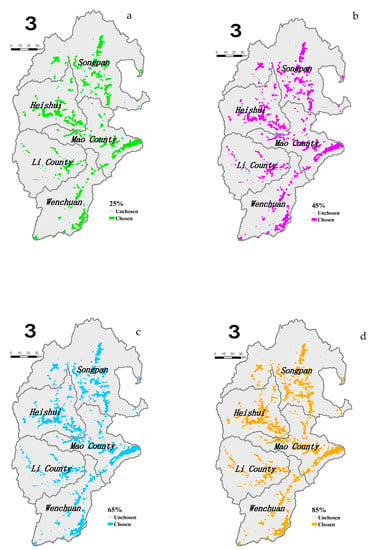
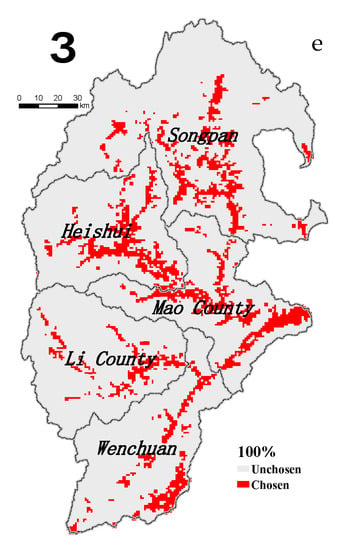
Figure A2.
The selection spatial distribution of priority conservation areas for cultivated land under 25%, 45%, 65%, 85%, and 100% conservation targets. (a): The selection spatial distribution of priority conservation areas for cultivated land under 25% conservation targets; (b): The selection spatial distribution of priority conservation areas for cultivated land under 45% conservation targets; (c): The selection spatial distribution of priority conservation areas for cultivated land under 65% conservation targets; (d): The selection spatial distribution of priority conservation areas for cultivated land under 85% conservation targets; (e): The selection spatial distribution of priority conservation areas for cultivated land under 100% conservation targets.
References
- Su, Y.; Qian, K.; Lin, L.; Wang, K.; Guan, T.; Gan, M. Identifying the driving forces of non-grain production expansion in rural China and its implications for policies on cultivated land protection. Land Use Policy 2020, 92, 104435. [Google Scholar] [CrossRef]
- Liu, Y.S.; Li, Y.H. Revitalize the world’s countryside. Nature 2017, 548, 275–277. [Google Scholar] [CrossRef]
- Liu, H.; Hao, H.; Hu, X.; Du, L.; Zhang, Z.; Li, Y. Livelihood diversification of farm households and its impact on cultivated land utilization in agro-pastoral ecologically-vulnerable areas in the Northern China. Chin. Geogr. Sci. 2020, 30, 279–293. [Google Scholar] [CrossRef]
- Bing, K.; Xinhai, L.; Min, Z.; Danling, C. Provincial cultivated land use efficiency in China: Empirical analysis based on the SBM-DEA model with carbon emissions considered. Technol. Forecast. Soc. Chang. 2020, 151, 119874. [Google Scholar]
- Long, H.; Qu, Y. Land use transitions and land management: A mutual feedback perspective. Land Use Policy 2018, 74, 111–120. [Google Scholar] [CrossRef]
- Li, J.; Zhang, C.; Zheng, X.; Chen, Y. Temporal-Spatial Analysis of the Warming Effect of Different Cultivated Land Urbanization of Metropolitan Area in China. Sci. Rep. 2020, 10, 2760. [Google Scholar] [CrossRef]
- Chen, Y.; Li, X.; Wang, L.; Wang, S. Is China different from other investors in global land acquisition? Some observations from existing deals in China’s going global strategy. Land Use Policy 2017, 60, 362–372. [Google Scholar] [CrossRef]
- Zhang, B.L.; Gao, J.B.; Gao, Y.; Cai, W.M.; Zhang, F.R. Land use transition of mountainous rural areas in China. Acta Geol. Sin. 2008, 73, 503–517. [Google Scholar]
- Xie, H.; Zou, J.; Jiang, H.; Zhang, N.; Choi, Y. Spatiotemporal pattern and driving forces of arable land-use Intensity in China: Toward sustainable land management using energy analysis. Sustainability 2014, 6, 3504–3520. [Google Scholar] [CrossRef]
- Duan, H.; Wang, T.; Xue, X.; Liu, S.; Guo, J. Dynamics of aeolian desertification and its driving forces in the Horqin sandy land, northern China. Environ. Monit. Assess. 2014, 186, 6083–6096. [Google Scholar] [CrossRef] [PubMed]
- Liu, Y.Q.; Long, H.L.; Li, J.L. Study on the land use transition and its cross-sensitivity of ecological service function in the Middle of Yangtze River Economic Belt. Geogr. Res. 2008, 37, 1009–1022. [Google Scholar]
- Liang, J.; Zhong, M.; Zeng, G.; Chen, G.; Hua, S.; Li, X.; Yuan, Y.; Wu, H.; Gao, X. Risk management for optimal land use planning integrating ecosystem services values: A case study in Changsha, middle China. Sci. Total Environ. 2017, 579, 1675–1682. [Google Scholar] [CrossRef]
- Guangxi land society. Reading Book of Cultivated Land Protection and Comprehensive Land Improvement; China Earth Press: Beijing, China, 2019; pp. 71–78. [Google Scholar]
- Han, H.B.; Zhang, X.Y. Exploring environmental efficiency and total factor productivity of cultivated land use in China. Sci. Total Environ. 2020, 726, 138434. [Google Scholar] [CrossRef]
- Luo, X.; Ao, X.; Zhang, Z.; Wan, Q.; Liu, X. Spatiotemporal variations of cultivated land use efficiency in the Yangtze River Economic Belt based on carbon emission constraints. J. Geogr. Sci. 2020, 30, 535–552. [Google Scholar] [CrossRef]
- Liu, Y.Q.; Long, H.L. Land use transitions and their dynamic mechanism in the Huang-Huai-Hai Plain. Acta Geol. Sin. 2016, 26, 515–530. [Google Scholar] [CrossRef]
- Liang, X.Y.; Li, Y.B. Spatio-temporal variation of farmland-fruit forest conversion and its enlightenment in Three Gorges Reservoir area: A case study on Caotangxi watershed. J. Nat. Resour. 2019, 34, 385–399. [Google Scholar]
- Yang, Y.; Zhang, Y.; Yang, Q.; Liu, J.; Huang, F. Coupling Relationship between Agricultural Labor and Agricultural Production Against the Background of Rural Shrinkage: A Case Study of Songnen Plain, China. Sustainability 2019, 11, 5804. [Google Scholar] [CrossRef]
- Grashof-Bokdam, C.J.; Cormon, A.; Polman, N.B.P. Modelling shifts between mono- and multifunctional farming systems: The importance of social and economic drivers. Landsc. Ecol. 2017, 32, 595–607. [Google Scholar] [CrossRef]
- Foley, J.A.; DeFries, R.; Asner, G.P.; Barford, B.C.; Bonan, G.; Carpenter, S.P. Global consequences of land use. Science 2005, 309, 570–574. [Google Scholar] [CrossRef]
- Shi, Y.Y.; Lv, X.; Huang, X.J. Arable land use transitions and its response of ecosystem services value change in Jiangsu Coastal Areas. J. Nat. Resour. 2017, 32, 961–976. [Google Scholar]
- Pan, H.; Liang, J. Facing the 3rd national land survey (cultivated land quality): Soil survey application for soil texture detection based on the high-definition field soil images by using perceptual hashing algorithm (pHash). J. Soils Sediments 2020, prepublish. [Google Scholar]
- Cai, H.; Ma, K.; Luo, Y. Geographical Modeling of Spatial Interaction between Built-Up Land Sprawl and Cultivated Landscape Eco-Security under Urbanization Gradient. Sustainability 2019, 11, 5513. [Google Scholar] [CrossRef]
- Zhang, H.; Zhang, Y.; Wu, S.; Cai, R. The effect of labor migration on farmers’ cultivated land quality protection. Sustainability 2020, 12, 2953. [Google Scholar] [CrossRef]
- Guo, Y.L.; Wang, Q.; Fan, M. Exploring the Relationship between the Arid Valley Boundary’s Displacement and Climate Change during 1999–2013 in the Upper Reaches of the Min River, China. ISPRS Int. J. Geo-Inf. 2017, 6, 146. [Google Scholar]
- Liu, S.Q.; Xie, F.T.; Zhang, H.Q.; Guo, S. Influences on rural migrant workers’ selection of employment location in the mountainous and upland areas of Sichuan, China. J. Rural. Stud. 2014, 33, 71–81. [Google Scholar] [CrossRef]
- Fang, Y.P.; Fan, J.; Shen, M.Y. Sensitivity of livelihood strategy to livelihood capital in mountain areas: Empirical analysis based on different settlements in the upper reaches of the Minjiang River, China. Ecol. Indic. 2014, 38, 225–235. [Google Scholar] [CrossRef]
- China Discipline Inspection and Supervision Daily. Available online: http://www.jjjcb.cn/content/2020-08/04/content_93496.htm (accessed on 17 October 2020).
- Wang, Q.; Li, Y.; Luo, G. Spatiotemporal change characteristics and driving mechanism of slope cultivated land transition in karst trough valley area of Guizhou Province, China. Environ. Earth Sci. 2020, 79, 1–8. [Google Scholar] [CrossRef]
- Hu, S.; Chen, L.; Li, L.; Zhang, T.; Yuan, L.; Cheng, L.; Wang, J.; Wen, M. Simulation of Land Use Change and Ecosystem Service Value Dynamics under Ecological Constraints in Anhui Province, China. Int. J. Environ. Res. Public Health 2020, 17, 4228. [Google Scholar] [CrossRef] [PubMed]
- Huang, B.Q.; Huang, J.L.; Pontius, R.G. Comparison of Intensity Analysis and the land use dynamic degrees to measure land changes outside versus inside the coastal zone of Longhai, China. Ecol. Indic. 2018, 89, 336–347. [Google Scholar] [CrossRef]
- Shafiezadeh, M.; Moradi, H. Evaluating and modeling the spatiotemporal pattern of regional-scale salinized land expansion in highly sensitive shoreline landscape of southeastern Iran. J. Arid. Land 2018, 10, 946–958. [Google Scholar] [CrossRef]
- Liang, X.; He, T.; Li, X.; Huang, J.L.; Clarke, K.C.; Yao, Y.; Guan, Q.; Hu, G. Modeling the dynamics and walking accessibility of urban open spaces under various policy scenarios. Landsc. Urban Plan. 2021, 207, 103993. [Google Scholar] [CrossRef]
- Lv, J.; Wang, Y.; Liang, X.; Yao, Y.; Ma, T.; Guan, Q. Simulating urban expansion by incorporating an integrated gravitational field model into a demand-driven random forest-cellular automata model. Cities 2021, 109, 103044. [Google Scholar] [CrossRef]
- Tris, E.; Dewi, S.; Dian, P.; Fajar, N. Standard Deviational Ellipse (SDE) models for malaria surveillance, case study: Sukabumi district-Indonesia, in 2012. Malar. J. 2012, 11 (Suppl. S1), 130. [Google Scholar]
- Al-Kindi, K.M.; Alkharusi, A.; Alshukaili, D. Spatiotemporal assessment of covid-19 spread over oman using GIS techniques. Earth Syst. Environ. 2020, 4, 797–811. [Google Scholar] [CrossRef]
- Luo, G.J.; Wang, S.J.; Li, Y.B.; Bai, X.Y. Spatio-temporal dynamics and ecological service function assessment of slope farmland in Karst areas of Guizhou province, China. Trans. Chin. Soc. Agric. Eng. 2014, 30, 233–243. [Google Scholar]
- Zhang, C.; Su, Y.; Yang, G.; Chen, D.; Yang, R. Spatial-temporal characteristics of cultivated land use efficiency in major function-oriented zones: A case study of Zhejiang Province, China. Land 2020, 9, 4. [Google Scholar] [CrossRef]
- Garcia, V.R.; Gaspart, F.; Kastner, T.; Meyfroidt, P. Agricultural intensification and land use change: Assessing country-level induced intensification, land sparing and rebound effect. Environ. Res. Lett 2020, 15, 085007. [Google Scholar] [CrossRef]
- Xinyuan, L.; Xiaobin, J.; Rui, S.; Bo, H.; Jing, L.; Yinkang, Z. A typical phenomenon of cultivated land use in China’s economically developed areas: Anti-intensification in Jiangsu Province. Land Use Policy 2021, 102. [Google Scholar] [CrossRef]
- Cook, R.R.; Auster, P.J. Use of simulated annealing for identifying essential fish habitat in a multispecies context. Conserv. Biol. 2005, 19, 876–886. [Google Scholar] [CrossRef]
- Cudlín, O.; Pechanec, V.; Purkyt, J.; Chobot, K.; Salvati, L.; Cudlín, P. Are Valuable and Representative Natural Habitats Sufficiently Protected? Application of Marxan model in the Czech Republic. Sustainability 2020, 12, 402. [Google Scholar] [CrossRef]
- Nackoney, J.; Williams, D. A comparison of scenarios for rural development planning and conservation in the Democratic Republic of the Congo. Biol. Conserv. 2013, 164, 140–149. [Google Scholar] [CrossRef]
- DFID (Department for International Development). Sustainable Livelihoods Guidance Sheets; DFID (Department for International Development): London, UK, 1999; pp. 1–2.
- Hao, H.G.; Li, X.B.; Xin, L.J. Impacts of non-farm employment of rural laborers on agricultural land use: Theoretical analysis and its policy implications. J. Res. Ecol. 2017, 8, 595–604. [Google Scholar] [CrossRef]
- Liu, X.; Zhao, C.; Song, W. Review of the evolution of cultivated land protection policies in the period following China’s reform and liberalization. Land Use Policy 2017, 67, 660–669. [Google Scholar] [CrossRef]
- Jin, G.; Chen, K.; Wang, P.; Guo, B.; Dong, Y.; Yang, J. Trade-offs in land-use competition and sustainable land development in the North China Plain. Technol. Forecast. Soc. Chang. 2019, 141, 36–46. [Google Scholar] [CrossRef]
- Tian, R.; Yang, Z.; Shao, Q. Effects of host country resource endowment and labor cost on China’s investment in overseas cultivated land. Environ. Sci. Pollut. Res. 2020, prepublish. [Google Scholar] [CrossRef] [PubMed]
Publisher’s Note: MDPI stays neutral with regard to jurisdictional claims in published maps and institutional affiliations. |
© 2021 by the authors. Licensee MDPI, Basel, Switzerland. This article is an open access article distributed under the terms and conditions of the Creative Commons Attribution (CC BY) license (http://creativecommons.org/licenses/by/4.0/).