Abstract
The aspirations of public administrations to meet quality parameters and standards in urban spaces have fostered new strategies and tools that allow users to give safety and well-being. The participation and interaction of different actors during decision-making in the context of allocation of public resources implies a significant degree of complexity when prioritizing actions in public works. The objective of the study focuses on obtaining an urban street condition index (USCI) that allows an efficient diagnosis of urban infrastructure. The study provides an innovation component for decision-making through the construction of guidelines to prioritize spending on investment in urban infrastructure. The case study has been developed in three countries, Brazil, Paraguay and Argentina (Triple Border) with the aim of drawing management guidelines during the process in public entities. The results for Brazil and Argentina present streets with satisfactory USCI. Paraguay reflects a significant lack of urban infrastructure and compliance of accessibility regulations. Regarding the city of Foz de Iguazú, it has been observed that 50% of the roads require prevailing actions to improve the mobility of the roads; 40% of these reflect reduced mobility and deterioration of urban components, configured as an urgent action, and only 10% of the roads studied reflect adequate mobility conditions.
1. Introduction
The different interpretations of development and conservation of urban infrastructure are guided by the different appreciations of the disciplines that interact with each other. The interacting social, urban, technical and political perspectives represent a clear conflict in the decision-making process during the exercise of public spending on infrastructure investment in urban spaces [1].
The aspirations of the public administration to advance in high standards of quality in urban roads and improve the mobility conditions of the user have been defining new sustainable development strategies in view of the needs of society and especially with reduced budgets in public management entities [2].
Although most public entities have instruments for measuring and inspecting urban elements, the capacity and need to integrate technical and public management decisions makes new methodological alternatives necessary to diagnose urban streets in order to optimize limited financial resources intended for public infrastructure [3,4,5].
With the growth of large metropolises and urban populations, the demands for public infrastructure are also increasing [6,7]. At the same time, the divergent attention between the aspects that influence user mobility (public transport, poor signage, deterioration of pavements, among others) generates biases in the quality of infrastructure [8].
With committed (or overburdened) public budgets and the reduced possibility of tax increases, governments face difficulties in financing the investments required for urban growth and development [9]. The objectives and financial resources of each public Administration will be able to guide the actions intended to improve the criteria and indicators analyzed here. The sensitivity of these attributes will depend on the public spending destined to the improvement of these evaluated aspects.
In 2015, 195 countries signed an agreement at the United Nations to improve the well-being of society, reduce poverty and increase the commitment to social justice. The Global Challenge for Government Transparency: The Sustainable Development Goals has defined guidelines to achieve these goals in a coherent and organized manner. The importance of including such aspects in the models of inspection and urban evaluation supports following the guidelines of public health, well-being and improvement of the environment.
The inclusion of different types of actors, limited public investment budgets and the lack of management tools that integrate aspects that intervene within an urban space enhances the need to build models and tools that promote the articulation of variables with social inclusion, technical and public institutions.
In the literature, some multicriteria models have been found that seek to measure the quality and well-being of the user in specific situations. These studies aim to conceive and define indexes associated with pedestrian safety [10,11], traffic comfort and environmental impact on bicycle lanes [12,13], pedestrian well-being at the time of transit [14,15,16] and measurement of sustainability in urban spaces [17,18] among others.
The construction of indices that evaluate urban spaces mostly defines aspects and attributes associated with a specific theme of the environment. The contribution of the studies that were frequently analyzed is aimed at solving a reduced number of indicators and above all with a specific impact on the sustainability axis. The singularity of these studies assumes a specific applicability oriented to variables of a very particular order and typology.
The relevance of the proposed model is characterized by a model that defines, identifies and evaluates indicators that interact within an urban space in the different transport models. The developed tool enhances the integration of variables of different nature and different measurement units (noise pollution, deterioration of elements, mobility and well-being of the user, among others).
This study promotes a multicriteria analysis model that allows classifying urban infrastructure through an urban street condition index (USCI) considering each of the actors during decision-making in the application of public spending. The study assumes the integration of aspects and attributes relevant to the urban mobility approach and under the physical conditions of each of the elements.
The study developed has been applied in the triple border region contemplated by the countries: Brazil, Argentina and Paraguay (Foz do Iguazú, Puerto Iguazú and Ciudad del Este, respectively). The validation of the model has been developed in a homogeneous way under the same lifting conditions, mobility (working days), traffic, and weather, among others.
The evaluated streets have been selected by means of tourist, commercial and moderate traffic criteria. A total of 27 km has been evaluated in the study, which has allowed us to review the state of the main roads of the highways under an economic, social, environmental and institutional context.
2. Materials and Methods
2.1. Case Study
The case study was developed in the triple border region, integrated for the cities: Foz de Iguassu (Brazil), Ciudad del Este (Paraguay) and Puerto Iguassu (Argentina). The region has multiple relationships (economic, social, political, labor and cultural) among the actors that make up such a transnational space under notable contrasts and asymmetries of poverty and inequality.
The region is geographically at the epicenter of the Guaraní aquifer water system, considered one of the largest and easily accessible. This geographical position makes the Triple Frontier a fundamental point for the control of the continent’s territory [19].
The main demographic and social characteristics of the cities analyzed in order to observe similar characteristics in the triple border region have been observed from the perspective of comparison of urban infrastructure efficiencies and the social and economic performance of each region. It is important to highlight that the 3 cities present a different but complementary profile between them. On the one hand, Foz do Iguaçu reflects a city (essentially) with a tourist profile, while Ciudad del Este and Puerto Iguazú can be characterized by commercial impact and high gastronomic offer, respectively.
Foz do Iguaçu reflects an estimated population of 258,532 inhabitants (demographic density 414.58 Hab./km2), maintaining a municipal human development index (MHDI) of 0.751 (Brazil 0.759), compared to a territorial area of 618.057 km2, expressing a GDP per capita (2017) of 9270 US $ and with an urbanization of public roads (2018) of 86%. On the other hand. Ciudad Del Este has an estimated population of 301,810 inhabitants (demographic density 2925.79 Hab./km2) with a department human development index (MHDI) of 0.655—Alto Paraná; (Paraguay MHDI 0.702). Ciudad del Este has a territorial area 104.00 km2 under a per capita social expenditure of 908 US $, with urbanization of public roads (2010) of 65%.
Puerto Iguassu reflects an estimated population of 45,800 inhabitants (population density 56.5 Hab./km2) under the Department human development index (MHDI) of 0.753—Argentina (MHDI 0.869). Area of the territorial unit of 759.00 km2 and with a per capita social expenditure of 694 US $, with urbanization of public roads (2019) of 78%.
The study has considered 27 urban streets, which have been selected with specific criteria defined (10 for Foz do Iguaçu; 7 for Ciudad del Este and 10 for Puerto Iguazú). The following road selection criteria have been considered: High urban mobility and tourist and commercial impact. Table 1 shows the urban streets analyzed for the Triple frontier region, indicating in parentheses the nomenclature used in the analysis and results stage.

Table 1.
Selected urban roads.
Even though the case study has been applied to the Triple Frontier, the configuration of the model makes it possible to highlight its application in other Latin American contexts at different geographical levels.
This means that the methodological structure can be reproducible to other scenarios where it is necessary to classify roads under technical, social and environmental criteria. It is important to highlight both the weights of the indicators because the inclusion of others may be subject to the needs and objectives of the public administration that applies the model.
2.2. Process
The Indicators have been selected that contribute significantly to the measurement of the quality of urban mobility during its interaction with urban space. These indicators have been considered in such a way that they adapt to current sustainability needs, such as deterioration of urban components, compliance with international regulations on accessibility, pedestrian density, road service levels, noise pollution, social impact, among others [20,21,22,23,24,25,26].
The study assumes a model based on multi-attribute theory for decision-making. The methodology developed expresses 3 main stages: inspection of urban components, calibration of the model and calculation of the mobility index at its different levels. The phase of urban components inspection collects and constitutes the information of each of the indicators defined for this study, considering the interaction of its components, transport systems and the impact on urban mobility.
This methodology has been defined based on the need to evaluate urban roads in an integrated way and under a sustainable nature. The optimization of environmental and human resources has fully motivated this study.
Next, the responses of the indicators are validated in the MIVES mathematical model [27], supported by the analytical hierarchy process [28] and the mathematical equation of the utility function, represented as the degree of satisfaction of a certain good or service.
The last phase of the model determines the urban mobility index, which allows classifying the urban streets in relation to the value calculated in phase 2 of the model. The mobility index is defined between the values from 0 to 1 at each level of the decision tree. Mobility indices close to 0 show low quality of urban mobility, and the road requires a prevailing intervention to recover urban space. Mobility indices close to values of 1 are understood as those roads with an adequate quality standard in the axes analyzed in this study.
Figure 1 represents the flow of the methodology developed under the sustainability profile, taking into account the international measurement parameters.
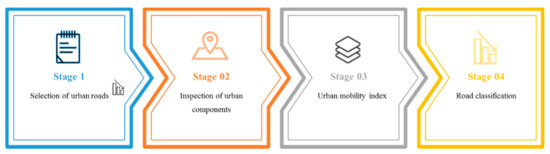
Figure 1.
Methodological process to classify urban roads. Urban street condition index (USCI).
The USCI methodology starts from 4 main processes that support decision-making. First of all, the routes to be analyzed under specific criteria (tourism and commercial influence) are defined. In the second phase, the information gathering and inventory of urban indicators is carried out to obtain input information to obtain the USCI.
The third stage uses the MIVES mathematical model based on the methodological framework developed. Finally, the stage of classification of urban roads involves the organization of the roads in a descending way (USCIs from lowest to highest value). This organization and classification of roads is a guide to apply public spending in urban space.
2.2.1. Inspection of Urban Components
The model developed for this study involves the integration of indicators associated with measuring the quality of an urban component that promotes proper mobility. The study reflects quantitative and qualitative aspects with different units of measurement, organized in such a way that they can be specifically evaluated.
Table 2 represents the parameters and indicators considered for this study and the revised references that have provided support in its structure. These parameters represent the inventory of aspects and attributes evaluated in order to measure the impact of mobility based on the presence, degree of deterioration and compliance with international regulations.
Table 2.
Attributes considered in the inspection model.
Table 3 represents the main structure of the study defined as a decision tree that allows organizing the aspects based on the multi-attribute theory. The study specifies requirements for urban infrastructure, accessibility and mobility, manifesting through the criteria, the quality of its components, compliance with regulations and possible interferences that promote the reduction of user mobility in an urban space.
Table 3.
Decision tree for the Triple Frontier.
In this way, with the aim of providing traceability to the study, each of the indicators considered in the study are characterized below. Table 4 defines the parameters considered for the indicator “sidewalk quality” referring to the criterion “physical state of the element”. Thus, the weights express, to a certain extent, the degree of importance of the attribute relative to the mobility of the user in the urban space.
Table 4.
“Sidewalk quality” indicator.
Table 5 identifies the indicator “quality of the asphalt surface” of the criterion “physical state of the element”. This indicator shows levels of service with regard to the deterioration of the rolling track of light vehicles, public transport and cyclists promoting (or not) the quality of mobility of the user in urban space.
Table 5.
“Quality of the asphalt surface” indicator.
Table 6 shows the indicator “Areas of circulation” with three levels or degrees of compliance that allow for adequate pedestrian mobility on roads under the minimum international standards. It is important to highlight that the criterion “Compliance with regulations” (decision tree) observes the different strategies in public management to achieve international standards and guidelines with regard to the quality of life of elderly and infirm persons.
Table 6.
“Circulation areas” indicator.
In the “Accessibility” axis of the decision tree, the indicator “Adaptations in infrastructure for people with reduced capacities” has been considered. To measure the “Accessibility” requirement, Table 7 is presented, according to the parameter “urban infrastructure in accessibility” following the respective regulations of Brazil (ABNT NBR 9050: 2004), Paraguay (Paraguayan National Law No. 4934) and Argentina (Law National Argentina N° 24314).
Table 7.
“Adaptations in infrastructure of elderly and infirm persons” indicator.
In this sense, the study promotes actions to improve urban components both in signaling and support elements in mobility itself. The requirement of the degree of compliance with these parameters supposes a clear policy of social inclusion and a significant improvement in urban mobility.
The “Mobility” requirement has considered four (4) qualitative and quantitative criteria: Pedestrian (indicators: quality of mobility, noise pollution), light vehicle (Indicator: interference), Cyclist (indicator: quality of the journey and safety) and public transport (indicator: quality of infrastructure and signaling). The analysis and measurement of these indicators correspond to a quantitative measurement from 0 to 100 points and measurement of decibels in the urban area.
Regarding the quality of mobility (indicator) of the pedestrian (criterion), Table 8 is presented, which represents each of the parameters considered for this attribute. Compliance with each of these represents a weighting of 100 points.
Table 8.
“Mobility quality” Indicator.
The parameter of density of the sidewalk has been measured through service levels corresponding to the number of pedestrians that travel on the sidewalk and the area within the urban space.
For this, Table 9 has been followed, which allows to measure this attribute quantitatively. In the same way, mobility interferences are physically represented in the field, such as those interruptions to the mobility of the pedestrian during its journey from one point to another [57].
Table 9.
Measurement of road density in service levels.
That is, the sidewalk is analyzed through interferences within the sidewalk that interfere with the quality of the user’s movement in a short period of time (informal vendors, waste deposits, among others). In the same way, the parameters “pedestrian traffic lights” and “Shading” have been incorporated in order to review the quality of pedestrian traffic from an origin and destination.
The “noise pollution” indicator has been measured by means of a portable device (Portable Digital decibel meter SKILL-TEC SKDEC-01 Digital Sound Leve Meter- Range 30 dB–130 dB), allowing to check compliance with the ABNT NBR 10151: 2019 regulation (in the case of Foz de Iguassu—Brazil), National Law N° 1540/04 (in the case of Puerto Iguazú—Argentina) and Law N° 1100/97 (in the case of Ciudad del Este—Paraguay). It is important to note that the tolerance limits (maximum) in the urban noise pollution indicator are defined as allowed values of 60 dB for Brazil, 70 dB for Paraguay and 70 dB for Argentina.
Regarding the “light vehicle” criterion, Table 10 shows the indicator “interference” that evaluates the quality of traffic and mobility with respect to 3 main parameters: presence of radars, light vehicle pedestrian interruptions and percentage of light vehicles (vehicular breakdown through gauges).
Table 10.
“Interferences” Indicator.
Regarding the “Quality of the journey and safety” indicator of the “Cyclist” criteria, measurement and evaluation parameters of the road are incorporated in relation to the presence of urban infrastructure and electronic devices. Table 11 shows the parameters associated with the degree of compliance and their weighting from values of 0 to 100 points.
Table 11.
Parameters of the indicator “quality of the journey and safety”.
Finally, the urban transport criterion considers the indicator “quality of infrastructure and signaling” through 5 analysis parameters. In this case, the existence of urban infrastructure that provides support for a better quality of mobility on the roads has been defined. Table 12 reflects the parameters analyzed for this indicator: existence of a preferential bus lane, speed control devices, quality of the public transport waiting point, quality of frequency and signaling.
Table 12.
“Quality of infrastructure and signaling” Indicator.
It is important to highlight that each of the indicators, criteria and requirements proposed for this study have been defined with the aim of significantly improving mobility conditions in each of the transport systems analyzed.
Likewise, the weightings indicated in each of the tables pertaining to the indicators and parameters have been defined through periodic meetings with specialists in the area of transport, development of urban indicators and creators of project evaluation methodologies.
2.2.2. Urban Street Condition Index (USCI)
For the integration of the indicators selected in the study, a value quantification methodology called Integrated Value Model for Sustainable Buildings (MIVES) has been used. Figure 2 shows the flow of the process of integration and evaluation of attributes considered for the study of the diagnosis of urban streets (characterization of the problem).
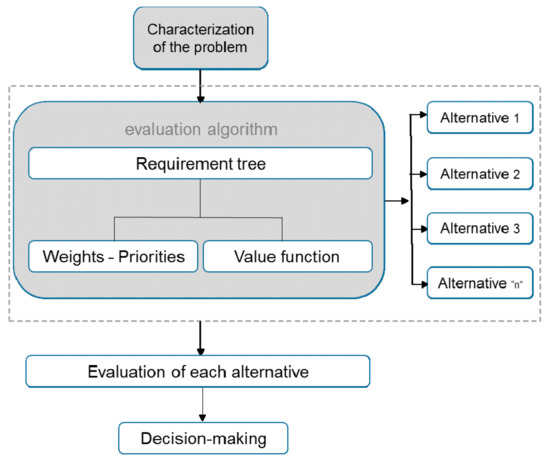
Figure 2.
Flow chart of Integrated Value Model for Sustainable Buildings (MIVES) methodology.
The MIVES model evaluates alternatives through two main processes: weighting of variables and value function. The weight of the attributes for the requirements, criteria and indicators has been defined through the AHP tool [58]. The weights indicated in each variable are in percentage, which establish the degree of importance of each of these aspects. It is important to highlight that the definition and application of the AHP methodology has been carried out under the consensus of specialists in areas related to this study (transportation, managers, engineers and public policy experts).
It is important to highlight that 8 experts associated with the transport sector have participated in an interdisciplinary way. The definition of the value function trends, the allocation of weights by AHP (construction of decision matrices) and the characterization of the requirements tree itself have been configured by 2 civil engineers with a transport profile, 2 engineers belonging to the Public administration, 2 architects with an urban development and implementation profile and 2 engineers with an urban management profile). On the other hand, the value function transforms the indicator with physical units to common units (value). The use of the value function allows transforming the different measurement units into one-dimensional units, allowing the attributes to be integrated in an organized and coherent way [59]. The value function is defined by 4 parameters that, when transformed, allow to obtain all kinds of trends (shapes) characterized by Equation (1).
where A = value that generates the abscissa “Xmin”, generally A = 0, Xmin = abscissa of the indicator that generates a value equal to “A”, X = abscissa of the evaluated indicator that generates a value equal to Vind, Pi = determines the slope of the curve at the coordinate inflection point (Ci, Ki), defining the shape of the curve. Ci = for “S” shaped curves; this factor establishes the value of the abscissa around the inflection point, Ki = defines the value of the ordinate of the point Ci. On the other hand, the parameter “B” (Equation (2)) is the factor that guarantees keeping Equation (1) in the interval 0 and 1 and is expressed by Equation (2).
According to the MIVES model and the scheme in Figure 2, urban roads are quantified in a stepwise fashion from right to left in the three cities analyzed. The mobility index for each indicator is obtained from the value function and the response (in the field) for each path corresponding to the decision tree.
To obtain the mobility index with respect to its criteria, Equation (3) is followed, which represents the sum of the product of the indicators belonging to the same criterion and their respective weights. The mobility index of the criterion supposes the evaluation of aspects in a more general way of the route analyzed.
In the same way, the model allows evaluating the aspects in the three main axes of the study (urban infrastructure, accessibility and mobility), through the sum of the product of the criteria belonging to the same requirement and their respective weights (Equation (4)).
Finally, to obtain the mobility index for each of the roads, Equation (5) is indicated, which represents the sum of the product of the requirements pertaining to the case study and their respective weights.
2.2.3. Value Function
Table 13 reflects the structure of the decision tree with the weights assigned by analytical hierarchy (in parentheses) and the shape of the value functions assigned for the study. It should be noted that the configuration of these has been derived from the consensus of specialists in the transport area (transportation, managers, engineers and public policy experts), defining the degree of importance of the evaluated aspects and the trends of the value functions used in the three countries.
Table 13.
Decision tree applied to the case of diagnosis of urban streets.
The specific weights in each variable and the definition of the trend of the value functions make possible to have a guide for public spending in the administration of urban infrastructure. The adaptation of specific indicators for each region could be understood within the needs and objectives of each public administration.
3. Results
The integration of parameters through the indicators, criteria and requirements has allowed obtaining specific results at the different levels of the decision tree. The presented model provides a strong component of innovation to diagnose urban spaces, specifically urban corridors, with the clear objective of classifying the urban streets and guiding decision-making entities in public spending.
The variables analyzed are represented in an organized way and in relative percentage in order to represent the mobility indices in relation to the weighting given in the analytical hierarchy process. Thus, the variables are organized by the different hierarchical levels defined in the decision tree.
First, the global (or total) indices are observed for each urban street studied, understanding that for values close to 100%, they show a positive response of the attributes. In other words, values close to the unit represent that the conditions of the analyzed road favor the correct mobility of the user in the different modes of transport. On the contrary, values close to 0.00% reflect a clear reduction in mobility and the prevailing need for public spending to improve the conditions of urban elements in order to improve the quality of life of the user in the urban space.
In order to be practical in guiding decision-making in public infrastructure investment, 4 levels of urban road care have been defined. For urban streets with mobility rates between 100% and 80%, it is considered a low-urgency road. Values between 79% and 60% indicate a necessary action, values between 59% and 40% imply the prevailing action by the public administration, and values below 40% suggest urgent actions (clear conditions of reduced mobility, deterioration of urban components and low quality of user’s life in urban space).
Urban Street Condition Index (USCI) for the Triple Border Region
The results of the study have been organized in such a way that the mobility indices can be observed in each of the roads in each country and in each attribute evaluated. Thus, the main parameters related to the triple border (Brazil, Paraguay and Argentina) have also been identified.
Table 14 represents the values of the USCI for the city of Foz de Iguazú in Brazil through the different aspects and indicators considered in this study. For the city of Foz de Iguazú, it can be noted that the roads with a predominant tourist profile present better global mobility conditions, and the commercial roads represent a decrease in the mobility index.
Table 14.
USCI for Foz do Iguazú (Brazil).
In the same way, compliance with international regulations and the quality of mobility itself present satisfactory results in most of its roads. However, the indicators “quality of the asphalt surface” and “quality of the journey and safety” suggest special attention to the aspects of road infrastructure for cyclists, lighting and safety of the journey.
The Figure 3 reflects the behavior of all the aspects evaluated for the city of Foz de Iguazú in a radial way with the integration of the studied roads. It can be clearly seen that Schimmplfeng Avenue considers the best mobility conditions in most of the attributes analyzed in relation to the other roads studied. Commercial roads such as Tarquínio dos Santos, Andradina and José Maria de Brito Avenue represent unsatisfactory mobility rates, indicating a clear need for investment in urban infrastructure to improve travel conditions in urban space.
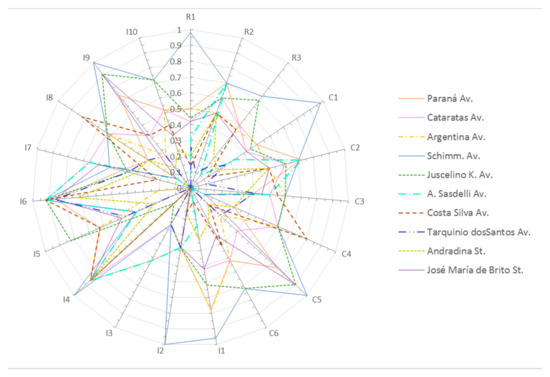
Figure 3.
Representation of the USCI index in the roads analyzed in Brazil.
Regarding Ciudad del Este (Paraguay), Table 15 shows the mobility indices belonging to the 7 urban streets studied. It has been observed that urban street number 4 (Gral. Bernardino Caballero) represents the urban space with the best mobility conditions with a value of 0.62 (62%). Although this street represents a significant mobility index compared to the other roads, the response of the Bernardino Caballero street shows deficiencies in the quality of its elements. Most of the urban streets studied have shown poor USCI globally (close to 0.30).
Table 15.
USCI for Ciudad del Este (Paraguay).
There is a need to generate public investment attitudes in the Ciudad del Este Administration to provide better traffic and mobility conditions, specifically on the República del Perú, San Blas and Street 10. The Figure 4 shows the deficiency, lack or absence of urban components suggests the detriment to the quality of user mobility on these streets, resulting in harmful social effects and phenomena in the sustainable development of a city.
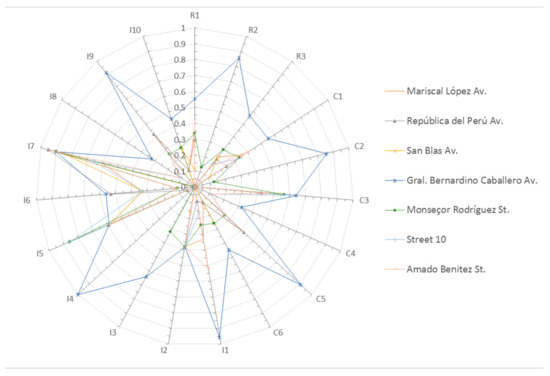
Figure 4.
Representation of the USCI index in the roads analyzed in Paraguay.
It has been observed that the streets analyzed (for the most part) do not address the aspects that have a significant impact on the quality of life of the user during their origin-destination journey. For example, compliance with regulations on accessibility, mobility in light vehicles, public transport and adaptations for people with reduced capacity have been little considered or in some cases non-existent.
Finally, the case of analysis of the city of Puerto Iguazú (Argentina), Table 16 highlights the homogeneity of its USCIs on the streets studied. The Córdoba, Tres Fronteras and Brazil Avenue have satisfactory indices in the face of a tourist and commercial road profile.
Table 16.
USCI for Puerto Iguazú (Argentina).
The proper arrangement, quality and proper conservation of its elements are manifested in a remarkable degree of mobility for this city. Although 30% of the streets present remarkable results; the other streets (50%) represent prevailing actions by the public administration in order to restore the quality of mobility in the section analyzed.
Public management could take care of the parameters of the cycling indicator and interferences on the urban streets, to increase the response of the studied roads, as well as the quality of the journey and safety of the cyclist (lighting, cycle routes, etc.) within the urban space.
Figure 5 shows the clear tendency of the public administration to attend to certain attributes of the public space to promote strategies for increasing urban mobility. In the graph, it can be seen that both indicators I8–I9 and criteria C4–C6 should be observed to increase the quality of life of the user in this niche of study.
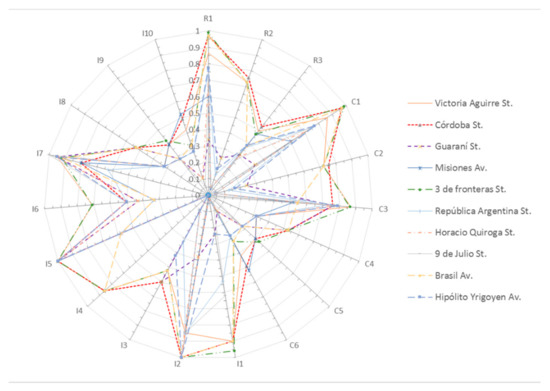
Figure 5.
Representation of the USCI index in the roads analyzed in Argentina.
Finally, Figure 6 represents the intersection of case studies of the triple border, integrating the indices of global mobility (average between roads), the requirement of urban infrastructure (R1), accessibility (R2) and urban mobility (R3).
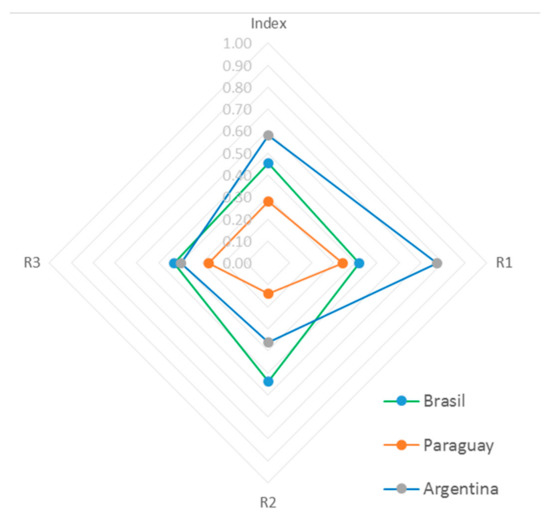
Figure 6.
Representation of the USCI index in the triple frontier.
In this way, Argentina represents a significant improvement in a general way (by evaluated area-country) and Paraguay remains with an urgent attention character in each of the studied streets. The integration and representation of requirements in this context allows observing different management policies (among countries) that allow increasing the benefits and qualities of mobility in the region.
4. Discussion
Public spending on urban infrastructure has decreased in real terms, generating insufficient infrastructure that impacts the economic development of Latin American regions. While the private and public initiatives make efforts in various sectors, the total investment has not been enough for the average cities to have a better well-being for their inhabitants.
The few and increasingly reduced municipal and state budgets push inappropriate decisions or act in the shadows of social pressure and with the absence of management tools that support the decision-making processes when planning public investment.
Although there are mechanisms for inspection, maintenance and prioritization of urban spaces, the integration of technical, political and social decisions makes the analysis and evaluation process consider variables of different origin and measurement that hinder decision making.
For practical purposes, Paraguay has 10% of roads with a mobility index with a character of necessary action; the remaining 90% is with reduced mobility and with high deterioration of urban components. Most of the roads contemplate significantly low responses compared to the Bernardino Caballero road in most of the indicators studied.
Regarding the city of Puerto Iguazú, 10% of the roads are in adequate conditions (or with a low need for action), 30% request necessary attention, 50% suggest a prevailing investment action, and only 10% present conditions of reduced mobility or deterioration of urban elements.
The study of the triple frontier has sought to integrate parameters of a diverse nature that impact on the quality of user mobility in modes of transport (pedestrian, cyclist, public and light transport). The integration and articulation of these parameters into indicators through technical competences (criteria and requirements; weights and value functions) have allowed us to achieve better responses in compliance with international regulations, social perception and political decisions.
In this way, the application of the methodology of inspection of elements until the evaluation of the USCI allows building urban development strategies in an organized, coherent and systematic way under the specific conditions of each region.
5. Conclusions
The methodology presented here provides a great methodological advance in terms of evaluating indicators of different nature and different units of measurement. The juxtaposition of criteria and requirements in three different countries inherently supports decision-making in public investment.
Regarding the city of Foz de Iguazú, it has been observed that 50% of the roads require prevailing actions to improve the mobility of the roads; 40% of these reflect reduced mobility and deterioration of urban components, configured as an urgent action, and only 10% of the roads studied reflect adequate mobility conditions.
In a global way, the triple border includes economic, social and environmental relationships throughout the last decade. The scope of social policies significantly impacts these relationships, which foster sustainable development ties and create migratory ties throughout the three countries. Thus, the juxtaposition of objectives and strategies with regard to urban mobility is an aspect that must be addressed with tools and models that promote the adequate use of economic resources in a sustainable and appropriate way for the region.
The integration of entities in decision-making, both public management and the technical part, translates into better approaches and solutions that provide guidelines in a sustained regime of environmental, social and economic development.
The study aims to provide useful information to officials who are in charge of planning and implementing public policies of public spending in relation to conservation and maintenance of urban roads with focus on The Global Challenge for Government Transparency: The Sustainable Development Goal, following those established guidelines by the United Nations that reflect the international instruments of well-being and Human rights, in public policies.
In the context of the triple border, it can be observed that public policies on public spending in the studied axes (urban infrastructure, accessibility and urban mobility) are more favorable in Puerto Iguazu in two of the requirements. Although Brazil maintains constant improvements in the conservation and maintenance of urban roads by supporting mobility in its 5 transport systems, there is a significant and positive USCI in universal accessibility policies.
In the same way, Argentina has presented important results in the axis of quality and presence of urban infrastructure. This situation can be reflected as a city with less deterioration in the presence of tourism with a gastronomic profile under relevant public policies on welfare and user safety.
On the other hand, in Ciudad del Este (Paraguay), the values corresponding to the USCI show deficiencies and important deficiencies in urban infrastructure (in presence and functionality), potentiating significant problems of mobility, quality and well-being of the user. It is highlighted that the policies associated with urban accessibility in the analyzed indicators present serious deficiencies (40% less than Brazil) and in most of the roads they contemplate values close to 0 of the USCI, manifesting an imperative need for actions and public spending on accessibility that allow meeting international standards.
In the context of Brazil (Foz do Iguazu), the 3 requirements analyzed present consistent USCI results. There is a need to implement actions in public spending that improve the USCI in accessibility and mobility issues. It is important to highlight that the study clearly reflects that there is a public policy inherent to the conservation and maintenance of urban roads with a tourist profile with respect to commercial roads.
Regarding Puerto Iguazu (Argentina), the results inherent to the analyzed indicators systematically present USCIs with the same behavior. The study area developed in Argentina presents outstanding results in the implementation of actions in urban infrastructure. On the other hand, there is a prevailing need for the improvement of mobility actions associated with the frequency of urban transport, signaling, user welfare (pedestrian) and implementation of cycle paths in the region.
In Ciudad del Este (Paraguay) there is an imperative need to increase policy actions and public spending associated with urban infrastructure, accessibility and urban mobility. The values found in the requirements, criteria and indicators suppose a reduced quality of mobility of the user and negative effects on the welfare of the user.
The construction of public policies regarding the administration of public spending in urban infrastructure must be guided by interdisciplinary diagnoses that allow generating strategies for action for the benefit of society.
Author Contributions
Conceptualization, N.V.F. and Y.S.M.; methodology, N.V.F., Y.S.M. and C.A.T.P.; validation, N.V.F. and I.F.; formal analysis, N.V.F., Y.S.M., C.A.T.P. and I.F.; investigation N.V.F.; resources, N.V.F.; data curation, N.V.F., I.F. and H.A.R.Q.; writing—original draft preparation, N.V.F. and Y.S.M.; writing—review and editing, N.V.F., Y.S.M., C.A.T.P., I.F. and H.A.R.Q.; visualization, N.V.F.; supervision, N.V.F.; funding acquisition, N.V.F. All authors have read and agreed to the published version of the manuscript.
Funding
This research was funded by Institutional Scientific Initiation Scholarship Program (PIBIC), Scientific Initiation Junior (ICJ) and Institutional Development Initiation Scholarship Program Technological and Innovation (PIBITI) through the Dean of Research and Graduate Studies, Federal University of Integration.
Institutional Review Board Statement
Not applicable.
Informed Consent Statement
Not applicable.
Data Availability Statement
Not applicable.
Acknowledgments
The authors thank the Scientific Initiation Scholarship Program of the Federal University of Latin American Integration, during the period 2017–2020 for the execution of the research project. Thus, the authors thank the Universities involved through their human resources in science and research.
Conflicts of Interest
The authors declare no conflict of interest.
References
- Younis, F. Significance of Infrastructure Investment for Economic Growth. MPRA Paper No. 72659, Posted 26 Jul 2016 16:58 UTC. Available online: https://mpra.ub.uni-muenchen.de/72659/ (accessed on 17 March 2021).
- Broniewicz, E.; Ogrodnik, K. Multi-criteria analysis of transport infrastructure projects. Transp. Res. Part D Transp. Environ. 2020, 83, 102351. [Google Scholar] [CrossRef]
- Wallbaum, H.; Krank, S.; Teloh, R. Prioritizing sustainability criteria in urban planning processes: Methodology application. J. Urban Plan. Dev. 2011, 137, 20–28. [Google Scholar] [CrossRef]
- Wey, W.-M. Constructing urban dynamic transportation planning strategies for improving quality of life and urban sustainability under emerging growth management principles. Sustain. Cities Soc. 2019, 44, 275–290. [Google Scholar] [CrossRef]
- Medina, M.G.; García, M. Ángeles, H. Real innovation in urban planning? Assessing the institutional capacity in the frame of the integrated sustainable urban development programmes. Eur. Plan. Stud. 2019, 28, 1139–1160. [Google Scholar] [CrossRef]
- Carrese, S.; Cuneo, V.; Nigro, M.; Pizzuti, R.; Ardito, C.F.; Marseglia, G. Optimization of downstream fuel logistics based on road infrastructure conditions and exposure to accident events. Transp. Policy 2019. [Google Scholar] [CrossRef]
- Marseglia, G.; Medaglia, C.M.; Ortega, F.A.; Mesa, J.A. Optimal alignments for designing urban transport systems: Application to Seville. Sustainability 2019, 11, 5058. [Google Scholar] [CrossRef]
- Cigu, E.; Agheorghiesei, D.T.; (Vatamanu), A.F.G.G.; Toader, E. Transport infrastructure development, public performance and long-run economic growth: A case study for the EU-28 countries. Sustainability 2018, 11, 67. [Google Scholar] [CrossRef]
- Välilä, T. Infrastructure and growth: A survey of macro-econometric research. Struct. Chang. Econ. Dyn. 2020, 53, 39–49. [Google Scholar] [CrossRef]
- Adinarayana, B.; Mir, M.S. Development of pedestrian safety index models for safety of pedestrian flow at un-signalized junctions on urban roads under mixed traffic conditions using MLR. Innov. Infrastruct. Solut. 2021, 6, 1–9. [Google Scholar] [CrossRef]
- Wang, J.; Yang, C.; Zhao, J. Conditions for setting exclusive pedestrian phases at two-phase signalized intersections considering pedestrian-vehicle interaction. J. Adv. Transp. 2021, 2021, 1–14. [Google Scholar] [CrossRef]
- Beura, S.K.; Chellapilla, H.; Panda, M.; Bhuyan, P.K. Bicycle Comfort Level Rating (BCLR) model for urban street segments in mid-sized cities of India. J. Transp. Health 2021, 20, 100971. [Google Scholar] [CrossRef]
- Arellana, J.; Saltarín, M.; Larrañaga, A.M.; González, V.I.; Henao, C.A. Developing an urban bikeability index for different types of cyclists as a tool to prioritise bicycle infrastructure investments. Transp. Res. Part A Policy Pr. 2020, 139, 310–334. [Google Scholar] [CrossRef]
- Labdaoui, K.; Mazouz, S.; Acidi, A.; Cools, M.; Moeinaddini, M.; Teller, J. Utilizing thermal comfort and walking facilities to propose a comfort walkability index (CWI) at the neighbourhood level. Build. Environ. 2021, 193, 107627. [Google Scholar] [CrossRef]
- Peeters, A.; Shashua-Bar, L.; Meir, S.; Shmulevich, R.R.; Caspi, Y.; Weyl, M.; Motzafi-Haller, W.; Angel, N. A decision support tool for calculating effective shading in urban streets. Urban Clim. 2020, 34, 100672. [Google Scholar] [CrossRef]
- Ahmad, S.N.; Harianto, T.; Samang, L.; Hustim, M. Level Vulnerability Damage of Pavement Using Pavement Condition Index Method; EDP Sciences: Makassar, Indonesia, 2018; Volume 181, p. 11003. [Google Scholar]
- Shruti, S.; Singh, P.K.; Ohri, A. Evaluating the environmental sustainability of smart cities in india: The design and application of the Indian smart city environmental sustainability index. Sustainability 2020, 13, 327. [Google Scholar] [CrossRef]
- Pinatt, J.M.; Chicati, M.L.; Ildefonso, J.S.; Filetti, C.R.G.D. Evaluation of pavement condition index by different methods: Case study of Maringá, Brazil. Transp. Res. Interdiscip. Perspect. 2020, 4, 100100. [Google Scholar] [CrossRef]
- Boomen, M.V.D.; Spaan, M.T.J.; Schoenmaker, R.; Wolfert, A.R.M. Untangling decision tree and real options analyses: A public infrastructure case study dealing with political decisions, structural integrity and price uncertainty. Constr. Manag. Econ. 2018, 37, 24–43. [Google Scholar] [CrossRef]
- Gibson, J.; Rioja, F. The welfare effects of infrastructure investment in a heterogeneous agents economy. BE J. Macroecon. 2019, 20. [Google Scholar] [CrossRef]
- Fogel, R. La región de la triple frontera: Territorios de integración y desintegración. Rev. Socio. Porto Alegre 2008, 20, 270–290. [Google Scholar] [CrossRef]
- Wu, Z.; Chen, R.; Meadows, M.E.; Sengupta, D.; Xu, D. Changing urban green spaces in Shanghai: Trends, drivers and policy implications. Land Use Policy 2019, 87, 104080. [Google Scholar] [CrossRef]
- Marull, J.; Farré, M.; Boix, R.; Palacio, A.B.; Ruiz-Forés, N. Modelling urban networks sustainable progress. Land Use Policy 2019, 85, 73–91. [Google Scholar] [CrossRef]
- Guo, S.H.; Yang, G.G.; Pei, T.; Ma, T.; Song, C.; Shu, H.; Du, Y.Y.; Zhou, C.H. Analysis of factors affecting urban park service area in Beijing: Perspectives from multi-source geographic data. Landscape Urban Plan. 2019, 181, 103–117. [Google Scholar] [CrossRef]
- Canitez, F. Transferring sustainable urban mobility policies: An institutional perspective. Transp. Policy 2020, 90, 1–12. [Google Scholar] [CrossRef]
- Morillas, J.M.B.; Gozalo, G.R.; González, D.M.; Moraga, P.A.; Vílchez-Gómez, R. Noise Pollution and Urban Planning. Curr. Pollut. Rep. 2018, 4, 208–219. [Google Scholar] [CrossRef]
- San José, J.; García, A. Planteamiento MIVES para la evaluación caso de la EHE. Dialnet 2008, 91, 28–36. [Google Scholar]
- Saaty, T. AHP: The Analytic Hierarchy Process; Mc Graw-Hill: New York, NY, USA, 1980. [Google Scholar]
- National Association of City Transportation Officials (NACTO). Urban Street Design Guide; Island Press: New York, NY, USA, 2013. [Google Scholar]
- Associação Brasileira De Normas Técnicas. NBR 12255: Execução e Utilização de Passeios Públicos-Procedimento; Associação Brasileira De Normas Técnicas: Sâo Paulo, Brazil, 1991; pp. 1–6. [Google Scholar]
- Associação Brasileira De Normas Técnicas. NBR 16537: Acessibilidade—Sinalização Tátil no Piso-Diretrizes para Elaboração de Projetos e Instalação; Associação Brasileira De Normas Técnicas: Sâo Paulo, Brazil, 2016. [Google Scholar]
- Ley 962. Código de Edificación de la Ciudad de Buenos Aires, Argentina, Accesibilidad Física Para Personas Con Necesidades Especiales; Boletín Oficial Number 1197; Comisión para la Plena Participación e Inclusion de las Personas con Capacidad COPIDIS: Buenos Aires, Argentina, 2001. [Google Scholar]
- Osama, A.; Sayed, T. Evaluating the impact of connectivity, continuity, and topography of sidewalk network on pedestrian safety. Accid. Anal. Prev. 2017, 107, 117–125. [Google Scholar] [CrossRef]
- Kirschbaum, J.; Axelson, P.; Longmuir, P.; Mispagel, K.; Stein, J.; Yamada, D. Designing sidewalks and trails for access. Best practices design guide. Fed Highw. Admin 2001, II, 484. [Google Scholar]
- American Association of State Highway Transportation Officials (AASHTO). Guide for the Planning, Design, and Operation and Pedestrian Facilities; American Association of State Highway Transportation Officials: Washington, DC, USA, 2004; ISBN 1-56051-271-7. [Google Scholar]
- Federal Highway Administration (FHA). Distress Identification Manual for the Long-Term Pavement Performance Program; Publication No. FHWA-HRT-13-092, Revised May 2014; Federal Highway Administration (FHA): Georgetown, DC, USA, 2003.
- Hadiwardoyo, S.P.; Correia, A.G.; Pereira, P. Road deterioration analysis for the national roads of Indonesia. In Proceedings of the 14th International Conference on QIR (Quality in Research), Lombok, Indonesia, 11–12 August 2015; Volume 14. [Google Scholar]
- American Association of State Highway and Transportation Officials (AASHTO). Distress Identification Manual for the Long-Term Pavement Performance Program (DIM); American Association of State Highway and Transportation Officials (AASHTO): McLean, VA, USA, 2003. [Google Scholar]
- Instituto Nacional de Vías INVIAS. Manual Para la Inspección Visual de Pavimentos Flexibles. Estudio E Investigación Del Estado Actual de Las Obras de la Red Nacional de Carreteras; Ministerio de Transporte. Convenio Interadministrativo 0587-03: Bogotá, Colombia, 2006.
- Instituto Nacional De Tecnología, Normalización Y Metrología. PNA 4500110: Accesibilidad a la Personas Al Medio Físico. Criterios Y Requisitos Generales de Diseño Para un Entorno Edificado Accesible; INTN Publisher: Asunción, Paraguay, 2010. [Google Scholar]
- Ministerio De Desarrollo Económico. Manual Práctico de Diseño Universal: Basado en la Ley 962, Accesibilidad Física Para Todos: Caba, 1st ed.; Ciudad Autónoma de Buenos Aires: Gobierno de la Ciudad Autónoma de Buenos Aires; Comisión para la Plena Participación e Inclusión de las Personas con Discapacidad-COPIDIS: Buenos Aires, Argentina, 2015; ISBN 978-987-673-030-3. [Google Scholar]
- Associação Brasileira De Normas Técnicas. NBR 9050: Acessibilidade a Edificações, Mobiliário, Espaços E Equipamentos Urbanos; ABNT Publisher: Rio de Janeiro, Brazil, 2015; p. 162. [Google Scholar]
- Cal Y Mayor, R.; Cárdenas, J. Ingeniería de Tránsito. Fundamentos Y Aplicaciones, 9th ed.; Alfa Omega: Mexico City, Mexico, 2014. [Google Scholar]
- Marisamynathan, S.; Lakshmi, S. Method to determine pedestrian level of service for sidewalks in Indian context. Transp. Lett. 2018, 10, 294–301. [Google Scholar] [CrossRef]
- Banerjee, A.; Maurya, A.K.; Lämmel, G. Pedestrian flow characteristics and level of service on dissimilar facilities: A critical review. Collect. Dyn. 2018, 3, 1–52. [Google Scholar] [CrossRef]
- Conceicao, L.; Correia, G.; Tavares, J.P. The deployment of automated vehicles in urban transport systems: A methodology to design dedicated zones. Transp. Res. Procedia 2017, 27, 230–237. [Google Scholar] [CrossRef]
- Muthanna, M.S.A.; Lyachek, Y.T.; Musaeed, A.M.O.; Esmail, Y.A.H.; Adam, A.B.M. Smart system of a real-time pedestrian detection for smart city. In Proceedings of the 2020 IEEE Conference of Russian Young Researchers in Electrical and Electronic Engineering (EIConRus), Moscow/St. Petersburg, Russia, 27–30 January 2020; pp. 45–50. [Google Scholar]
- Cook, N.; Hughes, R. Shading Liveable Cities: Exploring the ecological, financial and regulatory dimensions of the urban tree canopy. In State of Australian Cities Conference 2015: Refereed Proceedings; Burton, P., Shearer, H., Eds.; State of Australian Cities Research Network: Wollongon, Australia, 2015; pp. 1–10. [Google Scholar]
- Associação Brasileira De Normas Técnicas. NBR 10151: Acústica-Medição E Avaliação de Níveis de Pressão Sonora Em Aeas Habitadas-Aplicação de Uso Geral; Associação Brasileira De Normas Técnicas: Sâo Paulo, Brazil, 2019. [Google Scholar]
- Legislatura de la Ciudad Autónoma de Buenos Aires, Argentina. Ley 1540: Control de la Contaminación ACústica-Prevención -Control–Corrección-Contaminación Acústica; Gobierno de la Ciudad de BA: Buenos Aires, Argentina, 2004.
- Amado, H.; Ferreira, S.; Tavares, J.P.; Ribeiro, P.; Freitas, E. Pedestrian–vehicle interaction at unsignalized crosswalks: A systematic review. Sustainability 2020, 12, 2805. [Google Scholar] [CrossRef]
- Fistola, R.; Gallo, M.; La Rocca, R.A.; Russo, F. The effectiveness of urban cycle lanes: From dyscrasias to potential solutions. Sustainability 2020, 12, 2321. [Google Scholar] [CrossRef]
- Noring, L. Public asset corporation: A new vehicle for urban regeneration and infrastructure finance. Cities 2019, 88, 125–135. [Google Scholar] [CrossRef]
- Torres, C.; Sobreira, L.; Castro-Neto, M.; Cunto, F.; Vecino-Ortiz, A.; Allen, K.; Hyder, A.; Bachani, A. Evaluation of pedestrian behavior on mid-block crosswalks: A case study in Fortaleza—Brazil. Front. Sustain. Cities 2020, 2. [Google Scholar] [CrossRef]
- Lima, J.P.; Machado, M.H. Walking accessibility for individuals with reduced mobility: A Brazilian case study. Case Stud. Transp. Policy 2019, 7, 269–279. [Google Scholar] [CrossRef]
- Asplund, D.; Pyddoke, R. Optimal fares and frequencies for bus services in a small city. Res. Transp. Econ. 2020, 80, 100796. [Google Scholar] [CrossRef]
- Highway Capacity Manual: 2000: Transportation Research Board: Books; Transportation Research Board Publisher: Washington, DC, USA, 2000; p. 1287. ISBN 0-309-06681-6.
- Saaty, T.L. Decision making—the analytic hierarchy and network processes (AHP/ANP). J. Syst. Sci. Syst. Eng. 2004, 13, 1–35. [Google Scholar] [CrossRef]
- Gómez López, D.; del Caño, A.; de la Cruz, M.P.; Josa, A. Metodología genérica para la evaluación de la sostenibilidad de sistemas constructivos. El método MIVES. In Sostenibilidad y Construcción (en Prensa); Asociación Científico-Técnica del Hormigón (ACHE): Madrid, Spain, 2012. [Google Scholar]


Publisher’s Note: MDPI stays neutral with regard to jurisdictional claims in published maps and institutional affiliations. |
© 2021 by the authors. Licensee MDPI, Basel, Switzerland. This article is an open access article distributed under the terms and conditions of the Creative Commons Attribution (CC BY) license (http://creativecommons.org/licenses/by/4.0/).