1. Introduction
Italy is one of the countries with the greatest seismic risk in the Mediterranean area, owing to its particular geographical position, but also to the fragility of the building heritage [
1,
2].
The Civil Protection Department has grouped the Italian municipalities according to four seismic hazard classes based on intensity, location, and frequency of past seismic phenomena. The latest elaboration of the Civil Protection [
3] notes that almost half of the national territory is in a high risk area (seismic zone 1 or seismic zone 2), with as many as 3002 municipalities falling into high risk areas (39%). By comparing this survey with the 2011 census data available at the municipal level, it can be seen that the largest part of buildings exposed to risk is mainly for residential use, and that over 56% of the existing residential buildings in seismic zones 1 and 2 were built before 1970. This heritage usually does not include the use of anti-seismic construction techniques [
4].
The evolution of anti-seismic technology and engineering, the use of sensors and geomatics techniques for monitoring infrastructures [
5,
6] and historical-monumental [
7], and the occurrence of tragic telluric events have led to evaluation of the possibility of carrying out interventions relating to the adoption of anti-seismic measures, which vary according to geographic areas, the maintenance state of the buildings, and their age [
8,
9]. In this direction, we have to highlight the great possibility offered by new technologies in order to manage catastrophes and emergencies through LIDAR images [
10,
11], basing also on the availability of heritage digitalization processes [
12].
The first important novelty in the panorama of earthquake prevention laws refers to the Civil Protection Ordinance no. 3274 of 2003, issued in response to the earthquake of the 31 October 2002 into two Italian regions, Molise and Puglia [
13]; it radically modified the approach to anti-seismic design, defining the first significant elements in the field of seismic classification of the national territory and providing for the exclusive adoption of the semiprobabilistic calculation method for ultimate limit states.
The Italian government simultaneously launched a regulatory program aimed at mitigating the seismic risk on the national territory, especially after the 2009 L’Aquila earthquake [
14], when the “National seismic risk prevention plan” was launched (Law 77/2009). An organic multi-year prevention program was established, which includes interventions on public and private buildings, the use of new technical construction standards based on the performance levels of buildings (NTC2008), seismic zoning studies, and analyses on emergency limit conditions in order to prevent or reduce damage.
The unpredictability of seismic events and the long duration of real estate cycles contribute to the low sensitivity, which characterize the real estate sector user with respect to the issue of seismic risk mitigation, unless an event that “awakens” attention occurs [
15].
It should also be added that the seismic improvement or adaptation interventions can be very onerous both from an economic and logistical point of view, sometimes even penalizing from an aesthetic one, so that it is difficult for a private citizen, alone or in a consortium with other owners, to carry out structural interventions.
Proof of this is the fact that the government’s grand plan for the safety of the building stock, launched immediately after the devastating earthquake of 2016, and authorized by the European Union as “exceptional expenditure”, therefore off the balance sheet, was a failure. The main weapon was to be the so-called “Sismabonus”, a very high tax deduction, up to 85% of the expenditure, on works intended to strengthen the seismic resistance of buildings. However, against a budget of 2 billion euros authorized by the EU for incentives, just 14.6 million euros were disbursed in 2017. A very significant fact, considering that at the same time Italians have used important tax deductions attributable to other renovations, energy redevelopment, and even to the purchase of new furniture.
The epidemiological crisis caused by the coronavirus and the long lockdown of economic activities have then determined devastating effects on economic, social, and employment levels, and a heavy contraction significantly greater than that related to other disasters or disastrous natural events [
16,
17,
18].
Facing this serious situation, various regulatory measures have been adopted containing financial and fiscal provisions aimed at supporting the building sector, already severely affected by a long and serious crisis. In particular, the so-called Relaunch Decree no. 34/2020, converted in the law of the 17 July 2020 no. 77, intended to incentivize actions aimed at improving the structural health and performance of buildings, promoting important tax deductions with the aim of encouraging private initiative.
The 110% deduction of expenses, to be divided into five equal annual rates, can be used in different ways: Deduction, discount on the invoice, and credit transfer.
The real novelty of the financial intervention lies in the possibility for taxpayers of transferring the accrued tax credit to goods and services suppliers, credit institutions and financial intermediaries, or, finally, other parties involved in the transformation process. Providing for the possibility of transferring the tax credit to other subjects, the regulatory intervention intends to further support the action of citizens, avoiding the important money anticipation necessary to carry out this type of intervention and resolving the phenomenon of the so-called incapable, that is, those who, having no tax debt, or having it lower than the credit, could not benefit from the deduction [
19].
It should be added that the decree has also been accompanied by a substantial and captivating promotional campaign that had been lacking in previous actions, essential to guarantee adequate information and even more to solicit the awareness of the ordinary citizen. Risk perception plays a key role in promoting a structured, widespread, and real requalification of the Italian real estate assets.
Although from an in-depth analysis of the real theoretical and practical possibilities of intervention significant limits on applicability can be grasped, the decree draws real estate users’ attention to the urgent need for safeguarding life when significant seismic events happen and, on the other hand, for limiting the damage caused to the building during minor events (probably more frequent) and, therefore, protecting the value of their properties.
The decree somehow encourages private intervention by taking on the economic burden, but the action could be even more effective if it could be demonstrated that the structural interventions not only protect the value of the building, but also determine an increase greater than the transformation cost.
The residual obstacle linked to the logistical inconveniences related to this kind of transformation could, in fact, be countered by demonstrating the existence of an economic benefit in the owner’s portfolio as a “premium for the inconvenience”, quantifiable in the net increase in the market value of properties subject to structural redevelopment.
It should be noted, in fact, that building transformation is configured as a real estate investment, which must be matched with a return, an economic return commensurate with the risks and cash flows, presumably equal to the difference in the net value of the property subject to redevelopment.
In this perspective, the present work intends to address the issue of seismic upgrading/improvement of buildings from an appraisal perspective. Identifying criteria and methods capable of quantifying in monetary terms the economic convenience for transformation in the light of the International Valuation Standards (IVS) [
20]; in addition, identifying among the planned structural interventions, the most effective in terms of economic performance.
In light of the types of anti-seismic interventions envisaged by the 2018 NTC (paragraph 2), the appraisal analysis methodology is described (paragraph 3); the application of the method to a real case (paragraph 4) and the analysis of its results (paragraph 6) lead to the demonstration of the economic benefit—and not only social and environmental ones—of the interventions supported by fiscal and financial incentives (paragraph 6).
2. Seismic Safety Assessment and Seismic Risk Mitigation Actions
Seismic safety assessment is a quantitative procedure [
21], carried out on an existing structure, which establishes whether or not it resists the combinations of project actions, defined by the 2018 NTC [
22]; it determines the maximum extent of the actions it bears, within the safety margins made explicit by the rules.
The safety assessment of existing buildings is mandatory in case of:
- -
Evident reduction of the resistance and/or deformation capacity of the entire structure or of some parts of it. The causes of this reduction can be: Environmental actions and exceptional ones (such as earthquakes, excessive vertical loads, shocks, etc.); seabed subsidence; deterioration and decay of the mechanical characteristics of the materials (such as masonry degradation, concrete reinforcement corrosion, etc.).
- -
Design or building mistakes.
- -
Significant variation in variable loads related to a change in the intended use of the structure or parts of it.
- -
Interventions, including non-structural ones, which reduce the capacity or modify the stiffness of the load-bearing elements.
According to the Ordinance of the Council of Ministers President (O.P.C.M) 3274/2003 and subsequent amendments, the assessment is always mandatory for existing buildings classified as significant or strategic (use class III and IV).
The results of the checks allow definition of whether or not there is a need for interventions to make the structure compliant with safety criteria.
The categories of structural intervention, identified by the NTC, for existing buildings are:
- -
Adaptation interventions aimed at increasing the safety level of the existing building by achieving the safety levels required by the regulations. The safety assessment defines whether after the intervention, the structure resists the combinations of the design actions, reaching the required degree of safety. The project must refer to the entire structure and the performance expected for the various limit states must be guaranteed in terms of strength, ductility, and deformability.
- -
Improvement interventions, aimed at increasing the safety level of the existing building, without necessarily reaching the levels required by the regulations, increasing the resistance to the actions considered. Design and safety assessment will cover both the individual parts of the structure, subject to potential changes in behavior, and the whole structure.
- -
Repairs or local intervention concerning individual parts and/or limited portions of the building, not suitable for the function they must perform. Design and safety assessment will refer only to the objects affected by intervention, and must guarantee an improvement of the pre-existing safety conditions without significantly changing the overall behavior of the structure.
The adaptation and improvement interventions must be obviously subjected to static testing.
In order to draw up an intervention project, it is necessary to identify the existing structural system and its state of stress that defines a model and allows the definition of structural behavior.
The historical-critical analysis of the building is the first step. It is necessary: To find all the documents related to the first construction, such as drawings and project reports, as well as any subsequent interventions or test reports; to recover the current legislation, if any, at the time of construction; to evaluate deformations, instability, and crack patterns and their evolution over time; to consider the historical and urban aspects that have affected the building aggregate of which the building is part; and to verify how many and which earthquakes the building has suffered in the past.
The geometric-structural survey is used to know the overall geometry of the building. Structural elements must be described as fully as possible by in situ investigations, including pacometric, thermographic, sonic, and endoscopic tests. The state of conservation and the quality of the materials of the building elements, the identification of instability, crack patterns and damage mechanisms, are fundamental elements for defining the building resistant structure.
With the survey operations, the building current state is represented, through plans, elevations, sections, and construction details; survey can also detect all the changes that have taken place over time.
The mechanical characterization of materials concerns the knowledge of the resistance and deformability characteristics of the building materials. It is obtained through: (a) Existing documentation; (b) in situ diagnostic investigations, such as carbonation, sclerometric, ultrasonic, sonic tests, and flat jacks; and (c) sample investigations, such as tensile and compression tests.
The cognitive phases described above lead to the definition of the three levels of knowledge and of the correlated confidence factors, which are used as additional partial safety factors since they consider the shortcomings in the parameter knowledge.
The three levels of knowledge are:
- -
LC1: Historical-critical analysis, complete geometric survey, limited investigations on construction details, and limited tests on the mechanical characteristics of the materials must have been carried out; the corresponding confidence factor is FC = 1.35.
- -
LC2: Historical-critical analysis, complete geometric survey, extensive investigations on construction details, and extensive tests on the mechanical characteristics of the materials must have been carried out; the corresponding confidence factor is FC = 1.2.
- -
LC3: Historical-critical analysis, complete and accurate geometric survey in every part, exhaustive investigations on construction details, and exhaustive tests on the mechanical characteristics of the materials must have been carried out; the corresponding confidence factor is FC = 1.
The NTC also prescribe the values and combinations of the actions, both non-seismic and seismic ones, to be considered for safety checks and they give indications about the materials to be used for interventions on existing buildings.
The vulnerability assessment [
23] influences the choice of the type, technique, extent, and urgency of the intervention to be carried out on the building. This intervention must primarily counter the development of local mechanisms and/or fragile mechanisms as well as improve the overall behavior of construction. When choosing the intervention, economic, technical feasibility, accessibility, and environmental-artistic constraints have to be considered.
Some possible global interventions are based on: (1) Additional systems, such as reinforced concrete walls, steel braces; (2) dissipation systems, such as dissipative bracing; (3) insulation systems.
Some possible local interventions are: (1) Repair (injection of cracks, replacement of reinforcements, replacement of degraded concrete); (2) reinforced concrete (jackets); (3) steel reinforcement (jacketing and plating); and (4) FRP reinforcement.
For all building types, the project of the intervention, as required by the standard, must at least include: (a) The analysis and verification of the structure before the intervention, with identification of the deficiencies and the level of seismic action for which the ultimate limit state (ULS) (and the exercise limit state SLE if required) is reached; (b) the choice, explicitly motivated, of the type of intervention; (c) the explicitly motivated choice of techniques and/or materials; (d) the preliminary sizing of reinforcements and any additional structural elements; (e) the structural analysis of the post-intervention structure; (f) verification of the post-intervention structure, with determination of the level of seismic action for which the ULS is reached (and SLE if required).
With reference to the Italian regulatory and fiscal framework, it should be noted that the anti-seismic interventions described above give the right to a 110% deduction when they bring an improvement that allows the upward passage from one class to the next—for properties located in seismic zones 1, 2, and 3. The certification of the effectiveness of the structural intervention is assessed through eight seismic risk classes ranging from letter A + (earthquake-resistant building) to letter G (unsafe building in case of earthquake); a classification always referring to the entire structural unit and not distinguished by single real estate ones, drawn up on the basis of the guidelines contained in the recent Ministerial Decree 9/January/2020.
It is also interesting to note that the expenses incurred for the construction of continuous structural monitoring systems for anti-seismic purposes are also deductible—provided that they are carried out in conjunction with one of the planned anti-seismic interventions, in compliance with the expenditure limits indicated by current legislation. This opportunity foreshadows the creation of a monitoring network based on the creation of intelligent structures, capable of providing a self-diagnosis of their health status. The dynamic experimental observation of the measured data allows the indicators of the structural health status to be detected, capable of promptly and remotely signaling the onset of damage and/or degradation phenomena [
24,
25].
3. Methods: The Highest and Best Use (HBU)
The economic choice among investment alternatives recalls the transformation value as an economic aspect [
26,
27].
The transformation value can solve the problems of economic efficiency in project analysis: It is a net value (revenues minus costs) equivalent to the net present value of the financial analysis; it takes into consideration the resources, such as they are and/or whether susceptible to enhancement and development through an investment and intervention project; from a methodological point of view it constitutes at the same time a criterion and an evaluation procedure, therefore it directs the decision-making process and it quantifies the economic profitability; as a monetary value, it lends itself as a basis for the preparation of quantitative indices of economic efficiency [
28].
In the economic field, the transformation value is calculated from the difference between the expected value of the resources, once the construction of the work or intervention has been considered, and the overall cost of carrying out the project measured at the time of the valuation.
In principle, improvement and enhancement interventions should have positive effects on the market value of the properties and encourage the redevelopment of buildings in the medium term.
However, it is useful to identify a working method that can demonstrate the real economic convenience of the building transformation, or to pass the screening of economic checks (one of the sustainability constraints) because if the promoter—that is the one who hires the transformation initiative—does not detect the conditions for obtaining a profit commensurate with the risk, he does not activate the development process that leads to the realization of the project.
All economic investments, before being implemented, must verify the principles of economic rationality [
29]. More precisely,
- -
An investment choice must increase the economic benefit.
- -
Among the equally possible transformation alternatives, the one that, in relation to the nature of the induced economic consequences, minimizes costs or maximizes revenues, or maximizes the difference between revenues and costs, must be preferred.
The calculation of economic convenience follows the principle of incrementality: To formulate the judgment of economic convenience it is enough to take into consideration the incremental economic rates (costs, revenues, investments), i.e., those that result from each choice.
Since the transformation process induces a change in value on real estate resources, the criterion for choosing among the possible transformations must be traced back to the transformation value. This is understood as the value of the resources affected by the transformation intervention carried out according to their economic susceptibility, in compliance with technical, legal, and monetary constraints.
For the real estate appraisal theory, the transformation value is a syncretic economic aspect derived from the combination of the market price and cost, conceptually equivalent to the difference between the expected market value of the transformed property and the related transformation cost:
The transformation cost can be defined as the cost of recovery, redevelopment, and construction, in relation to the type of intervention required by the transformation itself.
The assumption underlying the “transformation value” is that a rational subject is not willing to pay (at present) an asset (i.e., the property to be transformed) at a price higher than the present value of the net (future) benefits that the same asset will be able to produce.
The “(current) transformation value” of the asset (
Vt) is therefore the result of a difference between future revenues (
R) and future costs (
K) relating to the production of the asset, discounted at actuality through an appropriate discount rate
i:
where
t is the time necessary to carry out the transformation.
The transformation value can therefore be used to express judgments of economic convenience relating to recovery and enhancement interventions; it can be used in the appraisal judgment as a valuation method, providing an appraised value; it can also be used in economic judgment ordinarily accepted, pursuing the objective of formulating a choice criterion in real estate investments with reference to a specific investor.
When two or more alternative transformations can be prefigured, the transformation value contributes to integrate the required objectivity requirements of choice, integrating the statistical criterion defined by the ordinariness postulated and allowing the identification of the Highest and Best Use (HBU), that is, the transformation to which the greatest transformation value corresponds [
30].
The HBU refers to transformations:
- -
Physically and technically feasible (technical constraint).
- -
Legally permitted (legal constraint).
- -
Financially feasible (budget constraint).
- -
Economically convenient compared to the current destination (economic criterion).
The conditions are binding in the sense that they must be met before proceeding to the selection of the HBU among the destinations alternative to the existing one.
In the use of the 110% bonus facilities, in particular, the constraint linked to the “legally allowed” factor is often decisive, because a series of “legal” requirements are envisaged. During the building life, owners make some changes in their properties—sometimes irregular ones and difficult to remedy—which can be difficult to detect, especially in condominium buildings, and they can compromise the feasibility of the intervention.
Since it is not at all obvious that transformations are profitable, the transformation value can be useful to valuate the economic convenience, providing an objective numerical indicator Δ conceptually equal to:
where
Vt_i is the transformation value of the
i-th possible transformation (which corresponds to the value of the asset in the post-intervention conditions net of the costs of the transformation
Ki),
Vante is the market value of the building in the current conditions,
Vpost_i is the market market of the building in the conditions following the intervention (considering the quantities referring all to the valuation date).
Considering all the
i = 1, ...,
n possible transformations, the HBU will instead be indicated through the quantification of the aforementioned differential, and represented by the transformation characterized by the condition:
With reference to existing residential buildings, the transformation value criterion described above can be used with reference to two distinct purposes:
- -
Appraising the increase in the property value for the building subject to seismic risk mitigation intervention (∆i), to be understood as the investor’s profit.
- -
Identification of the best performing risk mitigation intervention from an economic point of view (i.e., HBU—∆j).
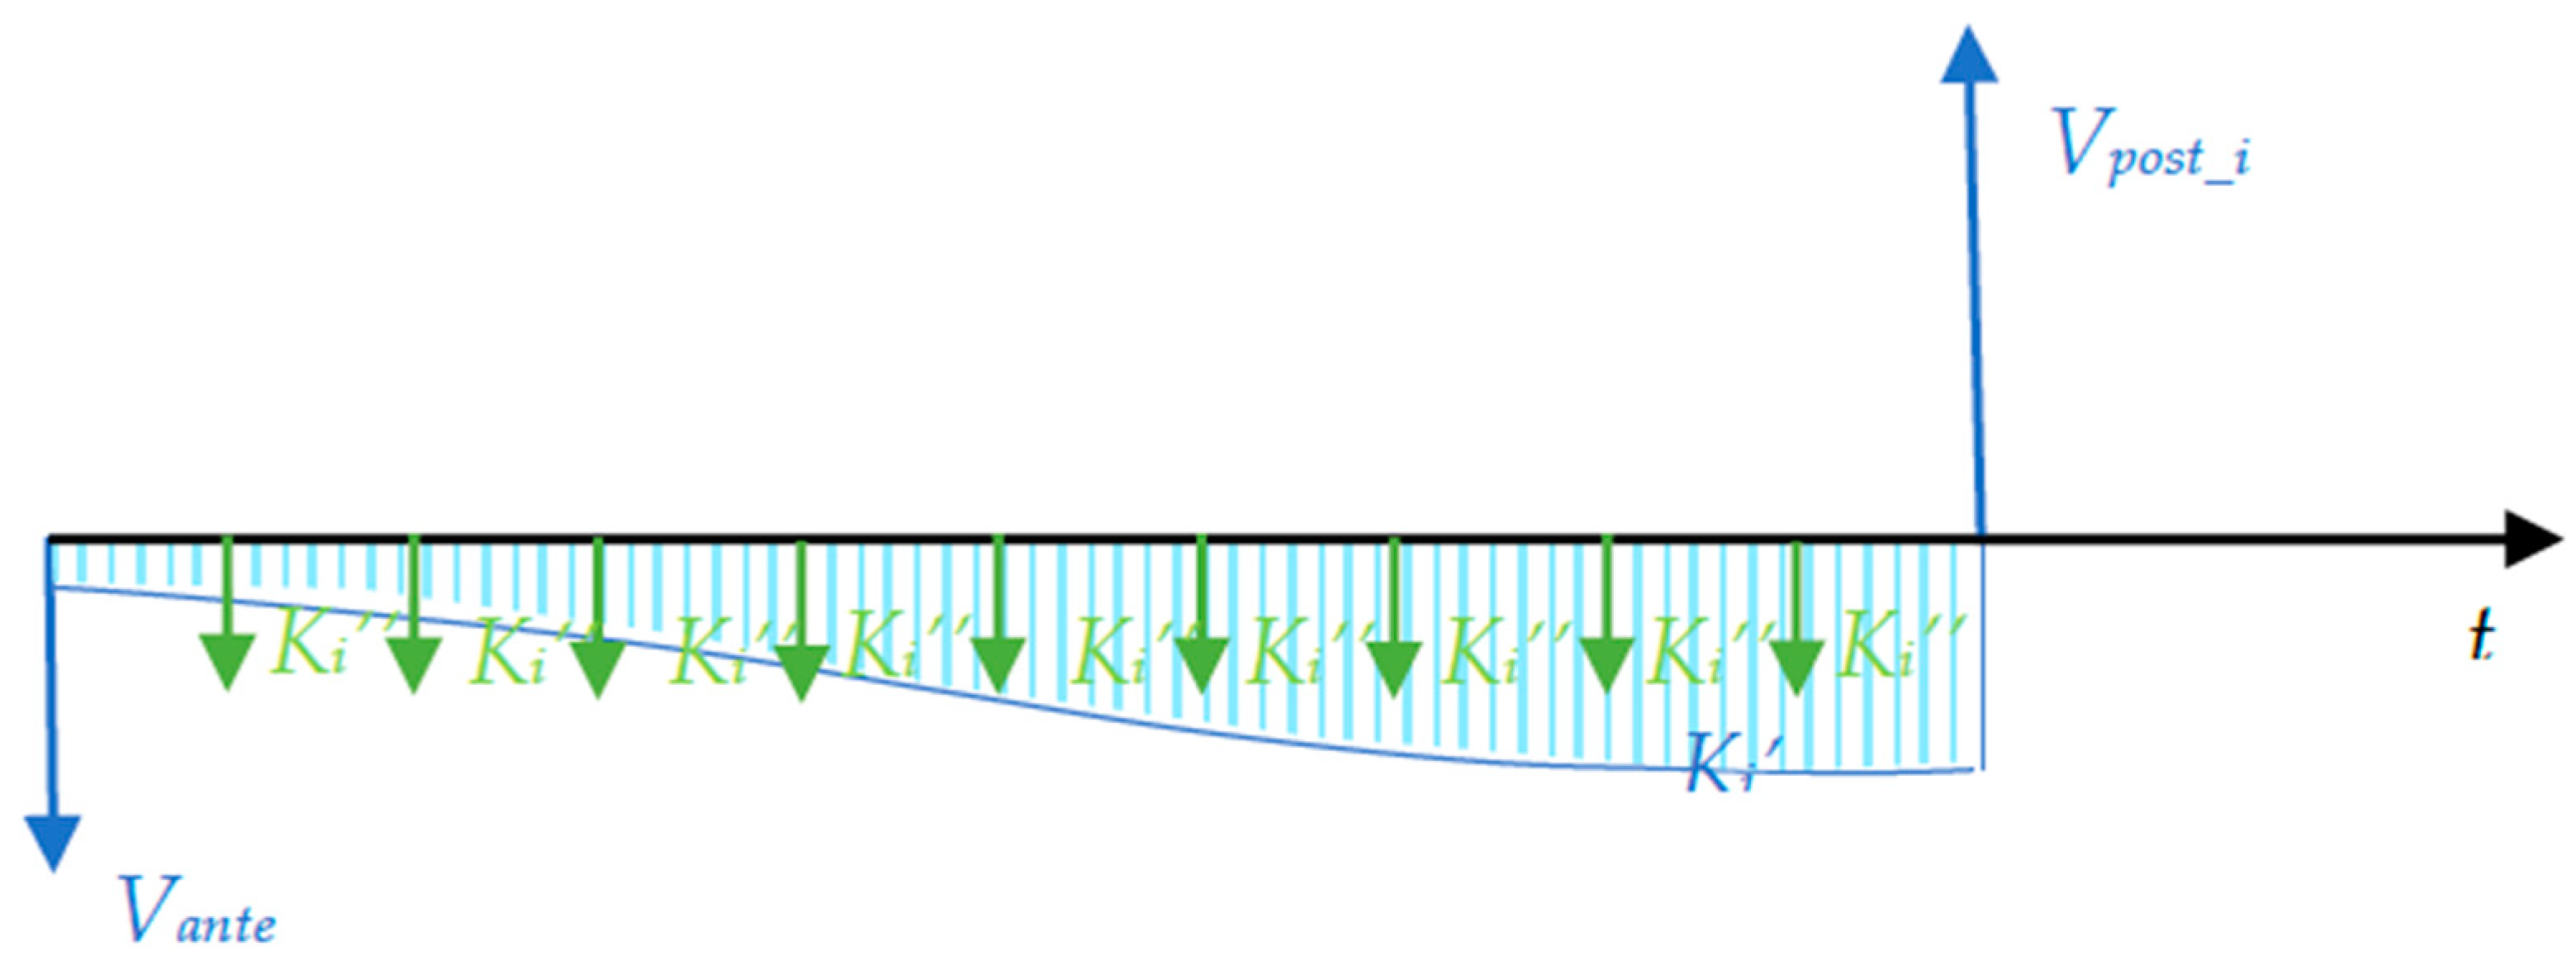
The application of the transformation value criterion requires the preparation of a cash flow, and, therefore, the precise definition of each individual incoming and outgoing rate and the related deadlines.
In general terms, the main financial items are represented by:
- -
The current value (Vante) and the future value of the property (Vpost_i), as reference data of the financial analysis, the former as an outgoing rate (invested capital), the latter as a positive one.
- -
Intervention costs and general expenses, such as outgoing services: Intervention costs properly called
Ki’(raw materials, transport, labor, business profit, planning expenses and general expenses, financial charges, interest), which in the residential construction sector have a tendentially sigmoidal trend with higher costs placed at the end of the construction cycle (owing to the higher incidence of the finishes) [
31]; other
Ki‘’costs (such as relocation and rental costs necessary when the owner has to leave the building to allow the work to be carried out), normally schematized according to the setting of a typical income in constant installments.
The reconstruction of the monetary flows (difference between all monetary income and expenses) of the project over the transformation period can be schematized by means of a cash flow, or by graphically representing on the time axis the different rates (income and expenses) with reference to the different deadlines (
Figure 1).
With reference to the aforementioned scheme, the financial sum of the rates, discounted up to date with an appropriate discount rate, returns the economic measure of transformation convenience Δ, which is the profit that is due to the promoter-owner as a reward for the real estate intervention in terms of net change in market value.
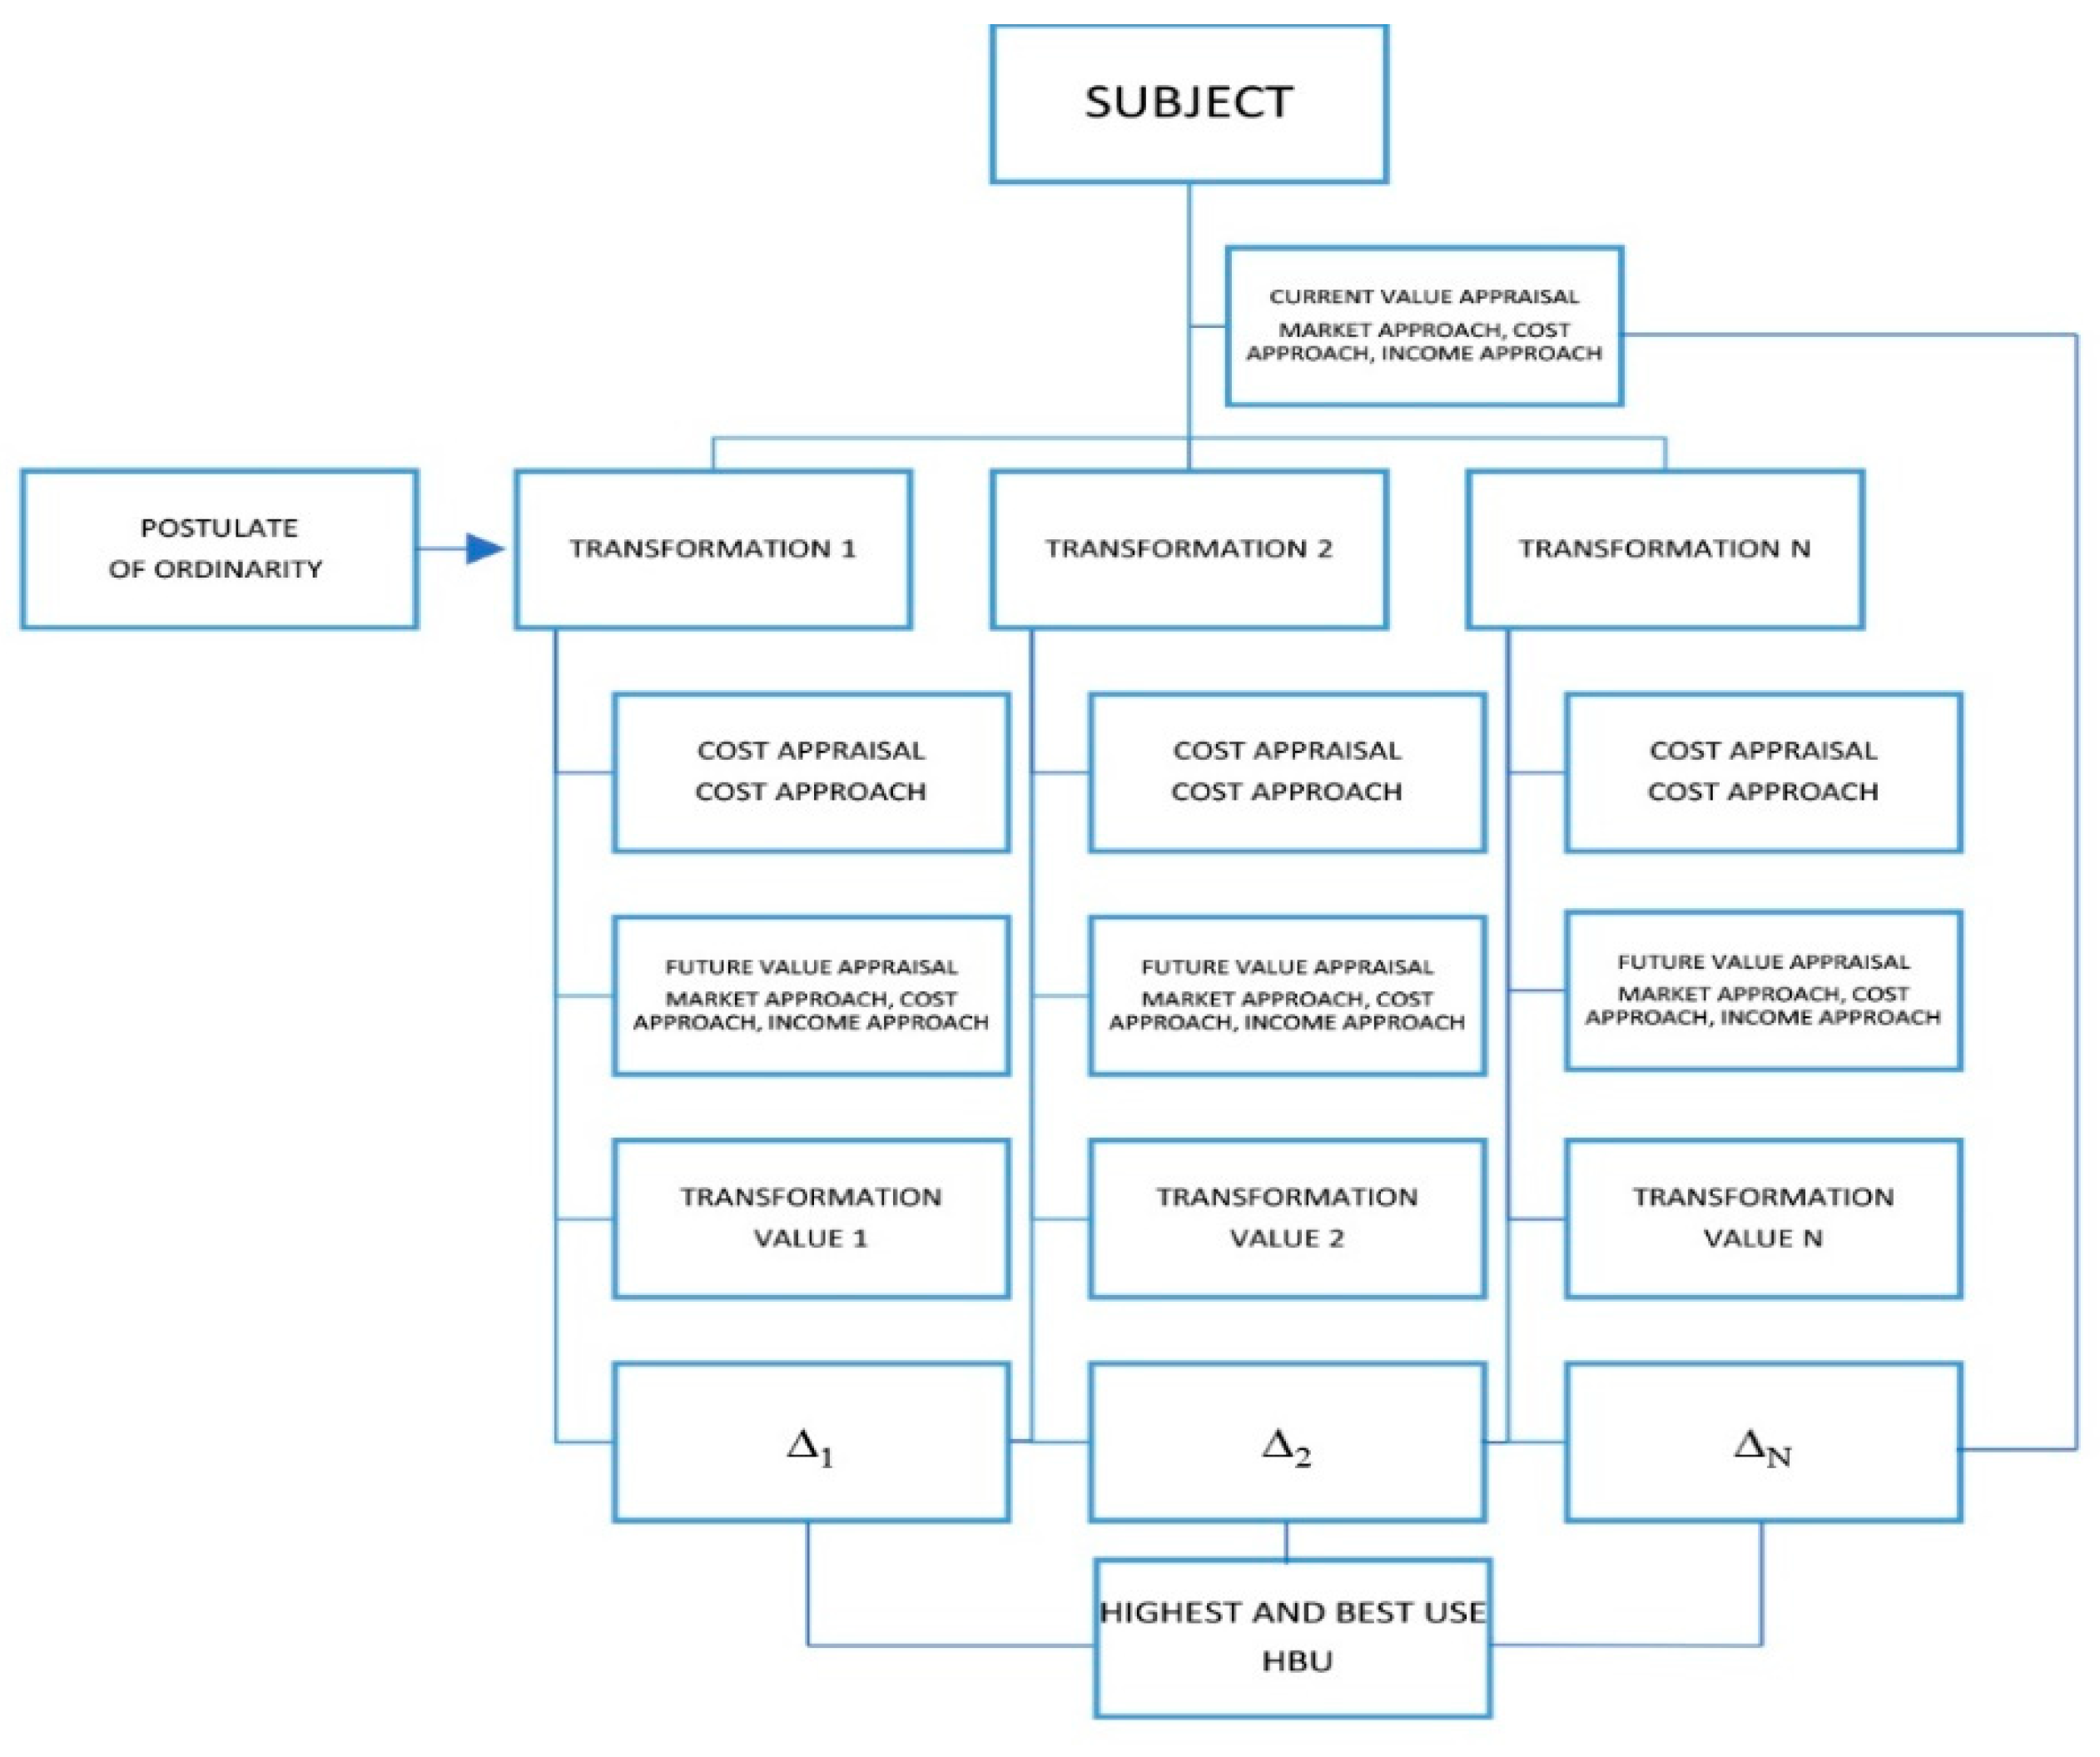
The economic convenience judgment requires the definition of a working method, the setting of an operating algorithm, the identification of executive tools and, nevertheless, the detection of a set of market data essential to set up the evaluation.
The reference framework is represented by the International Valuation Standards that, through the indication of the bases of the value and the appraisal methods, allows the workflow to be defined (
Figure 2).
4. Case Study
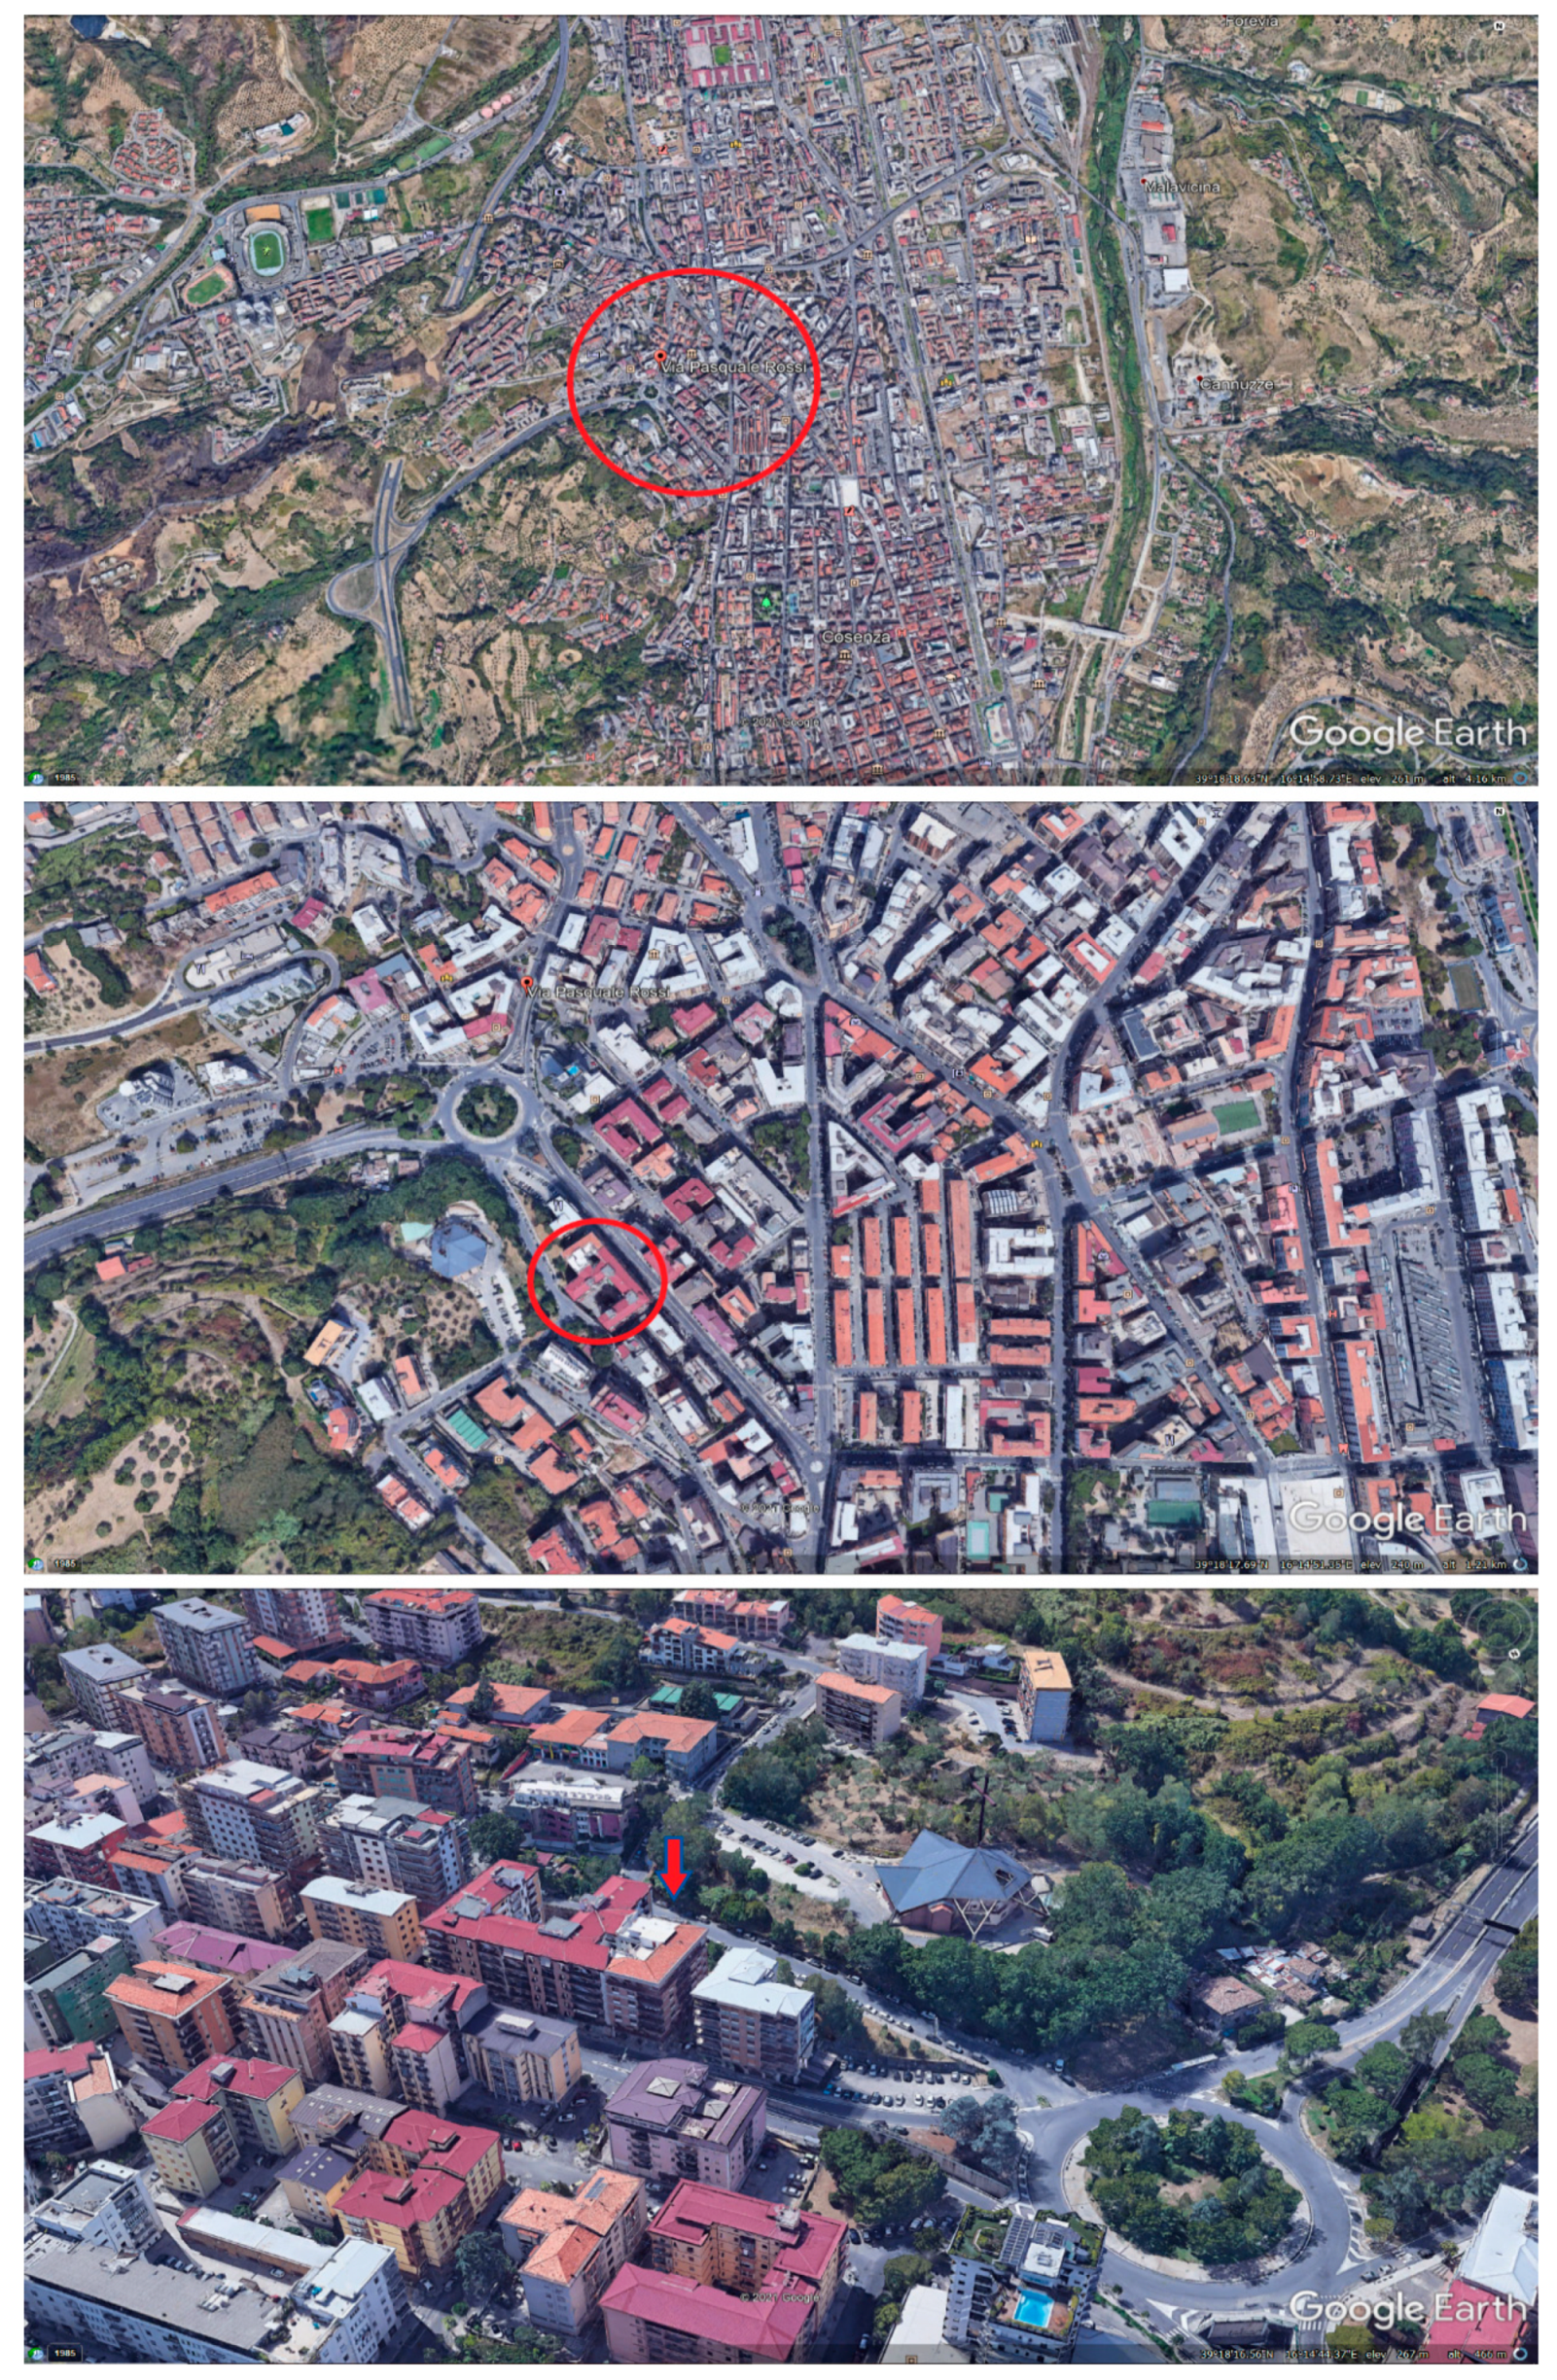
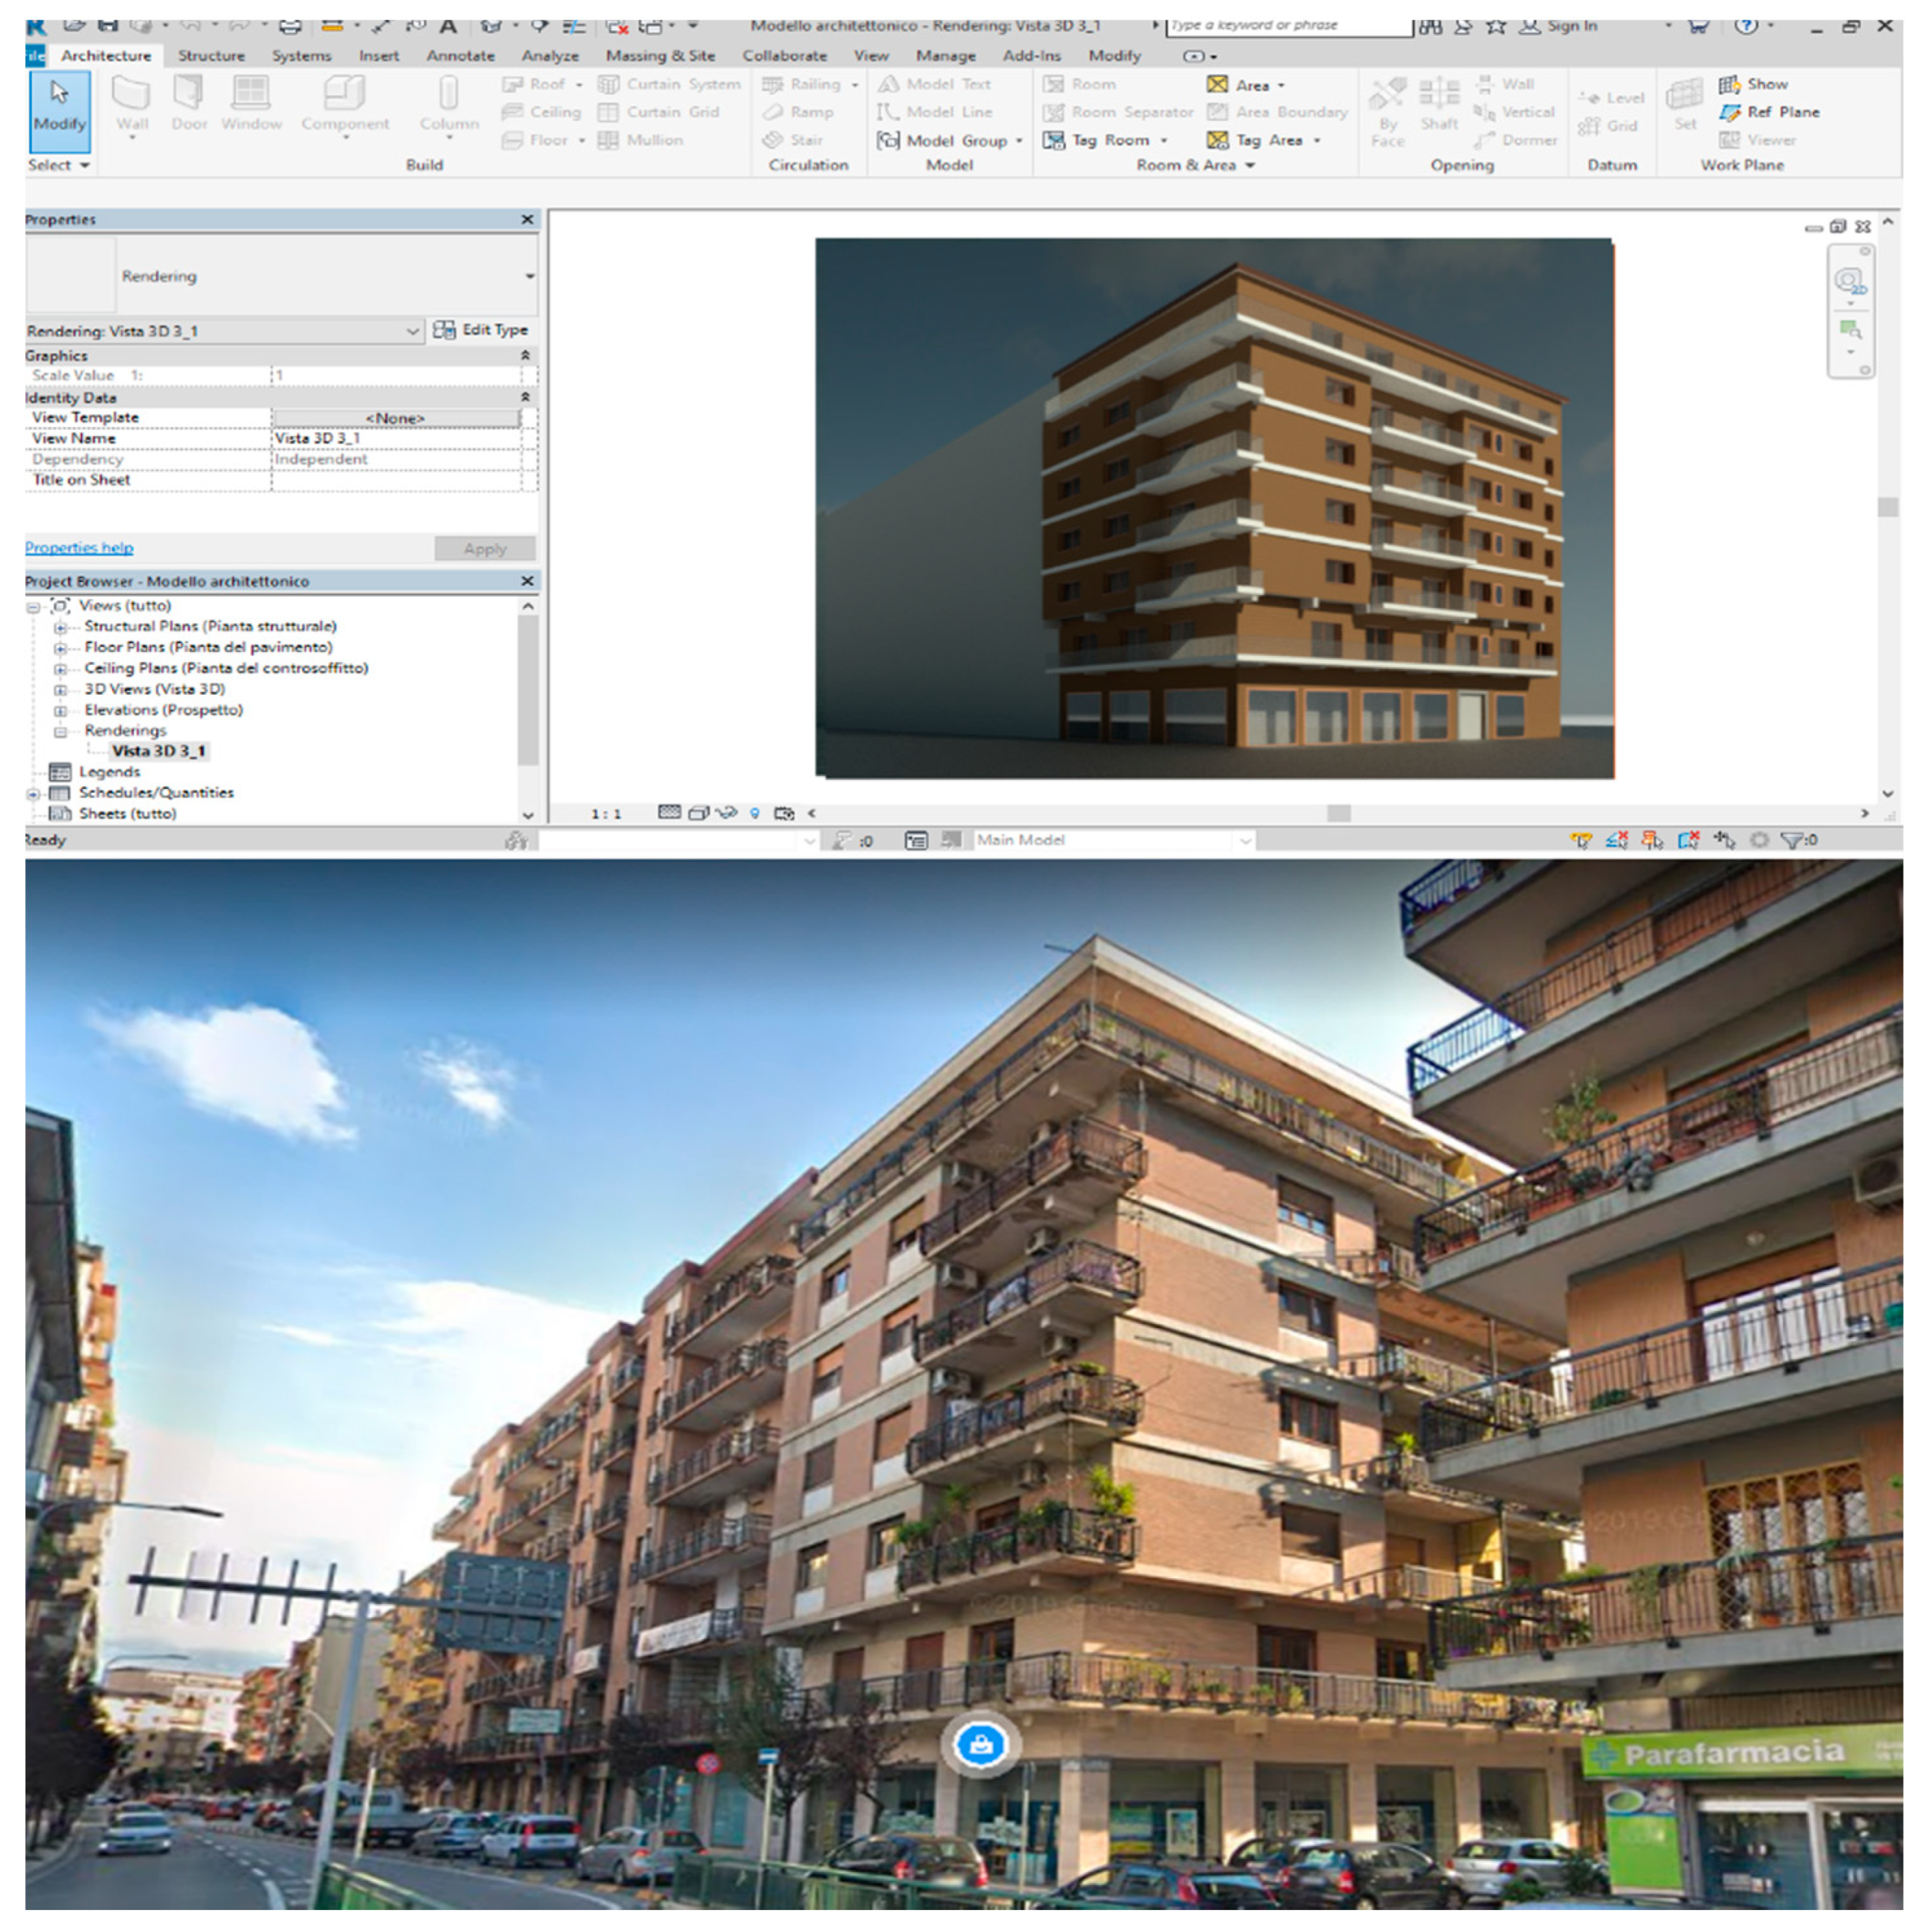
The case study illustrates the application of the workflow. The proposed methodology is applied, for descriptive purposes, to a structural adaptation project of a building located in the Municipality of Cosenza, in a semi-central area located at the motorway access in the southern area of the city. In the area, there are the main services and infrastructures, and there are direct road links to the different parts of the urban area. The area includes a series of 1970s-style buildings, although also more recent constructions are there. The subject building, in particular, is adjacent to others of the same type, arranged linearly along the main road artery (
Figure 3).
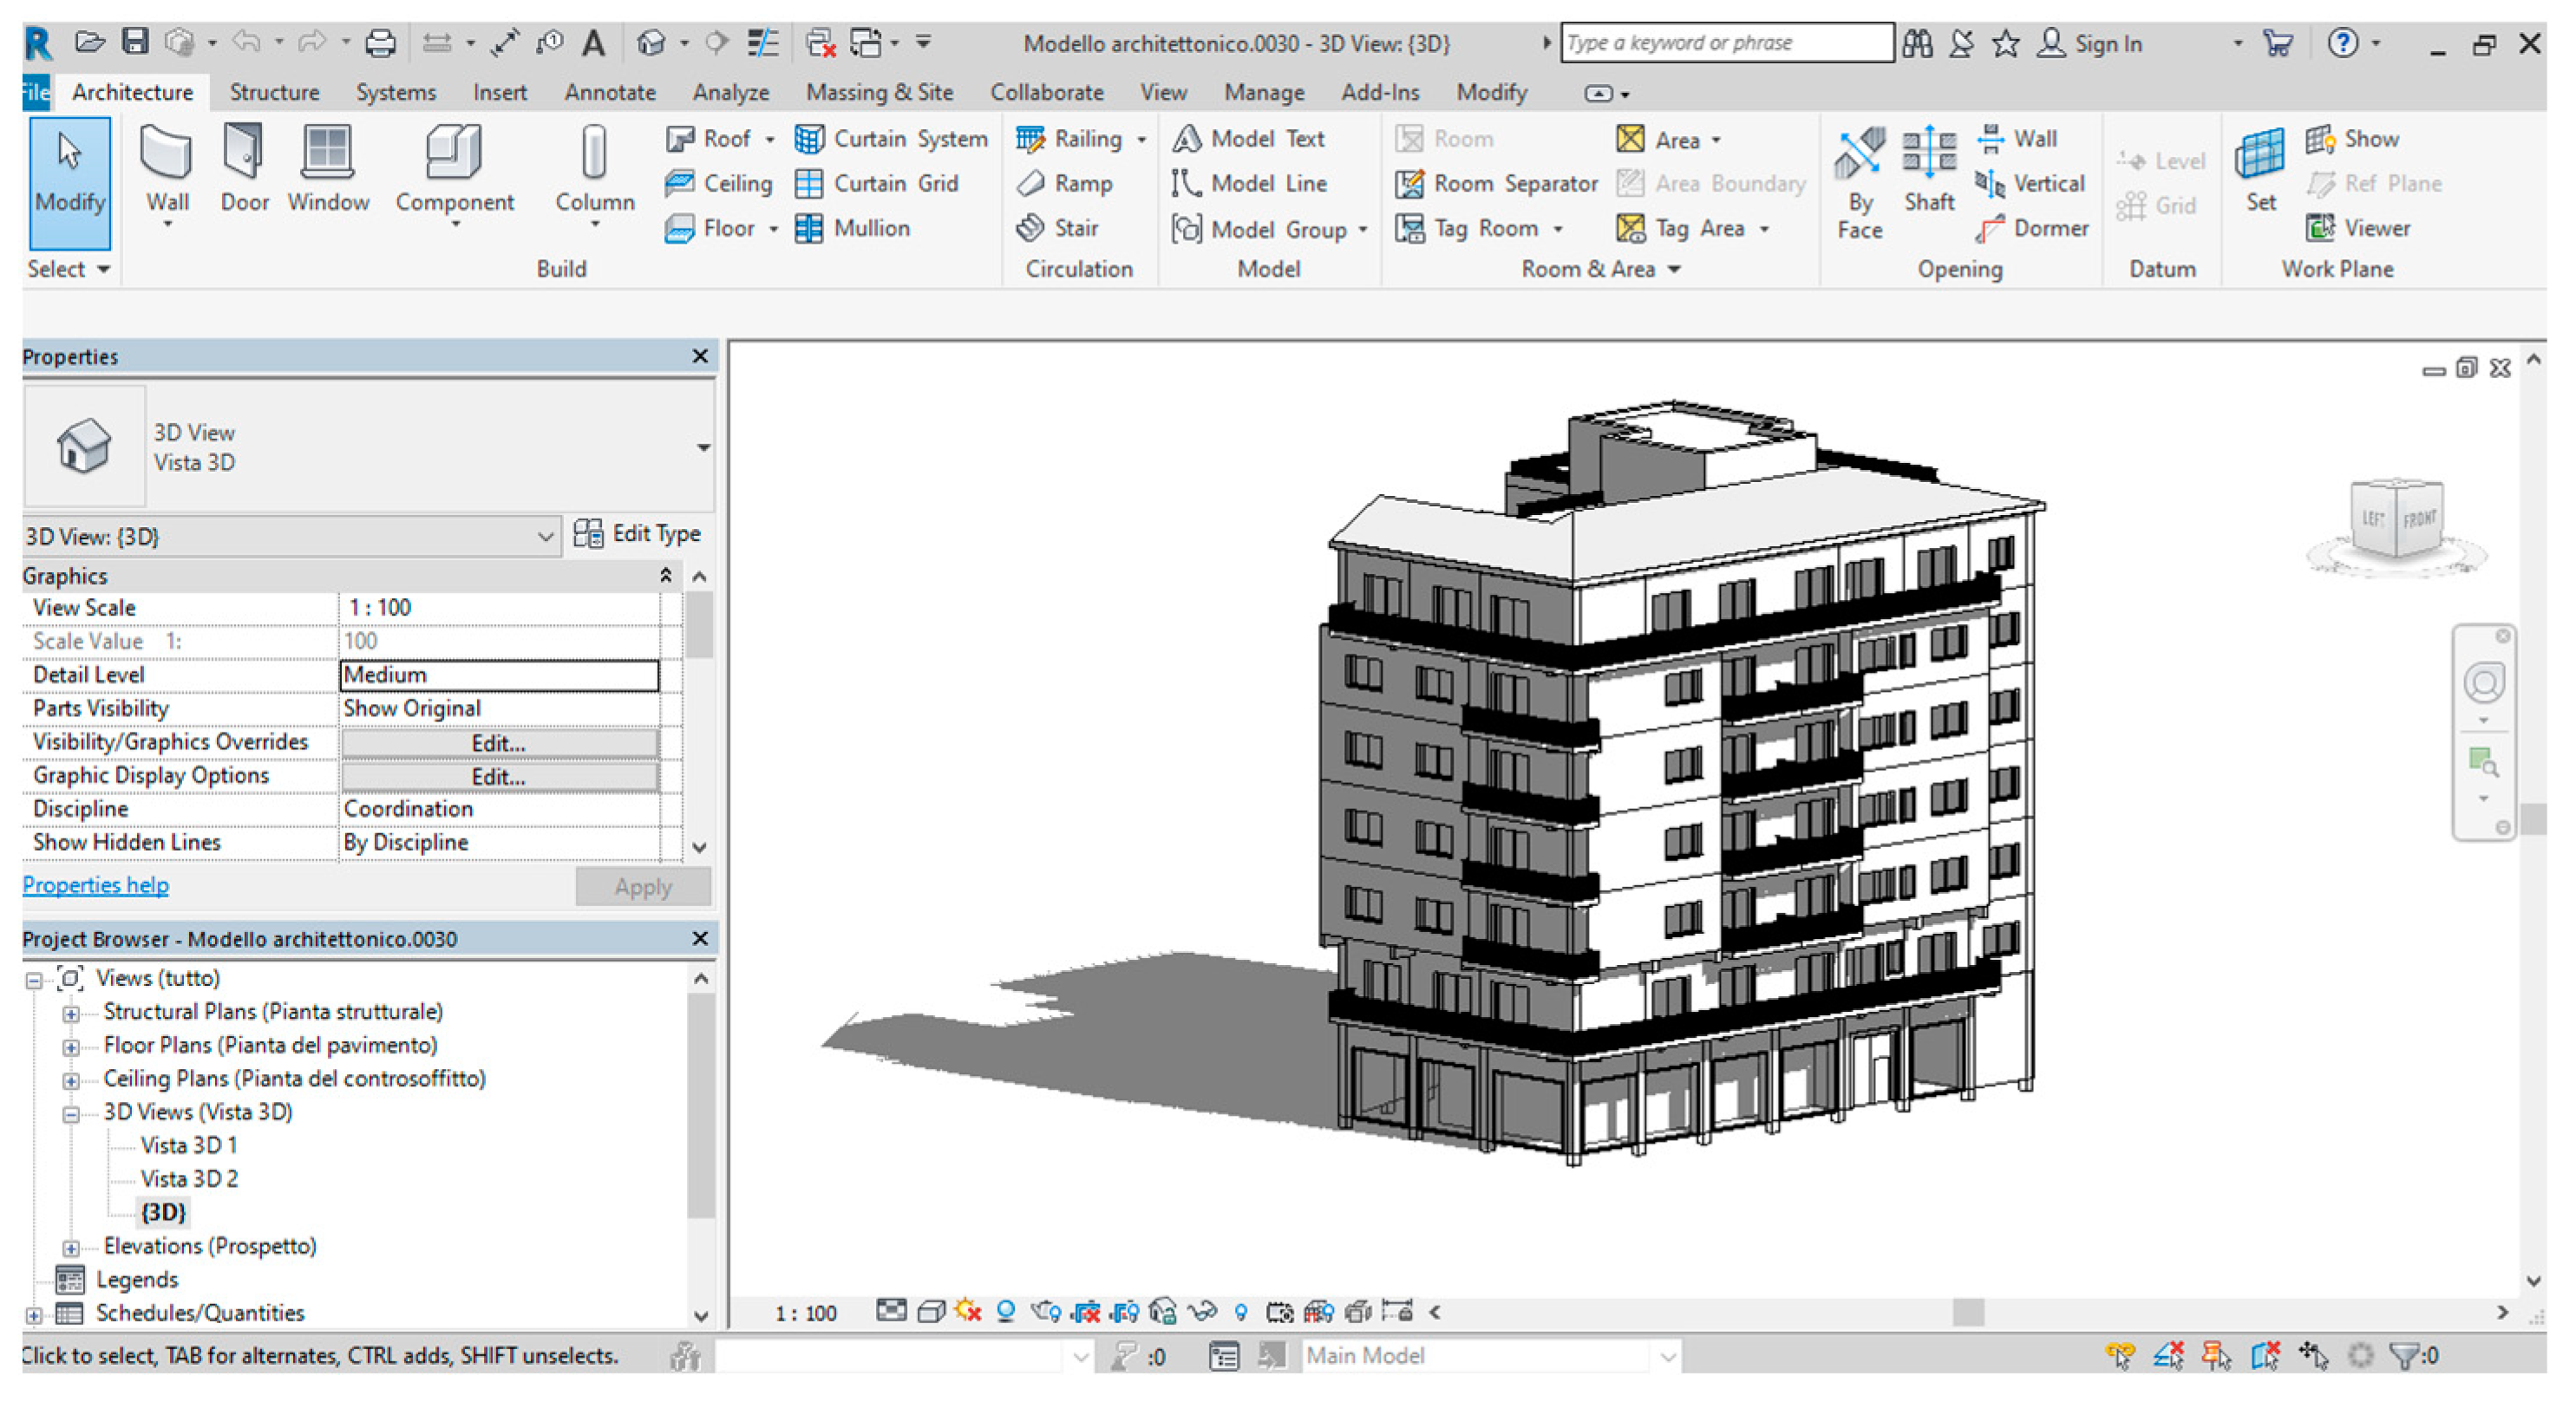
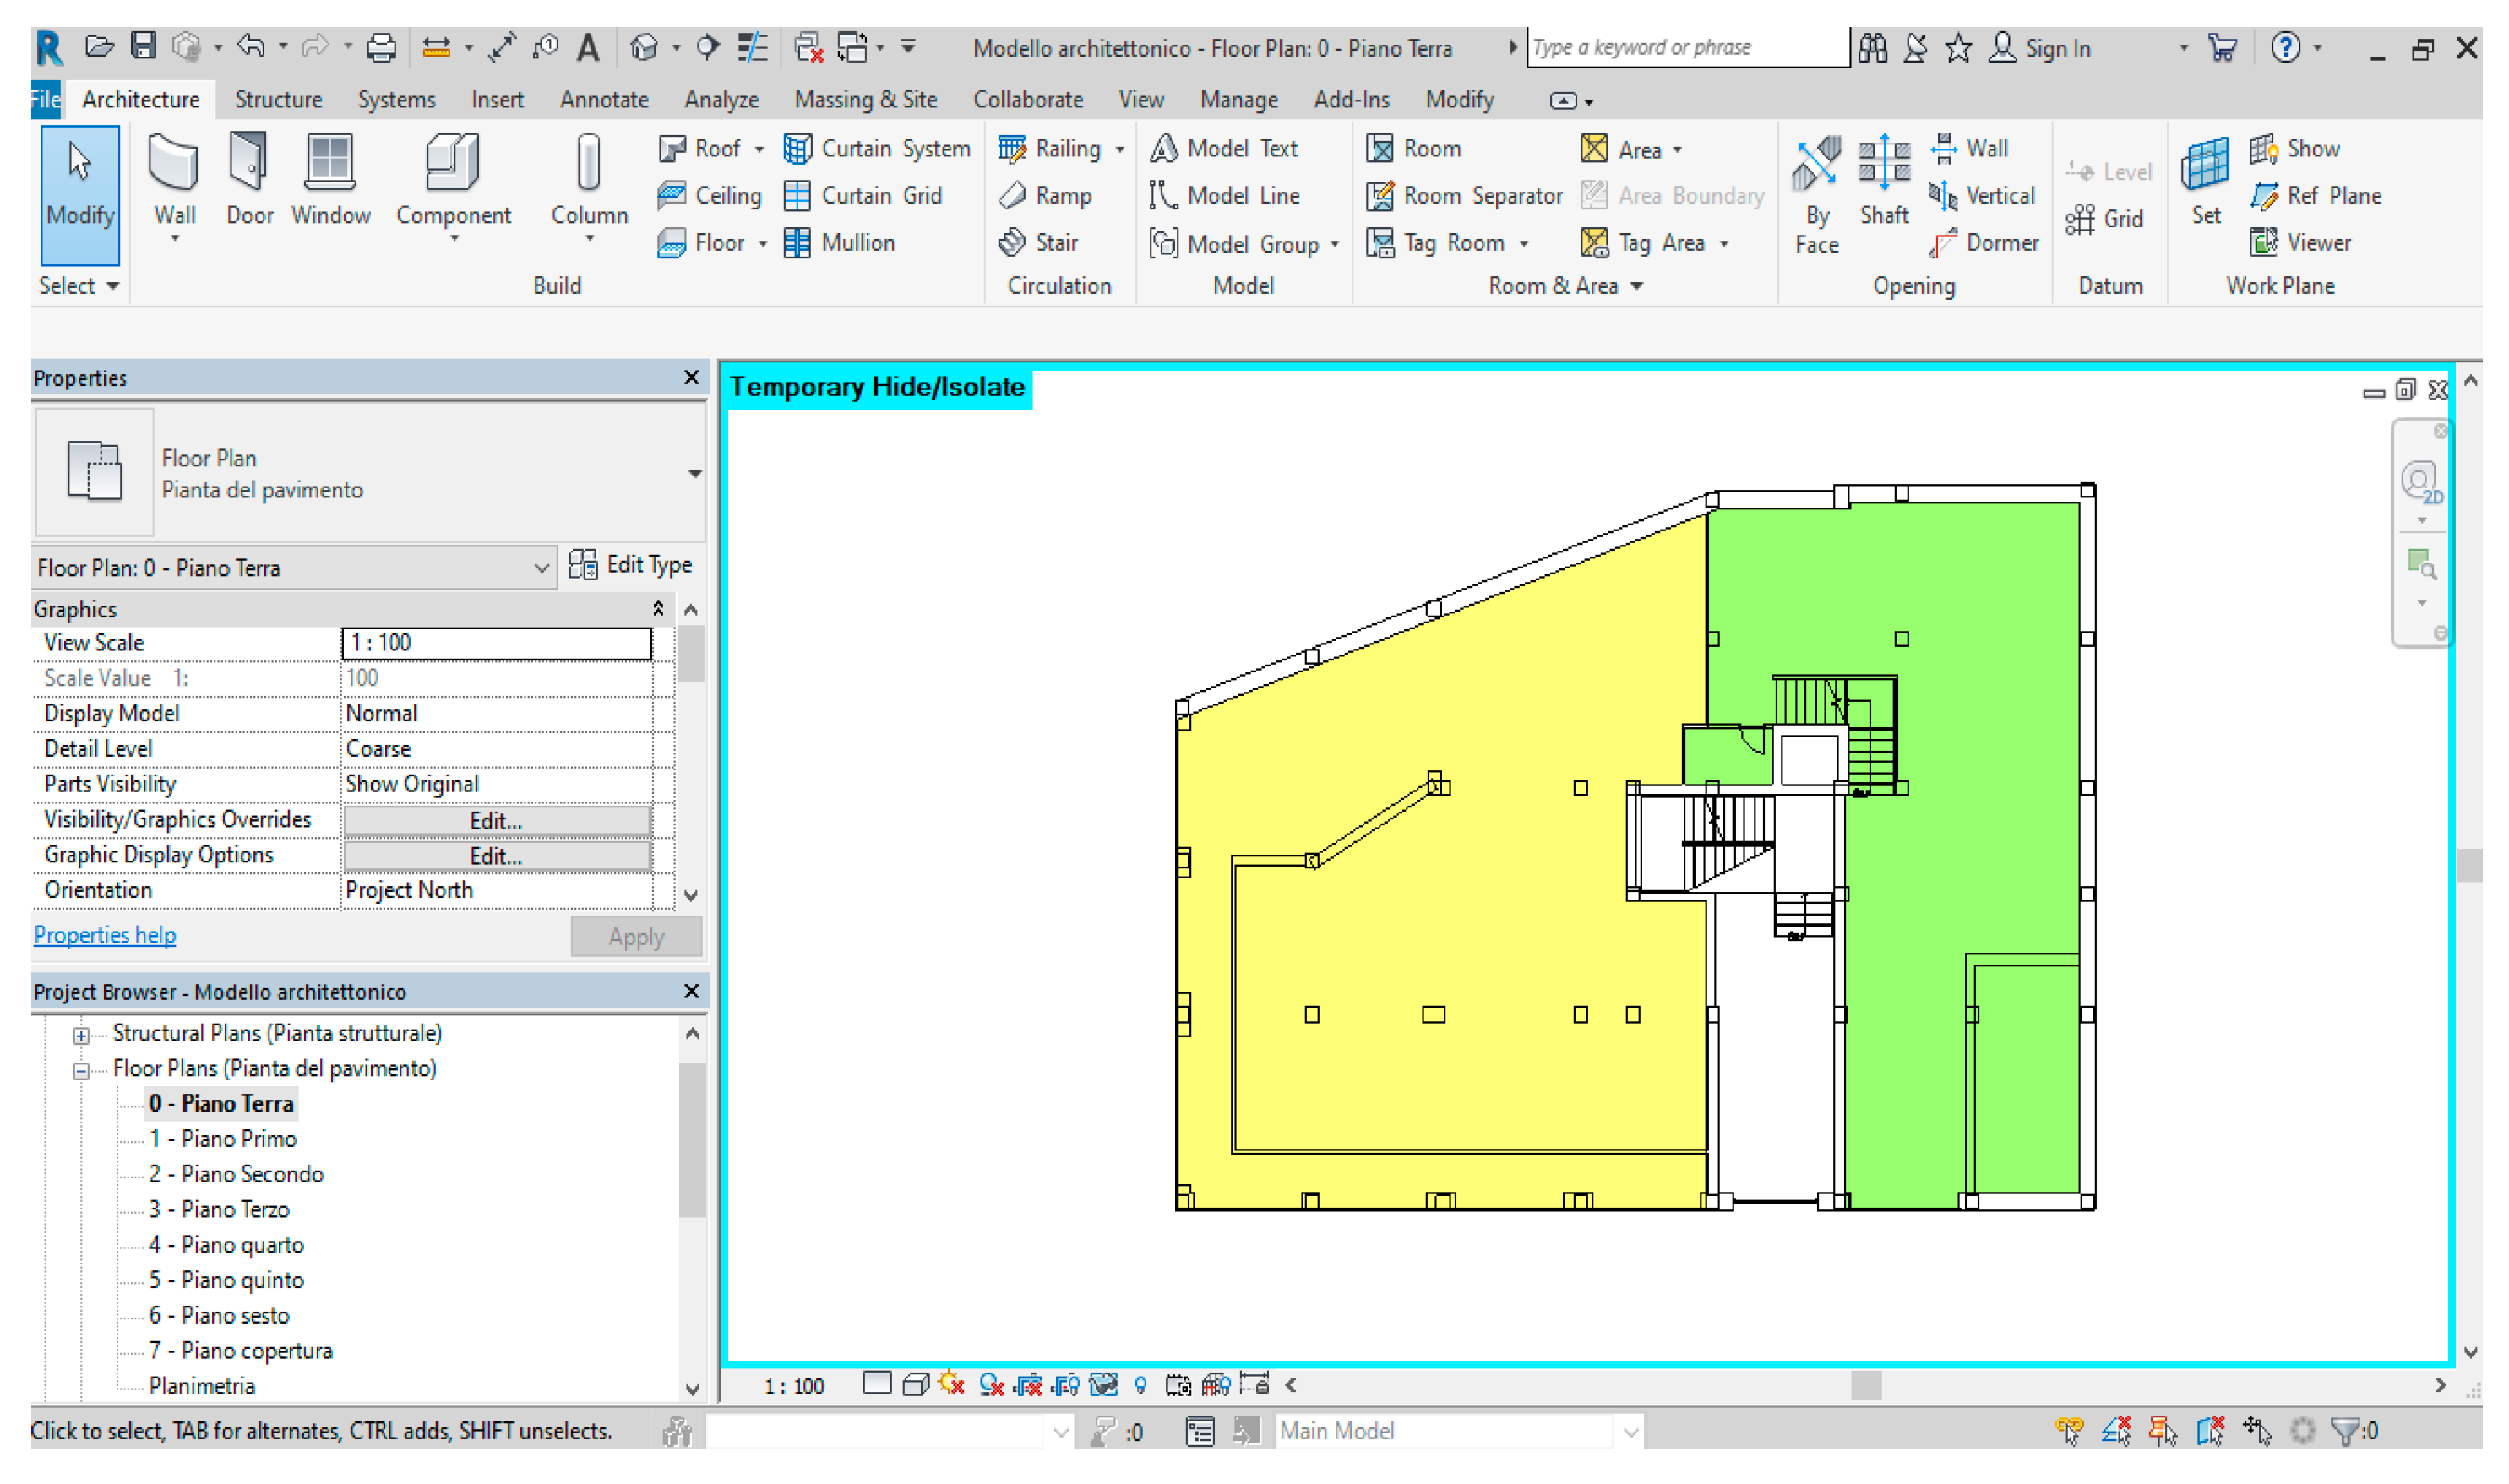
The building, built with a reinforced concrete structure around the 1970s, has a trapezoidal plan and consists of 6 floors above ground, connected by a flight of stairs and an elevator.
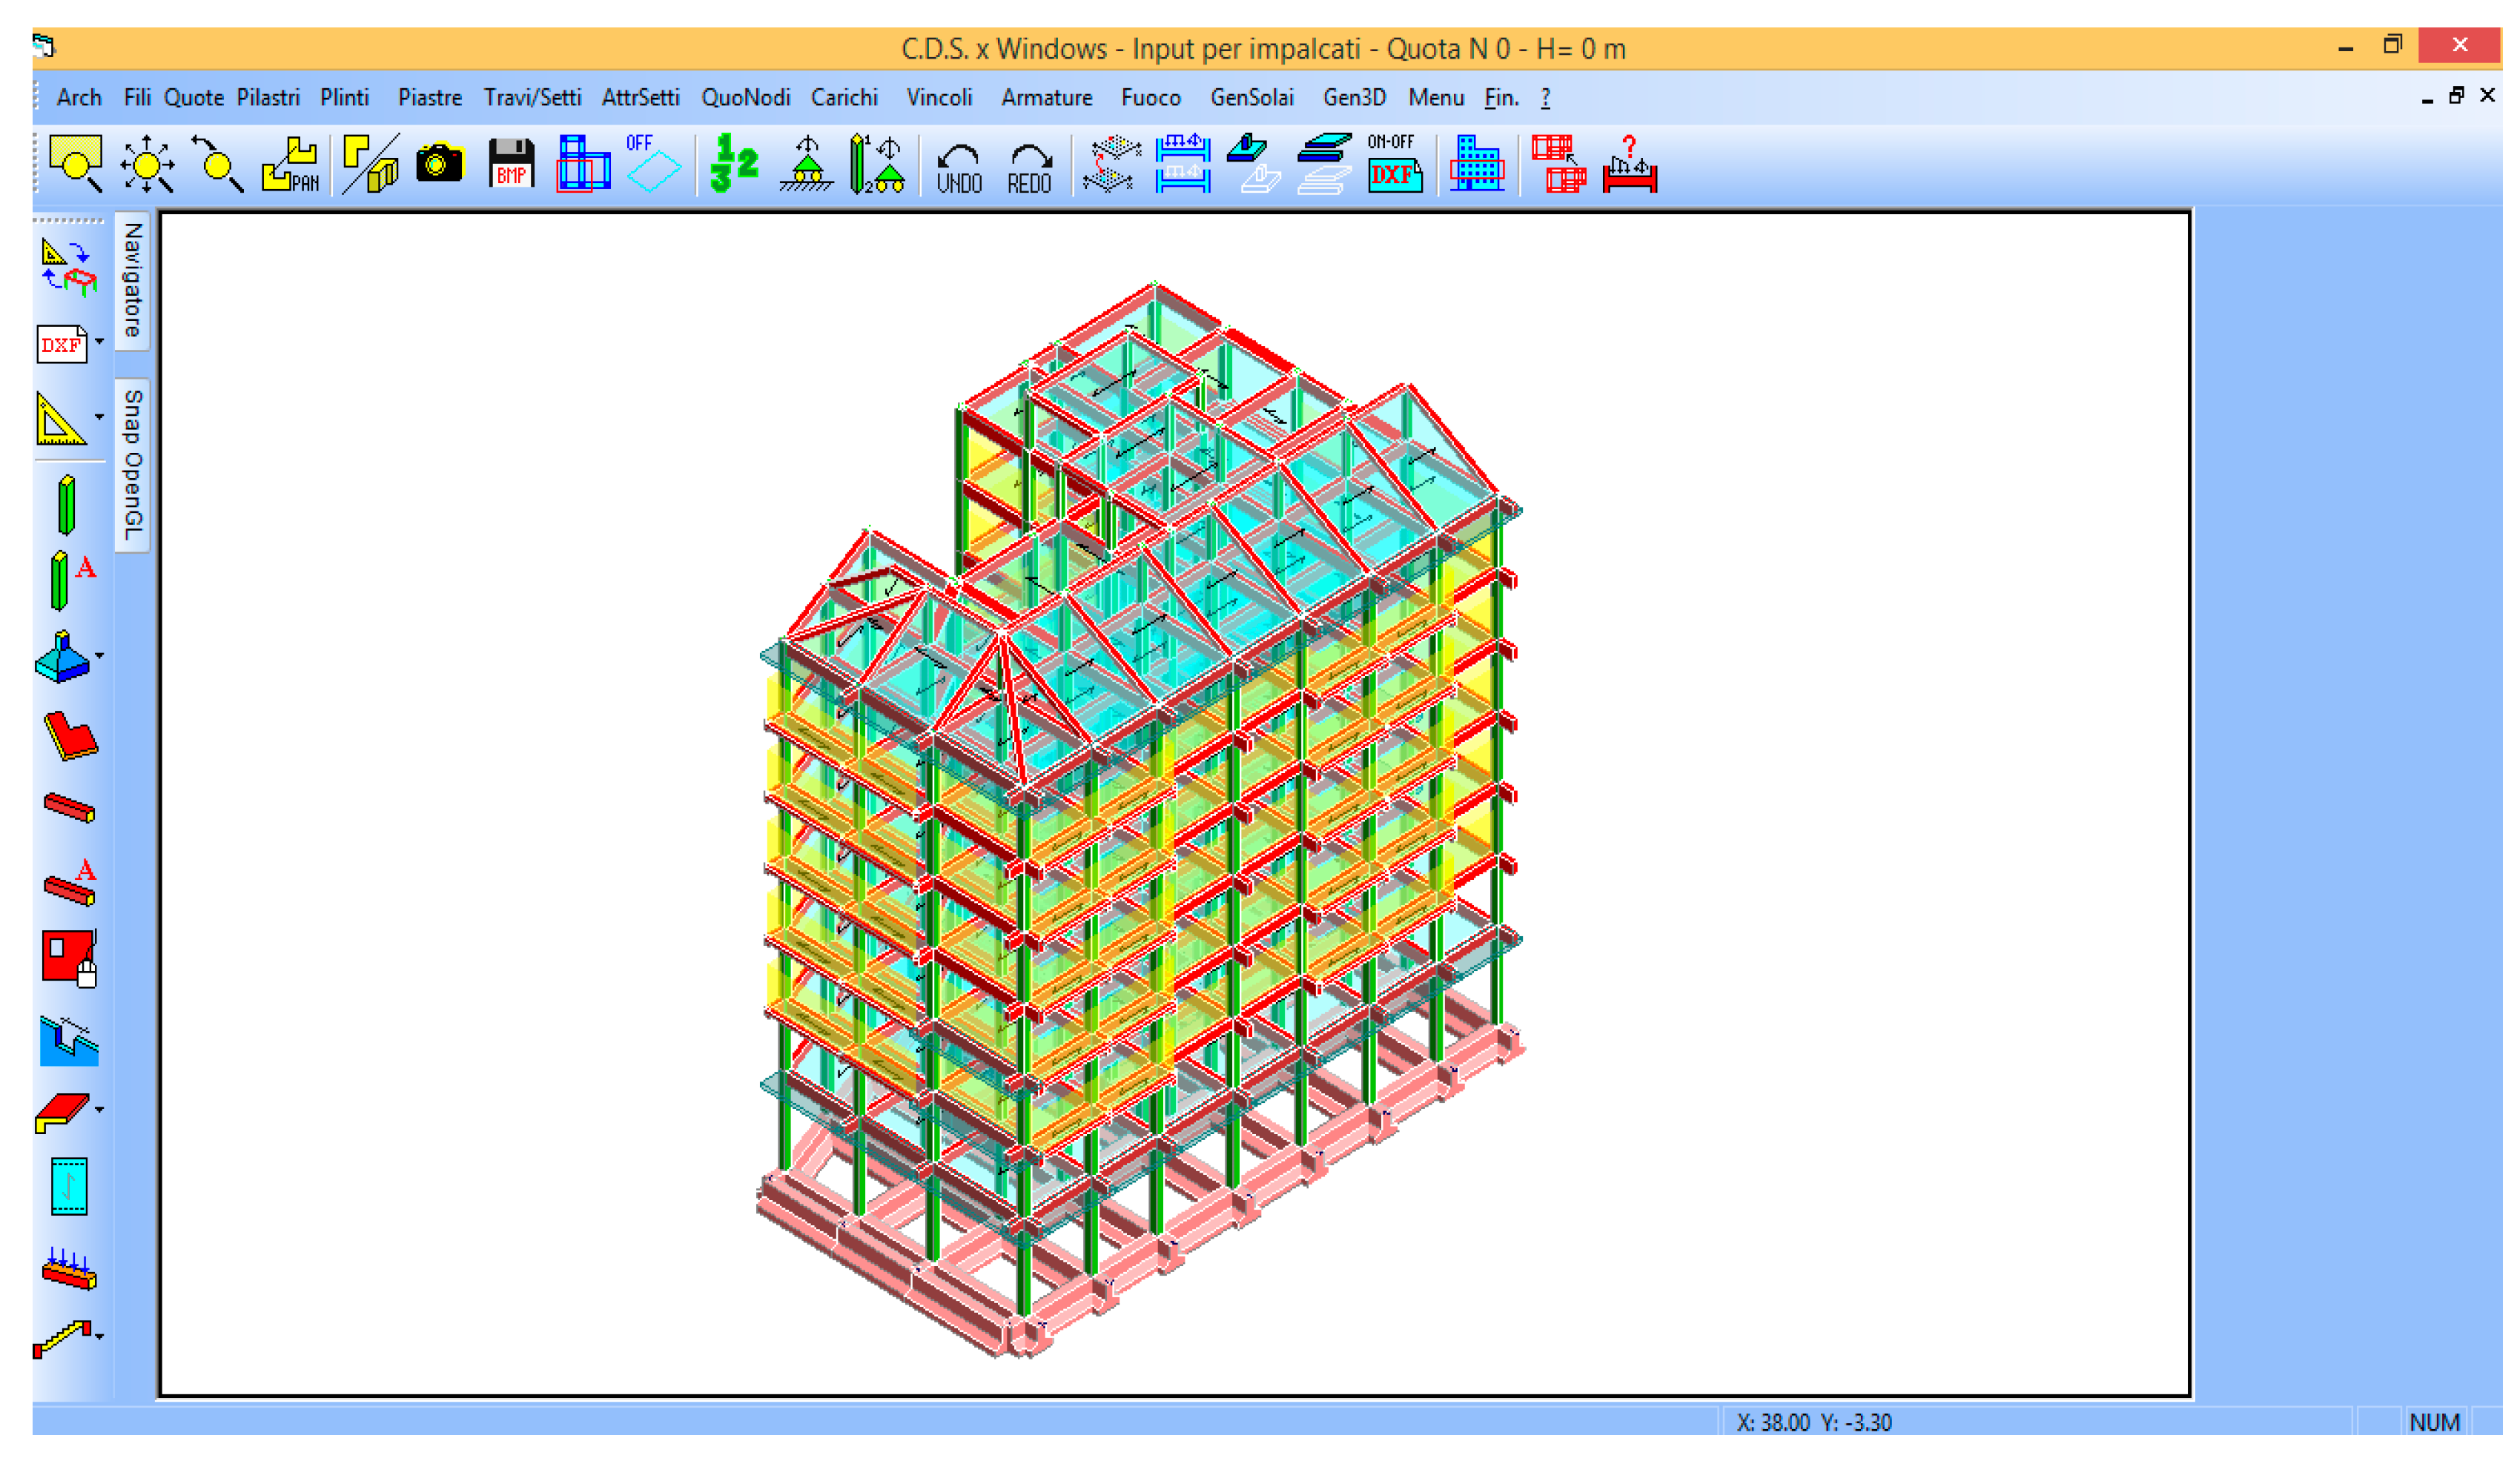
The original executive project is available. The building was reconstructed “as built” in its architectural and structural components, using Building Information Modeling (BIM) software for real estate purposes [
32] (
Figure 4 and
Figure 5).
On the ground floor there are two commercial warehouses (
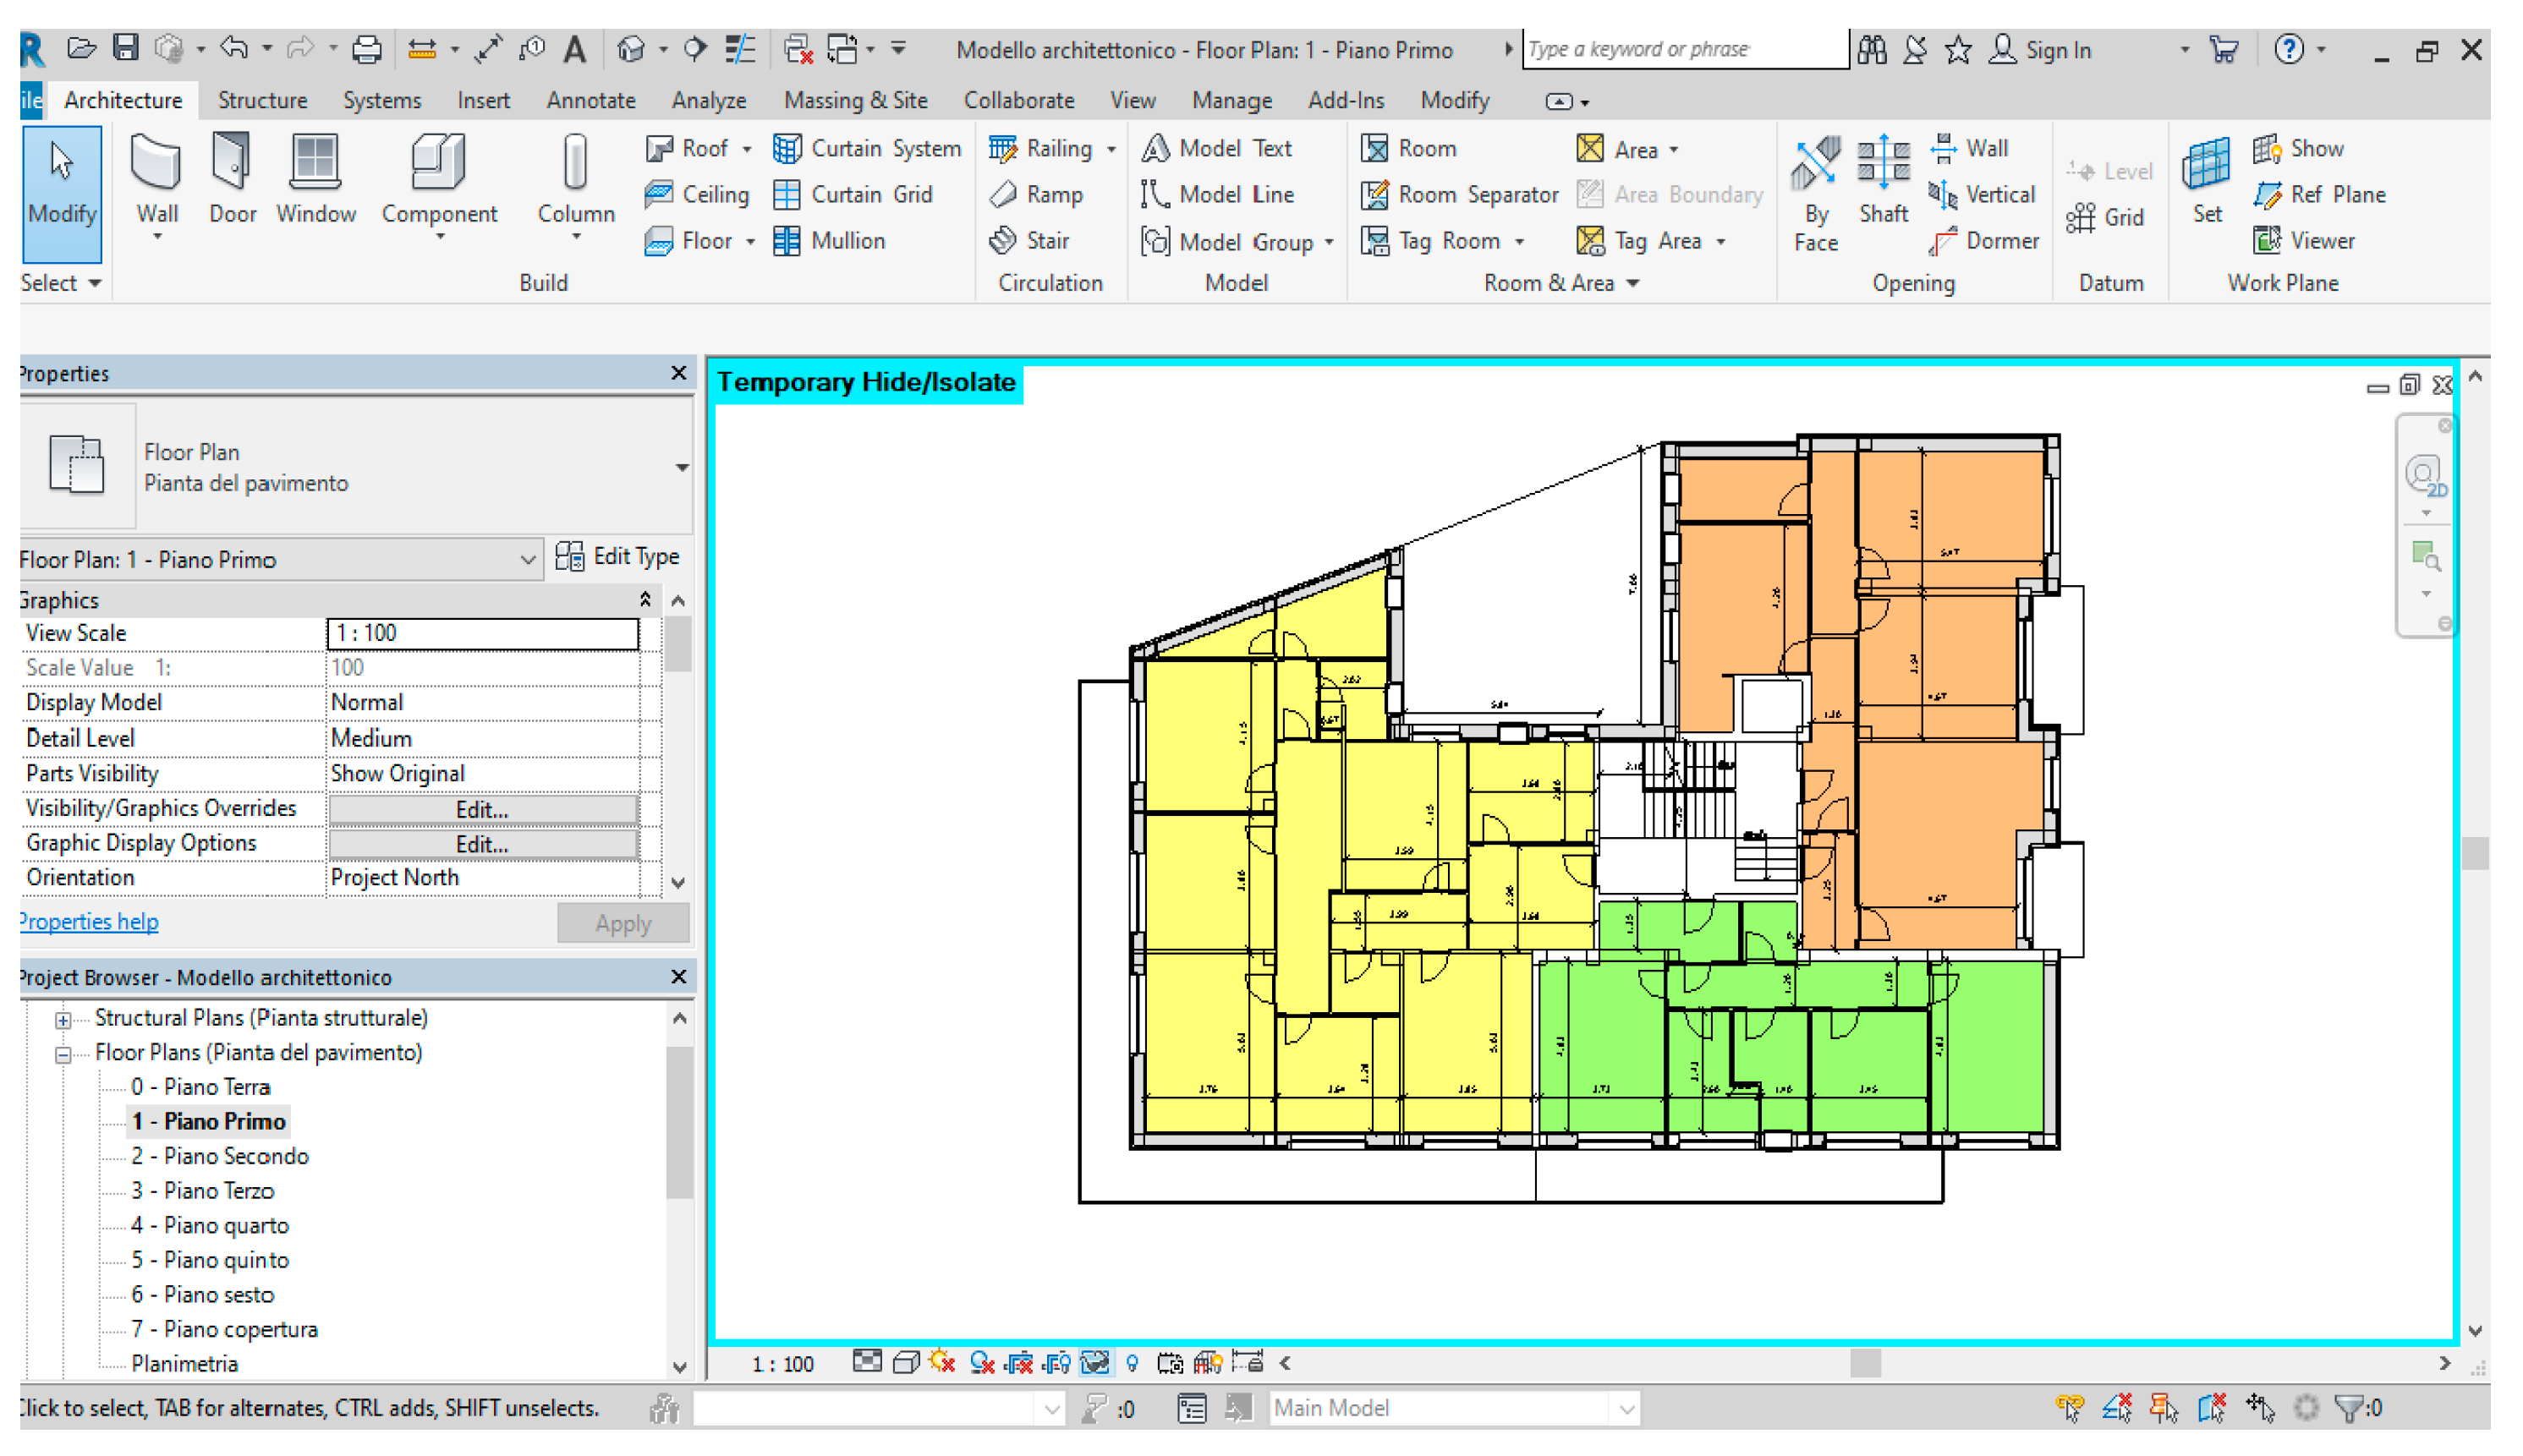
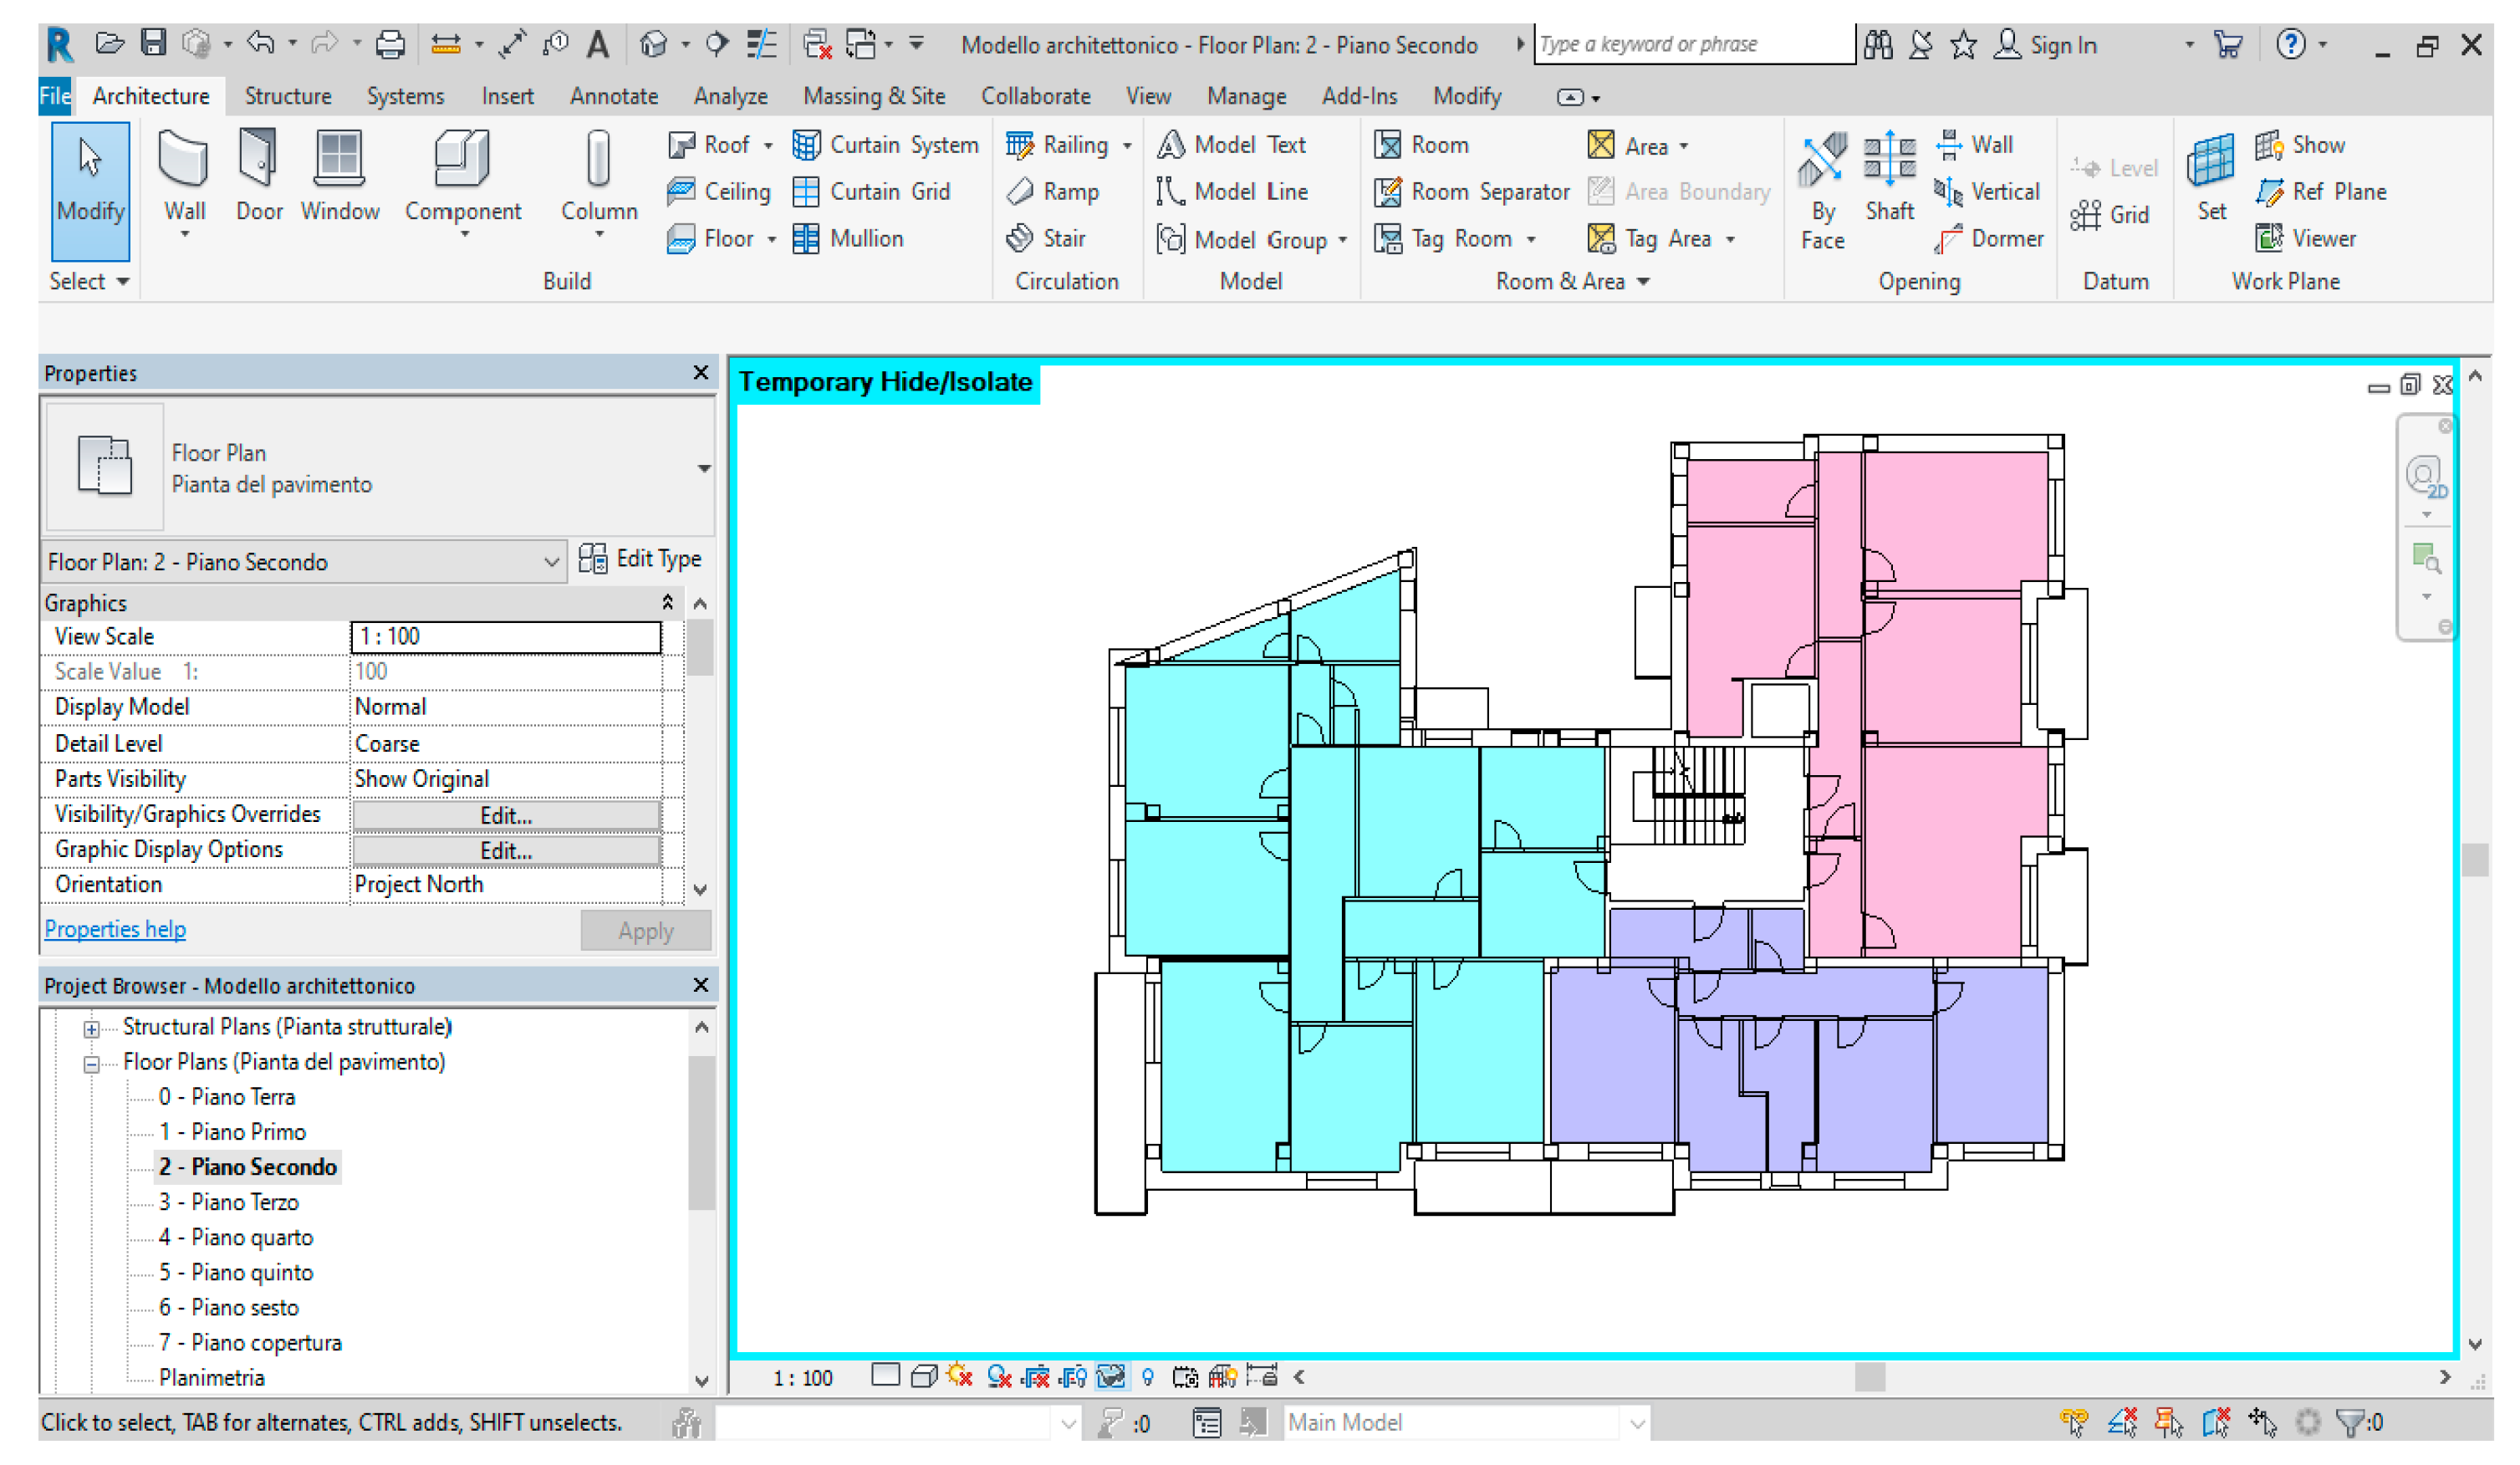
Figure 6), while on the remaining levels there are three apartments per floor. In particular, the plan of the first floor is repeated on the sixth and the conformation of the spaces of the second, third, fourth, and fifth levels are perfectly superimposable (
Figure 7 and
Figure 8). The inter-floor height is constant at 3.00 m, while the ground floor has an internal height of 4.30 m.
Once the building model was reconstructed, the structural component was exported through an ifc exchange file to a structural software, in order to verify its performance and to define the types of intervention.
4.1. Seismic Analysis
The subject building consists of a structure in reinforced concrete with a trapezoidal plan, formed by six floors above ground. The supporting skeleton is made up of a framed structure, with multi-story frames with several orthogonal spans and grade beams. The building has a sloping pitched roof. The intended use is mixed, commercial on the ground floor and residential on the upper ones.
Along the southwestern border of the building there is another structure of the same type, separated from the first by a technical joint. The study was carried out on the main building only, without taking into account the adjacent one, considering the seismic parameters shown in
Table 1.
In order to carry out the vulnerability analysis, all the elements necessary to define an adequate level of knowledge of the building were first acquired. Having the structural executives available and having acquired information about materials and the characteristics of the materials through non-destructive tests (sclerometric tests) on the concrete of some columns, the analysis was set up with an LC2 level of knowledge on a structural software (
Figure 9).
The calculation models used are those explicitly referred to in the D.M. 17/January/2018.
- -
Checks for vertical loads only
The seismic vulnerability analyzes are preceded by a structural analysis for gravitational loads only (
Figure 10), according to the N.T.C. 14-Jan-2018, to ascertain the load-bearing capacity in ordinary use conditions for vertical loads of the structure.
- -
Non Linear Static Analysis (pushover)—Concentrated Plasticity Model
It is a “step-by-step” incremental analysis, which takes into account the collapse of the various structural elements as they occur, evaluating the necessary redistribution of the actions (reconfiguration of the stiffness matrix). The non-linear static analysis methods called push-over are able to capture the changes in the structural response and stiffness that occur as the individual structural elements plasticize, until the structure is transformed into a mechanism.
This analysis allows the weakest elements to be identified and the improvement effects that can be obtained with the foreseen consolidation techniques to be evaluated.
Nonlinear static analysis consists in applying gravitational loads to the structure and, for the considered direction of the seismic action, a system of horizontal forces distributed, at each level of the building, in proportion to the inertia forces. The latter increase at each step of the push-over algorithm [
33].
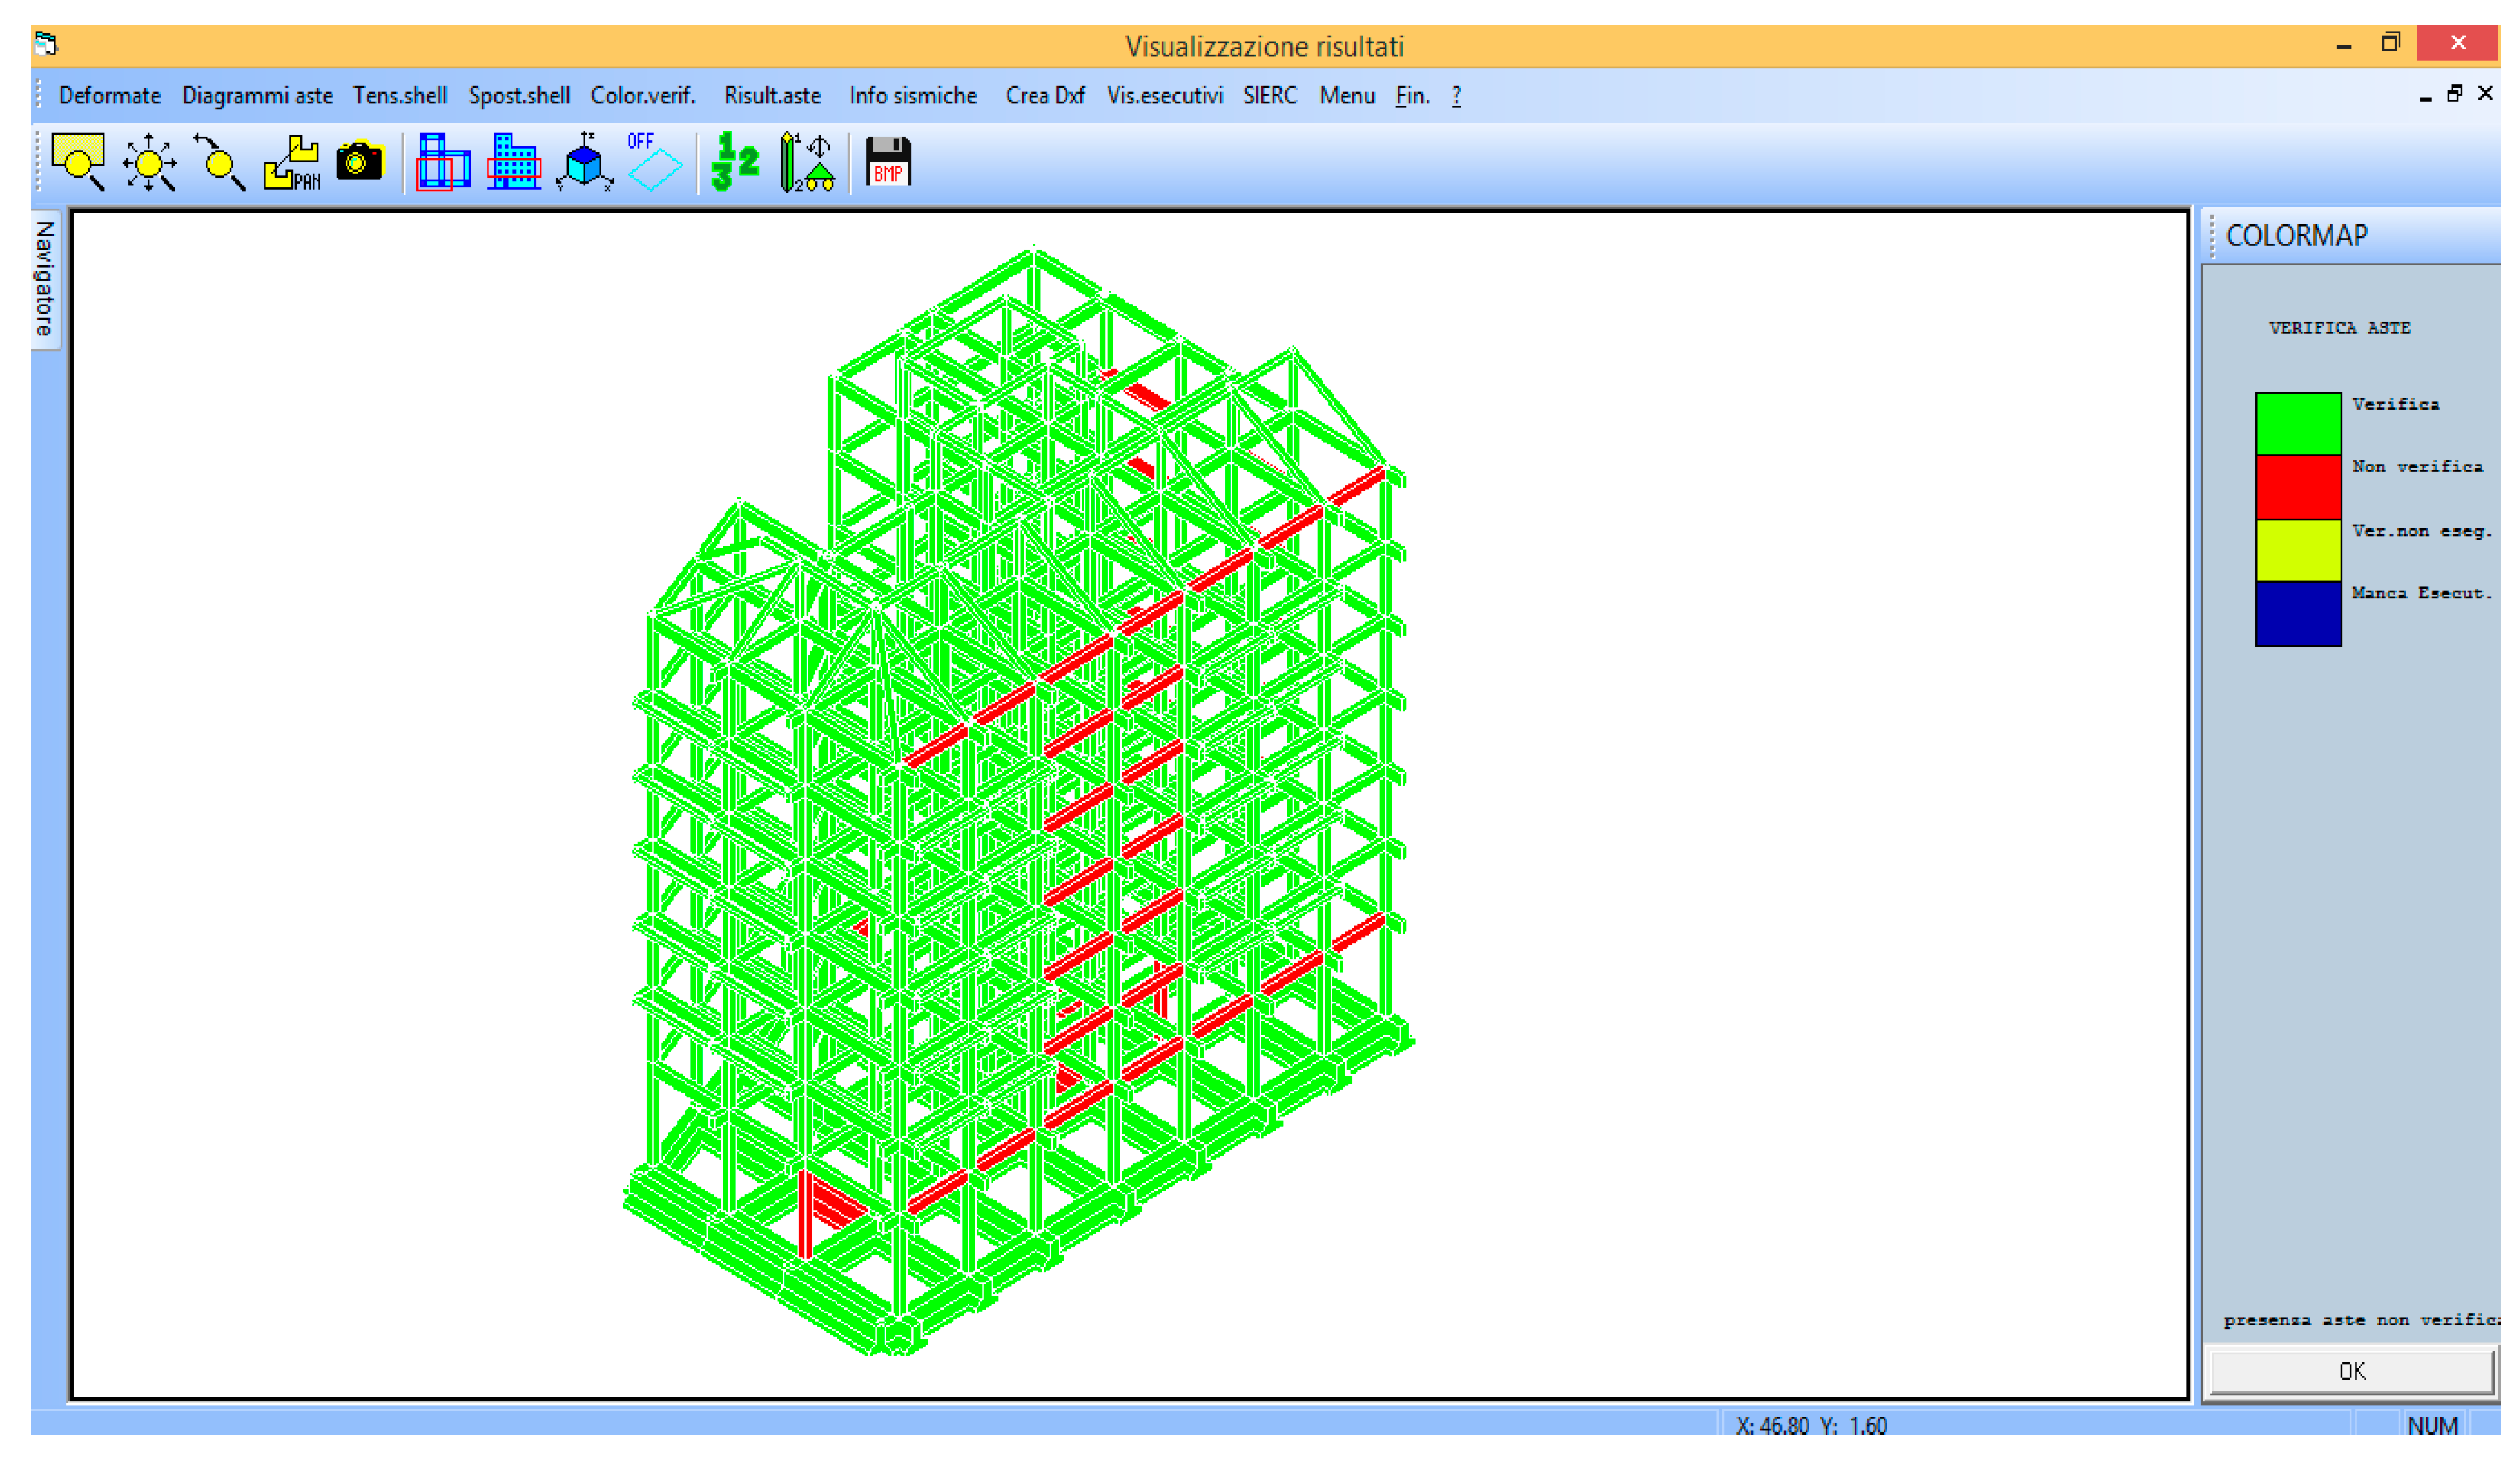
The analysis shows that the structure has a predominantly translational behavior with an insignificant incidence of torsional motions.
The pushover analysis carried out on the structure showed that for all 32 load combinations required by legislation, proportional to the seismic mass, to the main vibration mode of the structure and to the eccentricity, the structure collapses due to brittle failure mechanisms, squat beam shear, and perimeter columns, mainly on the lower levels. Ultimately, the appearance of fragile collapses makes the ductility resources that the structure could mobilize through the plasticization of the other elements practically unusable, almost all of which are still in the elastic range.
(a) Hypothesis of seismic adjustment
In order to achieve the seismic adaptation of the building, it was planned to act on the aforementioned elements by means of a reinforced concrete jacket for the columns and carbon fibers for the beams. After the preliminary intervention aimed at eliminating the fragile knot and V-T Beam and Column mechanism, interventions must be prepared to improve the dissipative capacity of the structure by means of specific reinforcement works (enlarging the section of the columns with concrete casing and of the beams using carbon fibers).
As regards the effectiveness of the aforementioned structural interventions, it can easily be concluded that the objective of the seismic adaptation has been largely achieved, given that the seismic safety index, which in the ante-operam conditions (current conditions) is lower than one unit, in the post-operam conditions (design conditions) largely exceeds this value (
Figure 11—
Table 2).
The costs for the seismic retrofitting have been quantified by a bill of quantity BOQ, taking into account the Regional Price List of Calabria; when considering all the ancillary works, the technical and general expenses, and a transformation duration of 18 months, their amount is 1,719,900.00 € discounted at current time.
(b) Hypothesis of seismic improvement
In the hypothesis of improvement, an intervention on the nodes present on the external facades has been prefigured by using carbon fibers in order to improve the behavior of the unconfined nodes.
The intervention does not produce a significant increase in the vulnerability index, which reaches a value of 0.31 (
Table 3), but in any case, it produces the jump of a seismic category class and therefore qualifies for access to tax benefits.
Also, in this hypothesis, the costs associated with the transformation are quantified through a BOQ, taking into account any other technical and general expenditure and also the costs necessary for the restoration of the external facades, amounting to € 661,500.00 discounted at current date in the ‘hypothesis of an intervention lasting six months.
4.2. Appraisal Analysis
After completing the structural analysis and defining the interventions, together with the related costs, the methodology provides for the appraisal of the market value in the conditions prior to the intervention and in those subsequent to each prefigured transformation.
4.2.1. Appraisal of the Current Value
The market value in the current state is appraised using a market-oriented method as indicated by the International Valuation Standards, with particular reference to the Market Comparison Approach (MCA) [
34,
35].
The MCA is a procedure that leads to the determination of the market value and/or income of a property based on a comparison with the prices of properties similar to the subject, recently bought and sold. In particular, the procedure reaches the determination of the value of the property through a set of monetary adjustments that can be assessed on the basis of the comparison between the different amounts of the common characteristics, according to the
similia similibus aestimentur criterion: “[...] the market will fix the price for a property in the same way it has already determined the price of similar properties” [
36]. It is clear, in fact, that a buyer is unwilling to pay a higher amount for a property than that of other similar properties, and therefore can be replaced with it. In this regard, it can be noted that, with the exception of some types of assets—those characterized by particular historical or artistic values—all properties can be economically substituted with others of equal utility, so that “abnormal” prices are rare.
The Market Comparison Approach, with its complete, clear, and flexible approach, can appraise any type of property, from condominium apartments to agricultural land, provided that there is a sufficient number of transactions of recent similar properties, through which you can make the comparison.
The MCA consists of a systematic procedure, aimed at determining the adjustments—corrections in monetary terms—to be made to the sale prices of the comparison properties, to take into account the differences between the comparable buildings characteristics and the subject ones. Through the adjustments, the procedure leads to the correct sales prices, which are the prices that the comparison properties would present if they were equal to the subject. In theory, the correct prices should therefore coincide, although in practice, there are differences related to the market imperfection.
The real estate features considered in the appraisal analysis are those relevant to the market segment considered and are summarized below:
Main area (SUI): Measured in gross square meters, sqm.
Balcony surface area (SUB): Measured in square meters, sqm.
Mezzanine area (SOP): Measured in square meters, sqm.
Toilets (SER): Measured by number, n°.
Floor level (LIV): Measured by the floor number of the property, n°.
Table 4 and
Table 5 show the different real estate features amounts for every single property.
In order to apply MCA, three data relating to the sale of properties similar to the subject were collected, located in the same micro-area indicated by the Revenue Agency (C1/semi-central), built in the same period, and therefore realized according to the same construction types, the same materials, and the same structural reference standard. Data were acquired by the Observatory of Real Estate Market (OREM), present in the Department of Environmental Engineering (DIAm) of the University of Calabria.
For the comparable buildings, the PRZ sale price updated to the current date (February 2021), the commercial area (SUP)—which is the sum of the main area and that of the balconies, calculated at 50%—were considered.
Table 6 shows the driver characteristics of the comparable buildings.
Once the survey is completed, the appraisal of the building in its current condition is carried out specifically through the simplified approach [
37], using the application of the appraising vector.
The procedure is illustrated below for residential properties on the first floor (
Table 7).
The hedonic prices of the driver characteristics are first estimated, according to the valuating practice indicated by the appraisal criteria:
- -
Main Surface hedonic price:
- -
Commercial surface hedonic price:
- -
Toilet hedonic price:
- -
Floor level hedonic price:
Table 8 shows the hedonic prices obtained with reference to the comparable buildings described in
Table 6.
The simplified approach requires the implementation of an appraisal vector built of the average adjustments:
where
pi is the average hedonic price of the
i-th feature,
x0i is the amount of the
i-th feature of the subject, while
xi is the average of the
i-th feature in the sample.
The most probable value of the subject is obtained by adding the elements of the vector algebraically, such as:
where
P is the sample average sale price (
Table 9).
The same procedure was applied to the other residential properties being valued, the results of which are shown in
Table 10.
For commercial properties, in the absence of sales data for similar properties, the valuation is made by referring to the minimum prices reported by the Territory Agency (I semester 2020—€ 2050.00/sqm), obtaining (
Table 11):
The value of the building in its current state is therefore € 3,112,586.32.
4.2.2. Appraisal of the Future Value—Adaption
The appraisal of the value of the building after seismic adaptation interventions requires the identification of a set of recently built comparable buildings, built in accordance with the current seismic legislation. It must also be considered that the seismic adjustment intervention involves the execution of ancillary works, which, ultimately, involve a restructuring of the building (reconstruction of plasters and paints, floors, etc., other interventions driven by the main one as prescribed by Superbonus 110%). To this end, the real estate valuation was based on the recognition of three comparable building belonging to the new properties segment, the driver characteristics of which are shown in
Table 12.
The valuation is carried out according to the methods already indicated for the appraisal of the current value, obtaining (
Table 13):
With regard to commercial properties, the valuation is made by referring to the maximum prices reported by the Territory Agency (I semester 2020—€ 3100.00/sqm), obtaining (
Table 14):
The value of the building after adaptation is therefore equal to € 5,062,716.08.
4.2.3. Appraisal of the Future Value in the Case of Improvement
The appraisal of the value of the building after seismic improvement requires, also in this case, the identification of a set of similar comparable buildings, built in the same reference period, which have been structurally improved. In addition, in this case, the valuation is carried out according to the above-mentioned methodology, comparing three sales data (
Table 15) of properties similar to subject, but improved in their structural performance. The results are reported in
Table 15,
Table 16 and
Table 17.
The value of the building after improvement is therefore € 3,888,484.20.
5. Results
The cross-sectional analysis of the results obtained for seismic and appraisal studies allows us to formulate judgments of economic convenience about different types of building transformation, choosing among the alternatives that respect physical, legal, and budgetary constraints, the best one in terms of added value (HBU).
Considering the value in the current state, the value in the future state, both in the case of adaptation and improvement, and the related transformation costs as indicated in the previous paragraphs, it is possible to compare the design alternatives, as indicated in
Table 18.
It should be noted that, in addition to the transformation costs, under the hypothesis of seismic adaptation there are also the costs that the owners of the properties have to bear as a consequence of the need to abandon temporarily their homes in order to allow the works, and, specifically, the costs for the rental of similar properties.
In this regard, the equivalent of the current value of a monthly fractional income for the transformation period (assumed time: 18 months) should be considered among the costs:
where
R is the monthly rent (obtained through the direct capitalization of the market value at the capitalization rate
ic = 3.5%),
ik is the periodical rate equivalent to the annual interest rate of 1%,
nk is the number of installments (18).
From the analysis of the results, it is possible to verify that both transformations are economically convenient because, while neglecting the tax benefits, they result in an increase in net value that can be interpreted as the amount due to the owner for having activated the transformation.
It is also possible to verify that between the two hypothetical transformations, the most convenient is represented by the seismic improvement, since the transformation costs, which also include the costs of moving and renting replacement properties, minimize the positive differential.
However, it is important to note that the benefits deriving from the Superbonus essentially allow the cancellation of the transformation costs (even 10% more often goes to cover the costs related to accessing bank credit through the sale of the Superbonus), entirely immediately deductible through the credit transfer mechanism—except for the moving and rental costs, which cannot be deducted. Considering, therefore, the financial benefits, the remodeling of the economic-appraisal framework reveals the important benefit brought by the regulatory provisions (
Table 19).
It is clear that the building transformation associated with seismic adaptation, which, it should be remembered, also includes all ancillary interventions attributable to it, determines a much more significant economic benefit (to the extent of about 600 €/sqm) in the portfolio of the owners to whom however, remains a newer but even safer property. Unlike ordinary conditions, Superbonus 110% shifts the highest and best use in favor of the adjustment intervention, with a significant economic benefit.
It should be noted that even the previous tax measures, which quantified the incentive to the extent of 85% of the expenses, would have produced an interesting economic impact on the value of properties (
Table 20); nevertheless, poor perception of the seismic risk and the lack of full understanding of the economic positive consequences made these benefits ineffective.
6. Conclusions
The so-called Relaunch Decree no. 34/2020, called Superbonus 110%, enhances the existing tax deduction to favor the relaunch of the building sector and the economy in the post-covid era on the one hand, to favor the anti-seismic requalification of the building stock on the other. Similar previous regulatory and fiscal interventions have not had the desired results. The reasons for this failure are to be found in the logistical complications associated with structural interventions, but probably also in the serious lack of information. The level of perception of seismic risk by real estate sector users is decidedly low; there is also a lack of awareness of the economic benefits associated with this type of intervention.
More explicitly, private owners hardly perceive the increase in value of the property linked to its better behavior against any damage caused by an earthquake, probably because the interventions are not generally visible (such as aesthetic or functional improvements) or because they are not generate an immediate economic gain (for example, savings on gas or electricity bills in the case of thermal improvement interventions): In the opinion of the authors, therefore, if this lack of awareness is not overcome, which is also of a psychological nature linked to removing the idea of seismic danger, tax deductions will hardly produce the desired effect. One proposal could be to lower the premium on building insurance policies by increasing the ability to overcome a medium intensity earthquake without excessive damage.
The 34/2020 decree does not require specific interventions, postponing the most appropriate choice from case to case, depending on the specificities of the subject building.
It is therefore necessary to identify a logical criterion and to define a strategy that satisfies the need for seismic risk mitigation; at the same time, choices have to be supported by an economic-appraisal analysis aimed at encouraging private interventions.
The work intends to define an appraisal analysis methodology based on International Valuation Standards aimed at guiding the choice of the most appropriate and convenient building transformation, demonstrating that any intervention determines an increase in the net value. The proposed methodology requires a transdisciplinary approach, based on the vulnerability analysis of buildings, on the evaluation of the properties market values, and on the financial analysis of the real estate investment, leading to the definition of an evaluation/choice approach of the economic convenience related to building transformation.
It is clear that it is always necessary to evaluate case by case whether there are the conditions to opt for a seismic improvement instead of a more important intervention—excluding for example the presence of foundation settlements, significant crack patterns, serious materials, or gravitational deficiencies, in order to carry out low-impact interventions, such as to overcome logistical resistance and contribute to a greater diffusion of risk mitigation on a territorial scale.
However, it could be concluded that the seismic adjustment interventions determine an economic benefit to the owner’s portfolio, which is particularly significant when it is taken into account that the intervention costs are practically zero; a benefit that, if known, could contribute to further incentivize the implementation of anti-seismic interventions.
We do not yet have sufficient elements to be able to affirm that the fiscal and financial measures in the field of earthquake safety can produce real, concrete, and widespread effects. Undoubtedly, they will be able to help foster that awareness, which is essential to carry out the important recovery and safety measures to the existing real estate assets.


