Abstract
The Nyangatom, in South Omo, Ethiopia, are a group of agro-pastoralists whose access to land is affected by large-scale sugarcane development projects. An informed selection of appropriate livestock management measures by local communities requires a spatially explicit representation of prevailing and changing supply–demand relationships for livestock herds among the Nyangatom. This study addresses this caveat and identifies seasonal and location-specific ‘hotspots’ in Nyangatom, where fodder demand exceeds supply. Assessments of fodder production are based on primary data collected through focus group discussions, key informant interviews, and field observations. Overall, annual fodder availability is estimated at 508,967 tonnes against the requirement of 584,205 tons, resulting in a deficit of 12.9% annually after out-migration. Under the implementation of the Omo-V sugarcane project and climate change, the fodder supply deficit will worsen to 219,977 tonnes annually. The most critical dry matter hotspots are found in the western and central parts of Nyangatom near the Kibish River, which shows the highest livestock density. In contrast, better fodder supply is estimated around the southwestern and northeastern parts. Change in policy, the frequency of droughts, conflict, and the large-scale irrigation schemes-induced reduction of the Omo River floods are accounted for the changes. Thus, there are strong signals to the local community and government to collaborate to reduce the potential constraints that affect sustainable rangeland management and food security and ensure sufficient attention to the interest of the agro-pastoralists.
1. Introduction
Drylands cover over 40% of the earth’s terrestrial land and accommodate unique ecosystems with valuable biodiversity [1]. Rangelands, the largest land-use system in the drylands, provide the necessities for grazing and browsing of animals [2]. African rangelands constitute about 65% of the total land area on the continent and support 59% of all ruminant livestock in Africa [3]. Moreover, rangelands are also natural habitats to a rich biodiversity of plants and wildlife, for products, such as charcoal, gums, resin, honey, wild food, traditional plant medicines, and for its aesthetic values that are shaped by the beautiful vistas [3,4,5,6]. In Ethiopia, in addition to extensive livestock production, rangelands are rich in biodiversity, minerals, water and energy resources, cultural heritage, untapped tourist attractions, and socio-anthropological values related to peoples’ wellbeing [7,8].
Pastoralism is the key economic activity and the main local livelihood source for the inhabitants of arid and semi-arid lands (ASALs) of Eastern Africa [8,9,10,11]. Livestock plays multiple economic and social roles; it is an important source of livelihood, has traditional socio-cultural value, as well as political functions, and is a major insurance against risks. For example, livestock is the main source of household foods by providing milk, meat, and blood, constitutes the basis of traditional social relations, e.g., via payment of bride-wealth during marriage or compensation of injured parties in ethnic feuds, is a symbol of prosperity and prestige, insurance and security against drought, diseases, and other calamities, and a means of alliance formation [5,8,12,13,14,15]. However, these traditional values of pastoralism are under pressure, due to extreme climate change variability, encroachment of sedentary agriculture in the fringes of drylands and other land-use changes, animal diseases, overestimation of the grazing capacity, and ignorance of the indigenous knowledge of the pastoralists [16,17,18,19].
Competition amongst pastoralists is an inevitable course of action for scarce resources, necessitating frequent livestock movements within the territory and beyond in search of good pasture and water [8,20]. The occurrence of frequent droughts in ASALs, perhaps a manifestation of long-term climate change, contributes to rangeland resource shortages, leading to increased competition among pastoralists to take their share of communal grazing lands. Mobility is a key pastoral risk management strategy during times of drought where rangeland resources become scarce [8,21,22,23,24,25]. The intensity of competition is increased with the frequency of drought and consequently causes rangeland degradation, due to overgrazing and insecurity between resource user groups [8,26].
Natural grazing and browsing on communal grazing land and stubble following crop harvest are the main components of animal fodder in Ethiopia [8,27,28,29] likewise, for the Nyangatom agro-pastoralists in the Lower Omo Valley (LOV) [8,30]. However, Admasu et al. [8] and Ayana [31] reported that the productivity of natural pasture in Ethiopia is very low, due to high rainfall variation, unsustainable utilization of grazing lands and overgrazing, agricultural expansion, and population pressure. This situation leads to low dry matter (DM) production, and hence, creates a critical imbalance in animal fodder supply over the year. The contribution from crop residues, improved fodder forage, and concentrates is very limited and is not sufficiently supported with appropriate extension packages in the valley.
Studies indicated that large-scale agricultural investment has a negative impact on livestock management, particularly in ASALs of Ethiopia. It affects livestock management through shrinking pasturelands and limiting livestock mobility following large-scale sugarcane and cotton plantations in the LOV [32,33,34]. The expansion of large-scale agriculture is affecting the pastoral land-use regime through limiting land and water rights-key factors in pastoral production systems [35]. In many cases, such as with the sugar development projects in the LOV, lands that are made available to investors are part of local livelihood systems: Either pastoralist pasturelands, cultivation places, or forest resources [33,34,36]). Tsegay et al. [37] and Sonneveld et al. [21] also noted that the extensive use of agricultural encroachment leads to land degradation, and affects pastoral production systems.
Livestock mobility following seasonal fodder variation is a judicious practice of the Nyangatom agro-pastoral community [12,30] and is also evidenced in Afar [22] and Gambella [38]. The scale and intensity of livestock migration depend on herd size, the location of the village (the nawi—the local Nyangatom name for a village), the security situation, as well as the availability of resources in the destination within a given period. However, since 2012, the LOV has become a ‘hotspot’ for big development interventions, including state-owned sugarcane plantations, and medium-scale private agriculture investments along the Omo River basin [32,34]. Among the districts in LOV, Nyangatom is one of the major ‘Omo–Kuraz’ sugar project intervention sites that has originally allocated 81,329 ha (currently downscaled to 50,000 ha) of mainly grazing, shrubland, and woodlands for sugarcane plantation and installation of factories, covering 13 qebeles [39]. According to the South Omo Animal and Fisheries Department, in the Omo–Kuraz project sites, the Nyangatom have the highest livestock numbers. Thus, the loss of livestock migration routes and dry-period grazing sites has the potential to disrupt the process of traditional livestock mobility that maintains the balance between fodder supply and demand. The seasonal migration in Nyangatom is traditionally planned with elders, chiefs of clans, and youths (herders) ahead of time. Such practices were also reported in the Karamojong cluster in Uganda [5] and in the Kuraz district in Ethiopia [30].
The Nyangatom employed traditional livestock management practices, such as rotational grazing. This is a common practice in most pastoral and agro-pastoral communities in Ethiopia, as confirmed in [8,22,38]. The purchasing and preparing of fodder are almost negligible in the Nyangatom tradition. To fill the fodder supply–demand gaps, first, they usually migrate with livestock within the Nyangatom area and further out migrate to adjacent dry season grazing areas (transhumance), such as Tirga, Kuraz, Surma, and south of Omo park.
The question arises whether these traditional institutions on livestock migration patterns in the Nyangatom can offer coping mechanisms to deal with the emerging pressures caused by large-scale developments and climate change. Moreover, the threat looms large that common constraints during livestock migration will exacerbate when new developments further restrict access to grazing lands, increasing stress levels among the herders.
For an appropriate policy analysis that addresses this question, we are confronted with the following challenges. First, prevailing migration (or rather, transhumance) patterns over space and time should be accurately represented for an assessment of the fodder demand. Second, data on fodder production in the same spatial and temporal dimensions are required to analyze the supply. The combination of the supply–demand assessments can identify critical ‘hotspots’ by season, where fodder shortages might lead to lower livestock production levels, overgrazing, and land degradation [38,40]. This study aims to address both challenges as follows. First, fodder demand is assessed by representing migration patterns of herd stocks from their homesteads to spatial (qebele) destinations over seasons (dry-wet). Second, addressing the prevailing data paucity on fodder production, we combine remote sensing information/imagery (obtained from USGS-Landsat-7), ground information on types, and the amount of biomass produced [41]. The combination of the assessment leads to critical ‘hot spots’ where supply cannot meet the demand. Furthermore, we analyze prospective scenarios based on the large-scale agricultural investment expansion, climate change, conflict, and its impacts on livestock mobility and livelihood strategies [8,19,38,42].
2. Materials and Method
2.1. The Study Area
Nyangatom district, home to the Nyangatom, Murle, and Kewgu peoples, is part of the lower Omo valley located in South Omo zone administration, southwest Ethiopia. The Nyangatom, all ethnic groups living in Nyangatom district, share a border with Surma, Salamago, Hamer, and Dassanech districts, and the Kenyan Turkana and South Sudanese Toposa districts. The Omo River forms the eastern boundary of the large grass and bush plains of the Omo National Park and meanders through the arid plains of Dassanech to form the southern and southwest boundary with the Kibish River and the western boundary of the Nyangatom agro-pastoralists (Figure 1). Agro-ecologically, the district is arid to semi-arid with an annual mean rainfall of 400 mm and 30 °C average temperature. The study area, Nyangatom, consists of 20 qebeles and hosts a total of 20,999 [43] people with a density of 9.61 people km−2. The density of the animal population per unit area is 1.37 (TLU (tropical livestock units) km−2).
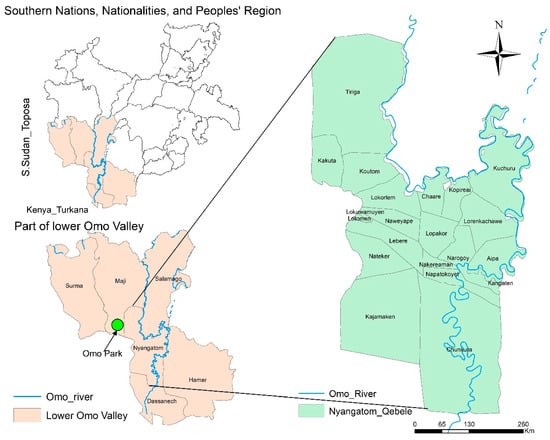
Figure 1.
Study area map.
The agricultural cycle in Nyangatom is divided into two seasons, coinciding with bimodal rainfall patterns. Planting of sorghum and maize (a local variety that is adapted to droughts) starts with the onset of the main rainy season (February to June). The second, short rainy season starts in November and ends in December. In Nyangatom, crop farming includes the growing of sorghum, maize, cowpea, and haricot beans along the banks of the Omo River. The Nyangatom use flood-recession and rainfall to cultivate crops [12].
2.2. Data Sources and Data Collection Strategy
The study makes use of primary and secondary data sources. Livestock population and land-use land cover-based fodder supply information was collected from various published and unpublished materials and organized for further analysis. The primary data on environmental changes, local livelihood, livestock mobility patterns, routes, challenges faced during migration, fodder sources, and types collected from 384 households sampled survey respondents, focus group (10) and key informant discussions (30), and field trekking to cattle camps in between July–November, 2018 and October-November, 2019. Focus group discussion and KI interview conducted in all the 20 qebeles to collect additional information about fodder types and species with elders and clan chiefs. During the FGD and KI, elders and youths were identifying as the most preferred livestock mobility routes, destinations, and the challenges they encounter. Figure 2 presents the generalized methodological framework for this study.
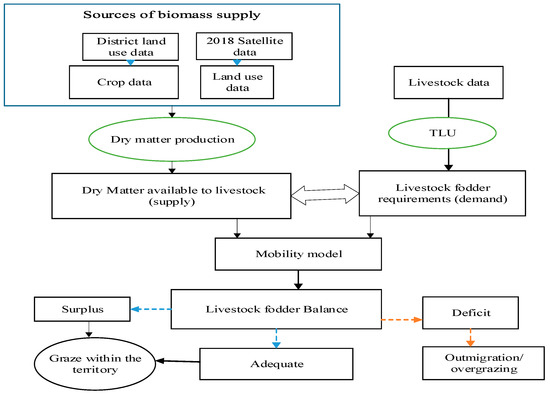
Figure 2.
A methodological framework for fodder supply–demand analysis (adapted from Blummel et al. [45]. TLU, tropical livestock units.
Land-use and land cover maps for the year 2018 were developed from satellite images (Landsat 8). The field data were recorded using ground control points and analyzed in ArcGIS 10.4.1 software. The outcome of land-use land cover used for the estimation of biomass (dry matter) production within the Nyangatom territory. Each land-use class in all the 20 qebeles was assessed from potential green fodder sources. Finally, all available green fodder was converted to DM equivalent using a standard conversion factor (Table A2) [44].
2.3. Data Analysis
The rangeland productivity and livestock mobility data were analyzed using Microsoft Excel to generate livestock supply and demand and supply–demand balance hotspots. The transformation matrix is adjusted in the excel sheet, and the model was run using the input data. We use ArcGIS10.4.1 software to analyze remote sensing data and prepare a land-use land cover (LULC) map of 2018 to determine the DM production. All information was evaluated against the local community views, expert opinions, researcher field assessment, and current literature to augment the quantitative data obtained through analysis.
2.4. Dry Matter (DM) Production
As in most pastoral areas in Ethiopia [40,41,46,47], livestock in Nyangatom mainly depends on green pastures in communal grazing fields, including shrublands, woodlands, and riverine forest lands. Tops of sugarcane and crop residues as sources of DM are not included in this estimation, due to their insignificant contribution to livestock fodder. Due to a lack of direct data on palatable biomass production in the district, land cover data was developed to estimate spatial dry matter production [41]. For the dry matter analysis, data obtained from the LULC were converted into DM production per unit area using standard conversion factors recommended in FAO 1987 [44]. The DM conversion factors for converting land area in hectare to biomass in tonnes were applied to estimate the potential fodder production from each land-use land cover type, applied to arid semi-arid land of east Africa. Thus, land-use types and temporal and spatial livestock fodder availability within the qebeles and seasons of migration are applied to estimate the total DM production in the district. The amount of annual fodder available for livestock is calculated using the green fodder sources that account for seasonal variation and pasture abundance in the district (Table 1 and Table A1). All potential lands that could contribute to dry matter production, such as grasslands, shrublands, woodlands, riverine forests, and croplands, were adjusted for annual fodder supply analysis following the conversion factors used by FAO 1987 [44].

Table 1.
Land-use land cover data based on dry matter (DM) production estimation.
2.5. Estimation of Livestock Fodder Requirement
The requirement of animal fodder on a dry matter basis was estimated based on the district livestock population census. The livestock composition is cattle, goats, sheep, and donkeys. Animal fodder demand was estimated from the total livestock inventory, qebele-based mobility assessment, and time spent at their destination. Elders and sub-clan chiefs from each qebele were interviewed on the livestock mobility routes. The share of livestock that remains behind the nawi and the share that moves during the dry and wet seasons were obtained. The elders, clan chiefs, and local experts reported that a significant amount (30%) of livestock migrate outside of the Nyangatom territory annually in search of fodder. The number of livestock that annually out-migrate beyond the district territory in search of pasture was confirmed by district and zone livestock management experts. Furthermore, the time is taken to arrive at the destination and stopover challenges faced during migration, and other relevant socio-economic factors that determine the livestock mobility, fodder supply, and demand were collected. The total livestock is standardized with TLU using the conversion factors described in [9] (p. 10). The annual dry matter fodder required for the total livestock maintenance was computed based on the assumption that one TLU requires 6.25 kg dry matter fodder per day or 2.3 tonnes per year [48]. It is important to note that we made an assumption that no livestock are entering the Nyangatom territory. Therefore, in this study, we only considered the livestock within the Nyangatom territory and livestock mobility as a management strategy (out-migration) to fill the dry matter supply gaps.
2.6. Livestock Seasonal Mobility and Supply–Demand Estimation
This study employed a migration model [22] to describe livestock mobility patterns in search of pasture and water across the Nyangatom territorial section in the lower Omo valley (Figure 3). The two-dimensional model refers spatially to qebeles and temporally to the dry and wet seasons. The model uses a transformation matrix that distributes the stock of herds over time following prevailing migratory livestock routes. The spatial-temporal assessment provides information on the local fodder demand by season. Concretely, the model focuses on the cumulative mobility of herds from and to qebeles, taking into account the share of herds that are left behind at the nawi.
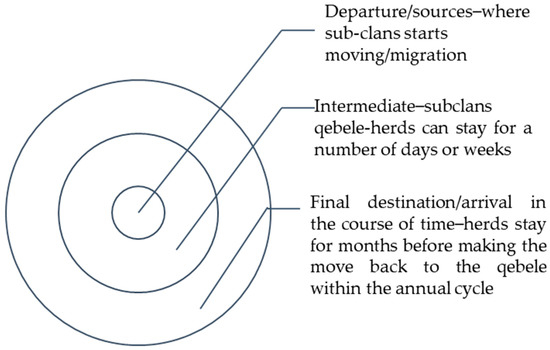
Figure 3.
Livestock migration model.
According to Sonneveld and his colleagues [22], the model’s functionality and applicability within the given geographic scale and time frame depend on three important assumptions: Contiguity, discreteness, and logical time steps from current to the future.
Contiguity assures that livestock mobility follows adjacent qebeles. Discreteness refers to the discrete-time steps and defined areas that are visited during migration. Logical time follows the restricted backward movement in time.
Thus, the model implements the Nyangatom livestock mobility in an M-square transition matrix with dimension; for cycle of seasons and denotes the homestead qebele; and the qebele destination areas. The vector represents the total herd stock at (home; destination areas), and represents the portion of total herds ( expressed in TLU that migrate to with diagonal matrix , showing the share left behind. Hence, the sum of livestock distribution that migrated from different home to destination areas over time is expressed as:
Thus, the dynamic nature of herd mobility over time explains the actual demand for livestock fodder at the different qebeles over time. Confronting the demand with the fodder supply gives us an insight into deficit hotspots.
We approximate the information on specific qebeles’ herd entry and exit period by assuming near the uniform seasonal entry and exit time for different qebele herds () into the qebele territory. The model also accounts for livestock moving beyond district borders which might amount to column sums that are <1. Thus, a share of the livestock grazes outside the district boundary and are, therefore, excluded from the hot spot analysis.
3. Results and Discussion
3.1. Characteristics of Livestock Migration in Nyangatom
According to the local community, Nyangatom experiences cyclical livestock migration depending on pasture availability. Dry-season livestock mobility is practiced with large herd sizes between May to February every year for at least 7–9 months (Table 2). Practically the Nyangatom migrate to Tirga, Kuraz, Narus, the Hamer-Dassanech border, towards Surma and Omo National Park, and Mt. Naita (Toposa’s territory), depending on resource availability and local security. Usually, they graze at their territorial section grazing land during the normal year, if there is no prolonged drought in the valley, and return to their qebeles cyclically during the wet season (March-April). However, in some cases, the Nyangatom semi-permanently reside outside of their territory, particularly among South Sudanese relatives [49], to fill the fodder gaps. Our study shows that the survival of Nyangatom agro-pastoralists is highly dependent on seasonal and spatial migration of herds to bridge fodder shortage. The characteristics of the livestock migration over the seasons are the main input in the transformation matrix discussed in Section 2.5.
Table 2.
Nyangatom traditional calendar used for transhumance and cultural activities.
According to focus group discussions (FGDs) and key informant interviews (KIs), in the course of migration, the herders and the livestock are facing various challenges, including conflict with other pastoralists, animal and human diseases, and psycho-social stress. This situation was confirmed with district and zone KIs interviewees. The common constraints to livestock mobility during the migration are described in Table 3.
Table 3.
The common constraints faced by herders during livestock migration.
Among these constraints, conflict be maintaining traditional grazing lands and the prevalence of animal diseases are the most important. The Nyangatom herders face cattle looting during migration, particularly from their Kenyan neighbors, but also from other ethnic groups in the LOV. In turn, Nyangatom also raid their neighbors for livestock [14,33]. Similarly, the livestock and herders are suffering from animal diseases, such as trypanosomiasis caused by the tsetse fly and other local zoonotic diseases. This finding is in agreement with [8,50,51]. During migration, herders become highly dependent on animal products, such as milk and blood, for their food supply and rarely get balanced diets that meet food diversity requirements for a healthy life.
Furthermore, livestock herders stated that they often feel lonely and disconnected from the families, since they spent a long time away from the village looking after the livestock. In the past, they used to return to the village and reunite with the family for at least a couple of months during the short rainy season (eurpe). However, due to changes in the local environment, they nowadays complain that “…we are forced to spend more time in Tirga and no chance to come back to the nawi for socialization such as getting a blessing from elders (or from father and mother), engagement and get married on time…”. Other key informants added that “…in the past the herders used to bring all livestock from the dry season grazing area to the nawi and slaughter the best fattened ox to the sub-clan leaders to get a blessing and show how they keep the livestock and marking of sub-clan young calves”. A study in Borana district in southern Ethiopia has shown that human capital and psycho-social tress had a significant relationship to social capital and peace and security dimensions, which affects the pastoral livelihood of the Borana people [52].
3.2. Fodder Demand
Table 4 presents total livestock in TLU and the annual fodder demand in TLU equivalent for the Nyangatom based on the 2018/19 district livestock enumeration. The livestock data were compared between zone and district for data consistency. The comparison yielded sufficient confidence to consider the district-level livestock enumeration data for supply–demand analysis. The total livestock population in 2018/19 for Nyangatom in TLU was estimated to be 362,860 at district enumeration. However, the local informants (clan chiefs, herders, local animal extension experts, and pastoral development offices) estimated up to 30% of the total livestock out-migrate every year in search of pasture (Table 4).
Table 4.
Total fodder requirement based on district livestock population data, 30% of total livestock adjusted for out-migration, and annual dry matter production based on 2018 LULC change analysis.
Similarly, this estimation was confirmed by zone offices of animal and fishery and pastoral development and witnessed during the field visit to the cattle camp in the Tirga area. Even some of the coordinate points taken in the Tirga grazing areas were out of the district map boundary. Accordingly, the annual demand for livestock fodder based on TLU and per unit intake capacity was estimated to be 584,205tonnes/year on a dry matter basis. This leaves about 213,514 tonnes of fodder demand obtained through out-migration of the Nyangatom territory annually. The national and regional DM deficit was reported to be 21 and 40 percent, respectively [41].
Figure 4 shows the spatial distribution of fodder demand and livestock density in Nyangatom district. Figure 4a shows an interpolation of livestock DM demand distributed over an area. Accordingly, the western and southeastern parts of the district have the highest livestock population, corresponding to high annual fodder demand. Similarly, Lorenkachawo, Chare, and Kupiray qebeles (Figure 4b) in the northcentral and eastern parts of the district, have a large livestock population and a correspondingly high demand for livestock fodder. This indicates that the livestock population pressure is highest in the west of Nyangatom following the Kibish River corridor bordering the Turkana and northcentral and northeastern parts close to the Omo River. The highest demand exists in Lorenkachawo, followed by Lotomon, Lokuumugnag, Lokorlam, Natikar, and Chunkura, and the least being in Narogy and Kangaten qebeles. By contrast, a few qebeles in eastern parts of the district along the Omo River are showing relatively lower fodder demand. The high demand in the Tirga area occurs after livestock migration during the dry season of the year. During the better months, March, April, and May (MAM) of the year, most of the livestock move back to the village (nawi), since the pasture and water have become relatively available (Table 3).
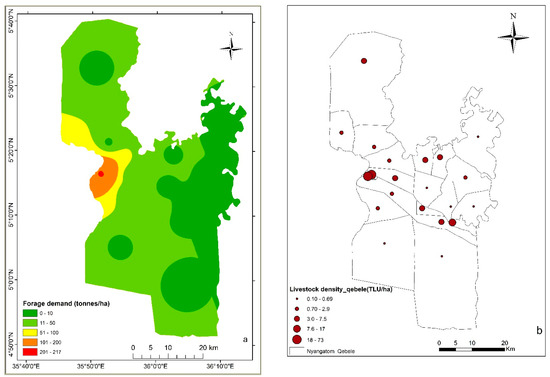
Figure 4.
Spatial distribution of fodder demand (a) and livestock density (TLU/ha) in each qebele (b).
3.3. Seasonality of Qebeles’ Livestock Migration Itineraries
During the migration, the herders used the same route to main dry season migration areas, such as Tirga and Kuraz. For illustrative purposes, we will now closely investigate how the livestock migrates and demand their fodder at stopovers and destinations by taking two qebeles as an example. Figure 5 indicates the detailed mobility routes for Chunkura and Lorenkachawo qebeles during the dry season and the time spent over the year after migration. The livestock at destination may stay from seven months to more than a year, depending on local environmental conditions, including pasture availability. The duration within each year that herds from each qebele spend in Tirga is 44–48 weeks. However, during a good year, Tirga is the least preferred, due to its distance, conflict risk, and prevalence of animal diseases (tsetse fly). From Chunkura qebele, for example, herdsmen first migrate (21,439 TLU) to Kuraz in Kajamakin qebele (starting in June), which is the nearest dry season grazing area, then continue the journey further to Tirga via Lebere, Lokorlam, Koutom, Kakuta within three days (starts mid-July) (Figure 5 as indicated in blue line and circle), demanding 462 tonnes of DM. Recently, however, due to escalating insecurity, agro-pastoralists abandon parts of the Mt. Kuraz grazing area and are forced to migrate to Tirga. During FG and KI discussions, however, the community at the Kibish area is confirmed to continue grazing in Kuraz, even under the security threat from Dassanech and Turkana during prolonged drought, in addition to Tirga. The community elders describe this situation as follows: ‘We die for our livestock, our lives without them are nothing.’ Similarly, livestock (28,011 TLU) from Lorenkachawo migrates to Tirga through Lokulan (Lopeta), Lokorlam (Bongosso and Lokidir), Koutom (Narus, Kongose, Aqualup), as indicated with a red line and circle (Figure 5). The stopover time may vary from a few days to a week to reach the dry season grazing site, depending on the availability of DM at stopovers. Thus, the total DM demand between departure and destination points was estimated in the order of 1282 tonnes. At this point, it is important to mention that there is no restriction for grazing at the sub-clan territorial sections. A similar livestock mobility following DM gradients in response to fodder need was reported in sub-Saharan Africa, Afar, and Somali regional states [22,53,54].
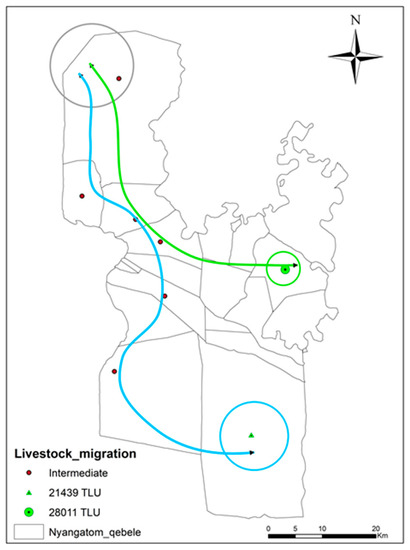
Figure 5.
Livestock movement routes for Chunkura (blue circle) and Lorenkachawo (red circle) (the black dots represent intermediate pasturelands with the total livestock moving to Tirga and the circle at Tirga (main dry season pastureland) showing the dry season pastureland, including territories beyond the district. The number in the legend indicates the total livestock migrating to dry season pasturelands.
3.4. Fodder Supply
The estimated total annual dry matter production in Nyangatom obtained from the current LULC analysis was 508,967 tonnes (Table 1 and Table 4). Figure 6 shows the spatial distribution of biomass production in Nyangatom district. The dry and wet season dry matter can support livestock production of 378,753 and 130,214 TLU equivalent, respectively. The analysis shows a concentrated biomass (DM) production in northern parts, particularly around Tirga and south-southwest around Mt. Kuraz (Kajamakin), which are the main dry season grazing areas; the western, eastern, and central parts showing less annual biomass production. A few places in the eastern parts of the Omo River show high annual biomass production; yet, these areas are less accessible, due to conflict with the Hamer, Dassanech, and Turkana. Some areas with better dry matter production and accessibility to the Omo River have been allocated to the Ethiopian Sugar Corporation (ESC) and medium to small-scale private agricultural investments, which further threatens the agro-pastoralists’ livelihoods and food security situation (Figure 6). Similarly, pasture degradation, due to overgrazing and climate change in western and central parts exacerbates the fodder supply deficit and forced the livestock to migrate beyond their territory in search of fodder and water to fill the demand gaps. Similar reports were made by Sonneveld et al. [22] and Meshesha et al. [54]. These migration trends beyond the district territory are often creating a fertile ground for resource-based conflict with neighboring ethnic groups who are sharing the same resources to support their livelihood. The similar resource-based conflict was regularly reported in the lower Omo valley [8,30,33,51,54].
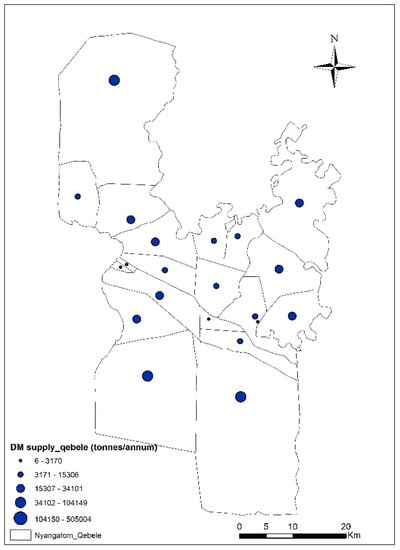
Figure 6.
Spatial distribution of dry matter supply by qebele.
3.5. Animal Fodder Supply–Demand without Migration for Dry and Wet Seasons
This study estimated the annual fodder supply of 508,967 tonnes/year against the demand of 584,205 tonnes/year, thereby showing a 12.9% dry matter deficit annually. The remaining (213,514 tonnes) fodder supply gaps in Nyangatom are filled through livestock migration outside of the study area to Surma/Suri, Omo Park, and Mt. Naita in the South Sudan border. The Nyangatom also take their livestock to Dassanech and Hamer pasturelands to the south and southeast of the district. Likewise, at the national level, Zemene et al. [55] and Mergia et al. [56] reported a negative fodder balance for the livestock population in Ethiopia, leaving up to 32% of the demand gap. Similarly, FAO [41] reported a 21 and 40 percent DM deficit for Ethiopia and SNNPR, respectively.
The supply–demand balance shows that most territorial sections of Nyangatom are facing fodder deficit except for a few pockets in the north, northeast, and southwest, which shows small surpluses of dry matter production (Figure 7; panel b). All-year surplus was reported around Mt. Kuraz (Kajamaken qebele), Chunkura, and Kuchuru qebeles. West, northwestern and central parts show a deficit between 217 and 10, whereas the eastern parts following part of the Omo River in between −10 (deficit) to 0 (no surplus) annually. This indicated that most parts of Nyangatom district are in deficit for livestock fodder supply.
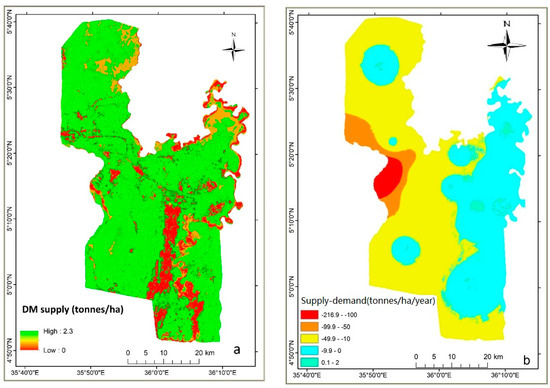
Figure 7.
Animal fodder supply (a) and (b) supply–demand balance for Nyangatom.
3.6. Animal Fodder Supply–Demand with Migration for Wet and Dry Seasons
Figure 8 presents the full livestock migration structure during the dry season of the year. Full migration routes for 20 qebeles were elaborated to demonstrate the actual livestock migration pattern and seasonality in search of good pasture and water. For migratory livestock route-mapping, we divided the seasons into dry and wet seasons (Table 3). The grazing period is different between the dry (9 months) and wet season (3 months). Unlike the Ethiopian highlands, the main rainy season (Kirmet/Akuporo) is March, April, and May (MAM), short rain (Tseday/Erupe) in October and November, and all other months of the year are dry season (Bega/Akaamu). The livestock migration in Nyangatom is cyclical and usually starts at the beginning of June (Losuban) and continues until the end of February (Lomaruk) every year under normal conditions. In the past, there used to be a short rainy season called Erupe (Lorara and Lomuk), in which a few livestock revisited the nawi/qebele grazing sites for a short time (Table 3).
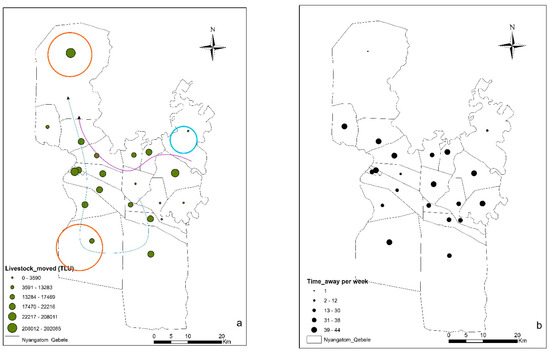
Figure 8.
Total TLU’s at destination qebeles (a) and mean time at destination qebele after migration (in weeks) (b) during the dry season (The red circles in Figure 8a indicates the major dry season migration areas and the blue circle shows Lokulan cattle camp and arrows indicates the livestock mobility).
Nyangatom agro-pastoralists follow certain migration routes depending on local environmental conditions, including precipitation, pasture, water availability, and security. Wonchesa et al. [40] also reported environmental constraints as factors determining animal feed availability in the Gurage zone. The community in all qebeles indicated that Tirga and Kuraz were the most preferred and commonly visited grazing areas throughout the year, particularly during the prolonged drought period. During the wet season (MAM), the Nyangatom keep their livestock close to the nawi/qebele pasturelands (concentrated in sub-territorial section pasturelands), for at least 10–12 weeks, depending on pasture and water availability.
Figure 8 depicts the total TLU presence in dry grazing areas and the livestock share of each qebele (Panel a), and the mean time spent at destination by individual households at Tirga and Kuraz (panel b). For example, the bigger circle (Figure 8a) indicated Tirga (north) and Kuraz (southwest) as the main dry season grazing areas to where most livestock migrated every year. The smallest circle in Tirga (Figure 9; panel b) indicates no stock moving away from Tirga during the dry season, since it is a hosting grazing area. The other short-period dry grazing areas include Lokulan (Lopeta) (northeast bordering Karo) and Narus (north Kowutom). The animals left behind in the nawi (all year round) are few and provide basic household incomes, while the majority of livestock migrates to the dry season grazing areas. In contrast, nearly no livestock in Kuchuru qebele (Kwegu territorial section) migrate to dry season pasturelands (blue ring in Figure 9; panel a). The Kwegu’s livestock spend most of the year around their territorial sections, including Lokulan (Lopeta) cattle camp.
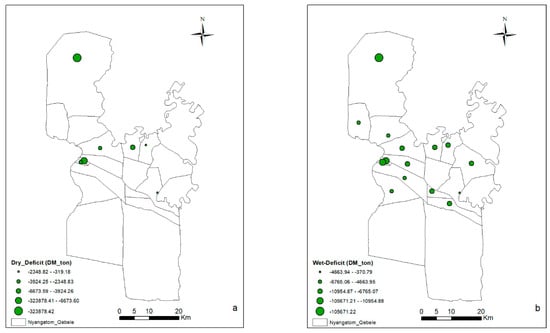
Figure 9.
Fodder deficit: (a) Dry season after migration and (b) wet season without migration.
3.7. Seasonal Supply–Demand Hotspot Analysis
Figure 9 and Figure 10 show qebeles with seasonal fodder deficit and surplus based on animal DM requirement equivalent. This analysis identified the critical hotspots in TLU equivalent between the two seasons considering concurrent livestock mobility. The DM supply deficit was found in western and northern parts of the district during the dry season and most of the district during the wet season of the year (Figure 9). During the wet season, all qebeles in the western, northern, and central parts showed fodder deficit. The high deficit all over the year in Tirga is due to the accumulation of livestock from all qebeles. Only a few pocket areas in some qebeles show some surplus, particularly in southern (Kajamaken and Chunkura), northeastern (Kuchuru), and eastern (Aipa) parts of the Nyangatom. All the areas in surplus were observed to be close to the Omo and Kibish rivers and are considered as a potential grazing area, but have limited access, due to resource-based conflicts with other resource user groups outside the district. Generally, after migration, most of the fodder deficit disappeared in western and central parts, whereas some qebeles persist in showing a deficit even after the migration (Figure 10). During the prolonged drought period, government and NGOs provide small fodder for the livestock that stay in the village (Nawi). However, according to the local community and experts, the surplus in the central parts of the district is an overestimation of DM, due to the wide coverage of Heliotropium cinerascens (losigra) weed, which is unpalatable for most livestock.
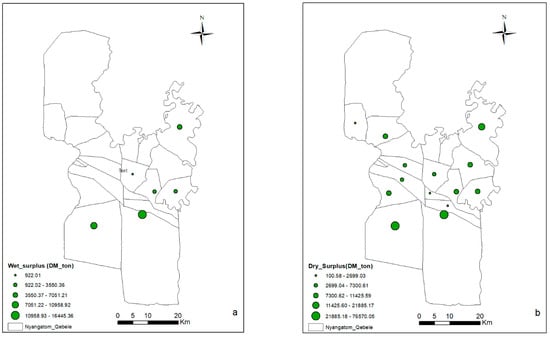
Figure 10.
Dry matter surplus: (a) Wet season without migration (b) dry season after migration.
During the wet season (March-May), Kajamakin (around Kuraz area), Kuchuru, Chunkura, Nargoy, Lopoko, and Aipa showed a small surplus of dry matter production (Table 3), while the rest were facing a fodder deficit (Figure 10; panel a). Similarly, during the dry season, when livestock migrated to dry grazing areas, Kakuta, Kajamakin, Lokorlam, Neyape, Lebere, Natikar, Kuchuru, Lorenkachawo, Chunkura, Lopokor, Nargoy, Nakiariman, Naptokoit, and Aipa show some surplus of DM production (Figure 10b). Kakuta, Nakiariman, and Naptokoit were slowly recovering from the wet season deficit into the dry season surplus following livestock migration to dry season grazing areas. The surplus in Kajamakin starts to reduce, due to hosting additional livestock from nearby qebeles between June and August (Figure 8; panel a). Hot spots where fodder demand exceeds supply were identified in the western and northcentral parts of the district, including Tirga. These critical fodder supply qebeles are known for high livestock numbers. This deficit situation can be explained by multiple factors, including lack of technologies that enable the agro-pastoralists to manage surplus DM production, rangeland degradation, overgrazing, conflicts that inhibit visiting important grazing areas, and invasions of alien species, such as Prosopis juliflora and H. cinerascens (losigiria) (see Section 4). Wonchesa et al. [40] in the Gurage zone, Mehari [57] in Afar, and Abebe [58] in the Borana zone of Oromia regional state and in Moyale reported similar challenges. The impacts of invasive alien species were reported in Afar grazing lands [22,37] and [42] in Sudan.
Generally, Lotomon, Lokuwamugnen, Kowtom (western parts), and Chare and Kupuriya (north) have shown the highest deficit all around the year, whereas Chunkura, Kajamakin (south and southwestern), and Kuchuru (northeastern) showed a little surplus. The livestock fodder requirement exceeded supply in western, northwestern, and central parts of the district, viz. livestock population pressure was highest compared to the southern and northeastern parts of Nyangatom district.
4. Scenario Analysis. Supply–Demand under the Omo-V Project and Climate Change
4.1. Large-Scale Agricultural Projects
The Omo-V sugar development project is perhaps the largest agricultural development project in Nyangatom district. According to the Omo-V project office, currently, they are preparing 50,000 ha (61.7%) of the original plan (81,000 ha) (or 18.8% of the total land area of the district) for sugarcane plantation, a sugarcane crushing factory, irrigation canal systems, housing for employees and other infrastructure developments, including road networks within the project site. Moreover, 30,000 ha (11.3%) of the fertile land, including grazing land, riverine forest, wood, and shrublands along the Omo River, were allocated to the private agricultural investments. Reports indicate that the demand for fertile land in Nyangatom is expected to increase in the future [34]. Thus, it is estimated that the land allocated for agricultural and sugarcane plantation development will reduce the dry matter production available for the Nyangatom livestock. For example, it is expected that most of the DM production (61,394 tonnes) from the Tirga area will be lost—which is the main Omo-V sugarcane plantation project implementation site and is Nyangatom dry season grazing land (Table 4). This, in turn, will not only affect the animal fodder supply–demand, but also restrict free livestock mobility and incur out-migration to even further away. Similar impacts from cropland expansion are reported in different parts of Ethiopia [32,33,39,40].
For a spatio-temporal assessment of the above-discussed intervention, we adjusted the shares in the transformation matrix to reflect changes and restrictions in the routings under the developing situation. We ran the model again and found that the total fodder supply would be further reduced from −132,260 to −242,248 tonnes annually. The mobility model indicated that the wet season balance will change from −114,713 to −155,924 tonnes, whereas dry season fodder balance will shift from −17,547 to −86,324 tonnes annually after implementation of the Omo-V sugar project. Figure 11 shows the fodder S-D before and after the implementation of Omo-V sugar projects. These changes are expected to be further aggravated with climate effects and will result in increased pressures and may lead to pastureland degradation. This pressure on pastureland might force the Nyangatom to further migrate to better areas. Finally, these conditions will result in more resource-based conflicts between hosting and visiting ethnic groups to the dry season grazing areas in the LOV.
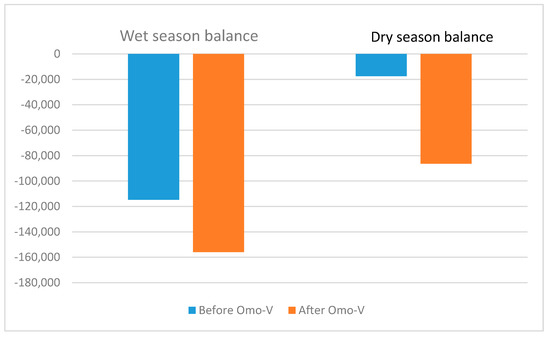
Figure 11.
Wet and dry season fodder supply balance before and after the implementation of the Omo-V sugar project.
Similarly, it is expected that the proposed Omo-V sugarcane project will further shrink and fragment the fertile pasturelands in Nyangatom and triggers additional migration in search of fodder. Experts and community spokespersons argued that the already vulnerable security situation can be aggravated by the arrival and expansion of large-scale agricultural investment (as seen in Salamago district), such as Omo-V, that takes large-fertile lands used for grazing and serving as corridors for livestock mobility [36]. Additionally, population influx following the project can further cut the pasturelands and limit livestock mobility in project intervention qebeles (since it touches about 13 qebeles out of the 20) [39]. This, in turn, exacerbates resource-based conflicts between different resource user groups in the LOV [59]. Consequently, the conflict dynamics again diminish the available pasturelands by limiting access to potential wet/dry season pasturelands (Figure 12). Studies indicated that the pastoral communities, due to the emerging large-scale development projects, are further marginalized to potential conflict-prone areas [32,60]. The pastoralists and agro-pastoralists are clearly experiencing loss of traditional pasturelands, due to large-scale sugarcane and agricultural projects in the Salamago and Surma districts [32,33,36] in the LOV. Agro-pastoralists in Nyangatom have already started to partly abandon some dry season grazing areas around Kibish, due to conflict with Turkana and Dassanech. The high-risk areas that are frequently visited by herdsman include the Nyangatom-Surma border (northwest, Omo Park), Nyangatom-Turkana (west, Kibish area), and Nyangatom-Dassanech (southwest around Mt. Kuraz) (Figure 12). The restrictions will further increase the pasture deficit, since the livestock has limited options to graze, particularly during times of prolonged drought. Yintiso [49] reported conflict dynamics between these ethnic groups for scarce resources.
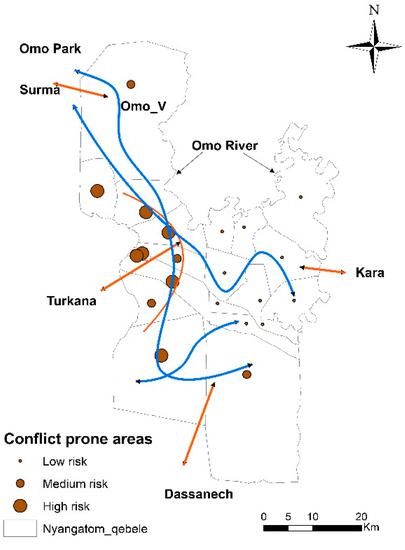
Figure 12.
Conflict dynamics and livestock mobility routes: Blue lines show the livestock mobility-back and forth, the red lines show conflict dynamics with neighboring ethnic groups (this risk analysis was done in consultation with KI, FGD, and experts).
4.2. Climate Change
On top of the emerging large-scale agricultural investment in pastoral lands, the changing climate and its variability are significantly affecting the pasture production and food security situation [19,42,61]. Worku and Lisanework [30] also reported the impacts of drought on livestock management in Kuraz district. According to the local community and experts, climate change in Nyangatom has already affected (i.e., diminished) pasture availability through degradation, and in the coming years, it is expected to reduce the fodder availability by up to 20%. Similarly, the invasion of alien species, as shown in Kibish with P. juliflora and central qebeles with H. cinerascens (losigira), has increased due to climate variability and changes, which further reduced pasture production. Thus, climate change will further affect the production of a sufficient quantity of pasture in Nyangatom up to −235,108 tonnes, which could lower the fodder supply to 51%. The transformation model shows the changes between the wet season (−141,811 tonnes) and dry season (−93,297 tonnes) (Figure 13). Climate change has the potential to impact the quantity and quality of fodder production, as well as large-scale pastureland composition [19]. Increased temperature is known to increase lignification and thereby the degradation rate and digestibility of the plant species [62]. Similarly, other studies [61,63] showed that a drier climate stimulates the growth of troublesome weeds in intensively managed grasslands and can contribute to an increased risk of weed invasion. The competitive advantage of invasive weeds will negatively impact fodder composition and quality of grasslands [26,64]. The key informants in Nyangatom confirmed the perceived changes in natural indicators, such as the disappearance of some fodder plants locally. Thus, this situation would increase the frequency of migration to non-hospitable and far-away areas, such as Kibish bordering Turkana and Lomolomur in the Surma area and Naita at the South Sudan border.
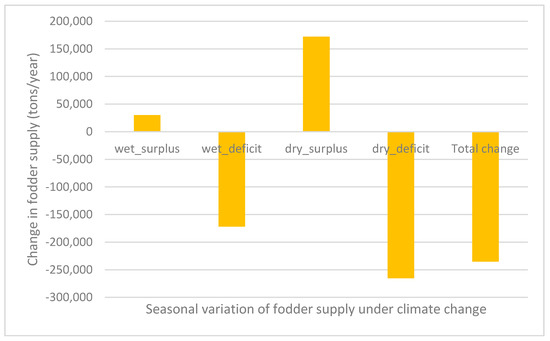
Figure 13.
The changes in animal fodder supply under climate change condition (20% reduction in fodder supply following climate change).
Under static fodder supply and traditional livestock management trends, the total livestock population in Nyangatom will show an increasing trend (Figure A1). This projected livestock population indicated that the total DM demand would increase from 792,129 in 2018/19 to 1,040,779 in 2025 and to 1,264,870 tonnes of dry matter equivalent by 2030. Dry matter demand is growing, while the pasture lands are shrinking following large-scale agricultural land encroachment, invasion of woody and herbaceous invasive species, and overgrazing [38,42]. This situation further aggravates the animal fodder supply challenges and stimulates further conflict in the LOV [36]. Therefore, this is the time to design sustainable pastureland and livestock management strategies in the face of large-scale agricultural investment, climate change, and increasing trends of livestock growth. This can be addressed through the appropriate engagement of local institutions (formal and informal) for pastureland and livestock management. The above transformation model analysis evidently indicates that the local livelihoods of the Nyangatom agro-pastoralists are becoming vulnerable, due to large-scale agricultural investment and related infrastructure development, under changing climate effects, conflict dynamics, and the growing demand for livestock fodder. With this, the local development plans must consider the local livelihood base to ensure equitable benefits from the resources available.
4.3. Implication for Future Pastoral Development
Expansion of large-scale agriculture, conflict, as well as overgrazing, have put considerable pressure on local livelihoods, livestock management, and the environment [18,41,51]. A policy focusing solely on agricultural intensification dismisses the pastoral livelihoods, for example, within the LOV encompass many non-farming elements, including pastoralism, hunting and gathering, and other diversified subsistence, as well as income-generating activities [12,59]. This kind of policy also ignores the fact that landholding has characterized customary land-use rights [12]. The government has to seek, therefore, diversified ways of large-scale agricultural development better based on local socio-ecological conditions, while taking pastoral livelihood and land-use patterns into consideration. To this end, it is suggested that future interventions should take into account improved fodder management technologies (production and storage) in the LOV. The control of conflict between different interest groups in the LOV can provide adequate space for livestock mobility and ensure the safety of herders engaged in this activity (Figure 12). These will free currently locked and inaccessible grazing areas, due to intermittent conflict, which will otherwise be further pressurized by large-scale agricultural investment.
Environmental factors, such as bush encroachment and increasingly frequent drought in the LOV, are concerning as they indicate an acceleration in the decline in fodder production and productivity. These natural phenomenons are coupled with overgrazing negatively affecting fodder production (Figure 4 and Figure A1) [54,57]. Furthermore, the occurrence of animal diseases further reduces the dry season fodder sources in the LOV [16]. Given the large contribution of the pastures to livestock production and their role in supporting local livelihoods, the impact of climate change on fodder production and its likely effect on livestock productivity and food security is a growing challenge [61]. Such challenges become worse in the case where the major sources of animal fodder is from green fodder, as shown in Nyangatom (Table 1, Figure 6 and Figure 7). If the current trend continues, overgrazing, climate change, and associated land degradation may create more damage to livestock productivity, which will have an immense effect on the sustainability of pasturelands and local livelihoods.
This study identifies critical hotspots as a livestock management tool that the local community, local government administration, and regional government can apply to design a pro-pastoral policy and promote sustainable pastoral development actions. The supply–demand model can be useful as a decision-making tool for policymakers, due to its flexibility to consider potential factors that can affect fodder supply. Further study can be recommended to find new hotspots by including livestock mobility (in-migration) and conflict dynamics following the up-coming and ongoing development projects in the LOV.
5. Conclusions
The main fodder sources in Nyangatom natural grazing system are grassland, shrubland, woodland, and riverine forest, which provide more than 87% of total annual DM demand in the district. Crop residue and other forage sources are not significant. The deterioration of communal grazing lands and increasing drought has made it difficult for pastoralists to maintain their livestock in the territory throughout the year. The seasonal migration or transhumance of livestock in search of fodder is a traditional practice that allows pastoralists to close the supply gaps to maintain their herds and the health of the environment. Large-scale agricultural investment and climate change put the rangelands under further new pressures, and with threats of animal diseases and conflicts with other resource user groups, the reduction of land productivity looms large.
Using remote sensing and GIS technologies, we identified DM yield and spatial and temporal distribution in Nyangatom district. The mobility model employed to determine the actual demand was confronted with the fodder supply to evaluate the supply–demand balance under the prevailing migration patterns. Further, the mobility model used to investigate the supply–demand hotspots, migration structure, and time spent at stopover and destination points may significantly enhance our understanding of animal mobility in the face of climate change, conflict, and large-scale agricultural land expansion. The supply–demand balance indicated that western and central parts of the Nyangatom face an enormous seasonal fodder deficit. In contrast, only areas in Kajamakin, Chunkura, and Kuchuru have shown some fodder surplus. Generally, Nyangatom has shown an overall deficit in annual fodder supply. Scenario analyses were carried out to indicate the cumulative impacts of the upcoming large-scale sugar project and other agricultural investments, conflict, climate change, and pressure from the livestock population and to support informed planning. These analyses will have fundamental importance towards achieving sustainable livestock management and ensuring food security in the lower Omo valley under emerging large-scale agricultural investment and climate change.
It is highly recommended that actions to increase the productivity of the local grazing land are taken together with promoting appropriate management practices, including community-managed area enclosure and support for improved forage development. Further, maintaining dry season pasturelands can help to reduce the fodder supply gaps. Hence, we strongly suggest that the local, regional, and federal governments support the local efforts of mitigation strategies to drought and communal grazing land management practices that benefit the community and satisfy national investment demands. Furthermore, policy support can be provided to improve drought resilience through enabling movement and eliminating restrictions to access dry season pasture reserves in times of drought. Appropriate interventions and strategies need to be put in place to ensure that in the coming years, the pasturelands can continue to play a useful role in supporting the livestock herds and the families relying on livestock as a major livelihood option under the current development challenges from Omo-V sugar-projects Nyangatom in particular and LOV in general.
Author Contributions
Methodology: A.K.G. and B.G.J.S.S.; formal analysis, data curation and writing-original draft preparation: A.K.G.; review and editing: B.G.J.S.S. and D.J.S.; supervision: B.G.J.S.S.; All authors have read and agreed to the published version of the manuscript.
Funding
This research is supported by the Netherlands Fellowship Programme NUFFIC/NFP-research grant scheme, CF11834-2016.
Institutional Review Board Statement
Not applicable.
Informed Consent Statement
Not applicable.
Data Availability Statement
The data presented in this study are available on request from the corresponding author.
Acknowledgments
We are grateful to the AAU-HoA-REC&N (for providing the research facilities in Ethiopia) and VU Amsterdam, The Netherlands. We would like to thank the Nyangatom district administration for the collaboration and providing access to conduct this study in 2018 and 2019. Special thanks go to the local community who participated in this research. We also thank Jon Abbink (VU and ASCL-UL) for comments and suggestions on an earlier draft of this manuscript.
Conflicts of Interest
The authors declare no conflict of interest.
Appendix A
Table A1.
The total livestock population and seasonal fodder supply–demand by qebele of the study area—note that 30% of the total livestock out-migrated in search of fodder during the dry season.
Table A1.
The total livestock population and seasonal fodder supply–demand by qebele of the study area—note that 30% of the total livestock out-migrated in search of fodder during the dry season.
| Name of Qebele | Dry Season Supply | Wet Season Supply | Dry Season Demand | Wet Season Demand-All Stock | Dry Season Balance | Wet Season Balance |
|---|---|---|---|---|---|---|
| Aipa | 12,514 | 4171 | 1089 | 1188 | 11,426 | 2983 |
| Chare | 6756 | 2252 | 10,680 | 12,493 | −3924 | −6493 |
| Chunkura | 78,111 | 26,037 | 1541 | 12,621 | 76,570 | 17,203 |
| Kajamakin | 60,358 | 20,119 | 5327 | 11,632 | 55,030 | 11,977 |
| Kakuta | 10,724 | 3575 | 8025 | 10,109 | 2699 | −3502 |
| Kangaten | 5 | 2 | 324 | 461 | −319 | −460 |
| Kopiriyai | 7126 | 2375 | 7527 | 12,975 | −401 | −6707 |
| Kowtom | 14,668 | 4889 | 17,016 | 14,666 | −2349 | −53,772 |
| Kuchuru | 25,575 | 8525 | 3690 | 1474 | 21,885 | 7051 |
| Lebere | 13,405 | 4468 | 2359 | 12,877 | 11,046 | −4545 |
| Lokorlam | 12,630 | 4210 | 3777 | 13,746 | 8853 | −5412 |
| Lokuwamugnen | 642 | 214 | 7315 | 14,093 | −6674 | −9651 |
| Lopokor | 9481 | 3160 | 2180 | 2746 | 7301 | 414 |
| Lorenkachawo | 15,625 | 5208 | 5340 | 17,490 | 10,285 | −7035 |
| Lotomen | 665 | 222 | 3067 | 16,744 | −2403 | −9651 |
| Nakeriaman | 2378 | 793 | 2228 | 10,423 | 150 | −6503 |
| Naptokoit | 6321 | 2107 | 6220 | 12,733 | 101 | −6806 |
| Nargoy | 11,479 | 3826 | 553 | 453 | 10,927 | 3374 |
| Natikar | 13,136 | 4379 | 7219 | 13,135 | 5917 | −4816 |
| Nawoyape | 7682 | 2561 | 1867 | 12,231 | 5815 | −6001 |
| Tirga | 69,472 | 23,157 | 373,691 | 122,390 | −323,878 | −74,754 |
| Total Nyangatom | 378,753 | 130,214 | 471,038 | 326,680 | −35,093 | −2,229,426 |
Table A2.
Biomass/dry matter conversion factors by land-use, FAO [38].
Table A2.
Biomass/dry matter conversion factors by land-use, FAO [38].
| Land-Use Class | DM Production (Kg/ha/annum) |
|---|---|
| Grassland | 2.9 |
| Settlement | 0.0 |
| Exposed land and soil/bare land | 0.5 |
| Water bodies | 0.0 |
| Cultivated (moderately) land | 1.8 |
| Dense woodland | 0.7 |
| Woodland | 1.9 |
| Riparian wood/forest/bush | 1.9 |
| Shrubland | 1.6 |

Figure A1.
Livestock trends in TLU and DM requirement equivalents in Nyangatom (the projection for 2025/2030 was made using annual animal growth rate of 3.6% for the zone-south Omo zone Animal and Fishery department, 2019 unpublished data.
References
- Millennium Ecosystem Assessment (MEA). Ecosystems and Human Well-Being: Desertification Synthesis; World Resources Institute: Washington, DC, USA, 2005. [Google Scholar]
- Holechek, J.L.; Pieper, R.D.; Herbel, C.H. Range Management Principles and Practices, 6th ed.; Pearson Education, Inc.: Upper Saddle River, NJ, USA, 2005. [Google Scholar]
- Friedel, M.H.; Laycock, W.A.; Bastin, G.N. Assessing Rangeland Condition and Trend. In Field and Laboratory Methods for Grassland and Animal Production Research; Mannetje, L.T., Jones, R.M., Eds.; CABI International: Wallingford, UK, 2000; pp. 305–360. [Google Scholar]
- Herlocker, D.J. Rangeland Ecology and Resource Development in Eastern Africa: Their Ecology and Development; Deutsche Gesellschaft für Technische Zusammenarbeit (GTZ): Nairobi, Kenya, 1999; p. 393. [Google Scholar]
- Grade, J.T. Karamojon (Uganda) Pastoralists’ Use of Wild Edible Plants: A Traditional Coping Mechanism towards Climate change. In Climate Change and Pastoralism: Traditional Coping Mechanisms and Conflict in the Horn of Africa; Berhe, M.G., Butera, J.B., Eds.; Institute for Peace and Security, AAU and University for Peace: Addis Ababa, Ethiopia, 2012; pp. 153–176. [Google Scholar]
- Abtew, A.A.; Pretzsch, J.; Secco, L.; Mohamod, T.E. Contribution of Small-Scale Gum and Resin Commercialization to Local Livelihood and Rural Economic Development in the Drylands of Eastern Africa. Forests 2014, 5, 952–977. [Google Scholar] [CrossRef]
- Getachew, K.N. Among the Pastoral Afar in Ethiopia: Tradition, Continuity and Socio-Economic Change; International Books: Utrecht, The Netherlands; OSS-REA: Addis Ababa, The Netherlands, 2001; p. 208. [Google Scholar] [CrossRef]
- Admasu, T.; Abule, E.; Tessema, Z. Livestock-rangeland management practices and community perceptions towards rangeland degradation in South Omo zone of Southern Ethiopia. Livest. Res. Rural Dev. 2010, 22, 5. Available online: http://www.lrrd.org/lrrd22/1/tere22005.htm (accessed on 10 March 2020).
- Jahnke, H.E. Livestock Production Systems and Livestock Development in Tropical Africa; Kieler Wissenschaftsverlag Vauk: Kiel, Germany, 1982. [Google Scholar]
- Coppock, D.L. The Borana Plateau of Southern Ethiopia: Synthesis of Pastoral Research Development and Change 1980–1991; International Livestock Center for Africa (ILCA): Addis Ababa, Ethiopia, 1994. [Google Scholar]
- Kaimba, K.; Njehia, B.K.; Guliye, Y.A. Effects of cattle rustling and household characteristics on migration decisions and herd size amongst pastoralists in Baringo District, Kenya George. Pastor. Res. Policy Pract. 2011, 1, 18. Available online: http://www.pastoralismjournal.com/content/1/1/18 (accessed on 10 March 2020).
- Tornay, S. The Nyangatom: An outline of their ecology and social organization. In Peoples and Cultures of the Ethio-Sudan Borderlands; Bender, M.L., Ed.; Michigan State University: East Lansing, MI, USA, 1981; pp. 137–178. [Google Scholar]
- Endalew, B.; Ayalew, Z. Assessment of the Role of Livestock in Ethiopia: A Review. Am.-Eurasian J. Sci. Res. 2016, 11, 5. [Google Scholar] [CrossRef]
- Glowacki, L.; Isakov, A.; Wrangham, R.W.; McDermott, R.; Fowler, J.H.; Christakis, N.A. Formation of raiding parties for intergroup violence is mediated by social network structure. Proc. Natl. Acad. Sci. USA 2016, 113, 12114–12119. [Google Scholar] [CrossRef] [PubMed]
- Vries de, D.; Leslie, P.W.; McCabe, J.T. Livestock Acquisitions Dynamics in Nomadic Pastoralist Herd Demography: A Case Study among Ngisonyoka Herders of South Turkana, Kenya. Hum. Ecol. 2006, 34, 1. [Google Scholar] [CrossRef]
- Koocheki, A.; Giliessman, S.R. Pastoral Nomadism, a sustainable system for grazing land management in arid areas. J. Sust. Agric. 2005, 25, 113–131. [Google Scholar] [CrossRef]
- Angassa, A.; Oba, G. Herder Perceptions on Impacts of Range Enclosures, Crop Farming, Fire Ban and Bush Encroachment on the Rangelands of Borana, Southern Ethiopia. Hum. Ecol. 2008, 36, 201–215. [Google Scholar] [CrossRef]
- Egeru, A.; Wasonga, O.; Kyagulanyi, J.; Majaliwa, G.J.M.; MacOpiyo, L. Spatio-temporal dynamics of forage and land cover changes in Karamoja sub-region, Uganda. Pastor. Res. Policy Pract. 2014, 4, 6. [Google Scholar] [CrossRef]
- Giridhar, K.; Samireddypalle, A. Impact of Climate Change on Forage Availability for Livestock. In Climate Change Impact on Livestock: Adaptation and Mitigation; Sejian, V., Gaughan, J., Baumgard, L., Prasad, C., Eds.; Springer: New Delhi, India, 2015; pp. 97–112. [Google Scholar] [CrossRef]
- Raikes, P.L. Livestock Development and Policy in East Africa, Center for Development Research Publications; Scandinavian Institute of African Studies: Uppsala, Sweden, 1981; p. 254. [Google Scholar]
- Sonneveld, B.G.J.S.; Keyzer, M.A.; Georgis, K.; Pande, S.; Seide Ali, A.; Takele, A. Following the Afar: Using remote tracking systems to analyse pastoralists’ trekking routes. J. Arid Environ. 2009, 73, 1046–1050. [Google Scholar] [CrossRef]
- Sonneveld, B.G.J.S.; van Wesenbeeck, C.F.A.; Keyzer, M.A.; Beyene, F.; Georgis, K.; Urbano, F.; Meroni, M.; Leo, O.; Yimer, M.K.; Abdullatif, M. Identifying Hot Spots of Critical Forage Supply in Dryland Nomadic Pastoralist Areas: A Case Study for the Afar Region, Ethiopia. Land 2017, 6, 82. [Google Scholar] [CrossRef]
- Behnke, R.H.; Scoones, I. Rethinking range ecology: Implications for rangeland management in Africa. In Rangeland Ecology at Disequilibrium: New Models of Natural Variability and Pastoral Adaptation in African Savannahs; Behnke, R.H., Scoones, I., Kerven, C., Eds.; The Commonwealth Secretariat and the Overseas Development Institute: London, UK, 1993. [Google Scholar]
- Desta, S.; Coppock, D.L. Pastoralism under pressure: Tracking system change in southern Ethiopia. Hum. Ecol. 2004, 32, 465–486. [Google Scholar] [CrossRef]
- Amsalu, T.; Addisu, S. Assessment of Grazing Land and Livestock Feed Balance in Gummara-Rib Watershed, Ethiopia. Curr. Agric. Res. J. 2014, 2, 114–122. [Google Scholar] [CrossRef]
- Abate, T.; Ebro, A.; Nigatu, L. Pastoralists perceptions and rangeland evaluation for livestock production in South Eastern Ethiopia. Lives Res. Rural Dev. 2009, 21, 101. Available online: http://www.lrrd.org/lrrd21/7/abat21101.htm (accessed on 10 March 2020).
- Tolera, A.; Abebe, A. Livestock production in pastoral and agro-pastoral production systems of southern Ethiopia. Lives Res. Rural Dev. 2007, 19, 177. Available online: http://www.lrrd.org/lrrd19/12/tole19177.htm (accessed on 10 March 2020).
- Tolera, A.; Yami, A.; Alemu, D. Livestock Feed Resources in Ethiopia: Challenges, Opportunities and the Need for Transformation; Ethiopia Animal Feed Industry Association: Addis Ababa, Ethiopia, 2012. [Google Scholar]
- Salo, S.; Tadesse, G.; Haylemeskel, D. Survey on Constraints of Improved Forage Adoption in Anelemo Woreda, Hadiya Zone, Ethiopia. Agric. Res. Tech. Open Access J. 2017, 12, 555839. [Google Scholar] [CrossRef]
- Worku, B.; Lisanework, N. Pastoral Perceptions towards Livestock and Rangeland Management Practices in Kuraz District of South Omo Zone, South Western Ethiopia. J. Nat. Sci. Res. 2016, 6, 1, ISSN 2225-0921. [Google Scholar]
- Ayana, A. Range Condition and Traditional Grazing Management in Borana. Master’s Thesis, School of Graduate Studies of Alemaya University, Dire Dawa, Ethiopia, 1999; p. 55. [Google Scholar]
- Abbink, G.J.; Askew, K.; Dori, D.F.; Fratkin, E.; Gabbert, E.C.; Galaty, J.; LaTosky, S.; Lydall, J.; Mahmoud, H.A.; Markakis, J.; et al. Lands of the Future: Transforming Pastoral Lands and Livelihoods in Eastern Africa; Working paper 154; Max Planck Institute Social Anthropology: Halle/Saale, Germany, 2014. [Google Scholar]
- Abbink, J. Losing the plot: Environmental problems and livelihood strife in developing rural Ethiopia-Suri agropastoralism vs. state resource use. In The Environmental Crunch in Africa. Growth Narratives vs. Local Realities; Abbink, J., Ed.; Palgrave-Macmillan: New York, NY, USA, 2018; pp. 137–178. [Google Scholar]
- Hodbod, J.; Tebbs, E.; Chan, K.; Sharma, S. Integrating Participatory Methods and Remote Sensing to Enhance Understanding of Ecosystem Service Dynamics Across Scale. Land 2019, 8, 132. [Google Scholar] [CrossRef]
- Tsuruta, T. The Impasse of Contemporary Agropastoralism in Central Tanzania: Environmental Pressures in the Face of Land Scarcity and Commercial Agricultural Investment. In The Environmental Crunch in Africa. Growth Narratives vs. Local Realities; Abbink, J., Ed.; Palgrave-Macmillan: New York, NY, USA, 2018; pp. 137–178. [Google Scholar] [CrossRef]
- Woldemariam, T.; Gebresenbet, F. Socio-political and Conflict Implications of Sugar Development in Salamago Wereda, Ethiopia. In A delicate Balance: Land Use, Minority Rights and Social Stability in the Horn of Africa; Berhe, M.G., Ed.; Institute for Peace and Security Studies: Addis Ababa University, Addis Ababa, Ethiopia, 2014; pp. 117–143. [Google Scholar]
- Tsegaye, D.; Moe, S.R.; Vedeld, P.; Aynekulu, E. Land-use/cover dynamics in northern Afar rangelands, Ethiopia. Agric. Ecosyst. Environ. 2010, 139, 174–180. [Google Scholar] [CrossRef]
- Bizelew, G.; Ajebu, N.; Getnet, A.; Getahun, A. Assessment of livestock feed resources in the farming systems of mixed and shifting cultivation, Gambella regional state, southwestern Ethiopia. Glob. J. Sci. Front. Res. Agric. Vet. 2016, 16, 2249–4626. [Google Scholar]
- Water Work Design Supervision Enterprise (WWDSE). Kuraz Sugar Development Project Feasibility Study Report: Environmental Impact Assessment Study Part I: Main Report; Water work design: Addis Ababa, Ethiopia, 2012. [Google Scholar]
- Wonchesa, D.D.; Wossen, A.M.; Negia, G.G. Feed resources assessment, laboratory evaluation of chemical composition of feeds and livestock feed balance in enset (Ensete ventricosum)-based mixed production systems of Gurage zone, southern Ethiopia. Int. J. Livest. Prod. 2018, 9, 112–130. [Google Scholar] [CrossRef]
- Food and Agriculture Organisation (FAO). Ethiopia: Report on Feed Inventory and Feed Balance; FAO: Rome, Italy, 2018; 160p. [Google Scholar]
- Fashir, G.A.; Fangama, I.M.; Abdalla, N.I. Influences of Agricultural Expansion on Grazing lands in Tendalti Locality, White Nile State, Sudan. Int. J. Curr. Microbiol. Appl. Sci. 2015, 4, 971–976. [Google Scholar]
- Central Statistical Agency (CSA). Projected Population Between 2014 and 2017; CSA: Addis Ababa, Ethiopia, 2014.
- Food and Agriculture Organization of the United Nations (FAO). Land Use, Production Regions, and Farming Systems Inventory; Technical report; FAO project ETH/78/003; FAO: Addis Ababa, Ethiopia, 1987; Volume 1, p. 98. [Google Scholar]
- Blummel, M.; Animut, G.; Angadi, U.B. Mapping Feed Demand and Supply; Global Nutrition Symposium: Addis Ababa, Ethiopia, 2018. [Google Scholar]
- Salo, S. Estimation of Feeds and Fodders for Livestock Population of Ethiopia and Mitigation of Feed Shortage. J. Nat. Sci. Res. 2017, 7, 11. [Google Scholar]
- Dereje, D.; Debela, K.; Wakgari, K.; Zelalem, D.; Gutema, B.; Gerba, L.; Adugna, T. Assessment of Livestock Production System and Feed Resources Availability in Three Villages of Diga District, Ethiopia; ILRI (International Livestock Research Institute): Addis Ababa, Ethiopia, 2014. [Google Scholar]
- De Leeuw, P.N.; Tothill, J.C. The Concept of Rangeland Carrying Capacity in Sub-Saharan Africa: Myth or Reality? Pastoral Development Network paper 29b; ODI: London, UK, 1990; p. 20. [Google Scholar]
- Yintiso, G. The Nyangatom Circle of Trust: Criteria for ethnic inclusion and exclusion. In Creating and Crossing Boundaries in Ethiopia. Dynamics of Social Categorization and Differentiation; Epple, S., Ed.; LIT Verlag: Münster, Germany, 2012; p. 272. [Google Scholar]
- Sharon, L. Natural Resource Use and Threatened Livelihoods: The Case of Oromo and Afar Pastoralists in the Middle Awash Valley of Ethiopia. Master’s Thesis, University College, London, UK, 2000; p. 178. [Google Scholar]
- Ebro, A. Rangeland Evaluation in Relation to Pastoralist’s Perceptions in the Mid-Awash Rift Valley of Ethiopia. Ph.D. Thesis, University of Free State, Bloemfontein, South Africa, 2003; p. 232. [Google Scholar]
- Ambelu, A.; Birhanu, Z.; Tesfaye, A.; Berhanu, N.; Muhumuza, C.; Kassahun, W.; Daba, T.; Woldemichael, K. Intervention pathways towards improving the resilience of pastoralists: A study from Borana communities, southern Ethiopia. Weather Clim. Extrem. 2017, 17, 7–16. [Google Scholar] [CrossRef]
- Turner, M.D.; Schlecht, E. Livestock mobility in sub-Saharan Africa: A critical review. Pastoralism 2019, 9, 13. [Google Scholar] [CrossRef]
- Meshesha, D.T.; Moahmmed, M.; Yosuf, D. Estimating carrying capacity and stocking rates of rangelands in Harshin District, Eastern Somali Region, Ethiopia. Ecol. Evol. 2019, 9, 13309–13319. [Google Scholar] [CrossRef]
- Zemene, W.; Tilahun, S.; Tolemariam, T.; Jimma, W. Assessment of the Prevailing cattle fattening practices in Jimma zone, South-western Ethiopia. Glob. Vet. 2016, 17, 105–113. [Google Scholar]
- Mergia, A.; Tolera, A.; Assefa, G. Feed resources Assessment and utilization in Baresa Watershed, Ethiopia. Int. J. Sci. Res. 2014, 3, 66–72. [Google Scholar]
- Mehari, Z.H. The invasion of Prosopis juliflora and Afar pastoral livelihoods in the Middle Awash area of Ethiopia. Ecol. Process 2015, 4, 13. [Google Scholar] [CrossRef]
- Abebe, A.; Eik, L.O.; Holand, Ø.; Ådnøy, T.; Tolera, A. Pastoralists’ perceptions of feed scarcity and livestock poisoning in southern rangelands, Ethiopia. Trop. Anim. Health Prod. 2012, 44, 149–157. [Google Scholar] [CrossRef]
- Abbink, J. Famine, Gold and Guns: The Suri of South-western Ethiopia, 1985–1991. Disasters 1993, 17, 218–225. [Google Scholar] [CrossRef] [PubMed][Green Version]
- Shete, M.; Rutten, M. Impacts of large-scale farming on local communities’ food security and income levels-Empirical evidence from Oromia Region, Ethiopia. Land Use Policy 2015, 47, 282–292. [Google Scholar] [CrossRef]
- Diriba, L.; Urge, M. Status and challenges of available feed resources and it’s quality under the changing climate in Adami Tulu districts of east Shoa zone, Ethiopia. Am. J. Basic Appl. Sci. 2020, 3, 15. [Google Scholar]
- Minson, D.J. Forage in Ruminant Nutrition; Academic Press: San Diego, CA, USA, 1990; p. 502. [Google Scholar]
- Boone, R.B.; Conant, R.T.; Sircely, J.; Thornton, P.K.; Herrero, M. Climate change impacts on selected global rangeland ecosystem services. Glob. Chang. Biol. 2018, 24, 1382–1393. [Google Scholar] [CrossRef]
- Gilgen, A.K.; Signarbieux, C.; Feller, U.; Buchmann, N. Competitive advantage of Rumex obtusifolius L. migh increase in intensively managed temperate grasslands under dries climate. Agric. Ecosyst. Environ. 2010, 135, 15–23. [Google Scholar] [CrossRef]
Publisher’s Note: MDPI stays neutral with regard to jurisdictional claims in published maps and institutional affiliations. |
© 2021 by the authors. Licensee MDPI, Basel, Switzerland. This article is an open access article distributed under the terms and conditions of the Creative Commons Attribution (CC BY) license (http://creativecommons.org/licenses/by/4.0/).