Article

Techno-Environmental Analysis of the Use of Green Hydrogen for Cogeneration from the Gasification of Wood and Fuel Cell

by
Abigail Gonzalez-Diaz
1,*,
Juan Carlos Sánchez Ladrón de Guevara
2,
Long Jiang
3,*,
Maria Ortencia Gonzalez-Diaz
4,
Pablo Díaz-Herrera
2 and
Carolina Font-Palma
5,*
1
National Institute of Electricity and Clean Energy, Reforma 113, Col. Palmira, Cuernavaca Morelos 62490, Mexico
2
Facultad de Ingeniería, Universidad Nacional Autonoma de Mexico, Mexico City 04510, Mexico
3
Institution of Refrigeration and Cryogenics, Zhejiang University, Hangzhou 310027, China
4
CONACYT—Centro de Investigación Científica de Yucatán, A.C., Calle 43 No. 130, Chuburná de Hidalgo, Mérida 97200, Mexico
5
Department of Engineering, University of Hull, Hull HU6 7RX, UK
*
Authors to whom correspondence should be addressed.
Sustainability 2021, 13(6), 3232; https://doi.org/10.3390/su13063232
Submission received: 31 January 2021 / Revised: 11 March 2021 / Accepted: 12 March 2021 / Published: 15 March 2021
(This article belongs to the Special Issue Sustainability of Carbon Capture and Utilisation)

Abstract

:
This paper aims to evaluate the use of wood biomass in a gasifier integrated with a fuel cell system as a low carbon technology. Experimental information of the wood is provided by the literature. The syngas is purified by using pressure swing adsorption (PSA) in order to obtain H2 with 99.99% purity. Using 132 kg/h of wood, it is possible to generate 10.57 kg/h of H2 that is used in a tubular solid oxide fuel cell (TSOFC). Then, the TSOFC generates 197.92 kW. The heat generated in the fuel cell produces 60 kg/h of steam that is needed in the gasifier. The net efficiency of the integrated system considering only the electric power generated in the TSOFC is 27.2%, which is lower than a gas turbine with the same capacity where the efficiency is around 33.1%. It is concluded that there is great potential for cogeneration with low carbon emission by using wood biomass in rural areas of developing countries e.g., with a carbon intensity of 98.35 kgCO2/MWh when compared with those of natural gas combined cycle (NGCC) without and with CO2 capture i.e., 331 kgCO2/MWh and 40 kgCO2/MWh, respectively. This is an alternative technology for places where biomass is abundant and where it is difficult to get electricity from the grid due to limits in geographical location.

1. Introduction

The 2 °C goal set by the Paris climate agreement places rigorous limits on greenhouse gas (GHG) emission. Most climate and integrated assessment models project that the concentration of CO2 in the atmosphere would have to decrease by the second half of the 21st century to achieve the 2 °C target [1]. In this sense, the deployment of negative emission technologies (NETs) becomes a key mitigation tool, which combines the production of energy from plant biomass to produce electricity. There are different NET technologies, the most important being [1]: e.g., coastal blue carbon (CBC), bioenergy with carbon capture and sequestration (BECCS), and direct air capture (DAC). According to experts on the Intergovernmental Panel on Climate Change (IPCC), the massive deployment of BECCS technology represents a cost-effective strategy [2]. The International Energy Agency (IEA) considers that BECCS could play an important role in the decarbonization of the power sector, contributing with 5% of total CO2 emission reduction in this sector by 2070 [3]. There are different BECCS technologies classified as a function of the biomass conversion pathways as follows: thermochemical, mechanical/chemical, thermo, and biochemical [4]. Among these options, the thermochemical and biological are the most used at commercial scale [1]. It is important to mention that biomass is abundant, especially in most developing countries. For example, biomass such as bamboo, rice, maize, sugarcane, sorghum, and wheat represent 85% of the total amount of residue produced in Mexico [5,6].
On the other hand, the importance of H2 as an energy vector has increased in recent years due to its widespread use and versatility e.g., in fuel cell vehicles, electricity, heating, and industrial feedstock; therefore, H2 has been considered an essential fuel for a decarbonized world [7,8,9,10,11]. Steam methane reforming (SMR) is the most used process to produce H2 due to its technological maturity and economical production at commercial size [8,10]. Despite the economic benefits of SMR over other processes, it has a large carbon footprint [8,12]. By stoichiometry, 5.5 kg of CO2 are produced per kg of H2 [13]. One option to reduce its carbon footprint is the implementation of CCUS technology. The H2 obtained through an SMR unit with CCS or CCUS is regarded as blue H2 (bH2). It can help to meet climate change goals at acceptable costs [7,8]. However, the deployment of bH2 is not necessarily CO2-free. CO2 capture efficiencies are expected to reach 85–95% at best, which means that 5–15% of all CO2 is leaked [9,11].
One of the promising technologies to produce clean H2 is the electrolysis process with surpluses of renewable energy (e.g., wind, solar), also known as “power-to-gas” (P2G) technology. The gas produced is called green H2 (gH2) due the fact that the electricity consumed to produce it comes from a carbon-free process. However, the electrolysis process requires a high amount of electricity. The power required to generate 1 kg of H2 is approximately 60.6 kWh, assuming an efficiency of 65% of the electrolyzer system, which leads to it being considered a commercially available technology [8,13]. A cleaner version than gH2 is net negative emission H2, which is produced using BECCS technology.
The negative emission H2 is commonly produced via pyrolysis and gasification processes, transforming the biomass chemically into syngas, which is a fuel gas mixture consisting primarily of H2, CO, and CO2. However, the presence of N2 and CO2 in the syngas contributes to the reduction of the lower heating value (LHV), which reduces the heat capacity of the syngas and in turn, limits its use in conventional power plant technologies and future technologies e.g., fuel cells. For example, syngas produced from biomass in a gasifier has a low content of H2 and CH4, which leads to an LHV of 5.6 MJ·(Nm)−3 [14]. An internal combustion engine requires a minimum LHV of 4.6 MJ·m−3 [15] and micro-turbines require 13.04 MJ·m−3 [16]. In the case of H2 utilization on fuel cell applications, H2 purity varies depending on the type of fuel cell used. For example, in the case of proton exchange membrane (PEM) fuel cell applications, H2 concentration in the fuel stream must be almost pure (≤99.97%) in order to avoid damage of the power device, so its use and market is limited to gH2. Meanwhile, the solid oxide fuel cells (SOFC), in addition to operating with H2, can work with different types of fuels such as synthesis gas, natural gas, and methanol [17] due to their higher operating temperatures than PEM fuel cells (100–300 °C). Generally, the SOFC operates in the region of 600 to 1000 °C. This means that high reaction rates can be achieved without expensive catalysts [18], as is currently necessary for lower temperature fuel cells (PEM), and SOFCs are not vulnerable to carbon catalyst poisoning. Among the SOFC types, planar SOFC (PSOFC) and tubular (TSOFC) geometry are the most promising because high-temperature gas-tight seals are eliminated, but one of the major disadvantages of the planar design is the need for gas-tight sealing around the edge of the cell components [18].
For H2 purification by CO2 capture, adsorption technologies have been widely investigated, considered as the alternative for the amine-based absorption carbon capture, and are a nearly mature technology [19]. Solid adsorption capture uses solid sorbents that are easy to control, require low regeneration heat and low capital investment. Adsorption processes can generally be classified into two types i.e., pressure swing adsorption (PSA and temperature swing adsorption (TSA) [20]. For PSA, adsorption is performed at pressures higher than atmospheric whereas TSA is heated by a feed of hot steam. When the adsorption step is performed at atmospheric pressure or lower, PSA is termed VPSA. PSA is commonly used for H2 production [21]. Liu et al. [22] investigated a two-stage VSA/PSA process for CO2 capture and H2 production from an SMR gas mixture. Results indicated the higher performance of PSA over their previous work i.e., single-stage PSA process. Wassie et al. [23] conducted a detailed thermodynamic and economic analysis of novel membrane-assisted gas switching reforming (MA-GSR). Results showed that the MA-GSR process achieved a similar H2 production cost as conventional SMR without CO2 capture.
Several research studies have been carried out to evaluate different biomass-fuelled power plant systems [24]. Zhen et al. [25] investigated the gasification performance of key components, including polyethylene and bamboo of municipal solid waste in a bench-scale fixed bed. It was observed that an optimal temperature for bamboo is 700 °C for the best syngas quality and the highest LHV is 6.22 MJ·Nm−3. Chiang et al. [26] tested gasification by using bamboo chopsticks as the feedstock. The syngas heating value was significantly enhanced by CaO additions, which was related to the higher reaction rate of water–gas shift reaction. Usach et al. [27] studied a farm-based biogas fueled trigeneration system with different cooling pathways. Results indicated that none of the pathways increased the economic viability of the plant due to low electricity prices.
Based on the different challenges to decarbonize and meet environmental targets, the novelty of this paper is the integration of gasification with PSA using activated carbon (AC) to purify the produced H2. Then for generating heat and electricity, a tubular solid oxide fuel cell (TSOFC) is integrated, due to its advantages over other type of fuel cells as described above. SOFC can convert CO and H2, and the high operating temperature allows internal reforming of gaseous fuel and the production of high quality heat for the cogeneration system, which definitely increases the efficiency of the system. The framework of this paper is illustrated as follows: methodology for wood gasification, H2 purification, and fuel cell simulations is presented in Section 2. Then, results of the simulation process and CO2 emission analysis are presented in an integrated system described in Section 3. Finally, a conclusion on the potential of the proposed system is reached.

2. Methodology

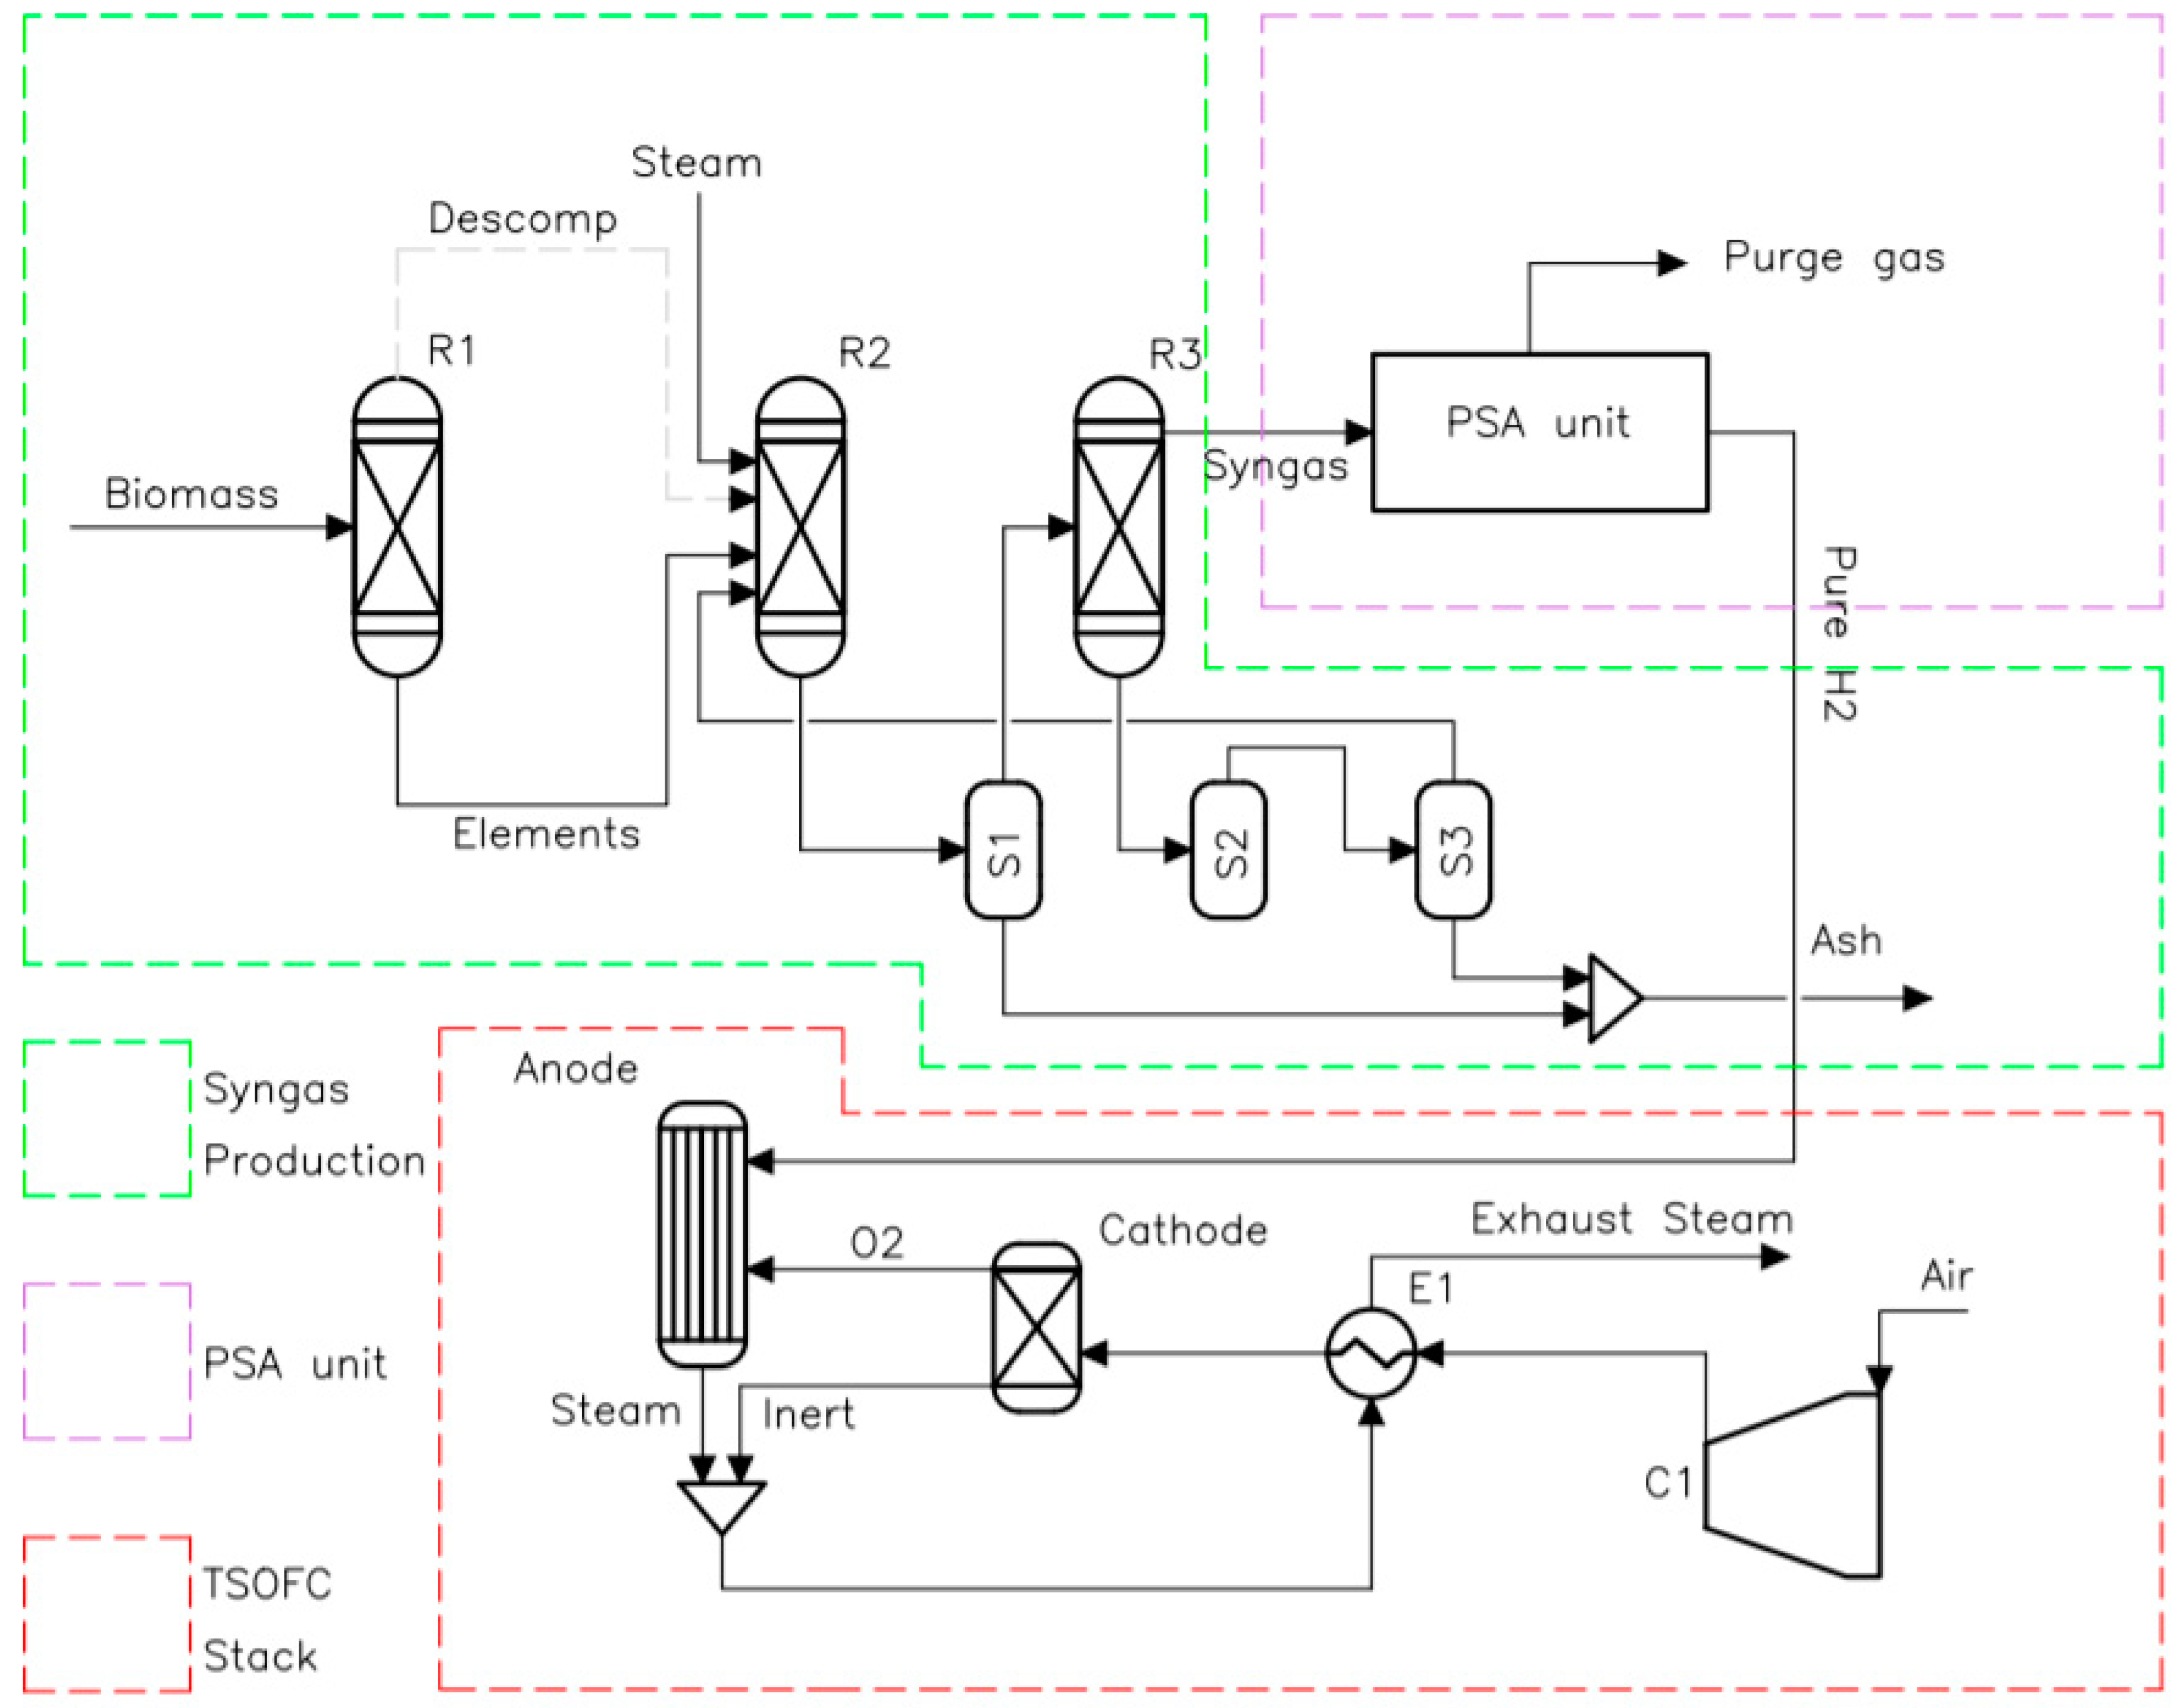
2.1. Process Description

Figure 1 shows the process flow diagram of the integrated bioenergy-fuel cell cogeneration plant simulated in Aspen Plus. This consists of three main processes: (a) syngas production from wood gasification, (b) H2 purification using a PSA unit; and (c) power and heat generation through a tubular solid oxide fuel cell (TSOFC) stack. More details on the modeling of each process are given below.

2.1.1. Syngas Production from Wood Gasification

The syngas production process is modeled using Aspen Plus® software. The modelling process consists of four physicochemical steps: decomposition, pyrolysis, gasification, and separation. The amount of wood that is fed into the gasifier is 132 kg/h. Wood biomass feedstock is a non-conventional material in Aspen library (Aspen Plus V11; Aspen, CO, USA, 2021), which cannot take part in the thermodynamic chemical reactions. Hence, the Ryield reactor (R1) represents decomposition, where biomass is first broken-down into its elemental components e.g., ash, H2, N2, S, O2, C, the composition depends on the type of wood or biomass used. This type of reactor is recommended when both the reaction kinetics and stoichiometry are unknown. Table 1 shows the thermodynamic input data used in the Ryield reactor (R1) model, which is based on the work developed by Islam [28]. The yield percentage is specified into the model using an inbuilt calculation block via Fortran statement. Therefore, the products of this reactor are the percentage elemental composition of the biomass which is subsequently fed into the first Gibbs reactor (R2) where pyrolysis, combustion, and gasification reactions occur, reported in Table 2 according to the reference [26]. When using air as gasifying agent, the ratio of air to biomass is indicated with the parameter equivalence ratio (ER). In this work, steam was used as the gasifying agent to increase the LHV of the syngas. A separator (S1) is placed after the R2 reactor to separate the products into syngas and ash. A second Gibbs reactor (R3) is positioned after the separator to adjust the composition of the synthesis gas. The product is passed to the second separator (S2) where the remaining solids and entrainment gas from the gas synthesis are separated. Finally, a third separator (S3) extracts the remaining entrained gas from the solids, which is returned to R2. The ash from each separator is collected for disposal in landfill.
For the modeling process, the Peng-Robinson with the Boston-Mathias modifications (PR-BM) state equation was selected because of its ability to calculate the thermodynamic properties of the participating fluids at the operating temperature and pressure. Other assumptions considered in the simulation are as follows:
  • The system is isothermal and operates under steady-state conditions without transients.
  • Pressure drops are overlooked. The formation of tars is neglected.
  • The composition of the char is 100% carbon.
  • The process is carried out under atmospheric pressure.
  • Heat losses from the gasifier are ignored.

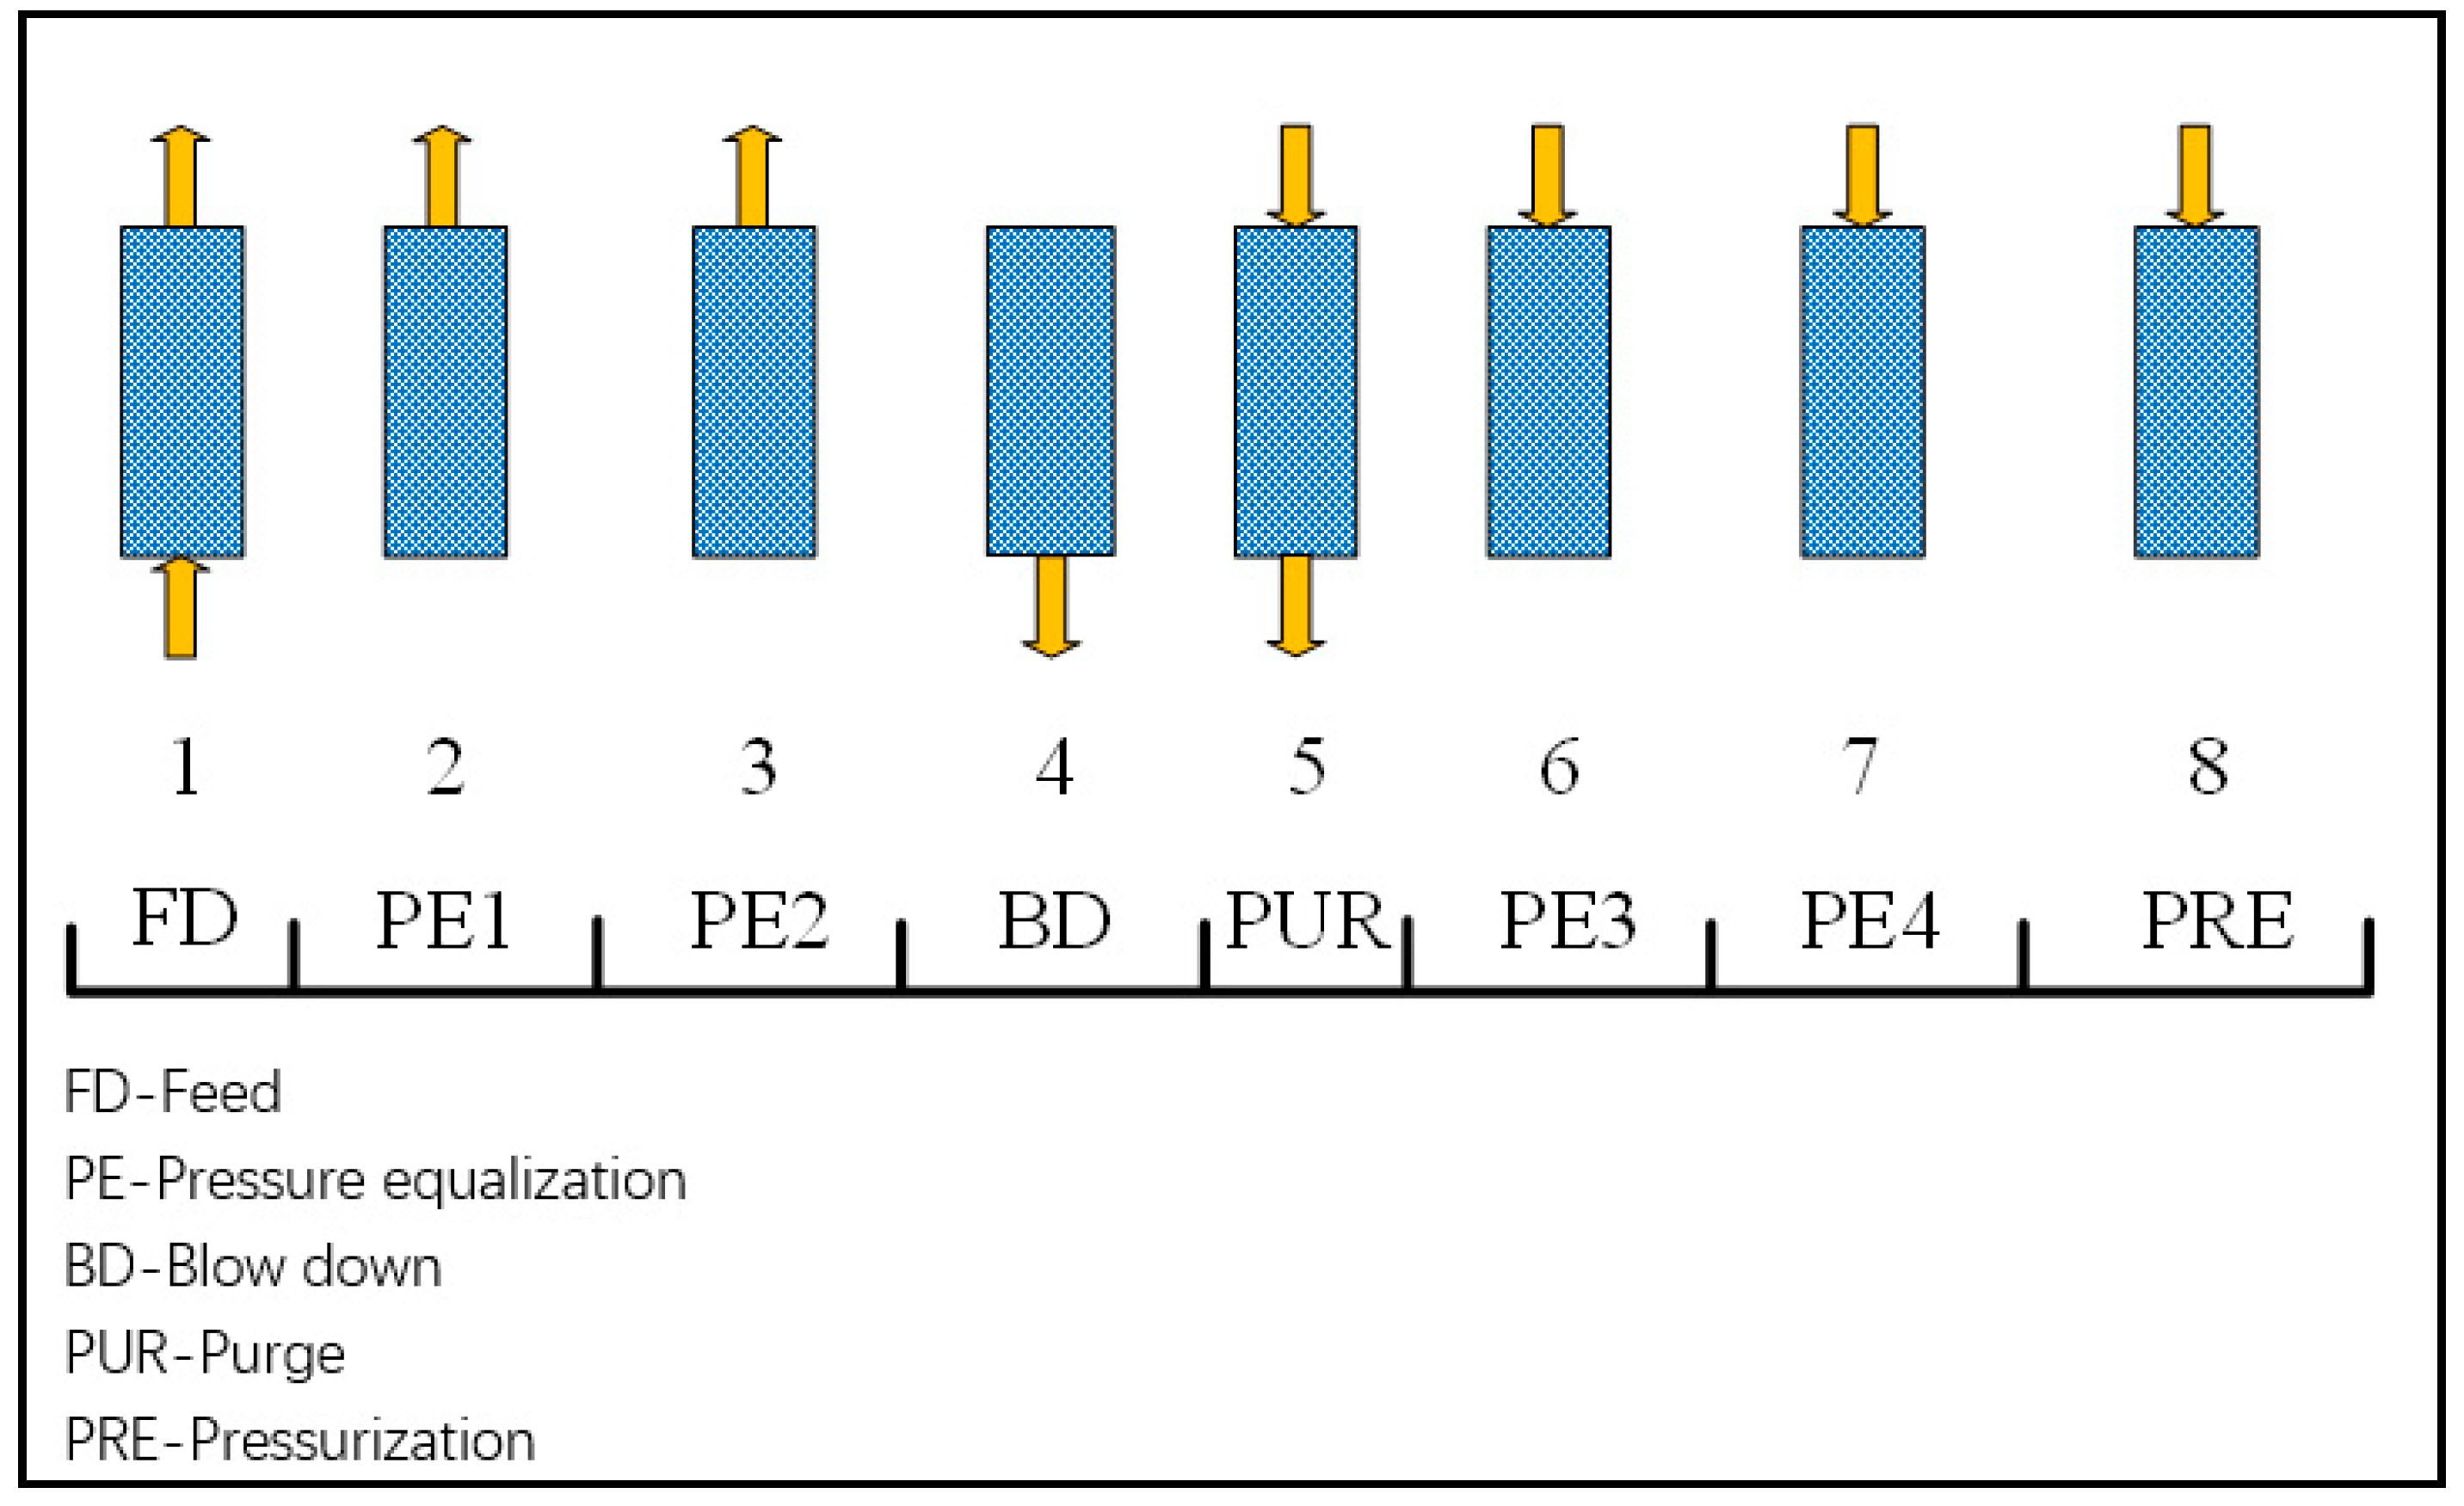
2.1.2. H2 Purification Using a PSA Unit

The syngas contains a high percentage of H2, which contains other components e.g., CO2, CO, N2. Thus, in order to use it in a fuel cell, as mentioned previously, it must be purified, in this work in a PSA. Figure 2 shows the schematic diagram for the cycle sequence used in PSA simulations. For the cycle configuration, two cycles are a sequence of adsorption-regeneration steps, which are important processes for cyclic stability. The room temperature 25 °C is considered for the PSA process. Activated carbon is selected as the adsorbent. The average mass flow rate of H2 is 10.57 kg/h when S/B are 0.3 and 0.4. Equations (1) and (2) describe the Dual Langmuir isotherm and Arrhenius equation used for PSA for H2 purification. Recovery rate and productivity are evaluated based on Equations (3) and (4). More detailed information can be found in reference [29].
q i =   q m a x 1 , i b 1 , i p i 1 + b 1 , i p i + q m a x 1 , i b 1 , i p i 1 + b 1 , i p i
where qi is the adsorption capacity, mol·kg−1; qmax1,i and qmax2,i are the maximum capacity, mol·kg−1; b1,i and b2,i are the adsorption constant, Pa−1. The values for the parameters of AC adsorption are as follows: qmax1 is 1.79 mol·kg−1; b0i is 1.33 × 10⁻⁸ Pa−1.
b i = b 0 i exp ( H a d s , i R T ) b i = b 0 i exp ( H a d s , i R T )
where b0i is the pre-exponential factor and ΔHads,i is the adsorption enthalpy which is 5926 J·mol−1.
R e c o v e r y   r a t e ( % ) = m o l H 2 ,   f e e d m o l H 2 , p r o m o l H 2 ,   f e e d
P r o d u c t i v i t y   ( m o l H 2 / k g s ) = m o l H 2 ,   f e e d m o l H 2 , p r o k g A C ,   f e e d t c y c l e

2.1.3. Power and Heat Generation through a TSOFC

The model simulation of the TSOFC stack process was based on the work developed by Tanim and coworkers [30], who assumed the following considerations: zero-dimensional; isothermal and steady state operation; all working fluids are treated as ideal gases; pressure drops are neglected. The zero-dimensional model generally assumes that chemical and thermodynamic equilibrium is present at the output streams [31].
Each TSOFC unit consists of two main components: one cathode and one anode. In general, a compressed and preheated air stream is fed to the cathode, which separates around 90% of the O2 contained in the air by an electrochemical process. Then, the purified O2 stream is fed to the anode, where it reacts with the H2, generating power and steam; this last is fed to a heat exchanger for air preheating. Since the steam is still hot (128 °C), it can be used for other heating purposes. The ANODE is simulated as an equilibrium Gibbs reactor with an operating temperature and pressure equal to 3 bar and 850 °C, respectively. The CATHODE is also simulated as an equilibrium Gibbs reactor but with the difference that includes a Fortran routine to calculate the actual operating voltage and the gross electric power of the TSOFC. The actual operating voltage of the cell ( V c ) can be determined as follows [30]:
V c = V N   ( n o h m + n a c t + n c o n )
V N =   Δ g ¯ f 2 F + R g T avg 2 F l n P H 2 P H 2 0.5 P H 2 O
where V N is the Nerst’s voltage, in Volts; Δ g ¯ f is the molar Gibbs free energy of formation in J/mol; F is the Faraday constant (96,485 C/mol); T avg is the average temperature of the TSOFC inlet and outlet streams (K); P i is the partial pressure (bar) of the gaseous species. The variables n o h m , n a c t , and n c o n are the ohmic, activation, and concentration losses in the cell, respectively (V). In this work, the n o h m and n a c t were calculated using the expressions proposed by Song and coworkers [32], and the geometry and materials properties published by Siemens-Westinghouse [30,32,33], resulting in values equal to 0.089 V and 0.18 V, respectively. n c o n is neglected because the diffusion at high operating temperature in the TSOFC is a very efficient process [34]. In turn, the gross electric power ( P e l ), defined in Watts, is calculated as follows [18]:
P e l = 4 F n O 2 V c
where n O 2 corresponds to the moles of oxygen consumption in the fuel cell. Finally, the gross electrical efficiency of the TSOFC can be expressed as follows [30]:
η e l , g r o s s =   P e l , A C η ˙ fuel L H V fuel
where   P e l , A C is the electrical AC power (W) after converting from DC power. In this work an inverter efficiency factor equal to 92% is used [35]; η ˙ fuel   is the mass flow rate of H2 in kg/s and L H V fuel is the lower heating value of H2 (120 kJ/kg).

3. Results and Discussion

The model of the gasifier process is validated against the experimental and simulation results reported by Islam [28] to provide confidence in this work. Table 3 presents the comparison results of the syngas thermodynamics properties obtained with the reference data in Table 1. It is observed that the composition of the CO and CO2, as well as LHV, are in the range between two data sets, which is an improvement from the simulation results of Islam [28]. Discrepancies between the experimental and this simulation results are mostly due to the assumption of chemical equilibrium, which yields the maximum attainable component conversions. Table 3 also shows in brackets the sum squared deviation (RSS) used to estimate the accuracy of the simulation results [36]. The syngas in this work contains 26.64% of H2 and 1.18% of CH4.
Due to the low LHV value of the syngas when using air as the gasifying agent presented in Table 4 and Table 5 shows the results of the syngas thermodynamics properties where steam to biomass (S/B) ratio is varied. As seen in Table 4, the maximum H2 concentration is reached for a S/B ratio equal to 0.4, corresponding to a H2 composition equal to 49.09% mol, with an LHV value of 9.39 MJ/Nm3. Additionally, the highest LHV corresponds to a S/B ratio equal to 0.3 with 10.12 MJ/Nm3. The carbon conversion efficiency increases as a function of the S/B ratio due to more available oxidant. Mass and energy balance is presented in Appendix A.
As in Table 4 and Table 5 shows the gas composition, after H2 is removed, at different S/B ratios. The purity of the H2 obtained is 99.99% and the rest of the gas consists basically of CO, CO2, and H2O, where CO is the most abundant component around 51.8–58.9%. Although the increment of the ratio S/B reduces the amount of N2, and increases the content of H2O, it is important to note that the work duty required for H2 separation in the PSA process decreases from 7.02 kW at S/B = 0.3 to 6.98 kW at S/B = 0.4 when flow rates of hydrogen are 10.57 kg/h and 10.54 kg/h, respectively.
Table 6 shows the results of the fuel cell TSOFC system. The overall electrochemical reaction in the anode took place at 3 bar and 850 °C, with an H2 feed of 0.0029 kg/s that reacted stoichiometrically with O2 to produce 1.11 V at an average temperature of 425 °C; however, activation and ohmic losses (anode, cathode, electrolyte, and interconnector) were discounted, leaving a cell voltage of 0.831 V. The tubular cell produced an AC power output of 217.1 kW with a net electrical efficiency of 58.2%, and as byproducts steam (0.0272 kg/s) and usable heat (100 kW). After comparing this work with the Mitsubishi Hitachi Power Systems, where the cell voltage changed by 86.76% and 8.93 % in net electrical efficiency, the Mitsubishi showed lower cell voltage due to high cell packing that allowed a higher current density. When using the Siemens–Westinghouse system, the change was 26.59% for voltage and 2.06% in efficiency; the voltage change is mainly due to the level of hydrogen purity since H2 is produced by hydrocarbon reforming. Nonetheless, Siemens–Westinghouse’s cell is integrated with a gas turbine that generates additional power and improves efficiency.
The 132 kg/h of biomass produces 10.57 kg/h or 0.0029 kg/s of H2 in the gasifier, after the PSA, which is fed to the fuel cell. The fuel cell generates 217 kW of electricity and the exhaust gas so that fuel cell has enough heat to generates 40 kg/h of steam needed in the gasifier. In order to complete 60 kg/h, 0.8 kg/h of natural gas is needed to burn as supplementary firing, as shown in Table 6.
Table 7 summarizes the key information of the integrated system (gasification, PSA, and fuel cell) used to estimate the efficiency of the integrated system (gasification process, PSA, and TSOFC).
The efficiency of the integrated system is estimated based on the information presented in Table 7 by using the following equation:
η e n =   W p m s   L H V H 2 + m N A   L H V N G 100 %
where η e n is the net efficiency of the integrated system in %; W p is the net power output generated in the fuel cell TSOFC in kW (This power considers); m s   is the mass flow rate of the wood biomass in kg/s−1; LHVH2 is low heating value of biomass in kJ/kg−1; m N A   is the mass flow rate of the supplementary natural gas in kg/s−1, LHVNG is low heating value of natural gas in kJ/kg−1.
The efficiency of the integrated system is estimated as 27.2%, a value lower than that of a gas turbine with the same capacity whose efficiency is around 33.1% [38]. Another alternative method for generating power with biomass is a microturbine. However, according to the manufacturer Capstone, the minimum limit of LHV established to be used in the Capstone C200 micro-turbine is 13.04 MJ/Nm−3, but the syngas generated in this study is around 10.12 MJ/Nm3 at S/B = 3. Then, it would be necessary to mix with different percentages of natural gas or liquid petroleum gas (LPG) in order to improve the LHV of the syngas; this could be a disadvantage for rural and remote areas because of the unavailability of these fossil fuels. Nonetheless, the use of fossil fuels would increase CO2 content, which is an advantage for fuel cells. In addition, if the steam generated in the fuel cell could be used to generate power in a small steam turbine or for thermal heating that could improve the efficiency of the system presented in this work even more.
Total CO2 emitted by the integrated system presented in this work is estimated considering the CO2 emitted and the CO2 sequestered by wood. The CO2 sequestered by wood is estimated by the simple Equation (10):
CO 2   per   tree = [ Tree   mass × 0.65 × 0.50 × 1.20 × 3.67 ] / [ age   of   biomass ]
where CO2 per tree is the sequestered CO2 in kg/h; tree mass is the mass flow of fresh biomass in kg/h; 65% is the percentage of dry mass; 50% is the percentage of carbon. As 20% of tree biomass is below ground level in roots, the equation is multiplied by a factor of 120%. Finally, the equation is multiplied by 3.67, which is the ratio of CO2 to C: 44/12 = 3.67.
Considering a 12-year old tree, total annual mass of tree is around 1,056,000 kg per year (132 kg/h, considering 8000 h of operation during the year). Using Equation (10), total CO2 absorbed per year is 125,954 kg/y. CO2 generated in the gasifier per year is 283,360 kg/y. Total net CO2 emitted by the system is 157,406 kg/y or 19.67 kg/h, and the CO2 intensity is 98.3 kgCO2/MWh. Compared with a NGCC without and with carbon capture, their carbon intensities are around 331 kgCO2/MWh and 40 kgCO2/MWh, respectively. An economic analysis is needed to compare the proposed integrated system with an NGCC with CO2 capture. However, this is beyond the scope of this work and will be presented as future work.

4. Conclusions

This study demonstrates that it is possible to combine biomass gasification and fuel cell technologies as an alternative option to generate clean electricity for remote areas. This concept was tested by using wood to generate a H2-rich gas in a gasifier. The integrated system could generate a net power of 197.92 kW and 60 kg/h of steam (used in the gasifier) when using 132 kg/h of wood. The net efficiency of the integrated system, considering only the electric power generated in the TSOFC, is lower than a gas turbine with the same capacity: 27.2% against 33.1%.
The carbon intensity of the system presented in this work is 98.3 kgCO2/MWh compared with those of NGCC without and with CO2 capture, i.e., 331 kgCO2/MWh and 40 kgCO2/MWh, respectively. If CCUS is integrated in the system, power with negative carbon emission is possible.
There is great potential for cogeneration with low carbon emission by using wood biomass in rural areas of developing countries. This is an alternative technology for places where biomass is abundant and where it is difficult to get electricity from the grid due to geographical location limits.

Author Contributions

Conceptualization, A.G.-D.; methodology, A.G.-D., C.F.-P., P.D.-H., M.O.G.-D.; software, A.G.-D., C.F.-P., L.J., and J.C.S.L.d.G.; validation, C.F.-P., L.J., J.C.S.L.d.G.; formal analysis, A.G.-D., C.F.-P., L.J.; investigation, J.C.S.L.d.G.; data curation, A.G.-D., C.F.-P., and J.C.S.L.d.G.; writing—original draft preparation, A.G.-D., C.F.-P., L.J., P.D.-H.; M.O.G.-D.; writing—review and editing, A.G.-D., C.F.-P., L.J., P.D.-H.; M.O.G.-D.; visualization, M.O.G.-D.; supervision, A.G.-D. and C.F.-P.; project administration, C.F.-P.; funding acquisition, C.F.-P. All authors have read and agreed to the published version of the manuscript.

Funding

This research received no external funding.

Institutional Review Board Statement

Not applicable.

Informed Consent Statement

Not applicable.

Data Availability Statement

Not applicable.

Acknowledgments

The authors would like to thank Sufyan Aslam Mukadam for his enthusiastic support in the literature search related to biomass gasification and fuel cells. González-Diaz would like to thank the National Institute of Electricity for the support. Font-Palma was supported by the Royal Academy of Engineering under the Leverhulme Trust Research Fellowship scheme (LTRF1920\16\18).

Conflicts of Interest

The authors declare no conflict of interest.

Nomenclature

ACActivated carbon
BECCBioenergy with carbon capture and sequestration
CBCCoastal blue carbon
CCScarbon capture and storage
CCUScarbon capture use and storage
DACDirect air capture
ERequivalence ratio
GHGgreenhouse gas
HHVhigher heating value
IEAInternational Energy Agency
LHVLower heating value
LPGLiquid petroleum gas
MA-GSRmembrane-assisted gas switching reforming
NETnegative emissions technologies
NGCCCombined cycle power plant
NGNatural gas
PEMproton exchange membrane
SMRsteam methane reforming
SOFTsolid oxide fuel cells
PSApressure swing adsorption
PSOFCplanar SOFC
S/Bsteam to biomass
TCRSTerrestrial Carbon Removal and Sequestration
TSAtemperature swing adsorption
TSOFCtubular solid oxide fuel cell
VPSAvacuum pressure swing adsorption

Appendix A

Mass balance of gasifier
Figure A1. Aspen plus process diagram.
Sustainability 13 03232 g0a1
Table A1. Mass balance, temperature and pressure of the streams of the gasifier at B/S = 0.3.
Stream NameUnitsASHBIOMASSELEMENTSGASGASIFOUTS2S4STEAM
TemperatureK1100.1298.2298.21100.11100.2298.21123.2423.2
Pressureatm1.041.001.041.041.041.041.041.04
Mass Flowskg/hr2.8132.0132.0189.5192.3132.0189.560.3
Mole Fractions
H2 0.63790.48990.48990.63790.52400.0000
O2 0.21100.00000.00000.21100.00000.0000
N2 0.00060.00030.00030.00060.00030.0000
H2O 0.14890.12130.12130.14890.11541.0000
CO 0.00000.24050.24050.00000.29840.0000
CO2 0.00000.10710.10710.00000.06030.0000
CH4 0.00000.03990.03990.00000.00080.0000
H2S 0.00000.00090.00090.00000.00080.0000
H3N 0.00000.00000.00000.00000.00000.0000
S 0.00160.00000.00000.00160.00000.0000
C 0.00000.00000.00000.00000.00000.0000
CL2 0.00000.00000.00000.00000.00000.0000
HCL 0.00000.00000.00000.00000.00000.0000
Table A2. Mass balance, temperature and pressure of the streams of the gasifier at B/S = 0.4.
Stream NameUnitsASHBAMBOOELEMENTSGASGASIFOUTS2S4STEAM
TemperatureK1100.1298.2298.21100.11100.2298.21123.2423.2
Pressureatm1.041.001.041.041.041.041.041.04
Mass Flowskg/hr0.51132.00132.00211.82212.34132.00211.8280.34
Mole Fractions
H2 0.63790.49090.49090.63790.50840.0000
O2 0.21100.00000.00000.21100.00000.0000
N2 0.00060.00030.00030.00060.00030.0000
H2O 0.14890.14810.14810.14890.15031.0000
CO 0.00000.21430.21430.00000.26730.0000
CO2 0.00000.11630.11630.00000.07250.0000
CH4 0.00000.02930.02930.00000.00050.0000
H2S 0.00000.00080.00080.00000.00070.0000
H3N 0.00000.00000.00000.00000.00000.0000
S 0.00160.00000.00000.00160.00000.0000
C 0.00000.00000.00000.00000.00000.0000
CL2 0.00000.00000.00000.00000.00000.0000
HCL 0.00000.00000.00000.00000.00000.0000
Figure A2. (a) Schematic mass balance for the TSOFC and (b) Schematic energy (enthalpy) balance for the TSOFC.
Sustainability 13 03232 g0a2
Table A3. Values for the mass and energy balance of TSOFC.
ItemUnitInlet
Air mass flowkg/s0.1133
Air pressurebar2.3
Air temperature°C320
Air enthalpy flowJ/s25,073.6
H2 mass flowkg/s0.0029
H2 pressurebar2
H2 temperature°C105
H2 enthalpy flowJ/s138.215
Gas composition
O2Mole fraction0.019
N2Mole fraction0.658
H2OMole fraction0.322
Flue gas flow ratekg/s0.116
Flue gas pressureBar2
Flue gas temperature°C355.54
Steam producedkg/h45
Steam pressurebar3
Temperature°C300
Power pumpkW0.0084

References

  1. National Academies of Sciences, E. Negative Emissions Technologies and Reliable Sequestration: A Research Agenda; National Academies Press: Washington, DC, USA, 2018. [Google Scholar]
  2. Meyer, L.; Brinkman, S.; van Kesteren, L.; Leprince-Ringuet, N.; van Boxmeer, F. Contribution of Working Groups I, II and III to the Fifth Assessment Report of the Intergovernmental Panel on Climate Change; Synthesis Report: Geneva, Switzerland, 2014; p. 169. [Google Scholar]
  3. IEA. Energy Technology Perspectives 2020; IEA Webstore: London, UK, 2020. [Google Scholar]
  4. Stafford, W.; Lotter, A.; Brent, A.; von Maltitz, G. Biofuels Technology: A Look Forward; United Nations World Institute for Development Economics Research: Helsinki, Finland, 2017. [Google Scholar]
  5. Rios, M.; Kaltschmitt, M. Bioenergy potential in Mexico—Status and perspectives on a high spatial distribution. Biomass Convers. Biorefinery 2013, 3, 239–254. [Google Scholar] [CrossRef]
  6. Aldana, H.; Lozano, F.J.; Acevedo, J. Evaluating the potential for producing energy from agricultural residues in México using MILP optimization. Biomass Bioenergy 2014, 67, 372–389. [Google Scholar] [CrossRef]
  7. IRENA. Hydrogen from Renewable Power: Technology Outlook for the Energy Transition; International Renewable Energy Agency: Abu Dhabi, United Arab Emirates, 2018. [Google Scholar]
  8. IRENA. Hydrogen: A Renewable Energy Perspective; International Renewable Energy Agency: Abu Dhabi, United Arab Emirates, 2019. [Google Scholar]
  9. IRENA. Global Energy Transformation: A Roadmap to 2050, 2019th; International Renewable Energy Agency: Abu Dhabi, United Arab Emirates, 2019. [Google Scholar]
  10. CCC. Hydrogen in a Low-Carbon Economy; Committee on Climate Change: London, UK, 2018. [Google Scholar]
  11. Díaz-Herrera, P.R.; Ascanio, G.; Romero-Martínez, A.; Alcaraz-Calderón, A.M.; González-Díaz, A. Theoretical comparison between post-combustion carbon capture technology and the use of blue and green H2 in existing natural gas combined cycles as CO2 mitigation strategies: A study under the context of mexican clean energy regulation. Int. J. Hydrogen Energy 2021, 46, 2729–2754. [Google Scholar] [CrossRef]
  12. IEAGHG. Techno-Economic Evaluation of SMR Based Standalone (Merchant) Hydrogen Plant with CCS; IEAGHG Document Manager: Cheltenham, UK, 2017. [Google Scholar]
  13. GE. General Electric (GE): Power to Gas: Hydrogen For Power Generation; GE Document Number: GEA33861; GE: Boston, MA, USA, 2019. [Google Scholar]
  14. Programa Especial Para el Aprovechamiento de Energías Renovables. 2014. Available online: https://www.dof.gob.mx/nota_detalle.php?codigo=5342501&fecha=28/04/2014 (accessed on 1 March 2021).
  15. Edenhofer, O. Bioenergy. In IPCC Special Report on Renewables Energy Sources and Climate Change Mitigation; Cambridge University Press: Cambridge, UK, 2011. [Google Scholar]
  16. SEMARNAT-INECC. Mexico’s Climate Change Mid-Century Strategy; Ministry of Environment and Natural Resources (SEMARNAT) and National Institute of Ecology and Climate Change (INECC): Veracruz, Mexico, 2016. [Google Scholar]
  17. Santin, M.; Traverso, A.; Magistri, L.; Massardo, A. Thermoeconomic analysis of SOFC-GT hybrid systems fed by liquid fuels. Energy 2010, 35, 1077–1083. [Google Scholar] [CrossRef]
  18. Larminie, J.; Dicks, A. Fuel Cell Systems Explained, 2nd ed.; John Wiley & Sons Ltd.: Hoboken, NJ, USA, 2003. [Google Scholar]
  19. Jiang, L.; Gonzalez-Diaz, A.; Ling-Chin, J.; Roskilly, A.; Smallbone, A. Post-combustion CO2 capture from a natural gas combined cycle power plant using activated carbon adsorption. Appl. Energy 2019, 245, 1–15. [Google Scholar] [CrossRef]
  20. Jiang, L.; Roskilly, A.; Wang, R. Performance exploration of temperature swing adsorption technology for carbon dioxide capture. Energy Convers. Manag. 2018, 165, 396–404. [Google Scholar] [CrossRef] [Green Version]
  21. Ye, F.; Ma, S.; Tong, L.; Xiao, J.; Bénard, P.; Chahine, R. Artificial neural network based optimization for hydrogen purification performance of pressure swing adsorption. Int. J. Hydrogen Energy 2019, 44, 5334–5344. [Google Scholar] [CrossRef]
  22. Liu, B.; Yu, X.; Shi, W.; Shen, Y.; Zhang, D.; Tang, Z. Two-stage VSA/PSA for capturing carbon dioxide (CO2) and producing hydrogen (H2) from steam-methane reforming gas. Int. J. Hydrogen Energy 2020, 45, 24870–24882. [Google Scholar] [CrossRef]
  23. Wassie, S.A.; Cloete, S.; Spallina, V.; Gallucci, F.; Amini, S.; Annaland, M.V.S. Techno-economic assessment of membrane-assisted gas switching reforming for pure H2 production with CO2 capture. Int. J. Greenh. Gas Control. 2018, 72, 163–174. [Google Scholar] [CrossRef]
  24. Murugan, S.; Horák, B. A review of micro combined heat and power systems for residential applications. Renew. Sustain. Energy Rev. 2016, 64, 144–162. [Google Scholar] [CrossRef]
  25. Zheng, X.; Chen, C.; Ying, Z.; Wang, B. Experimental study on gasification performance of bamboo and PE from municipal solid waste in a bench-scale fixed bed reactor. Energy Convers. Manag. 2016, 117, 393–399. [Google Scholar] [CrossRef]
  26. Chiang, K.-Y.; Chen, Y.-S.; Tsai, W.-S.; Lu, C.-H.; Chien, K.-L. Effect of calcium based catalyst on production of synthesis gas in gasification of waste bamboo chopsticks. Int. J. Hydrogen Energy 2012, 37, 13737–13745. [Google Scholar] [CrossRef]
  27. Usack, J.; Van Doren, L.G.; Posmanik, R.; Tester, J.; Angenent, L. Harnessing anaerobic digestion for combined cooling, heat, and power on dairy farms: An environmental life cycle and techno-economic assessment of added cooling pathways. J. Dairy Sci. 2019, 102, 3630–3645. [Google Scholar] [CrossRef] [PubMed] [Green Version]
  28. Islam, M.W. Effect of different gasifying agents (steam, H2O2, oxygen, CO2, and air) on gasification parameters. Int. J. Hydrogen Energy 2020, 45, 31760–31774. [Google Scholar] [CrossRef]
  29. Brea, P.; Delgado, J.; Águeda, V.I.; Uguina, M.A. Comparison between MOF UTSA-16 and BPL activated carbon in hydrogen purification by PSA. Chem. Eng. J. 2019, 355, 279–289. [Google Scholar] [CrossRef]
  30. Tanim, T.; Bayless, D.J.; Trembly, J.P. Modeling of a 5 kWe tubular solid oxide fuel cell based system operating on desulfurized JP-8 fuel for auxiliary and mobile power applications. J. Power Sources 2013, 221, 387–396. [Google Scholar] [CrossRef]
  31. de Souza-Santos, M.L. Solid Fuels Combustion and Gasification; Taylor & Francis Group: Abingdon, UK, 2010. [Google Scholar]
  32. Song, T.W.; Sohn, J.L.; Kim, J.H.; Kim, T.S.; Ro, S.T.; Suzuki, K. Performance analysis of a tubular solid oxide fuel cell/micro gas turbine hybrid power system based on a quasi-two dimensional model. J. Power Sources 2005, 142, 30–42. [Google Scholar] [CrossRef]
  33. George, R.A. Status of tubular SOFC field unit demonstrations. J. Power Sources 2000, 86, 134–139. [Google Scholar] [CrossRef]
  34. Costamagna, P.; Magistri, L.; Massardo, A. Design and part-load performance of a hybrid system based on a solid oxide fuel cell reactor and a micro gas turbine. J. Power Sources 2001, 96, 352–368. [Google Scholar] [CrossRef]
  35. Doherty, W.; Reynolds, A.; Kennedy, D. Computer simulation of a biomass gasification-solid oxide fuel cell power system using Aspen Plus. Energy 2010, 35, 4545–4555. [Google Scholar] [CrossRef] [Green Version]
  36. Nikoo, M.B.; Mahinpey, N. Simulation of biomass gasification in fluidized bed reactor using ASPEN PLUS. Biomass Bioenergy 2008, 32, 1245–1254. [Google Scholar] [CrossRef]
  37. Kobayashi, Y.; Tomida, K.; Nishiura, M.; Hiwatashi, K.; Kishizawa, H. Development of Next-Generation Large-Scale SOFC toward Realization of a Hydrogen Society. Mitsubishi Heavy Ind. Tech. Rev. 2015, 52, 111. [Google Scholar]
  38. Gas Turbine World 2018, GTW Handbook; Pequot Publishing Inc.: Fairfield, CT, USA, 2018; Volume 30.
Figure 1. Process flow diagram of the integrated bioenergy-fuel cell cogeneration plant simulated in Aspen Plus.
Sustainability 13 03232 g001
Figure 2. Cycle sequence used in the pressure swing adsorption (PSA) simulations.
Sustainability 13 03232 g002
Table 1. Thermodynamic input data used in the Ryield reactor model. Capacity of the gasifier is 132 kg/h of biomass.
Ultimate Analysis (wt.%, Dry)Wood Chip (Islam, 2020) [28]
Ash0.450
Carbon52.463
Hydrogen7.466
Nitrogen0.100
Sulfur0.299
Oxygen39.223
Proximate analysis (wt.%, dry)
Fixed carbon17.15
Volatile matter82.4
Ash0.45
Moisture13.48
Low heating value (LHV) (MJ/kg)19.54
ER0.25
Temperature (°C)827
Table 2. Reactions in each step of biomass gasification.
Pyrolysisendothermic stageBiomass ↔ H2 + CO + CO2 + CH4 + H2O(g) + Tar + Char
Oxidationexothermic stageC + O2 → CO2 Char combustion
C + ½O2 → CO Partial oxidation
H2 + ½O2 → H2O Hydrogen combustion
Reductionendothermic stageC + CO2 ↔ 2CO Boudouard reaction
C + H2O ↔ CO + H2 Reforming of the Char
CO + H2O ↔ CO2 + H2 Water shift reaction
C + 2H2 ↔ CH4 Methanation
Table 3. Comparison results of the syngas thermodynamics properties obtained in this work with the reference data.
Wood ChipReference (Islam, 2020) [28]
Experimental
Reference (Islam, 2020) [28]
Aspen Plus Simulation (RSS) c
This Work a
Aspen Plus Simulation (RSS) c
H2 (% mol)813 (0.39)26.64 (5.43)
N2 (% mol)N.A. bN.A. b36.10
H2O (% mol)N.A. bN.A. b5.90
CO (% mol)19.522.5 (0.02)21.52 (0.01)
CO2 (% mol)6.511 (0.48)8.57 (0.10)
CH4 (% mol)411 (3.06)1.18 (0.49)
Low heating value (LHV) (MJ/Nm3)4.938.48 (0.52)6.24 (0.07)
Carbon conversion efficiencyN.A. bN.A. b0.935
a Thermodynamic method: PR-BM, Gasifier: RGibbs block with Restricted chemical equilibrium (temperature approach for the entire system −150 °C). b N.A. = not available, c RSS = sum squared deviation.
Table 4. Syngas thermodynamics properties as a function of the S/B ratio.
S/B Ratio0.30.40.6
H2 mol%48.9949.0947.85
N2 mol%0.030.030.02
H2O mol%12.1314.8121.73
CO mol%24.0521.4315.94
CO2 mol%10.7111.6313.01
CH4 mol%3.992.931.38
LHV (MJ/Nm3)10.129.397.96
Carbon conversion efficiency0.9611.01.0
Table 5. Simulation results of the PSA at different S/B ratios, and H2 purity = 99.99 mol%.
PSA ResultsUnitsS/B
0.40.3
Composition in the Purge Gas
H2mass fraction0.07090.0744
O2mass fraction9.747 × 10−195.499 × 10⁻¹⁹
N2mass fraction0.0005370.000601
H2Omass fraction0.18740.1464
COmass fraction0.51810.5888
CO2mass fraction0.22080.1869
CH4mass fraction0.000550.00089
H2Smass fraction0.00170.0019
H3Nmass fraction2.108 × 10−62.354 × 10⁻⁶
Smass fraction8.459 × 10−129.176 × 10⁻¹²
Flow rate of H2kg/h10.5710.54
Work capacity kJ/molH24.764.80
H2 recovery%75.174.3
Work capacitykW6.987.02
Table 6. Simulation results of the fuel cell tubular solid oxide fuel cell (TSOFC) system.
TSOFC ResultsUnitThis WorkMitsubishi Hitachi Power Systems MEGAMIE [37]Siemens–Westinghouse [32,33]
Cell operating temperature°C850850850
Cell voltageV0.8310.110.61
AC Power outputkW217.1210220
Net electrical efficiency%58.253.057.0
Power consumption of air compressorkW12.12--
Discharge air pressure bar2.3--
Flue gas mass flowkg/s0.1165N.A.N.A.
H2 fuel consumptionkg/s0.0029N.A.N.A.
Supplementary fuelkg/h0.80
Steam generatedkg/h60
N.A. = not available.
Table 7. Summary of key information of the integrated system.
ConceptUnitAmount
Biomass mass flowkg/h132
LHV of biomasskJ/kg19,540
LHV natural gaskJ/kg50,047
Supplementary gaskg/h0.8
H2 producedkg/h10.57
AC gross power output kW217.1
Total work duty required for H2 separation kW6.98
Total word required to pump the water for steam in the fuel cellkW0.084
Power consumption of air compressorkW12.12
Net power kW197.92
Net efficiency%27.20
CO2 generated in the gasifierkg/h35.41
Publisher’s Note: MDPI stays neutral with regard to jurisdictional claims in published maps and institutional affiliations.

