1. Introduction
The current socioeconomic and health context has shown the need to advance in the development of skills and knowledge that allow the formation of statistically and probability literate citizens, capable of “derive meaningful information from data, the ability to read, work with, analyze and argue with data, and understand what data mean, including how to read charts appropriately, draw correct conclusions from data, and recognize when data are being used in misleading or inappropriate ways” [
1] (p. 5).
This article assumes that it is not only about having informed citizens but that, from decision making based on quantitative evidence, they can change their way of acting, in pursuit of a sustainable present and future. From this perspective and, beyond the current context, Stochastic Education [
2] takes on special importance, positioning itself as a tool to promote the development of competences, capacities and attitudes that generate changes in the behavior of citizens of the 21st century.
Undoubtedly, Stochastic Education is a fertile ground to help raise awareness, understand, reflect and act around one of the most compelling challenges in today’s world: Education for Sustainable Development (ESD). From this position, Vásquez [
3,
4], Vásquez and García-Alonso [
5] and Vásquez and Alsina [
6] propose Stochastic Education to Educate for Sustainability, which seeks to promote that everybody can develop a literate citizen in statistics and probability, in addition to acquiring knowledge, skills, values and attitudes with which they can contribute to sustainable development. From this point of view, a critical background review has been carried out on relevant aspects for our research, such as the analysis of sustainability attitudes [
7]. In this sense, it should be noted that, according to these authors, clear and widely shared definitions of attitudes towards ESD have not yet been developed, and psychosocial variables have emerged as an important component in the literature. Furthermore, there is no agreement on the use of a common tool that measures SD and environmental attitudes, due to the different theoretical backgrounds underlying the various approaches [
8].
Therefore, if we want to have literate citizens following this approach, motivation and the ability to understand, interpret, critically evaluate and, when appropriate, express opinions regarding quantitative and statistical messages and information, must be developed from an early age. At the same time, arguments based on data, or issues related to uncertainty and risk in the real world, should be promoted, leading citizens to make decisions which create a more sustainable world. This becomes even more important if we consider the words issued, in 2020, by the Secretary-General of the United Nations (UN), who explicitly points out that “as the United Nations marks its seventy-fifth anniversary and the world deploys data to face a common challenge, let us use World Statistics Day to spotlight the role of statistics in advancing sustainable development for all” [
9].
To train literate citizens from this broad perspective, we must (re) think the school and the teaching staff functions, who according to Calero, Mayoral, Ull and Vilches [
10], are the responsible agents for promoting this transformation. In this sense, UNESCO [
11] (p. 7) stresses that “it is not only to integrate content such as climate change, poverty and sustainable consumption [..] but also to create interactive and student-centered teaching and learning contexts.”
This article assumes that teachers have not been trained to design activities that, from different subjects, promote the Sustainable Development Goals (SDGs) in the classrooms. Even more, if we consider that the UNESCO [
12] report on progress in ESD and education for global citizenship shows the complexity of incorporating ESD into educational practice. According to UNESCO [
11], implementing SDGs learning through ESD requires joint and articulated work in five fields of action: (a) integrating ESD into public policies, strategies, and educational programs; (b) integrating ESD into curricula and textbooks; (c) integrating ESD into teacher training; (d) teaching ESD in the classroom and in other learning settings; and (e) evaluating ESD learning outcomes and the quality of ESD programs.
From our perspective of mathematics teacher trainers, and within the framework of the Stochastic Education Approach to Educating for Sustainability, we focus on the opportunities offered by mathematics textbooks for the inclusion of education for sustainability in the classroom. To do this, we ask ourselves what learning opportunities do stochastic tasks present in Primary Education textbooks offer to educate for sustainability? More specifically, we posed the following three research questions: (a) the current textbooks using in Chile, when they develop tools about statistics and probability, do they address problems of concern worldwide?, that is, do these textbooks promote EDS?; (b) statistics and probability address their study towards informed decision-making, based on the study developed, and which requires a high cognitive demand. Throughout the different educational levels, is Stochastic Education developing tasks of high cognitive demand and are they connected to the SDGs?; and (c) statistical tasks must be close to the tasks carried out by a statistician and connected to the SDGs; in this sense, these tasks should verify all the aspects that make these tasks authentic [
5]. Can the statistical tasks proposed in these textbooks be considered authentic?
We focus on textbooks because, in addition to being part of the first action field to promote education for sustainability [
11], they are a widely used resource by teachers in the teaching and learning process, therefore “understanding textbooks is essential to understand the learning opportunities offered by educational systems around the world” [
13] (p. 1). In addition, Johansson [
14] adds that they are extensive printed objects that try to guide the work of students throughout the school year in a specific subject and have a close relationship with classroom instruction. This makes them a resource with transformative capacity in the educational process and, consequently, they must be analyzed in greater depth [
15].
On the other hand, this validity granted to textbooks moves them to a prominent position in curricular reforms so that, in many countries, they are considered a relevant resource when the implementation of a new curriculum takes place [
13]. Thus, when confronted with the challenge of implementing ESD in the school classroom, textbooks can play a role similar to that they play when facing curricular changes and, in this sense, could contribute to their inclusion in classroom practices.
Considering these facts, our objective is to analyze the statistical and probability tasks from a collection of primary education mathematics textbooks to educate for sustainability. Specifically, it is a collection of Chilean books that have a great impact on the process of teaching mathematics in Chile, as they are distributed free of charge by the Ministry of Education of Chile (MINEDUC) to public and shared financing schools, impacting more than three million students from 1st to 8th grade (6–14 years old).
2. Education for Sustainable Development through Statistical and Probabilistic Literacy
Since the 1980s, we have been faced with the challenge of generating a collective responsibility that allows us to face the problems that humanity confronts and that seriously threaten its future [
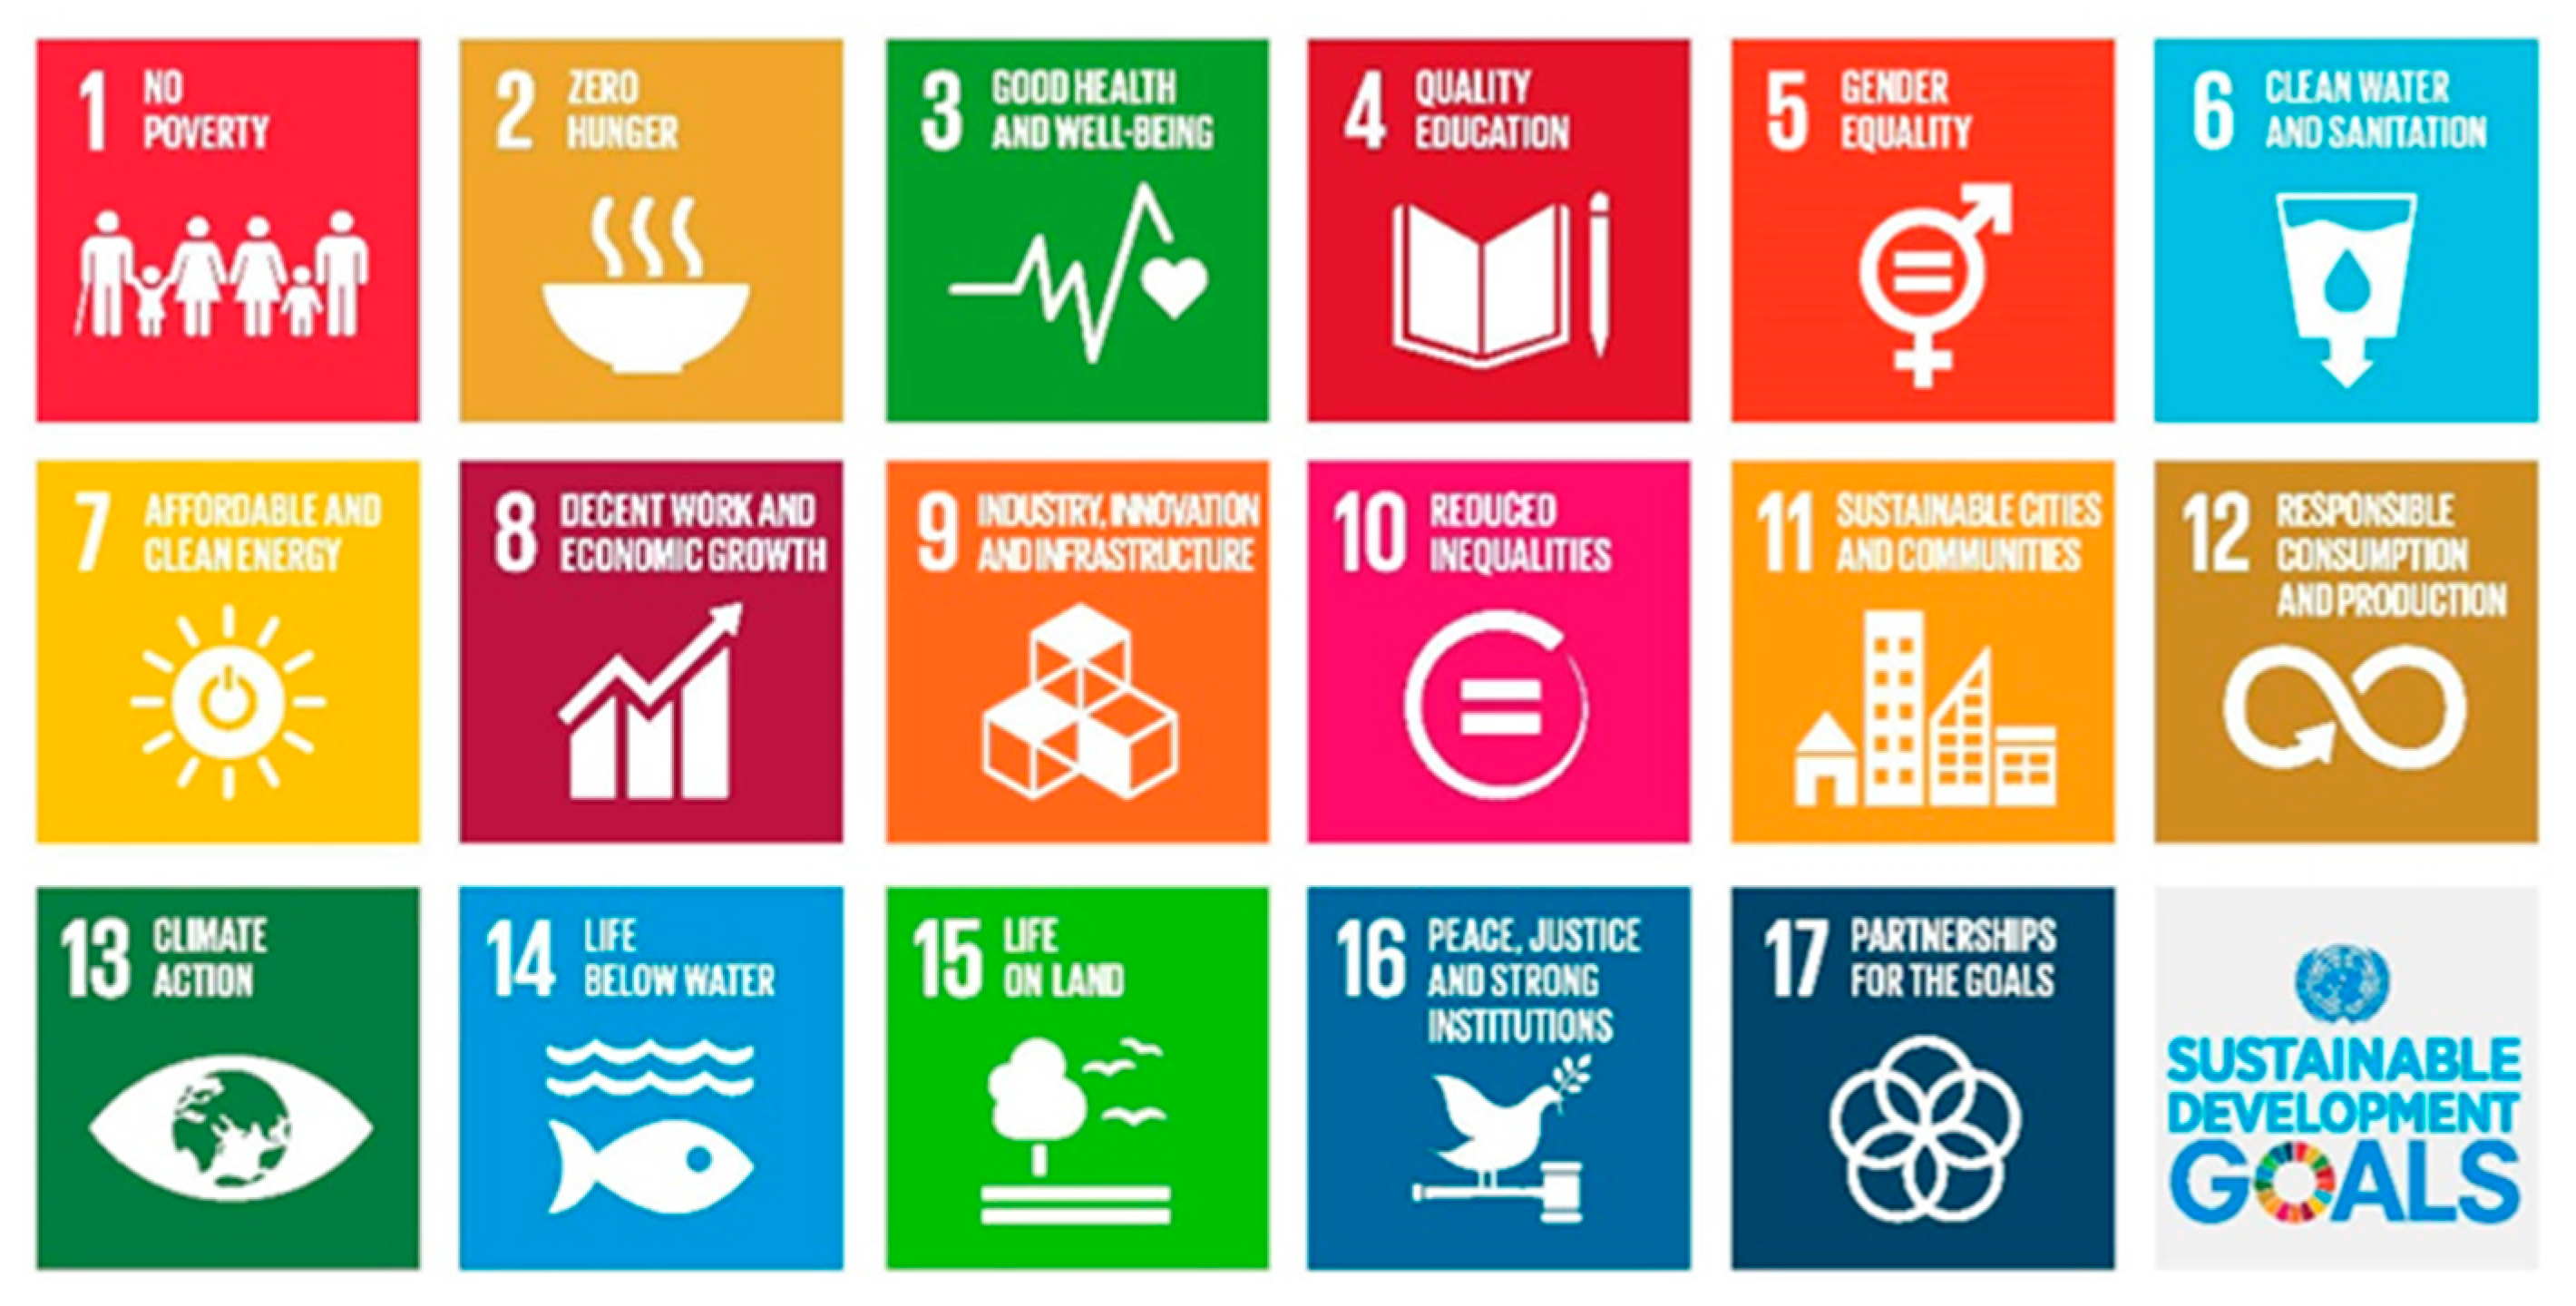
16]. Today, the need to promote sustainable development is even greater, and it is understood as a crucial challenge that should foster practical actions so that we can all build a better future together, one that allows ending poverty, inequalities, achieving peace and justice and protecting human rights and the planet [
17]. In this sense, the UN recognizes three major dimensions of action: economic, social and environmental, from which 17 SDGs are suggested (
Figure 1):
According to UNESCO [
11], to achieve these objectives it is necessary to have a holistic, inclusive and transformative education, which considers: (a) the contents and learning outcomes (integration of sustainability issues into the study plans); (b) pedagogy and learning environments (learner-centered, action-oriented teaching and learning based on interaction and exploratory learning); (c) learning results (promoting skills such as critical and systemic thinking, joint decision-making, assuming responsibility for current and future generations); and (d) social transformation (empowering learners of any age and in any educational setting, to transform themselves and the society in which they live). This represents a challenge for teachers and teacher trainers, especially in the areas of physics, chemistry and mathematics, since they may be less aware of their competencies to implement an education in this line [
18,
19,
20].
With the purpose of incorporating sustainability in higher education, the Copernicus-Alliance network of European universities for sustainability has been working since 1993 with this objective, with special emphasis on the training of Primary and Secondary Education teachers. On the same line, Alsina and collaborators [
21,
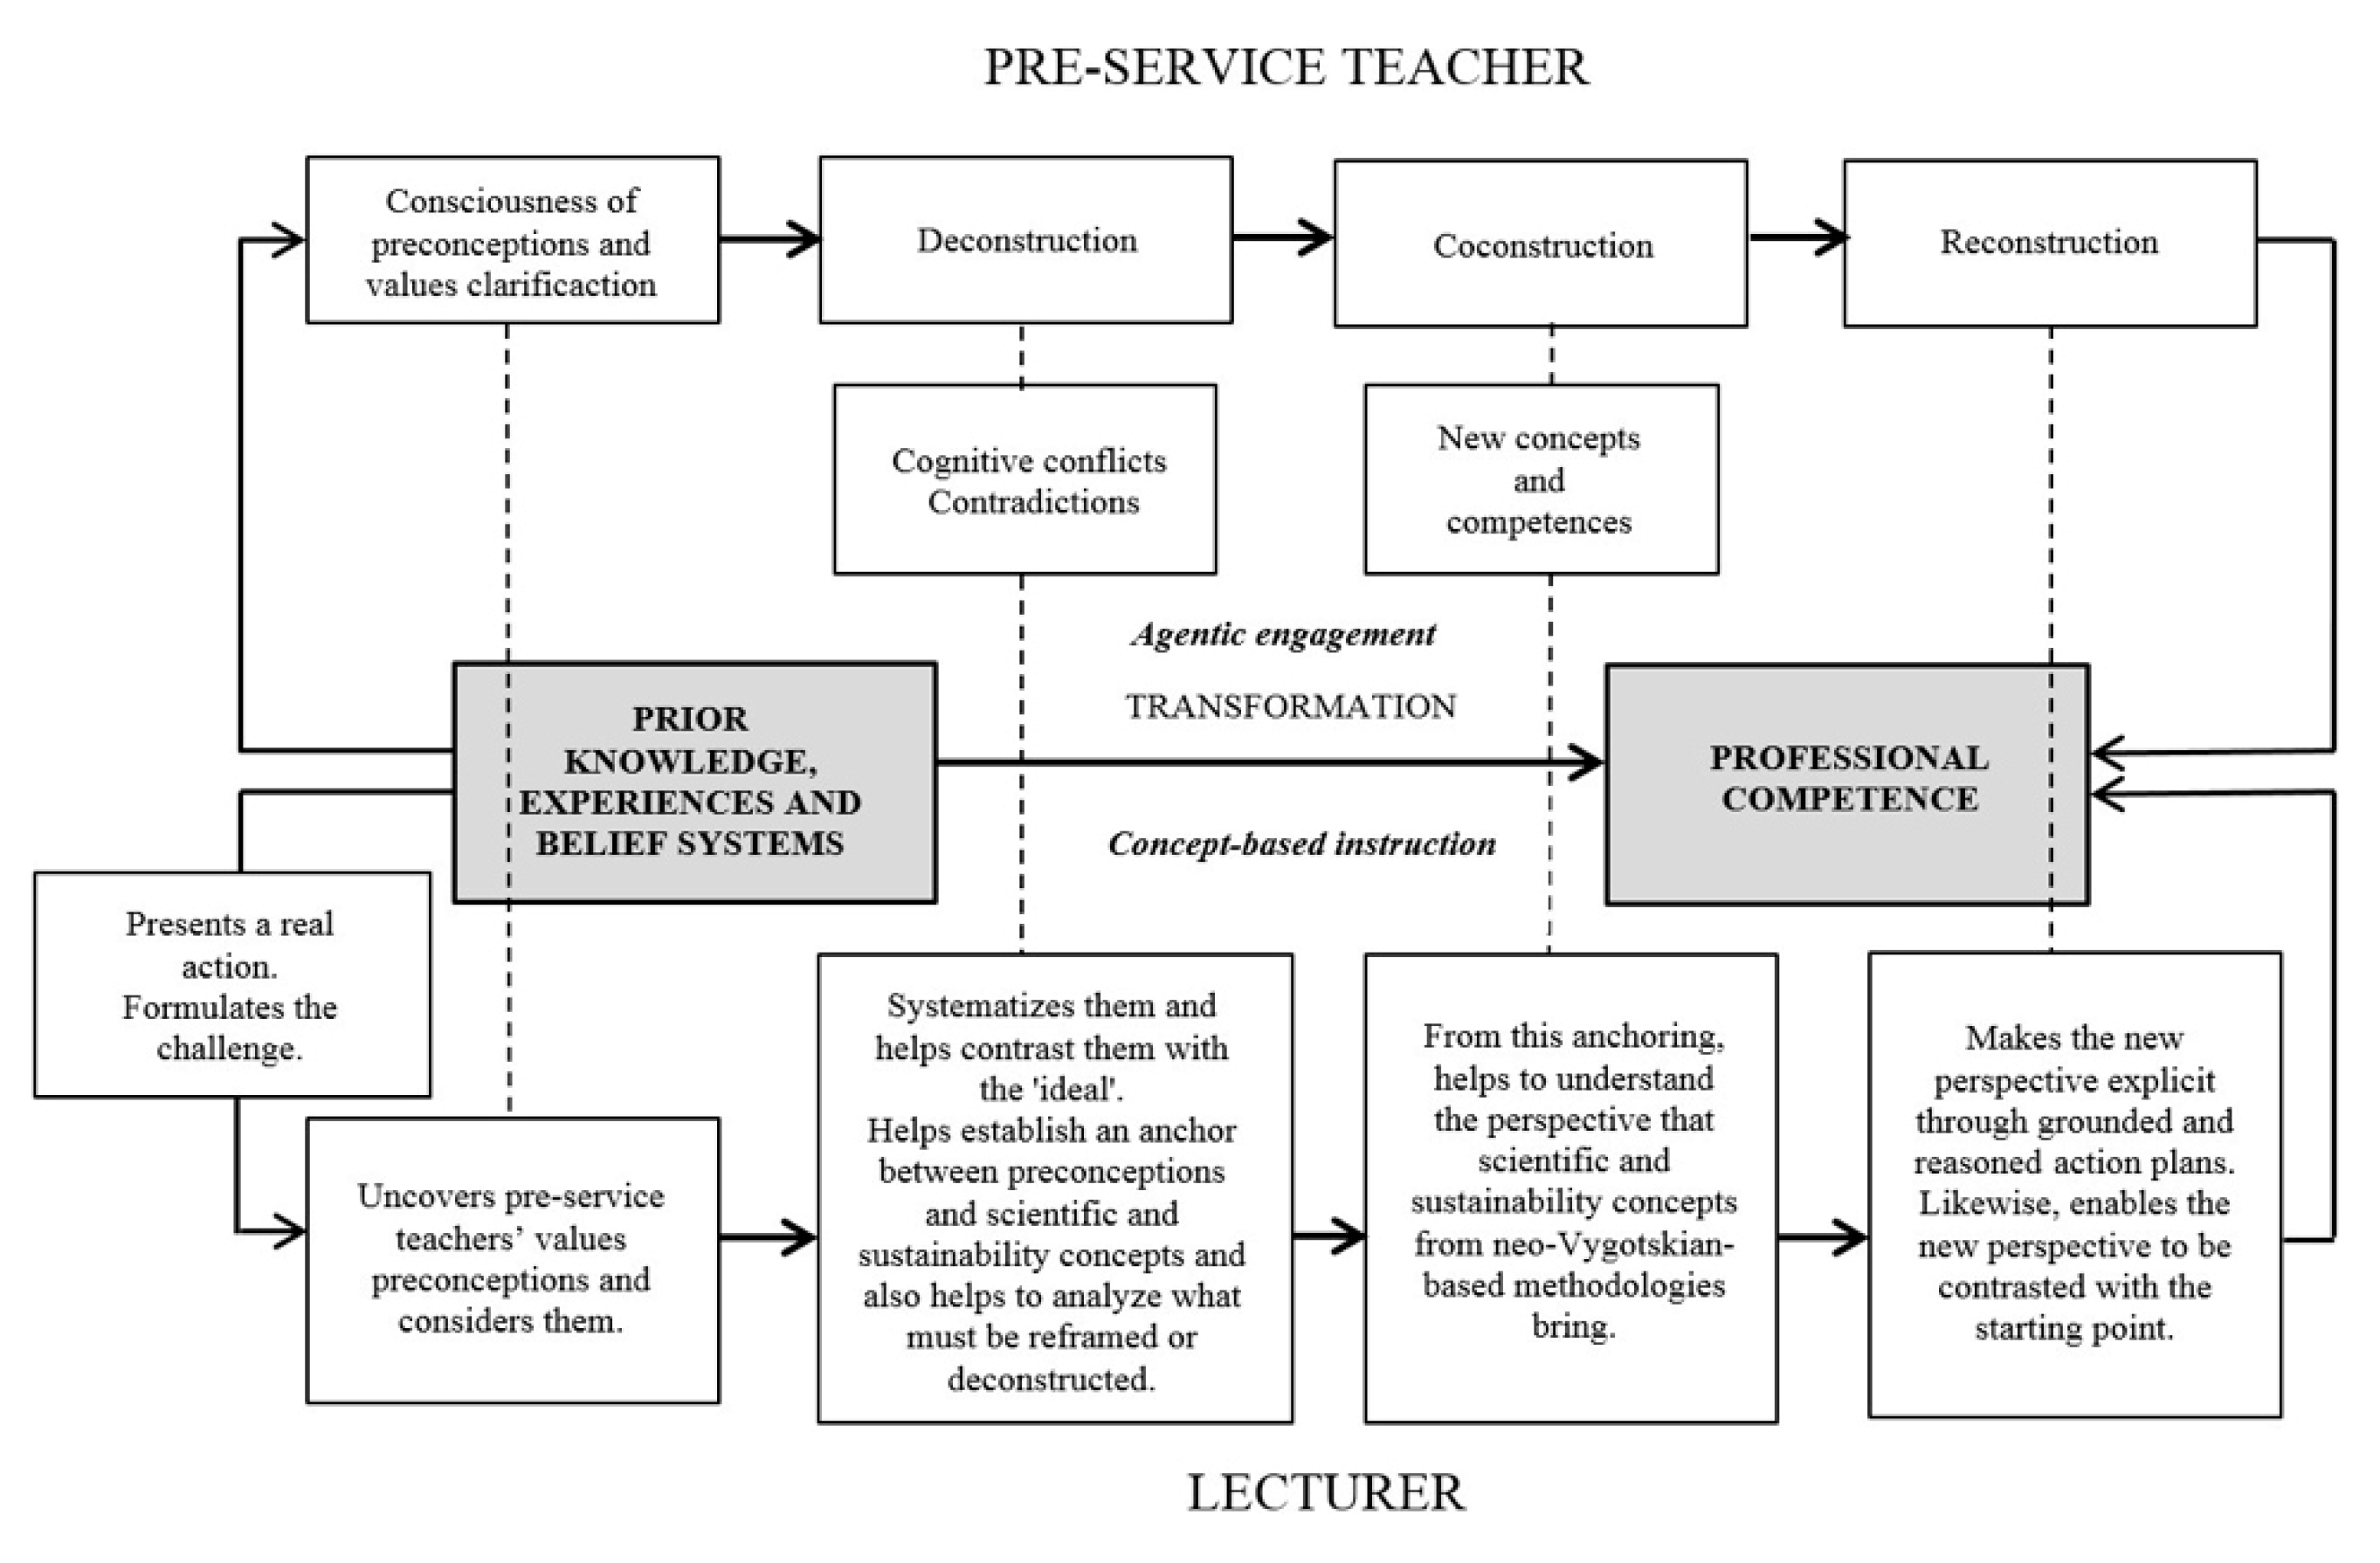
22] suggest that, to carry out this transformation, it is essential to incorporate explicitly in the teaching practice of university teachers—responsible for the training of mathematics teachers—the knowledge provided by research results from various fields of study related to teacher training. From this point of view, Alsina and Mulà [
22] develop the Transformational Professional Competence Model through Reflective Learning and Sustainability (
Figure 2).
This model describes some essential strategies to foster the transformation of prior knowledge of future mathematics teachers (knowledge, experiences and prior beliefs) into professional competence, from the ESD framework and using the realistic-reflective training model.
Considering this information, Vásquez [
3] promotes the incorporation of competences related to ESD from Stochastic Education. Taking into account that in Stochastic Education the context is fundamental, since “data are not just numbers, they are numbers with a context” [
23] (p. 801), the analysis of the data cannot be thought of without thinking about the context in which they are offered [
24,
25]. The objective of statistics is to go deeper into the context to develop an understanding of the context itself, which leads to a constant interrelation between the concrete and the abstract in statistical reasoning [
26]. Furthermore, “statistical concepts linked to context should be approached as social constructs, following the way suggested by the data-oriented approach” [
27] (p. 124). The context determines how and what data to collect, how to analyze them and interpret the results [
26] and what gives rise to a continuous interrelation between the statistical problem and the context of the problem [
25,
28]. However, context in statistics and probability has special relevance in the analysis of socio-political aspects [
29,
30] and the case of Stochastic Education to educate for sustainability gets close to this area. In addition, the teaching of statistics and probability has enormous potential to incorporate discussions about students’ everyday lives in mathematics classrooms [
31]. On the other hand, from the perspective of Critical Statistics, using tasks in real contexts to teach statistics is not only important for the development of critical citizens but also for the development of statistical thinking and reasoning [
15]. Thus, Pfannkuch and Wild [
32] indicate the need to solve real-world problems in order to develop statistical thinking in students, as it contributes to making predictions, seeking explanations and finding causes within specific contexts and both Garfield [
33] and Ben-Zvi and Garfield [
34] indicate that it is necessary to make interpretations based on data sets, data representation or statistical summaries of data when developing statistical reasoning.
Consequently, it is crucial to develop competencies in citizenship to “empower and equip present and future generations to meet their needs through a balanced and integrated approach of the economic, social and environmental dimensions of sustainable development” [
35] (p. 7). From this perspective, stochastic education is constituted as a powerful tool that contributes directly to the development of key sustainability competencies and therefore directly helps to train sustainability citizens. It is in this sense that the need to develop skills for sustainable development becomes a purpose to teach stochastics and in turn stochastics becomes an excuse to train for sustainability [
3]. From this perspective, a reorientation of the teaching of stochastics in the school classroom is required, one that moves towards Stochastic Education to Educate for Sustainability, in such a way that all people can constitute themselves, not only as citizens literate in statistics and probability, but also to acquire knowledge, skills, values and attitudes with which they can contribute to sustainable development.
Statistical and probabilistic literacy is conceived as a basic competence to evaluate statistical and probabilistic data in diverse contexts [
36,
37] and stochastic education to educate for sustainability is conceived as the teaching of stochastics from the approach of problems from real and local contexts linked to the SDGs, with the purpose of developing competencies that empower teachers and, therefore, students to reflect and act on issues related to sustainable development. This double approach from statistical and probabilistic literacy and stochastic education to educate for sustainability will, on the one hand, allow students to know and become aware of ESD and the SDGs and reflect on what they can do to reach them from actions themselves (decision-making) and, on the other hand, give meaning to the learning of probability and statistics, thus allowing a greater internalization of what has been learned.
Nonetheless, assuming that it is not only that students understand the different problems (social, economic, and environmental), but that it is necessary to even go further, in such a way that students become aware of these problems and act to advance towards a more sustainable world [
11], what characteristics should the tasks proposed under the stochastic education approach have to educate for sustainability?
According to Vásquez and García-Alonso [
5], it is necessary for teachers to design and implement statistics and probability tasks with various characteristics that involve contexts for sustainability; that show articulation throughout the lesson or lesson plan; that are challenging tasks that motivate and help students to build new statistical and probabilistic knowledge through problem solving; and, finally, that they are authentic, that is, that they allow “to represent some real life situation in such a way that important aspects of that situation are simulated to a reasonable degree” [
38] (p. 40). For this, Chamoso, Vicente, Manchado and Múñez [
39] point out that the following fundamental aspects must be achieved: event (that has a high probability of happening outside the school), question (that is transferable to an equivalent situation outside the school). school), information (matches real life), purpose (matches the purpose of solving outside of school) and specificity of the data (if the details of the situation influence the problem-solving strategy).
Within this framework, the stochastic tasks of a collection of Chilean mathematics textbooks for students from 1st to 8th grade (6–14 years old) were analyzed. With this analysis, it is intended to contribute to the characterization of key elements to guide the design of statistics and probability tasks to educate for sustainability, so that students at these levels understand the different problems (social, economic, and environmental) with which we are confronted, as well as the measures that must be adopted to transform and act towards a more sustainable world.
3. Methodology
This study is theoretical and qualitative [
40] and uses content analysis as a technique [
41], since the purpose is to explore the opportunities offered by mathematics textbooks to promote ESD in the school classroom, through contexts linked to sustainable development to teach statistics and probability. This will enable the research questions outlined above to be answered.
3.1. Sample and Analysis Units
The sample selected for the analysis is intentional and it is made up of a collection of eight Chilean mathematics textbooks (
Table 1). These books have a great impact on the process of teaching mathematics in Chile, as they are distributed free of charge by MINEDUC to public and shared-financed schools, impacting more than three million students in Primary Education (6–14 years old).
The units of analysis of this study are the units (U) and lessons (L) of each text, in which contents related to statistics and/or probability are addressed (
Table 2).
3.2. Categories Analysis
According to Vásquez and García-Alonso [
5], Statistical Education should be studied around the statistical investigative cycle [
25] with the aim of developing students (future citizens) and with the compromise of transforming their environment and with social awareness [
42]. By doing this we are promoting EDS [
5]. These authors said that this implies that the tasks must be of high cognitive demand (addressed to decision-making), seek to change their environment (and, therefore, be well articulated throughout their development) and have to be authentic, represent real-life situations or simulate it to a reasonable degree.
For this reason, the lessons in
Table 2 have been categorized and coded based on a set of indicators refined and adapted from the study by Vásquez and García-Alonso [
5], which address the following categories: (1) contexts for sustainability; (2) levels of articulation; (3) cognitive demand; and (4) authenticity. These categories allow us to analyze statistics and probability lessons from a double perspective; local, to analyze contexts for sustainability and cognitive demand of each of the tasks that make up the lesson; and global, to analyze articulation levels and the authenticity of the lesson as a whole.
(1) Contexts for sustainability: according to the UN, to encourage sustainable development, among other aspects, it is necessary to consider three dimensions of action (economic, social and environmental), from which it raises 17 sustainable development objectives. This study considers such dimensions to define context categories for sustainability. Accordingly, we seek to observe the presence of these contexts (economic, social, and environmental) which give meaning to the teaching of statistics and probability. Problems from real and local contexts are addressed, which foster the development of critical thinking, allowing students to understand and reflect on reality, and the importance of contributing from their own actions to the development of a sustainable world. In addition, the categories: “other contexts not significant for sustainability”, which include contexts not linked to the areas of action of ESD (for example dice throwing, coin tossing or roulette spinning, pet amounts, number of siblings, among others; and “without context”, which includes tasks that do not consider any type of context, have been considered.
(2) Articulation levels: the degree to which each of the contexts, considered in the previous category, developed throughout the entire lesson is observed, allowing a global review of itself.
For this, the following four levels have been defined:
- -
Level 0: the context that is initially presented does not refer to any of the contexts for sustainability.
- -
Level 1: the sustainability context appears in an initial or motivational activity, but it is not used in any other task.
- -
Level 2: the sustainability context appears discontinuously throughout the lesson and does not support all the tasks that are proposed.
- -
Level 3: the sustainability context is the backbone of the entire proposed lesson, from the beginning until the end.
(3) Cognitive demand: to what extent the proposed task requires more elaborated knowledge about statistical and probabilistic information and its relationship with work context is observed. The taxonomy for the analysis of cognitive demand of the mathematical tasks proposed by the National Council of Teachers of Mathematics (NCTM) [
43] is used. According to this taxonomy, the following three levels of cognitive demand are differentiated as related to statistical and/or probabilistic knowledge with the context and the actions that must be developed in the activity:
- -
Memorization: the focus of the task is on memory reproduction of previous learning; construction of tables/graphs from data provided; and/or identification of the elements that comprise it (construction procedure), without modifying the information contained.
- -
Connection: it focuses on establishing connections between statistical and probabilistic concepts, which require extensive knowledge and at the same time connecting different representations for the understanding of statistics and/or probability. But the context does not play a fundamental role or does not lead to the posing of new questions to obtain greater statistical and/or probabilistic knowledge.
- -
Reflection: it demands drawing conclusions connected with the ESD. In this type of task, context becomes a source of statistical and/or probabilistic learning and a source of reflection on the individual role in the local community and in the society in which he/she participates.
(4) Authenticity: it allows analysis of whether the lesson approaches some SDG or focuses on contexts oriented to the development of the SDG. Therefore, the more aspects that are verified, the more legitimate the lesson is, deepening the knowledge of the SDG. Thereby, the legitimacy of the lessons related to the study of statistics and probability is observed, based on an adaptation of the indicators proposed by Paredes, Cáceres, Diego-Mantecon, Blanco and Chamoso [
44]:
- -
Event: the proposed situation is feasible in real life outside of school and considers contexts for sustainability (data close to local or country settings or close to the situation of the context where they live).
- -
Question: it is put forth in the usual way for the event described and its answer has a practical statistical and/or probabilistic value or is interesting because of the debate it provokes.
- -
Information: the data matches real ones or have been adapted to highlight the context for sustainability addressed. The data used in the task are obtained through polls, they are real data or adequate for the age and level at which they are proposed.
- -
Purpose: it is explicitly mentioned and is in line with that raised from the real situation and some context for sustainability. The task carried out does so in a way that addresses the proposed sustainability context, and the statistical and/or probability content contributes decisively to its achievement.
- -
Specificity of the data: the data are collected from polls and/or experiments carried out by the students or the origin of the data or graphs with which they work is mentioned. Such data are adequate to answer the question posed or guide students to reach intended conclusions.
Following this approach, a task can be considered
authentic, believable or
fictitious [
44]. For a task to be considered plausible or authentic it must develop the indicators described in the ‘event’, ‘question’ and ‘information’ described in the authenticity section of the analysis instrument.
3.3. Analysis Procedure
At the beginning of this investigation, we first proceed to identify the units of analysis of each of the textbooks. For this, we select those chapters in each textbook dealing with statistics and probability. Depending on the educational level, these chapters could appear subdivided into two or more lessons.
Table 2 shows all the units of analysis selected in this research. Afterwards, a content analysis was done that allowed the different categories of analysis to be systematically and objectively identified (sustainability contexts, levels of articulation, cognitive demand, and authenticity). Subsequently, the units of analysis were coded according to the categories described above. Codification was carried out by three mathematics education experts. To ensure reliability coding, the coders went through a calibration process that considered joint coding sessions and disagreement discussion, to carry out an individual coding process later. To quantify the agreement degree between the encodings, the Kappa of Fleiss index was determined, with a value of 0.8101, therefore the agreement degree was “almost perfect” [
45] (Landis y Koch, 1977, p. 165).
An important point in the coding process, in addition to considering the indicators described above, was wondering about how students can cope with the solution of the proposed task, the type of prior knowledge they must apply, as well as the level (class) in which the task is framed.
In this way, the data were obtained and recorded in an Excel spreadsheet for later analysis. Finally, specific examples were selected for each of the categories.
4. Results
There were analyzed 283 mathematical tasks (
Figure 3). Of these, 65.4% correspond to tasks related to statistics issues and 34.6% to probability. To establish this classification, the lesson topic declared in the pages of the textbook was considered.
The results for each category are presented below: (1) sustainability contexts; (2) articulation levels; (3) cognitive demand; and (4) authenticity.
4.1. Sustainability Contexts
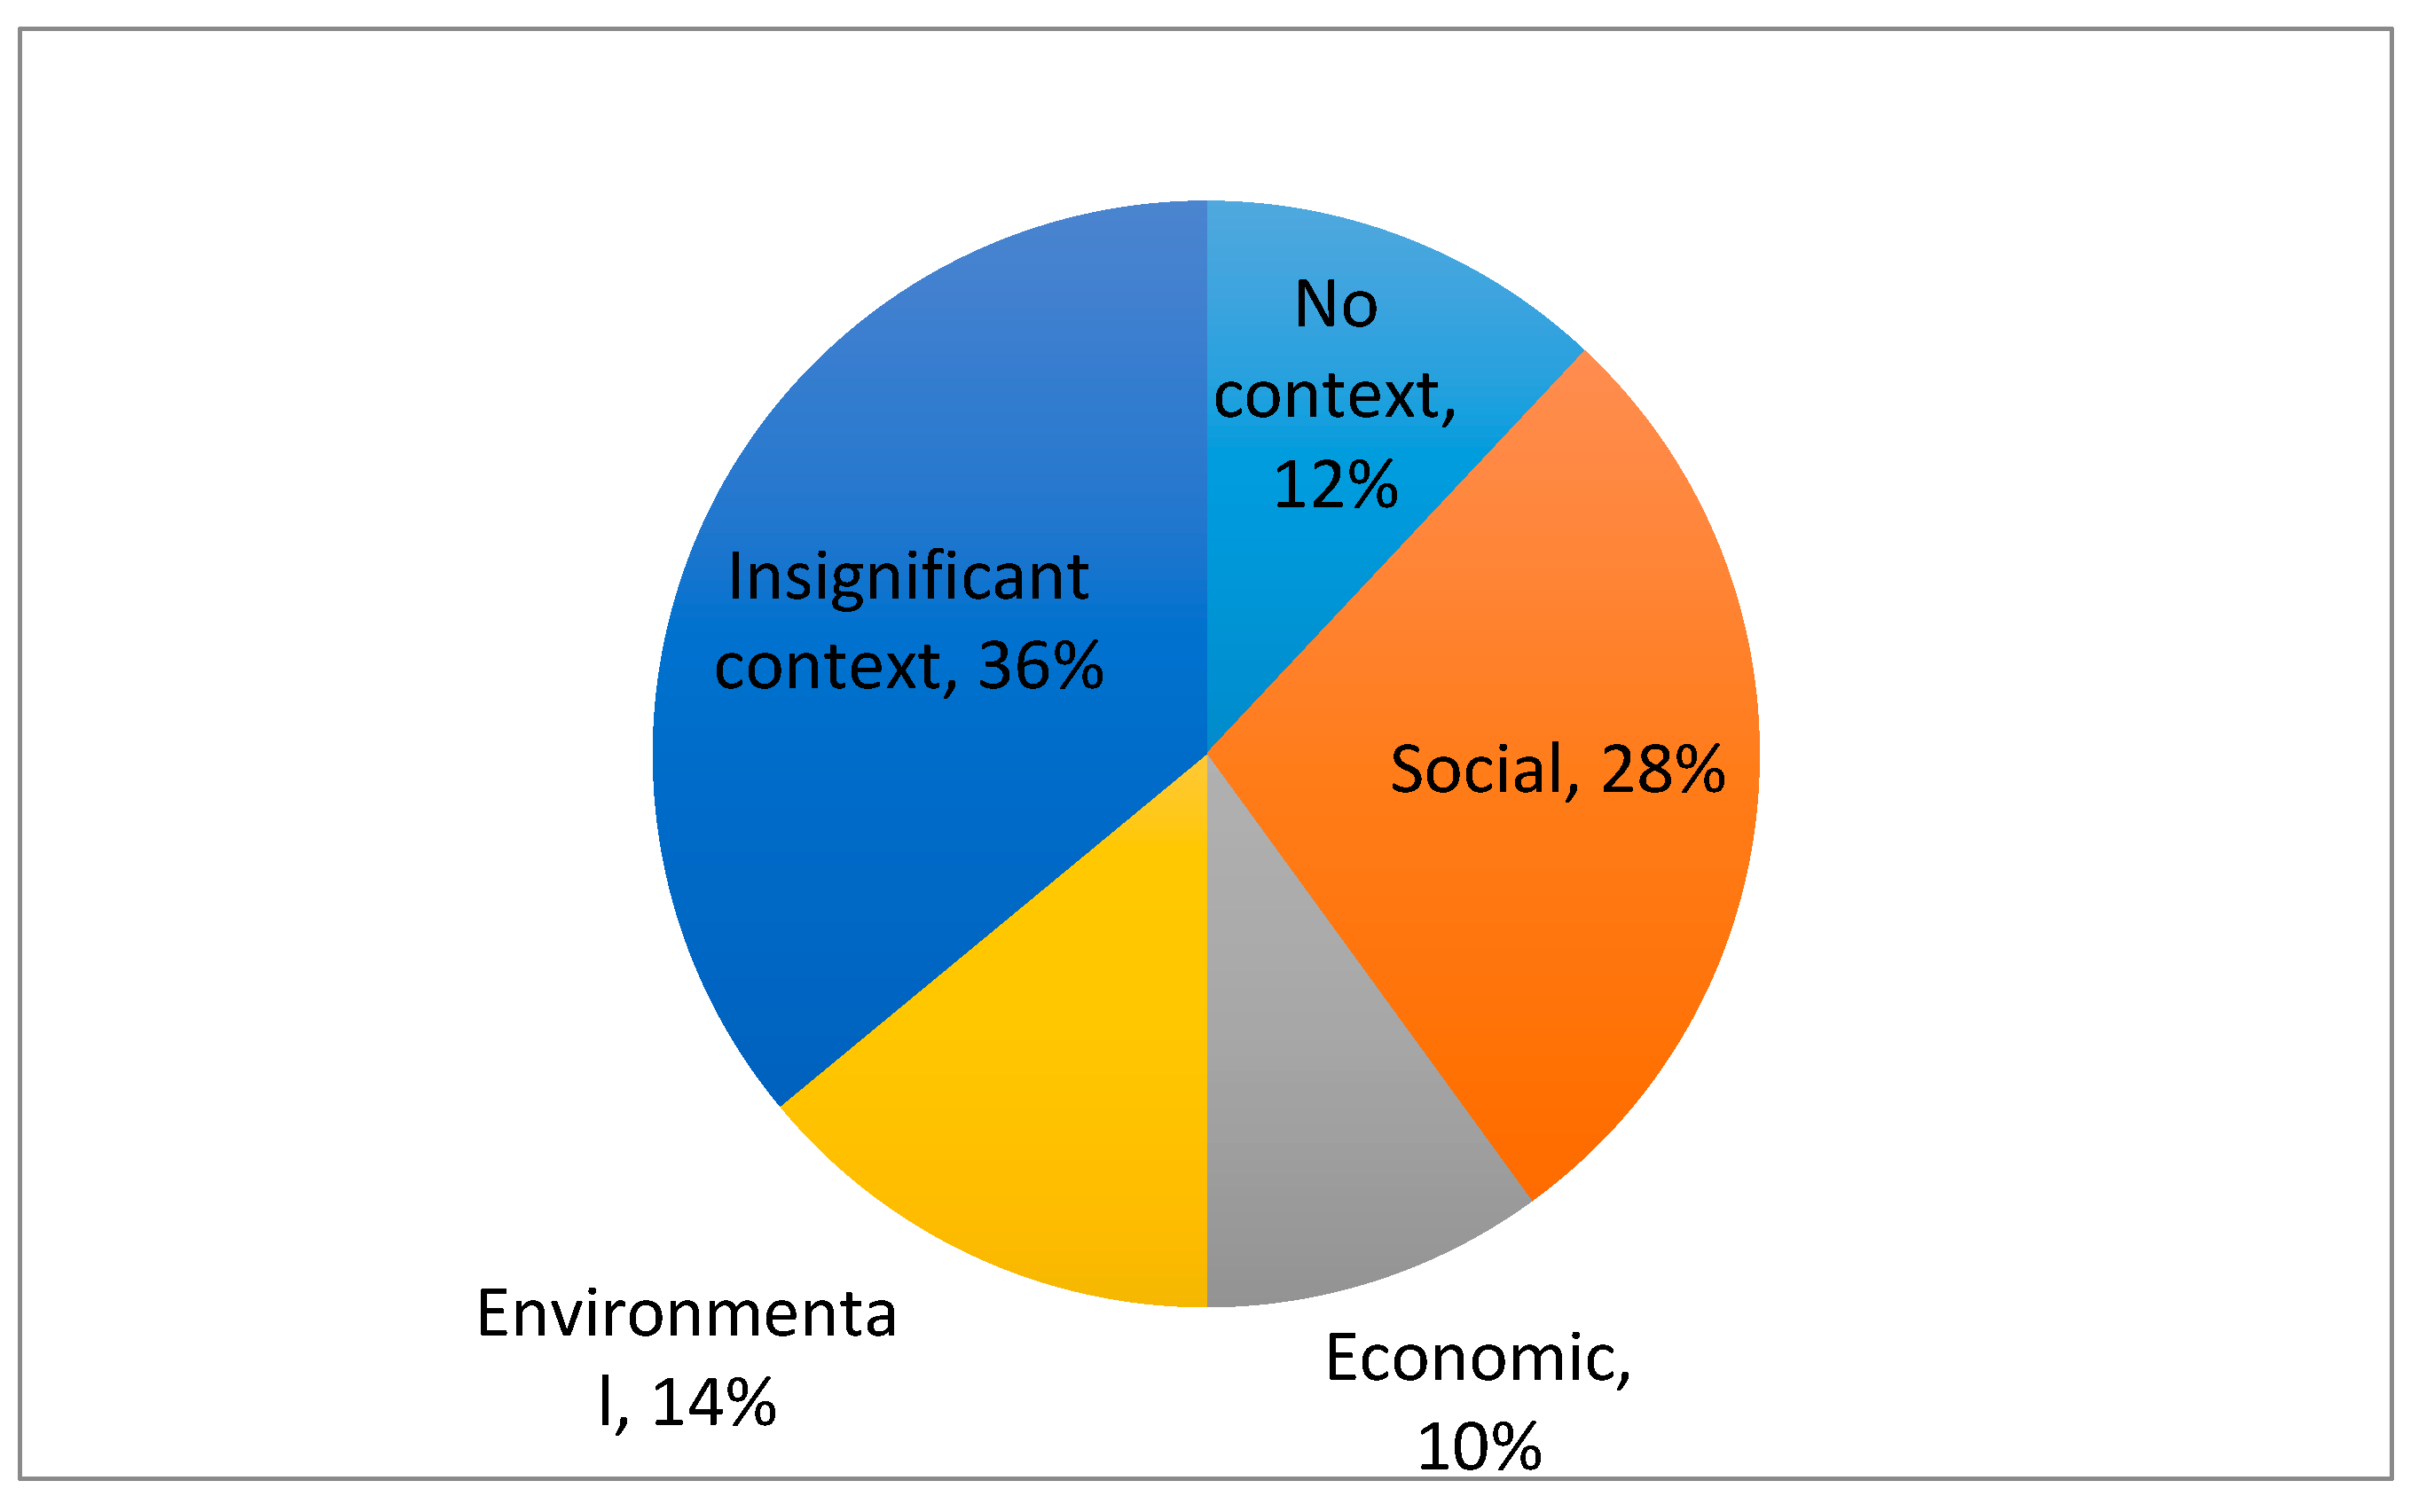
In tasks related to the study of statistics (
Figure 4), it is observed that 52% of the tasks analyzed includes sustainability contexts, where the social context is the one mostly addressed (28%), based on tasks that are designed from topics such as means of transport, sports, food, healthy habits or poverty. The next most common topic is related to the environmental context (14%), where recycling is the most used. It is also worth highlighting the high percentage of tasks with insignificant or no contexts, which represent almost half of the statistical tasks analyzed.
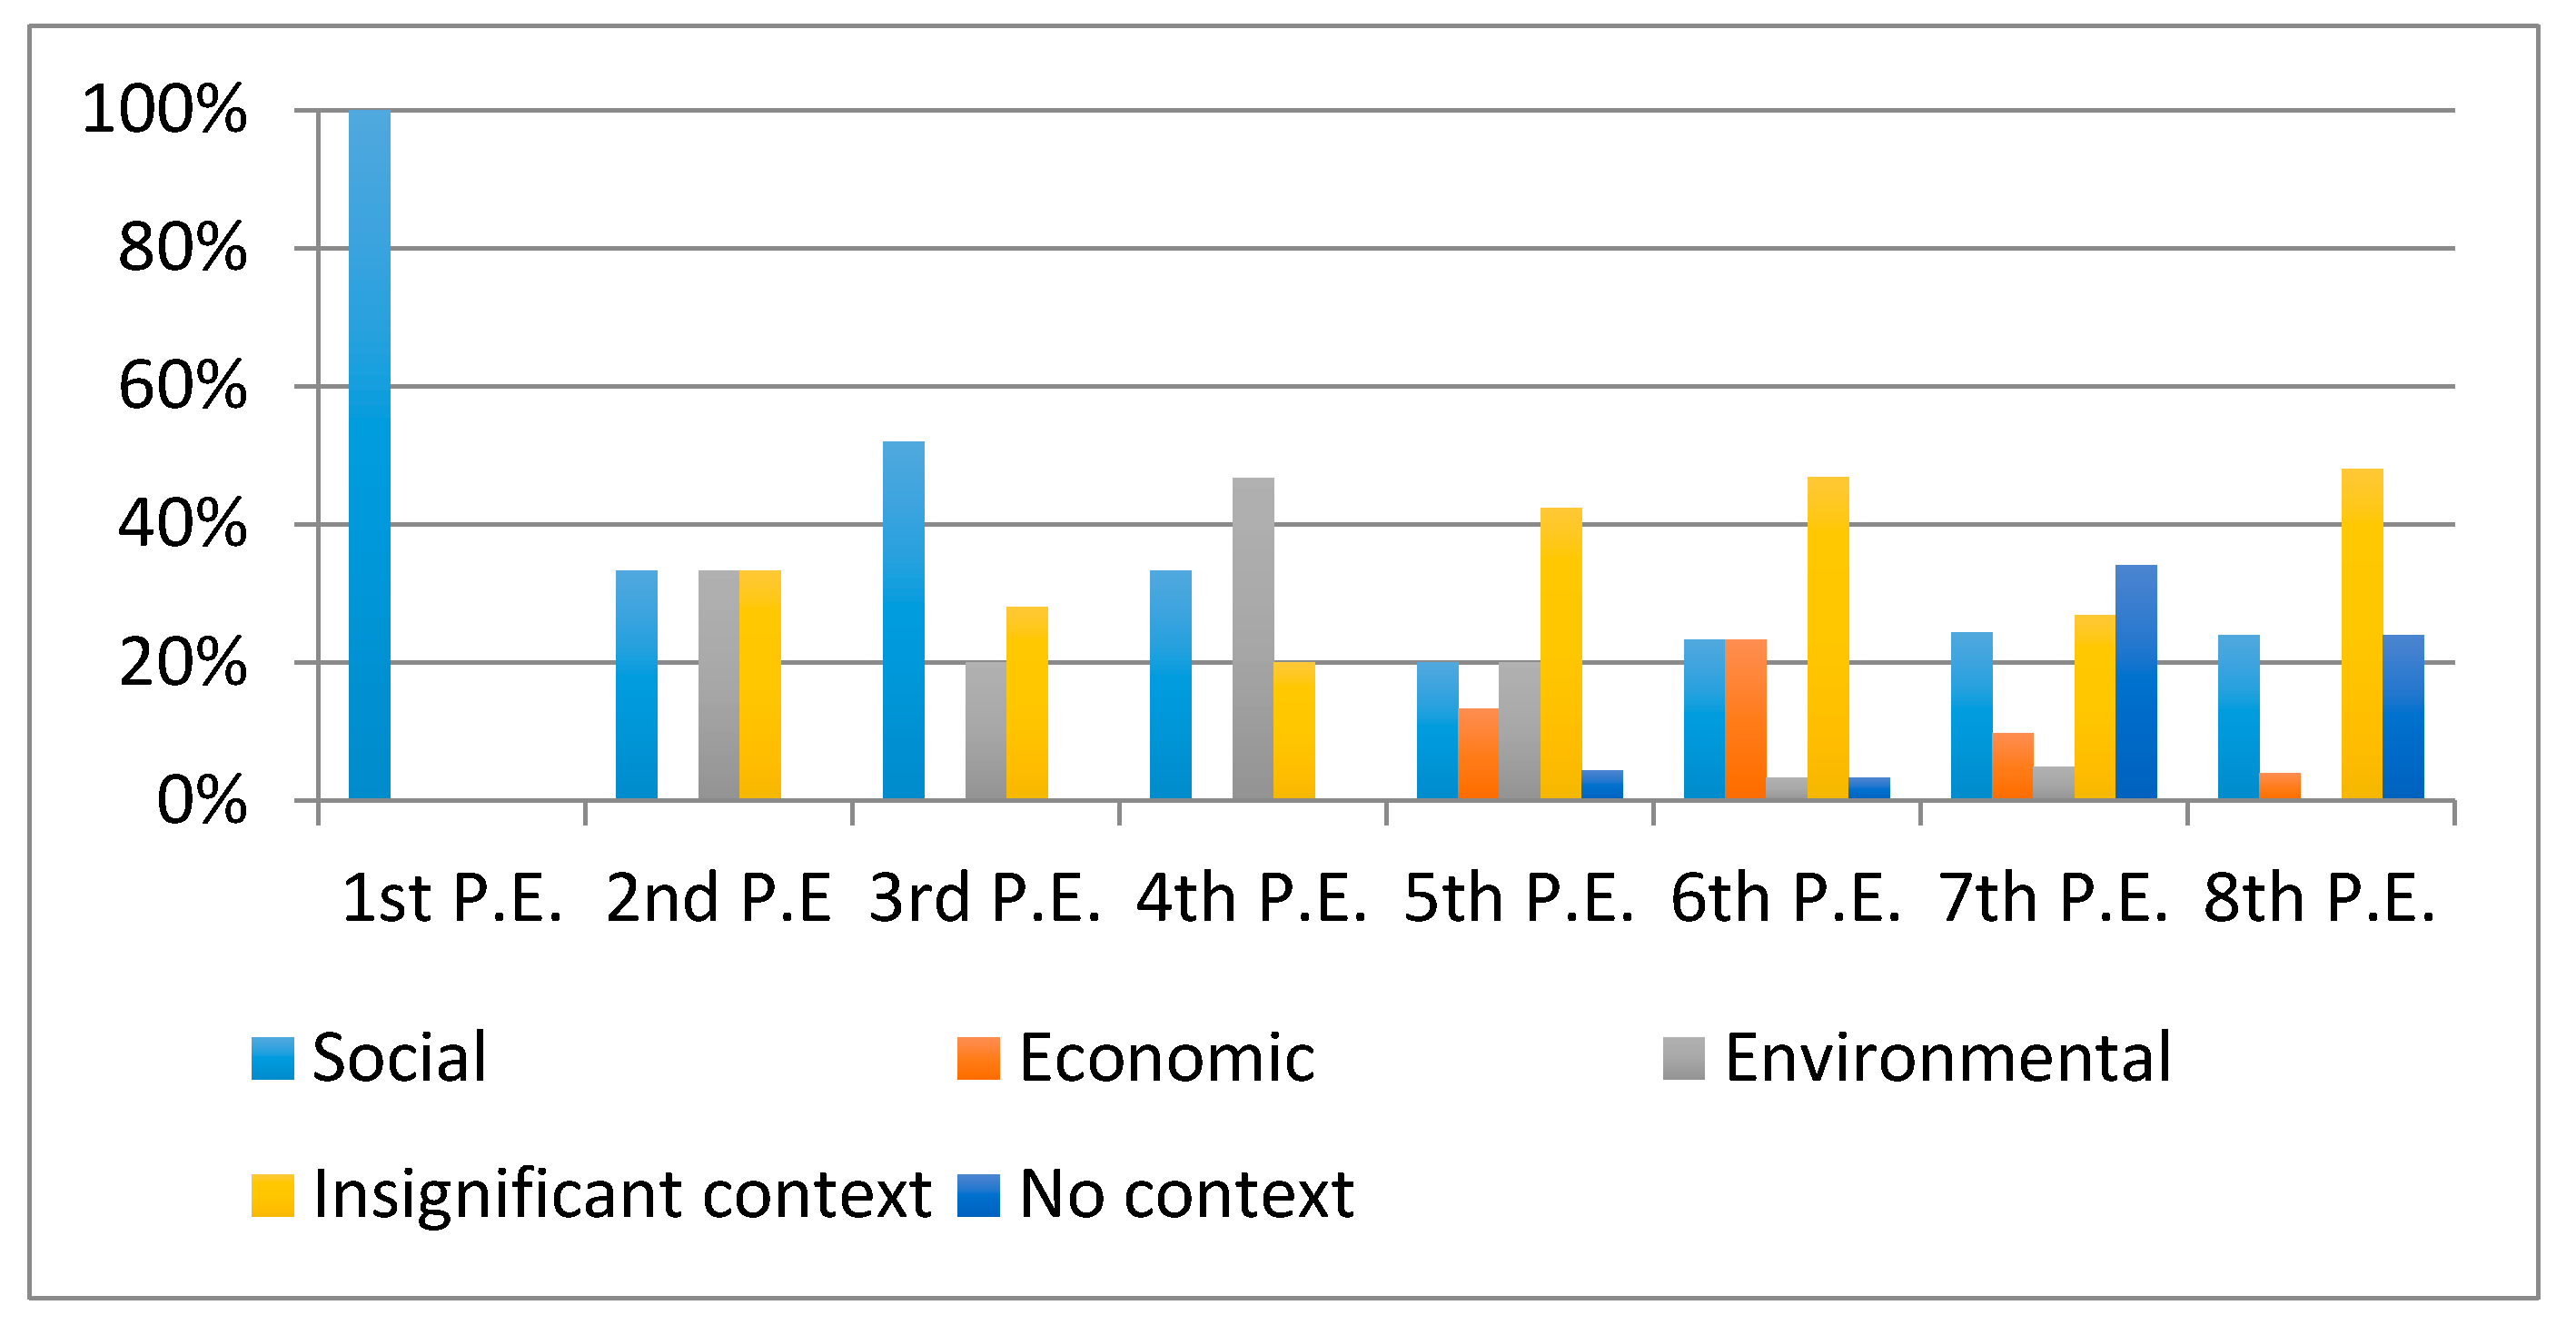
If we focus on how these contexts are distributed in the different educational levels (
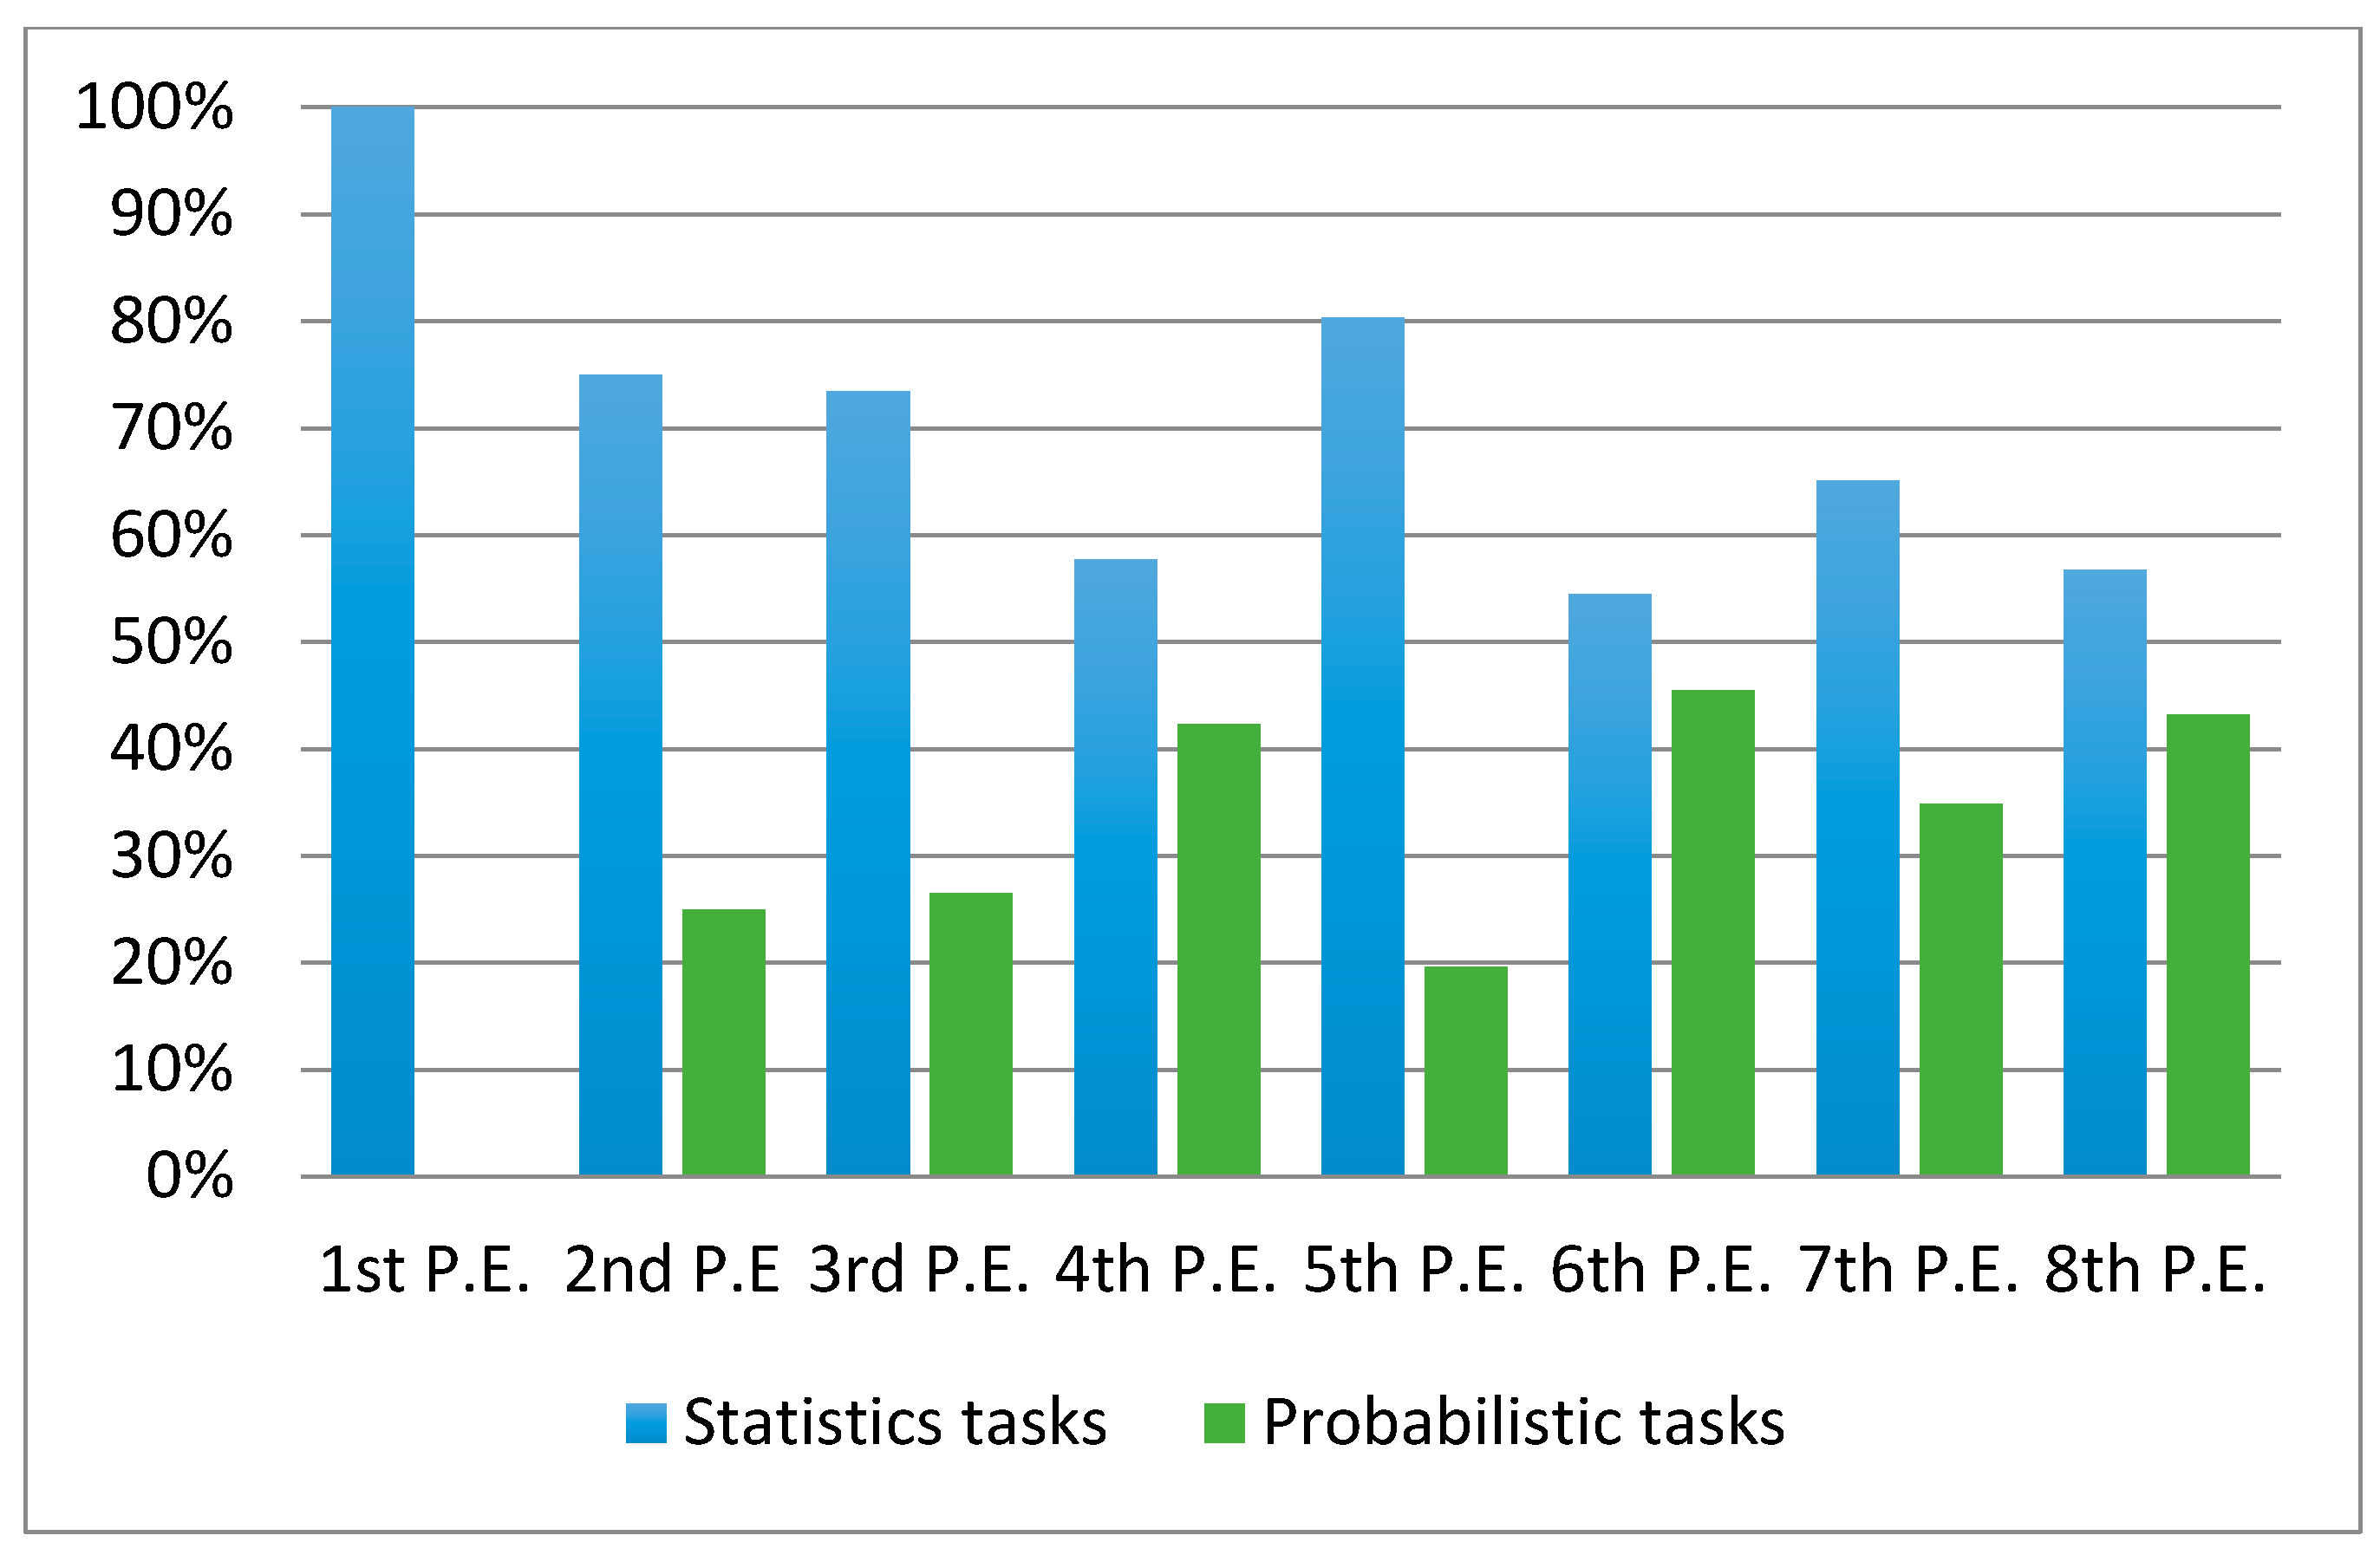
Figure 5), it can be seen that: (a) in the first levels, statistical tasks focus on social, environmental and non-significant contexts; (b) on the contrary, in the last levels the economic context begins to appear, as well as a notable presence of little significant tasks. Moreover, in the last two primary classes, we can observe a strong presence of insignificant or no context tasks, which reveal a procedural approach towards teaching statistics and probability.
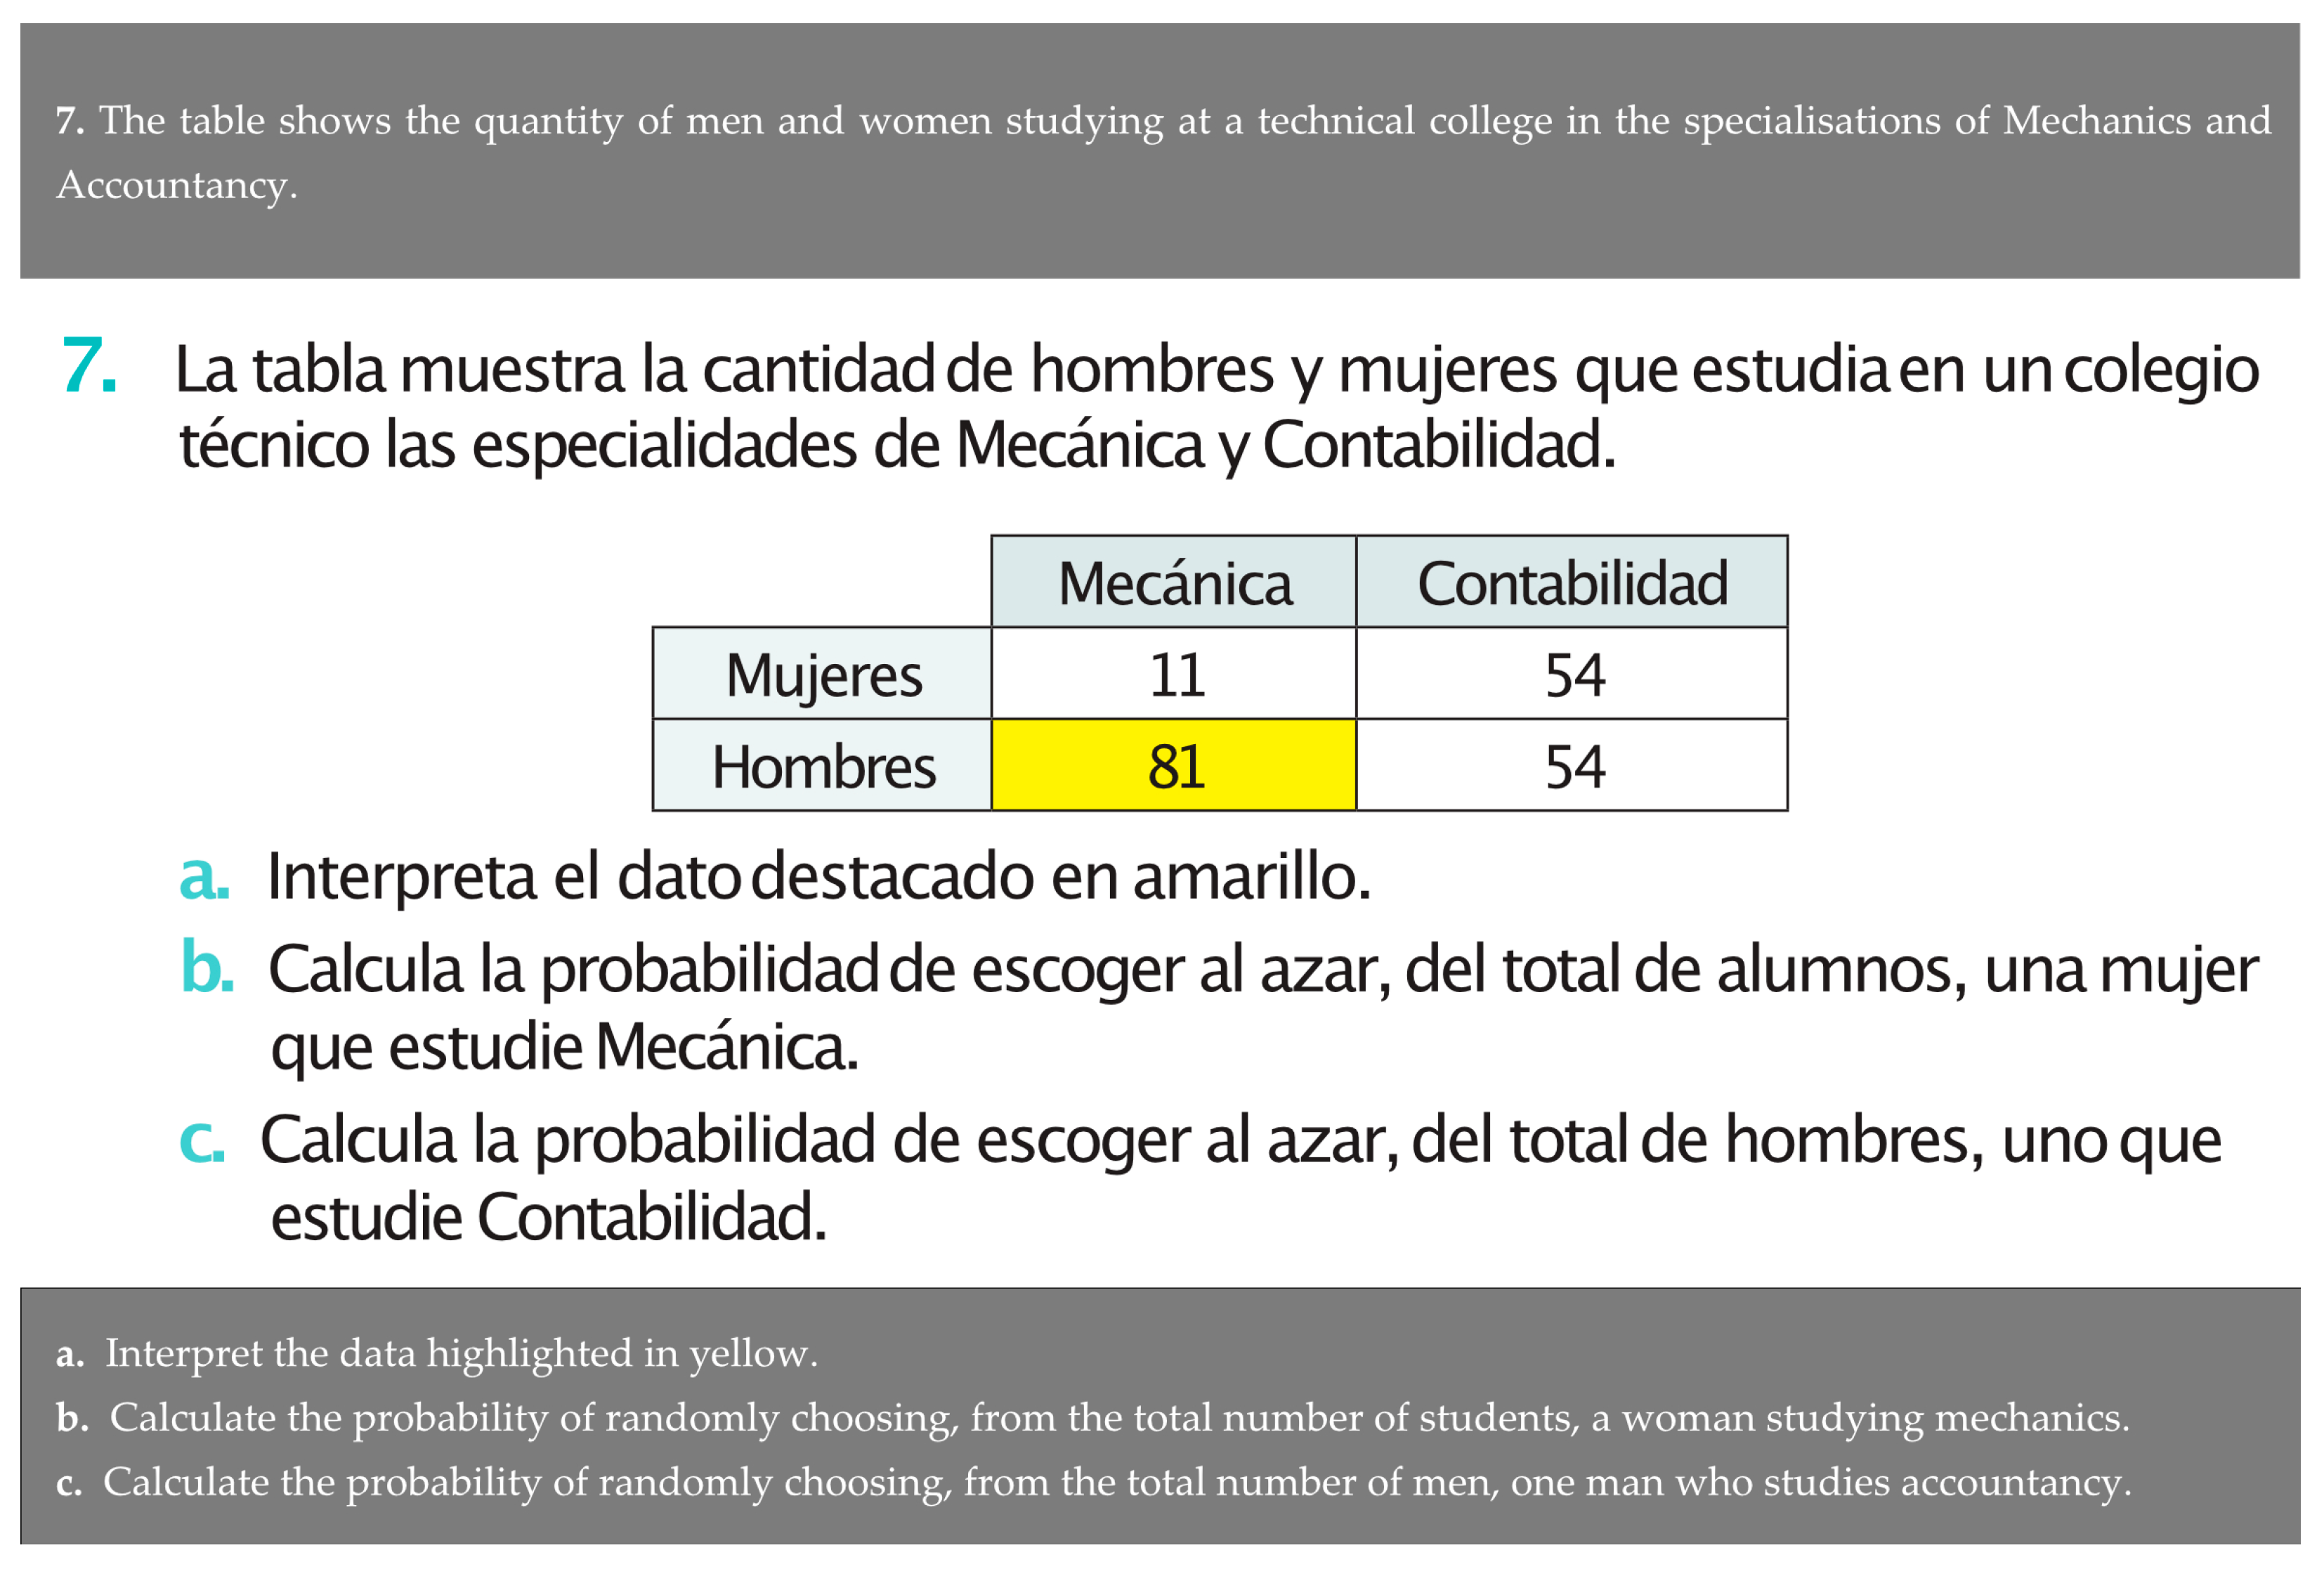
It has also been analyzed how the different contexts appear throughout a lesson, observing that the different tasks are usually referred to different contexts. This, a priori, may be interesting because it could be leading students to apply the same tool in different contexts, moving away from what Weiland [
26] pointed out when he proposes that context is also a learning object and, therefore, it is necessary to deepen it using the statistical and probabilistic tools that it develops. In this sense, tasks that could be a deepening source and analysis in the classroom are sometimes offered. For example, in the task shown in
Figure 6, the study from a gender perspective could be carried out. However, as we can see in this example, no questions are asked about the difference between men and women in the specialties of Mechanics and Accounting, but rather it focuses on the calculation of probability without questioning anything that goes beyond the procedure.
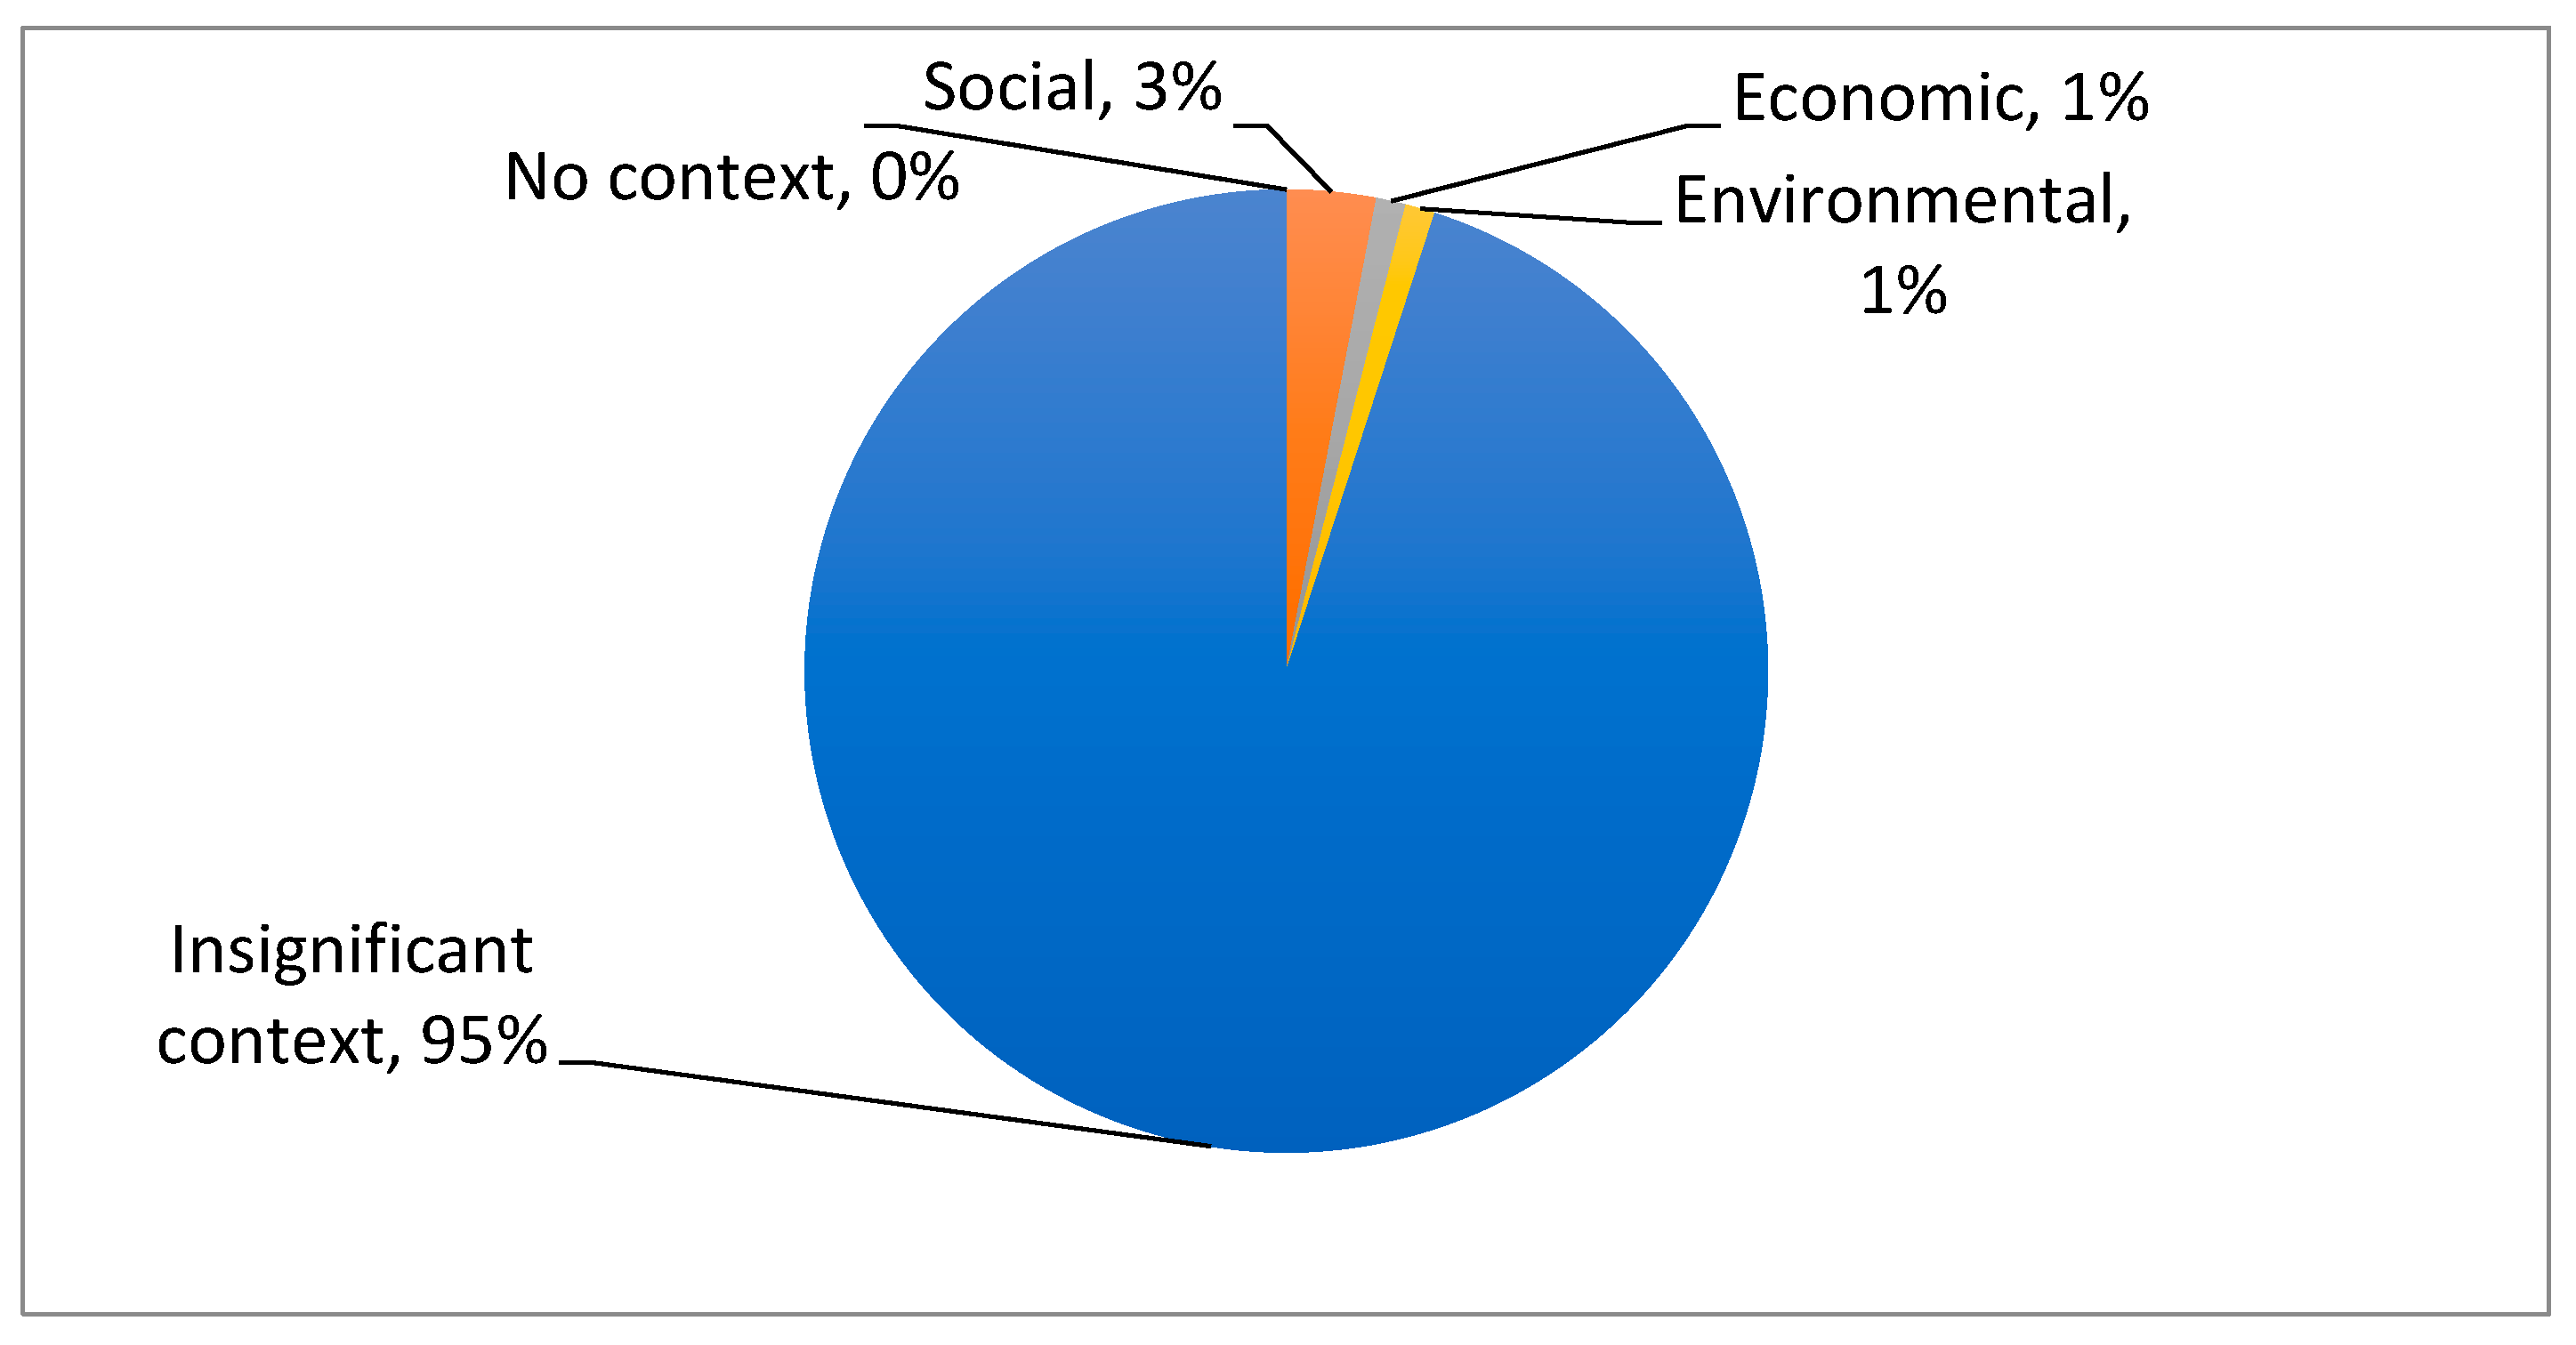
Concerning tasks related to the study of probability (
Figure 7), it is observed that those related to insignificant contexts prevail (95%), while within sustainability contexts, the social context is the one with the greatest prevalence (3%), although a long way from the previous one.
This highlights the disconnection of probability with the student’s setting. Textbook treatment of chance is often related to stochastic experiments such as dice throwing, roulette spinning or coin tossing. They are laboratory experiences, which have nothing to do with everyday situations that lead us to make decisions and where chance and variability have a very important presence.
4.2. Articulation Levels
In the analyzed textbooks, we have observed that only three statistics and probability lessons, out of all the Primary Education books, develop a different articulation level than level 0: lesson 1 from 4th grade (collect information and communicate conclusions), which is at level 2 (a topic related to SDG 11: Sustainable cities and communities is presented); and Lessons 1 and 2 from 8th grade of primary school (statistics and probabilities), which are at level 1 (beginning presentation in sport, which we can link to SDG-3: Health and well-being). With this data, it is evident that textbooks, for the most part, do not start from a subject close to any of the SDGs.
By way of example,
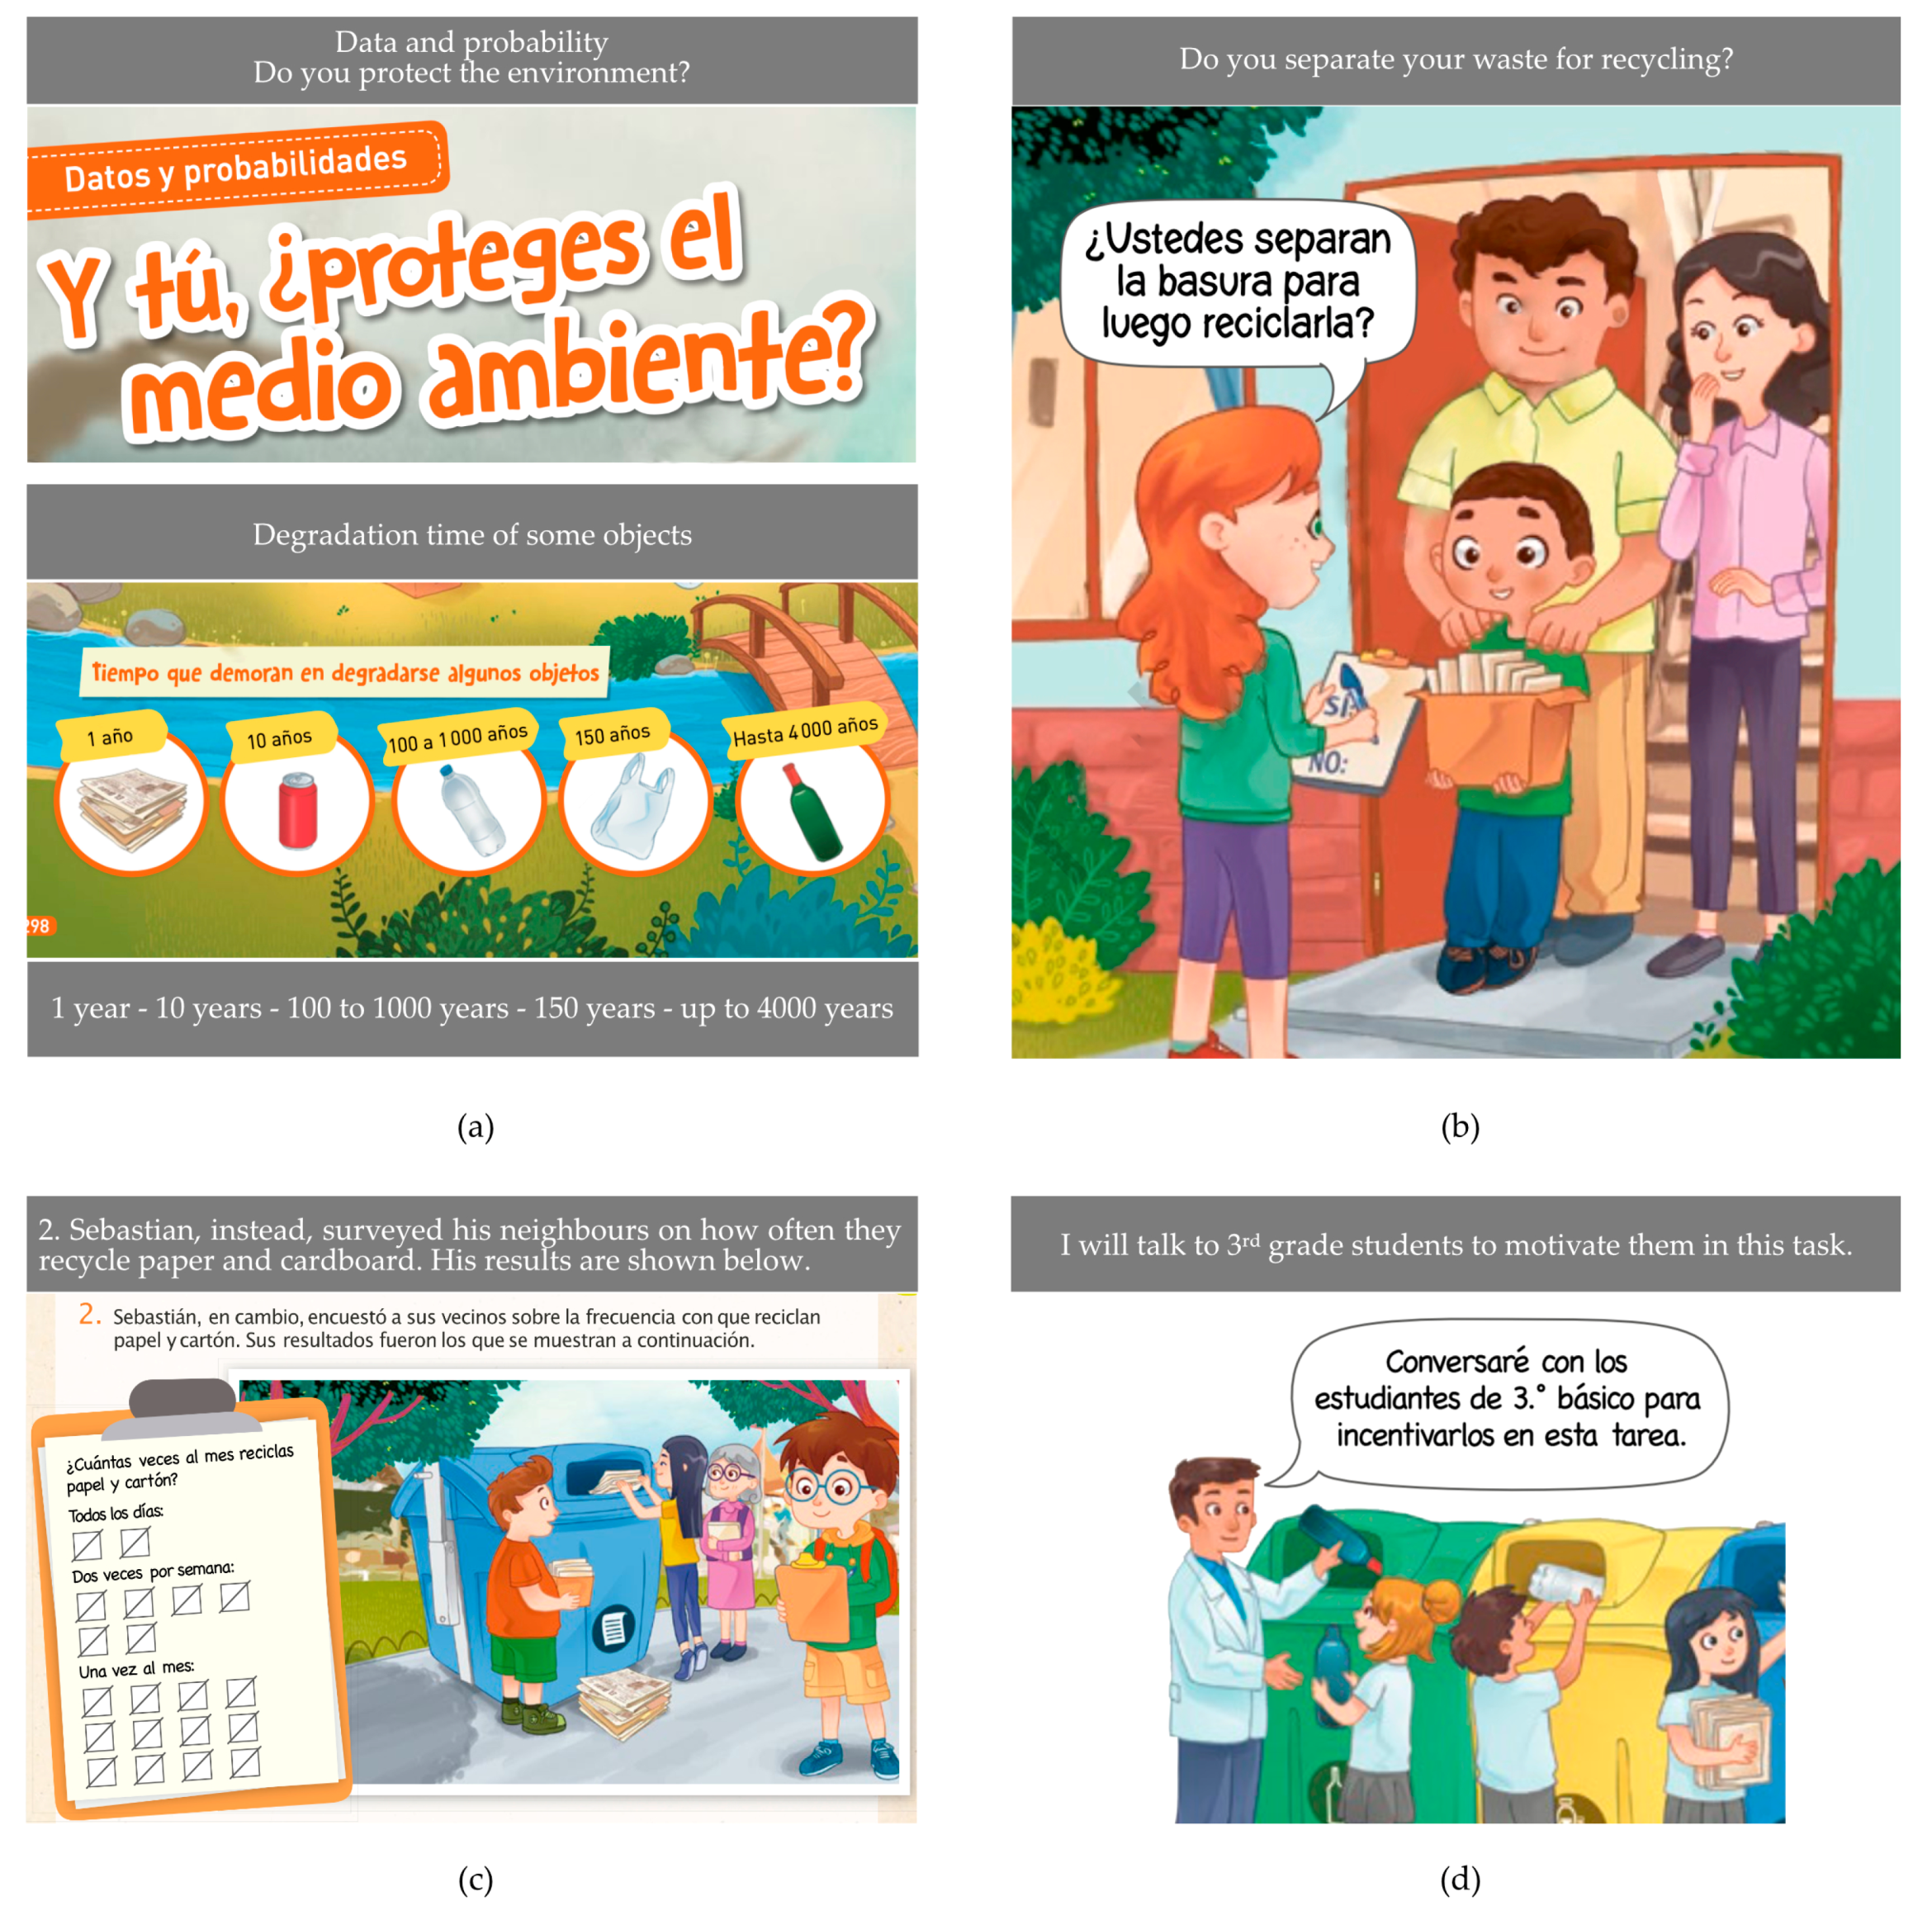
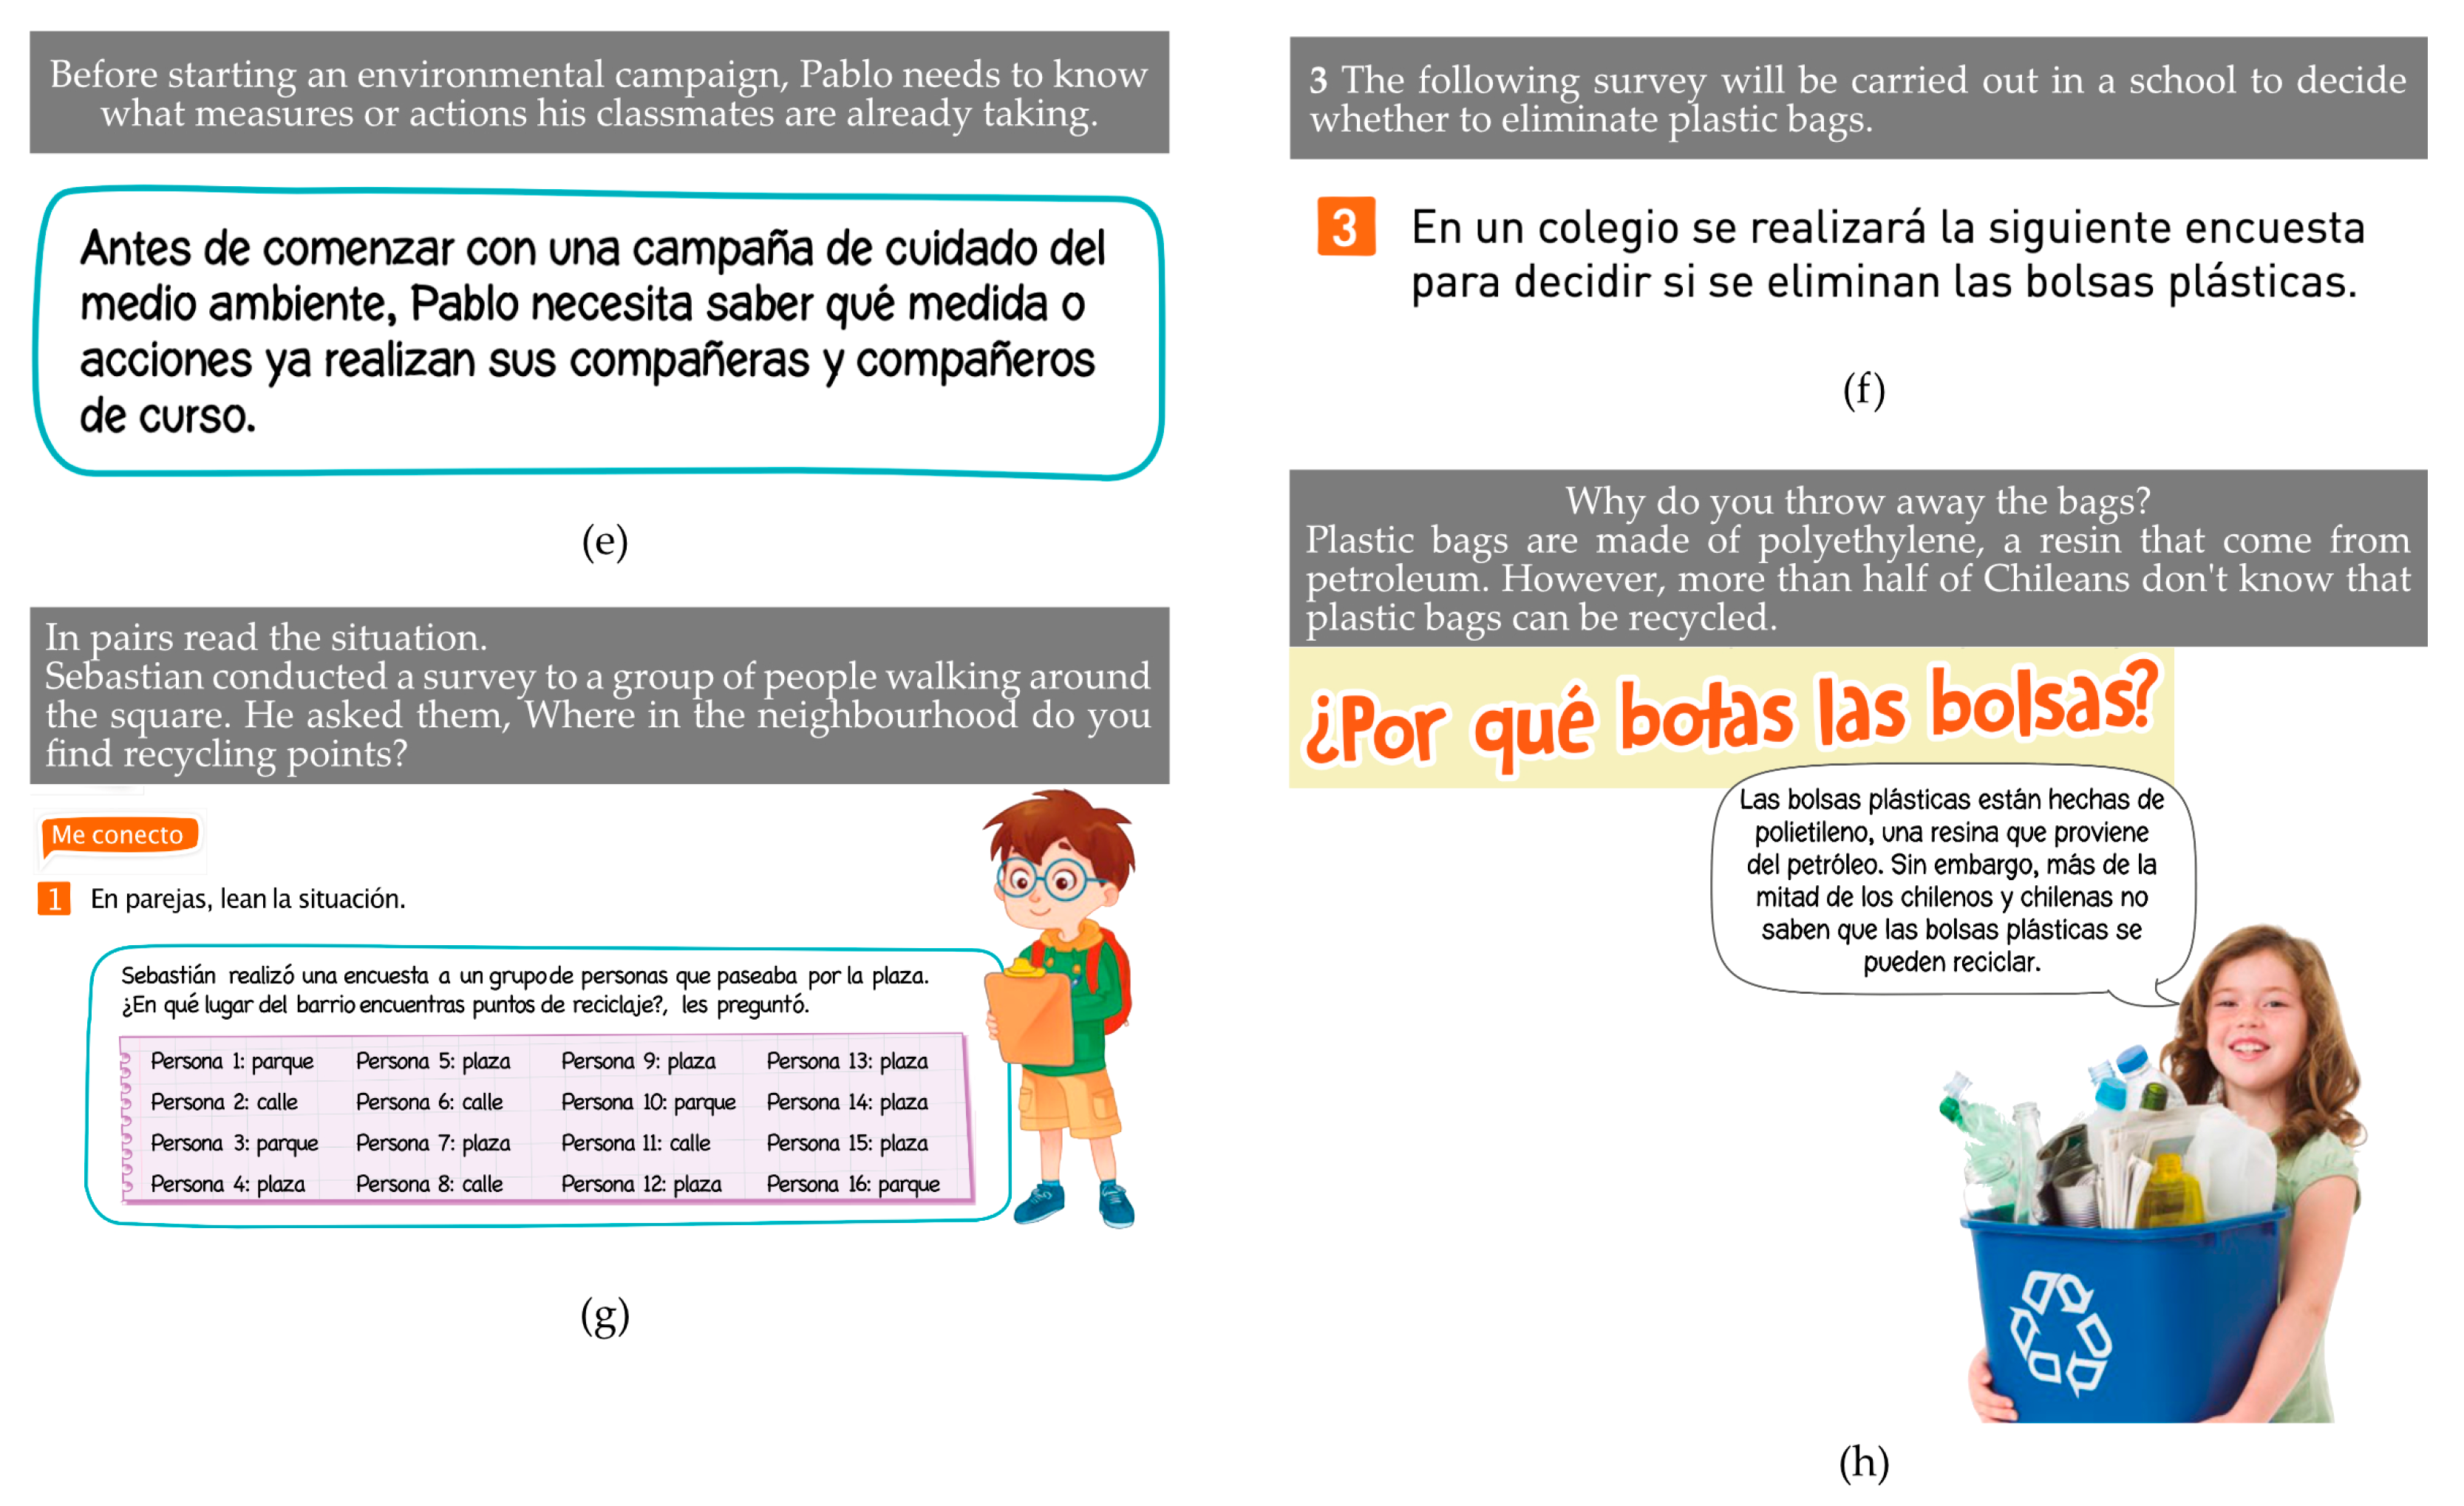
Figure 8 shows some tasks from lesson 1 from the 4th grade of primary school, which has been categorized as articulation level 2 because, despite referring to different aspects of recycling, it is not developed in a continuous way: throughout the same lesson, other situations or contexts not related to this aspect are worked on, such as favorite subject, sports workshops, Christmas bread, social networks, Rapanui language, and so forth. These topics and works are not linked to recycling, so the student develops a “discontinuous” work, which is why the lesson has not been categorized at level 3.
As it can be seen, the tasks in
Figure 8 allow students to focus their attention on acquiring knowledge about a context related to the SDG, using statistics as a tool, throughout various tasks of the lesson. In addition, in line with critical statistics, they promote actions to cause changes in family habits or school setting.
4.3. Cognitive Demand
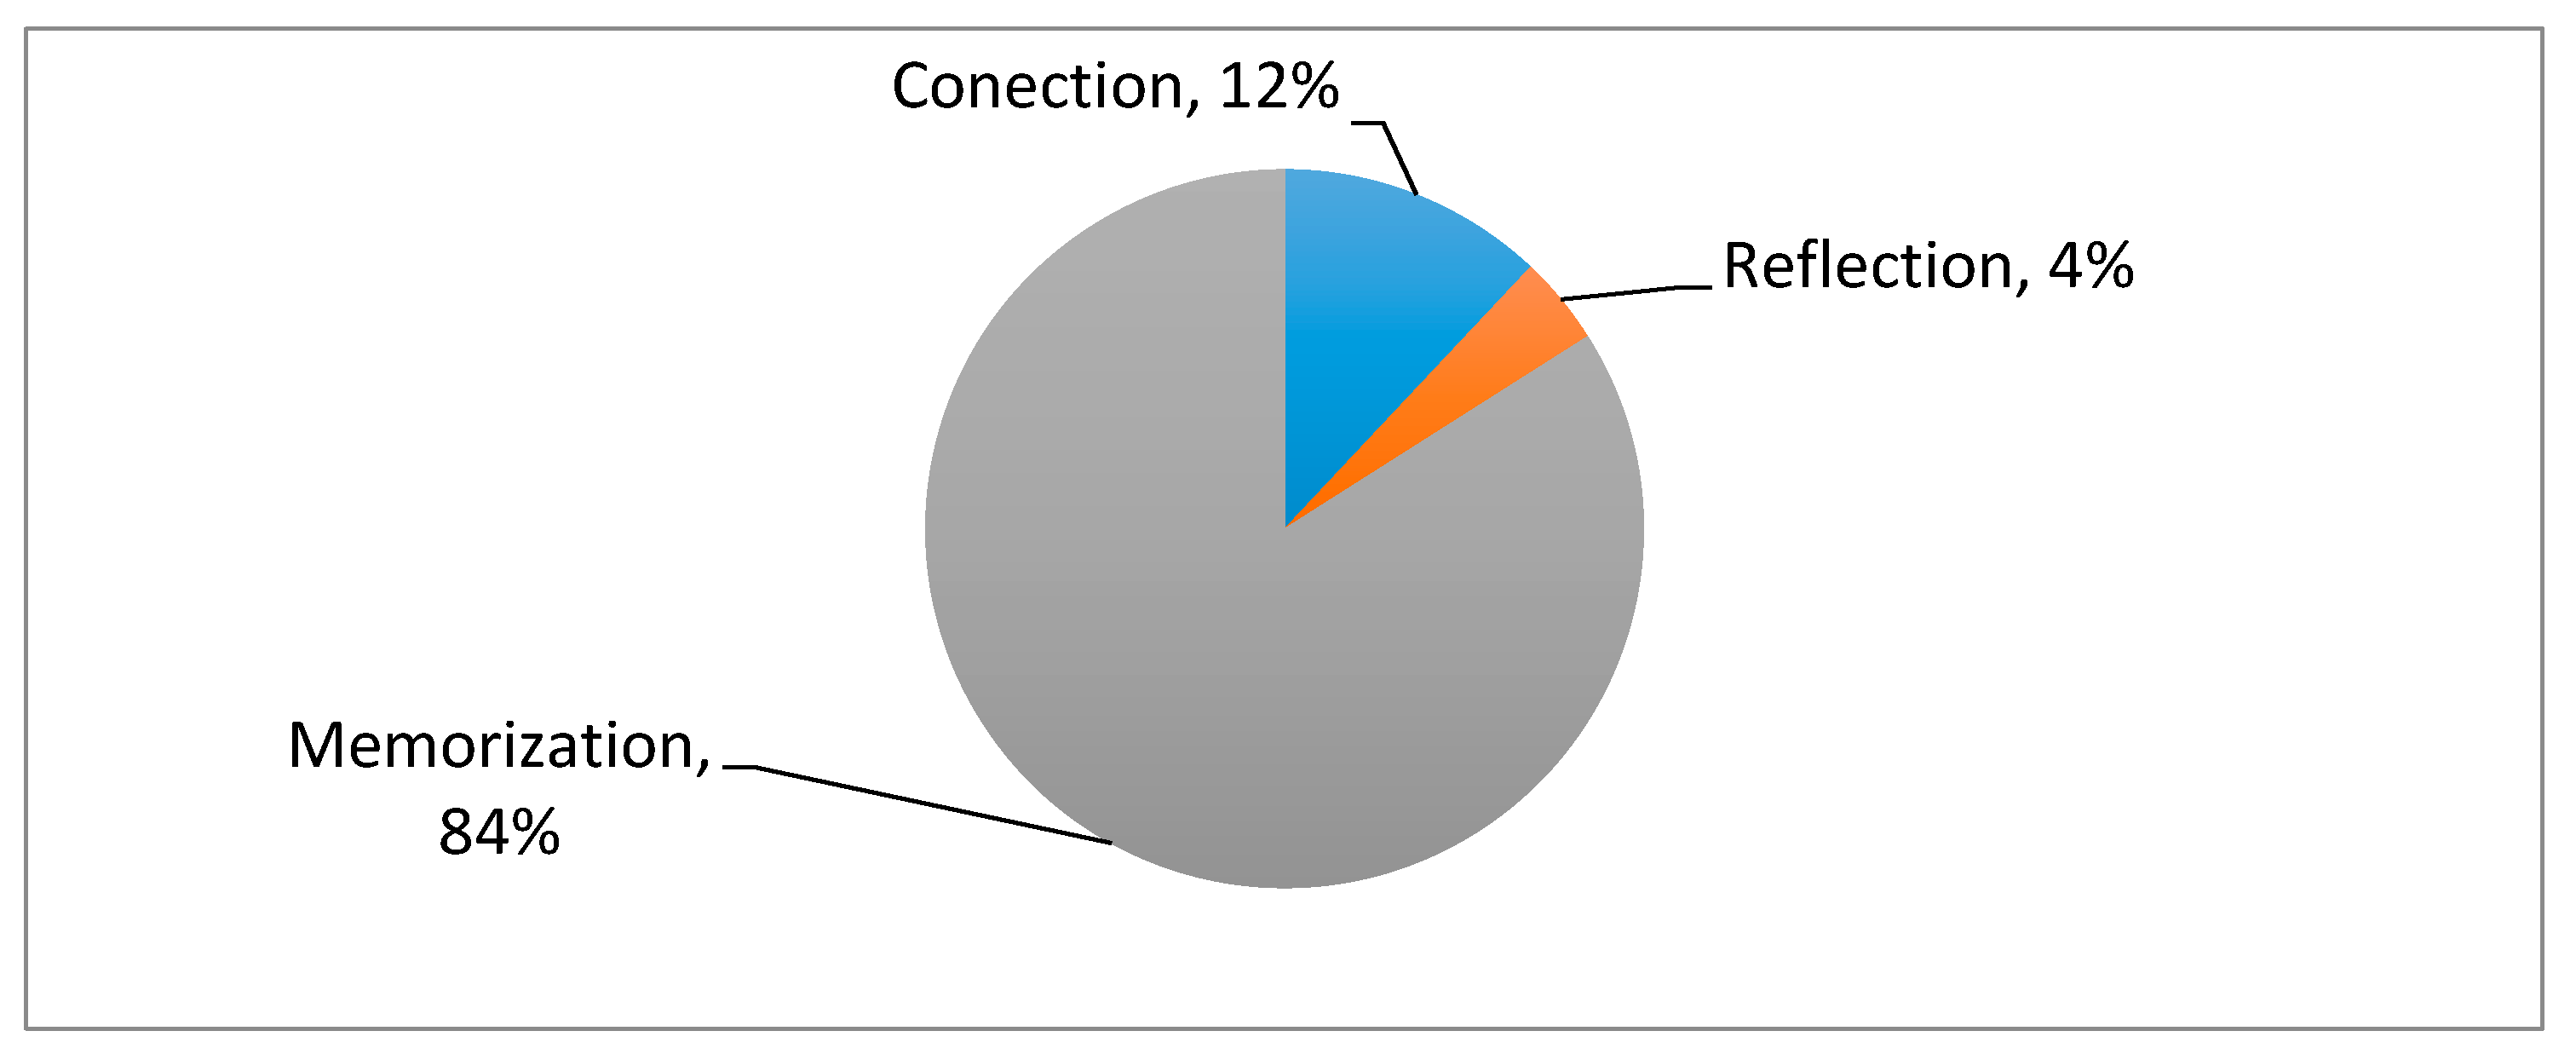
At all levels, except in 1st grade, tasks that are categorized within the memorization demand prevail (84%), that is, they are tasks that require direct application of the processes or knowledge previously exposed in the lesson (
Figure 9).
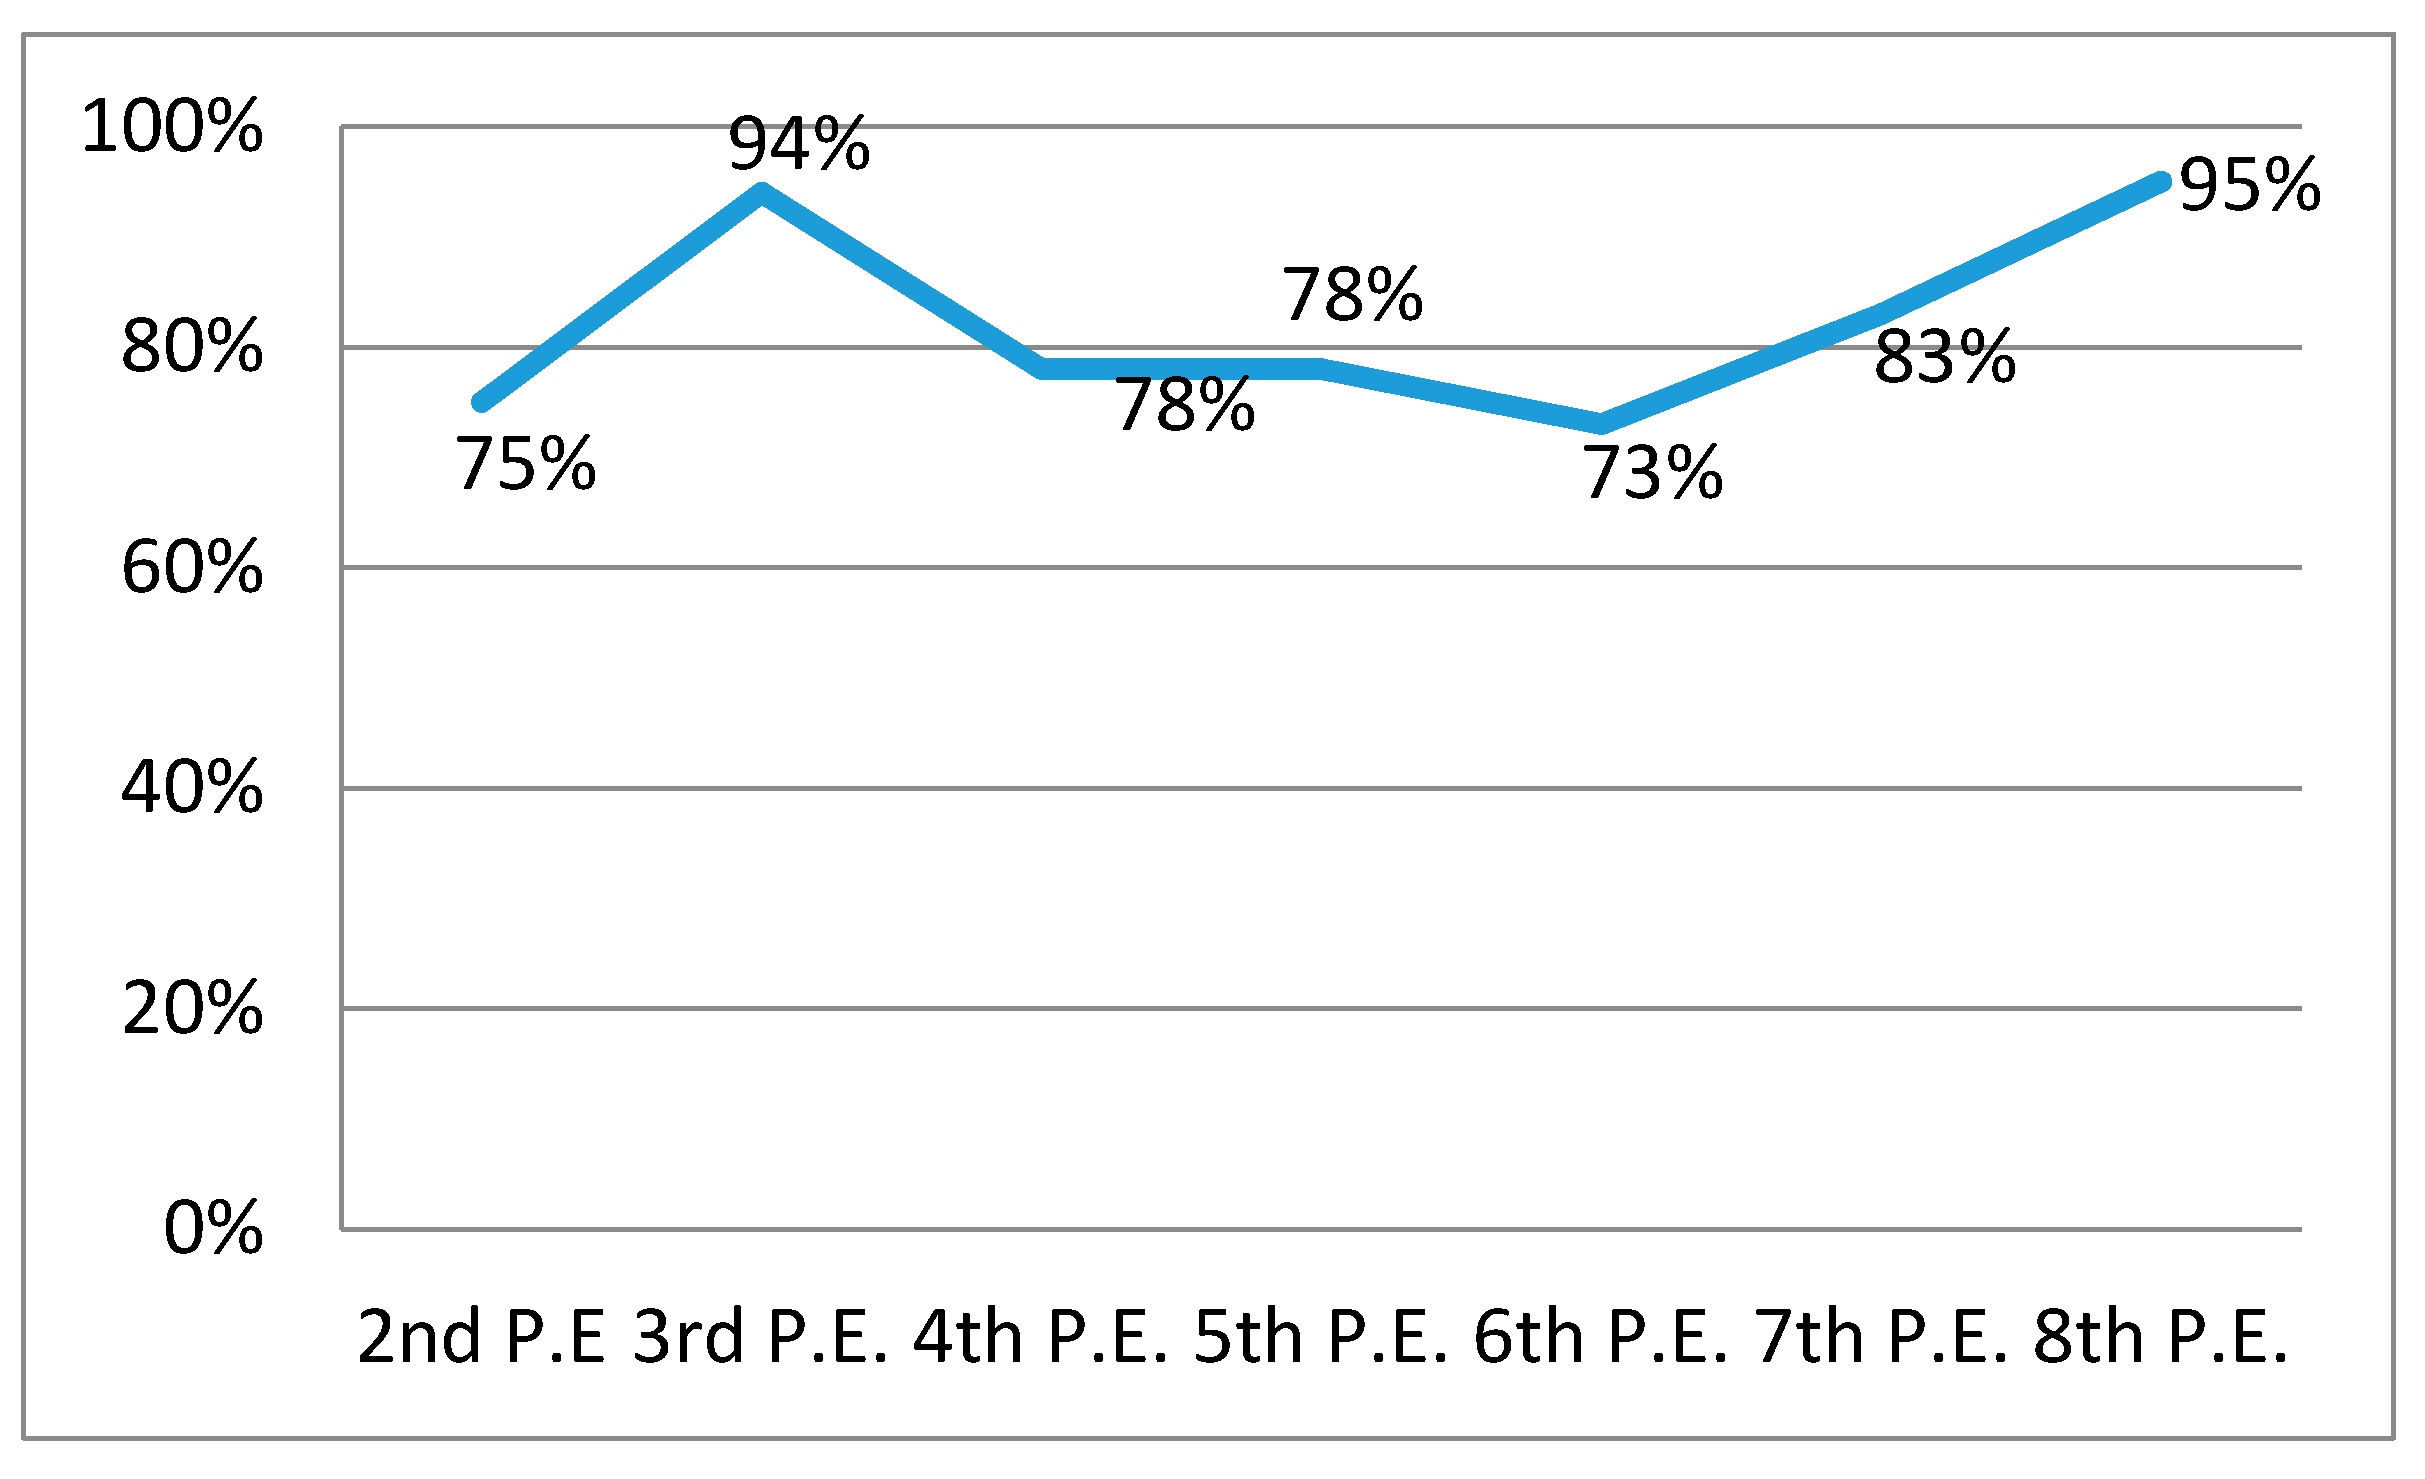
In
Figure 10, which shows the evolution of memorization demand along the different levels, this category represents more than 70% of the tasks offered in textbooks and that, from 6th grade increases reaching the same percentage in 8th grade as 3rd grade (95% of the tasks presented). These data show an approach to teaching statistics based on the use of processes and not on their application to solve problems and make decisions, which require a greater cognitive demand.
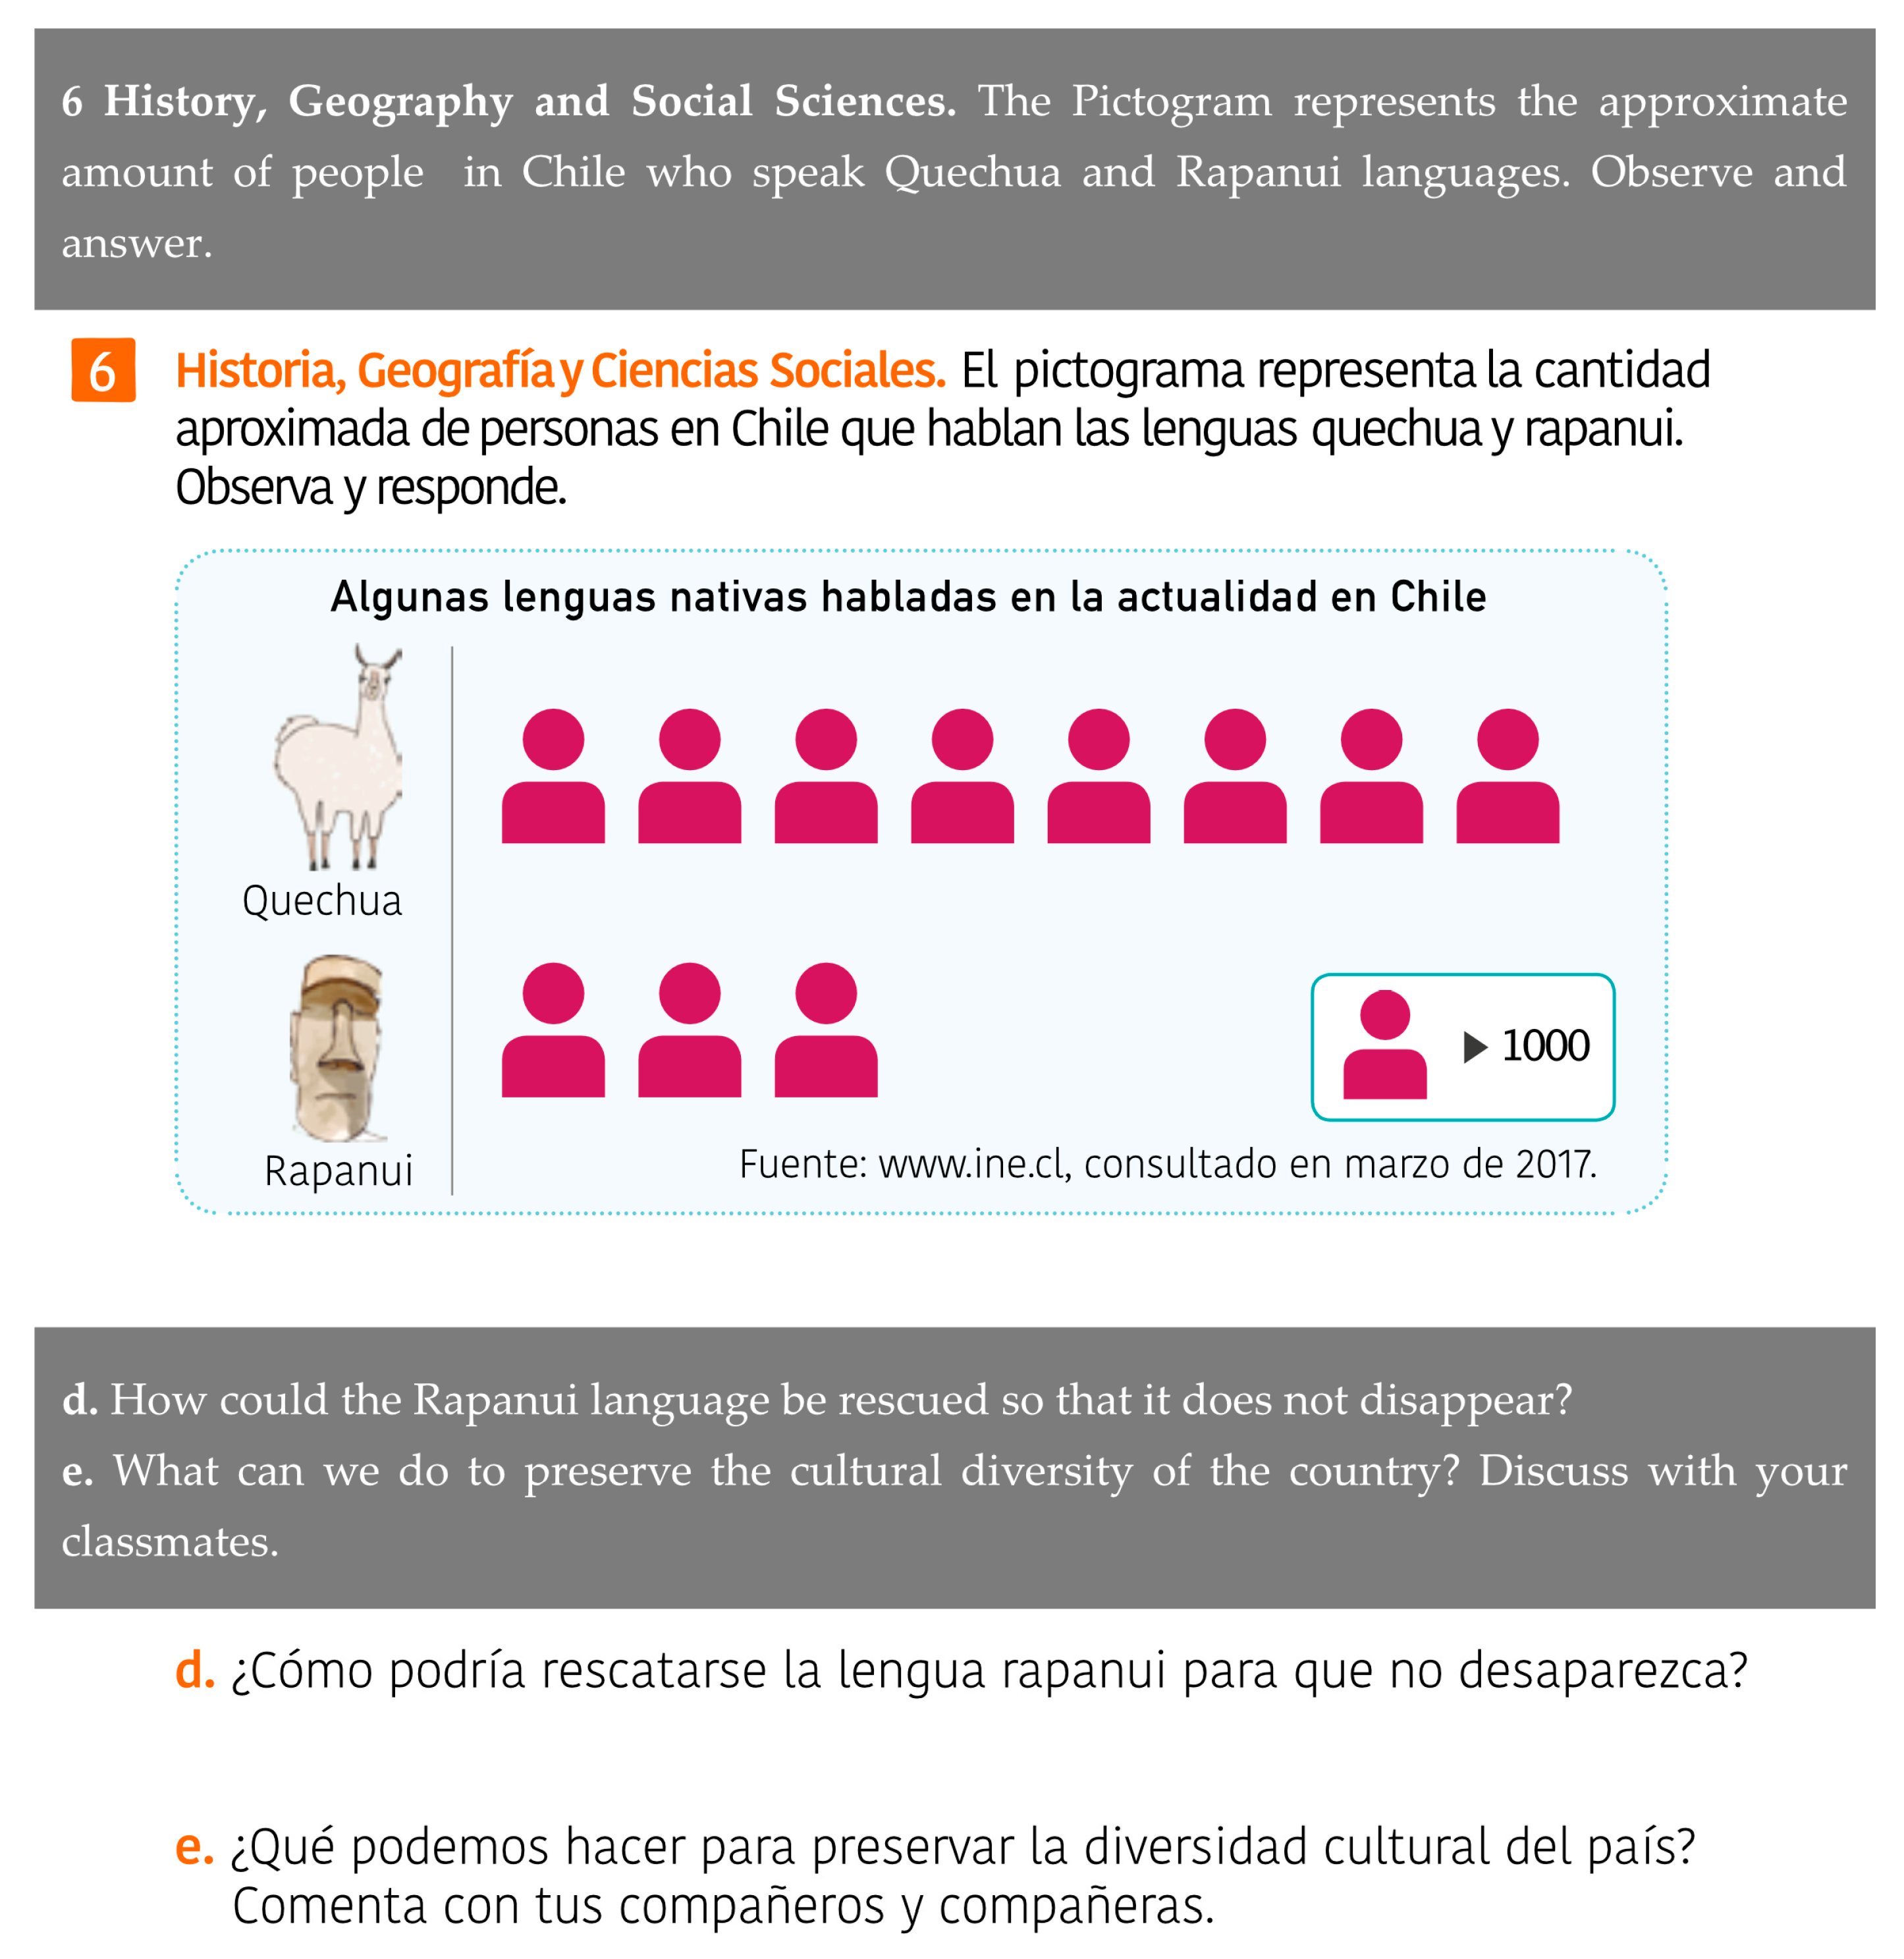
Few tasks fall into the categories of Connection or Reflection: the task in
Figure 11 shows an example of a Connection task, in which the student is asked to inquire about strategies to rescue the Rapanui language, so that he/she connects the statistical graph with the extinction of a language. The task in
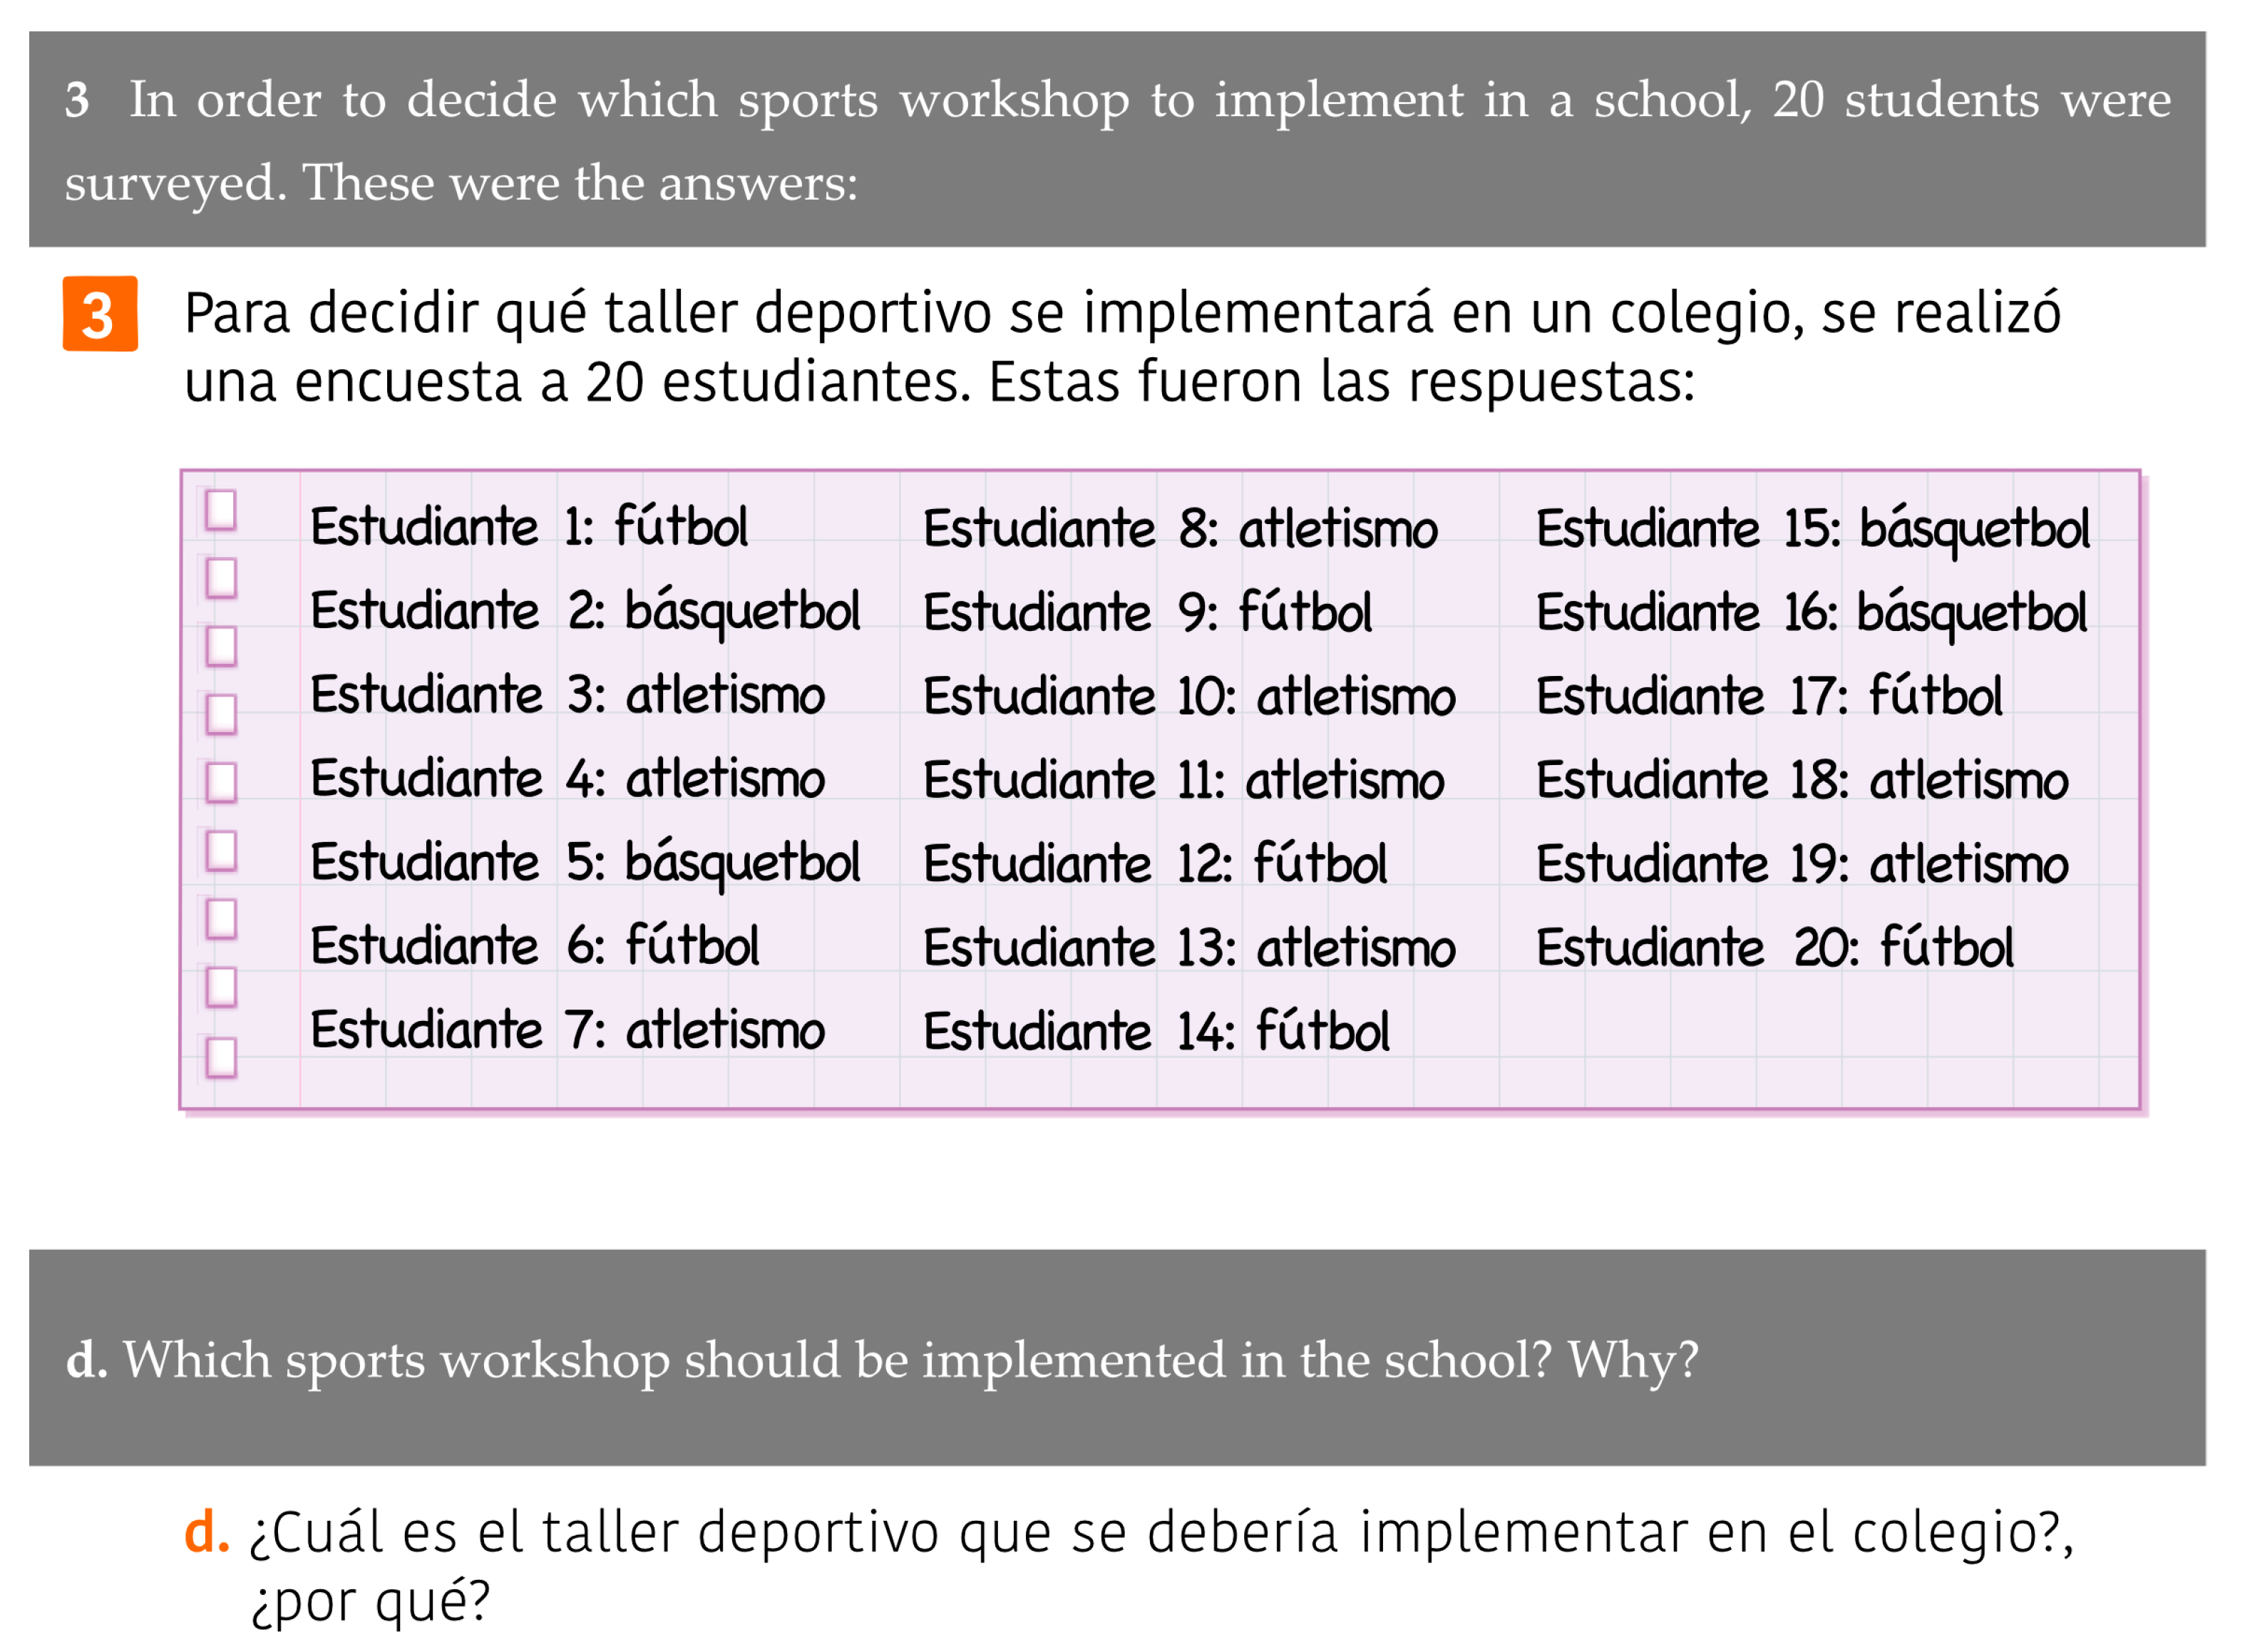
Figure 12, on the other hand, requires the student to make a decision about the sports workshop that the school should offer, using the tools that he/she knows, so it is considered cognitively demanding Reflection.
Regarding probability tasks, Memorization increases up to 92%. These data are especially striking, when chance and variability in daily life continually challenge us to make decisions, and many of these decisions require an analysis of the cases that may occur, that is, the development of probabilistic reasoning. In contrast, in textbooks it is simplified to the application of routine processes without connection to the setting and context.
4.4. Authenticity
This category has been analyzed understanding the lesson as a unit that promotes knowledge about statistics and probability and its use so that citizens are able to develop in our society. The form of analysis focused on the lesson as a unit and not on tasks, because analyzing whether a statistical task is authentic requires that it has a development that approaches the statistical investigative cycle (problem-plan-data-analysis-conclusions), which means that this task must develop several well-articulated tasks and that these integrate statistical tools necessary to reach the conclusion. The tasks that are proposed in the textbooks are not extensive enough to be able to develop this analysis.
In general, after a global analysis, we place most of the lessons in a fictitious category, since throughout the lesson the characteristics of authenticity with an ESD approach are not verified. We observe that the lessons of all levels report that they start from a plausible event or question in real life and, therefore, have these first characteristics of authenticity. But, during their development, in almost all the lessons, the information they handle does not use, as a rule, real data or that has been adapted to the level to which they are addressed. On many occasions, the purpose of the task does not address any of the SDGs or the tasks that are being suggested are not linked to the question or the data to be analyzed in the proposed event. In addition, no specific data are used for the presented task, that is, there are many types of data throughout the lesson, but it has not been considered which ones give an answer to the initial question or which integrate the whole lesson, which means that one cannot speak of specificity of data.
The only lessons that are not considered fictitious are 4th Grade Lesson 1 (Gathering Information and Communicating Conclusions), 7th Grade Lesson 2 (Organizing and Representing Data), and 8th Grade Lesson 1 on Statistics (out of a total of 19 lessons). These are three statistics lessons that are classified as believable since they verify the event-question-information aspects. This means that the lessons offer a topic close to an SDG, pose probing questions appropriate to the topic raised and use real or suitable data for the planned analysis and the level at which they are addressed.
As an example,
Table 3 shows the characteristics of authenticity verified by 4th grade lesson 1 of primary school that lead to a
believable categorization: the
purpose is not verified, since the task is not designed for the development of SDGs, so it is not an achievement target, and neither is the origin of the data analyzed, which would give rise to questioning the
specificity of the data by the students.
Authenticity not only informs the lesson in terms of the development of the SDG and the role of statistics and probability as an instrument of knowledge and understanding of these objectives. Knowing the characteristics of authenticity that are not verified, also informs about the tasks necessary to develop ESD, while achieving an authentic lesson or task. From the analysis of
Table 3, it is observed that lesson 1 focuses on the SDG-12, analyzing the setting in which the students find themselves, while asking questions about the origin and relevance of the data to answer the question initially posed.
5. Final Considerations
In this study, the statistical and probability tasks to educate for sustainability from a collection of primary education mathematics textbooks have been analyzed. To support this analysis, it has been considered that, on the one hand, ESD requires a change in the educational approach currently being developed, assuming that its main goal is to train citizens who are literate for sustainability, aware that their decisions affect the sustainability of the world in which we live [
11]; and, on the other hand, that knowledge offered by Stochastic Education allows the incorporation of tools, based on what is subject to chance and statistical analysis, both to understand relevant aspects of our society as a whole and to make conscious decisions about the impact of our individual actions [
2]. From this double perspective, as indicated, Stochastic Education to Educate for Sustainability promotes that everyone can develop as citizens literate in statistics and probability.
Additionally, it has been assumed that educating society from this double perspective requires that we have previously trained our teachers, as well as having analyzed the sources they use to develop their teaching. For this reason, we have studied the sustainability contexts, articulation levels, cognitive demand and the authenticity of the statistical and probability tasks present in eight Chilean Primary Education textbooks because, not by accident, books are the main resources teachers use.
The first research question asks about the topics that textbooks address and if they promote EDS by contexts close to the environment. Among the main findings, the low presence of sustainability contexts stand out. In statistics tasks, the high percentage of tasks that consider insignificant contexts or no context (46%) shows that statistics teaching is far from reality and, in many cases, it lacks sense for students; while, in probability tasks, 95% refer to insignificant contexts, mainly focused on dice throwing, coin tossing, roulette spinning, and so forth.
We know that “tasks in non-real contexts continue to promote the division between the world and the school, and students continue to believe that school knowledge is only useful and functional at school and that the world needs another kind of knowledge” [
15] (p. 383). The importance of incorporating close and meaningful contexts for students, which allow them to develop the sense of data, is something that has been strongly promoted by different authors and international organizations [
24,
46] because “what matters is not the data, but the answers and the knowledge that we seek in the data” [
47] (p. 4). This reflection is necessary, as it could be a different path that develops a connection with the real world. We also know that when tasks use the context of social phenomena, statistical and technological knowledge is the protagonist when reflecting on social and cultural concerns [
48]. Thus, for Stochastic Education to develop an approach towards ESD, it is necessary that context becomes a learning source [
26], and this is achieved if the statistical tool develops the investigative cycle [
25] around the selected SDG.
Regarding the second research question, about the levels of articulation of stochastic education and the achievement of the SDGs, the analysis of the levels of articulation has brought us closer to how statistical thinking and the development of the SDGs are combined. In this sense, in this study we have been able to observe that the lessons are not articulated to develop any of the SDGs, except for three out of the 19 analyzed. This confirms that they are not ESD-oriented textbooks but, also, the study has shown that the topics used have no place in any of the SDGs but are rather topics with little interest for the globalized social context in which we are currently located. From this perspective, and in line with the UNESCO [
11] recommendations regarding ESD, it is urgent that we review the topics that are developed in the classrooms and connect them with those of worldwide concern. Without this exercise in connection with what the international community has analyzed as relevant, we may be generating a citizenry that is not very critical of what is certainly important to everyone.
On the other hand, regarding cognitive demand, the analysis carried out has shown that there is a clear predominance of memorization tasks, showing that the teaching of statistics and probability is mainly focused on procedural aspects and the direct application of formulas and calculations. This undoubtedly limits the possibility of perceiving statistics and probability as useful tools for decision-making in situations of uncertainty and with a large amount of data.
Finally, in relation to the authenticity of the task, we were interested in knowing if the tasks verify the characteristics of authenticity described in Vasquez and García-Alonso [
5]. This characteristic of the analysis has focused on observing whether the proposed tasks use contexts close to the SDGs (context) in an articulated way throughout the lesson (levels of articulation) and with an optimal level of demand to students (cognitive demand). The analysis shows that most of the lessons fall into the
fictitious category, which indicates that there are still aspects to be integrated to align teaching to ESD.
6. Recommendations and Future Implications
This article analyzes the Primary Education textbooks used by the majority of Chilean students. The Organisation for Economic Cooperation and Development (OECD) has selected the ceiling to achieve the SDGs in 2030, and even with textbooks published from 2016, we observe that they do not incorporate the aspects that an ESD should develop. In that way, the contexts and authenticity of the proposed tasks, for the most part, do not connect to any of the SDGs and it appears an algorithmic development of low cognitive demand that prevail over decision-making and awareness of their environment.
The characteristics used in the analysis developed in this paper facilitate, not only their approach to ESD in textbooks, but also provides the gaps that should be covered to achieve an ESD. Therefore, it offers clues about what weaknesses the analyzed tasks show and where we can improve in the sense to achieve an ESD.
We consider that these characteristics also offer criteria to the educational institutions and educational policy when they select textbooks that promote ESD and, consequently, they try to develop the SDGs.
And finally, an analysis of these characteristics also contributes to the fact that active teachers and prospective teachers have criteria to be able make a good selection of tasks already prepared or be able to design tasks that promote an ESD. We consider that these characteristics may be useful for statistical and probability training programs with a focus on ESD.
7. Limitations of this Study
A limitation of our work is that the analysis is carried out on textbooks and, for that reason, we have no information about how the teachers make their selection of the tasks in the textbooks. In this way, once the teacher selects the Stochastic Education lesson, we neither have any information about whether he follows all the tasks shown in the lesson or if he selects some of the tasks, and which criteria he uses to do so. We also do not know if, throughout Primary Education, Stochastic Education is developed at all educational levels, or maybe if there are some units that the teacher does not develop.
Another limitation is that the results presented here are local, since they are limited to Chile. In this sense, it is necessary to know whether these results should be extended to other countries.
The analysis of these four dimensions together (context-articulation levels-cognitive demand-authenticity) has provided a deep and compact vision of the lessons and tasks of statistics and probability offered by the collection of textbooks analyzed with respect to the development of a citizenship literate for sustainability. Although the data obtained are not optimistic, the four dimensions considered for the analysis [
5] are a roadmap for teachers about the characteristics that new designs and proposals for stochastic education should incorporate to educate for sustainability.
In conclusion, the textbooks analyzed are not aligned with ESD, since our data confirm that awareness and work around the closest settings of different SDGs, mentioned by UNESCO, are not fostered. For this reason, we want to insist on the need to reorient the teaching of statistics and probability in the school classroom, leaving aside the algorithmizing of its teaching to move towards an approach focused on the training of citizens educated for sustainability, with critical thinking that allows them to make informed decisions. For this, it is advisable to design tasks that incorporate critical aspects of society “must also include the development of students in the sense of empowerment in a way that enables them to use statistics to” respond “or change the world” [
30] (paragraph 9). Therefore, according to Vásquez [
3], it is imperative to move towards a stochastic education to educate for sustainability, focused on addressing problems from real and local contexts linked to the SDGs, with the purpose of empowering students to reflect on issues related to sustainable development.


