
Influence of Fine Recycled Concrete Powder on the Compressive Strength of Self-Compacting Concrete (SCC) Using Artificial Neural Network

 ,
,  ,
,  ,
, 
Abstract
1. Introduction
2. Neural Network Approach
2.1. Basic Principles
2.2. Collected Experimental Data Set
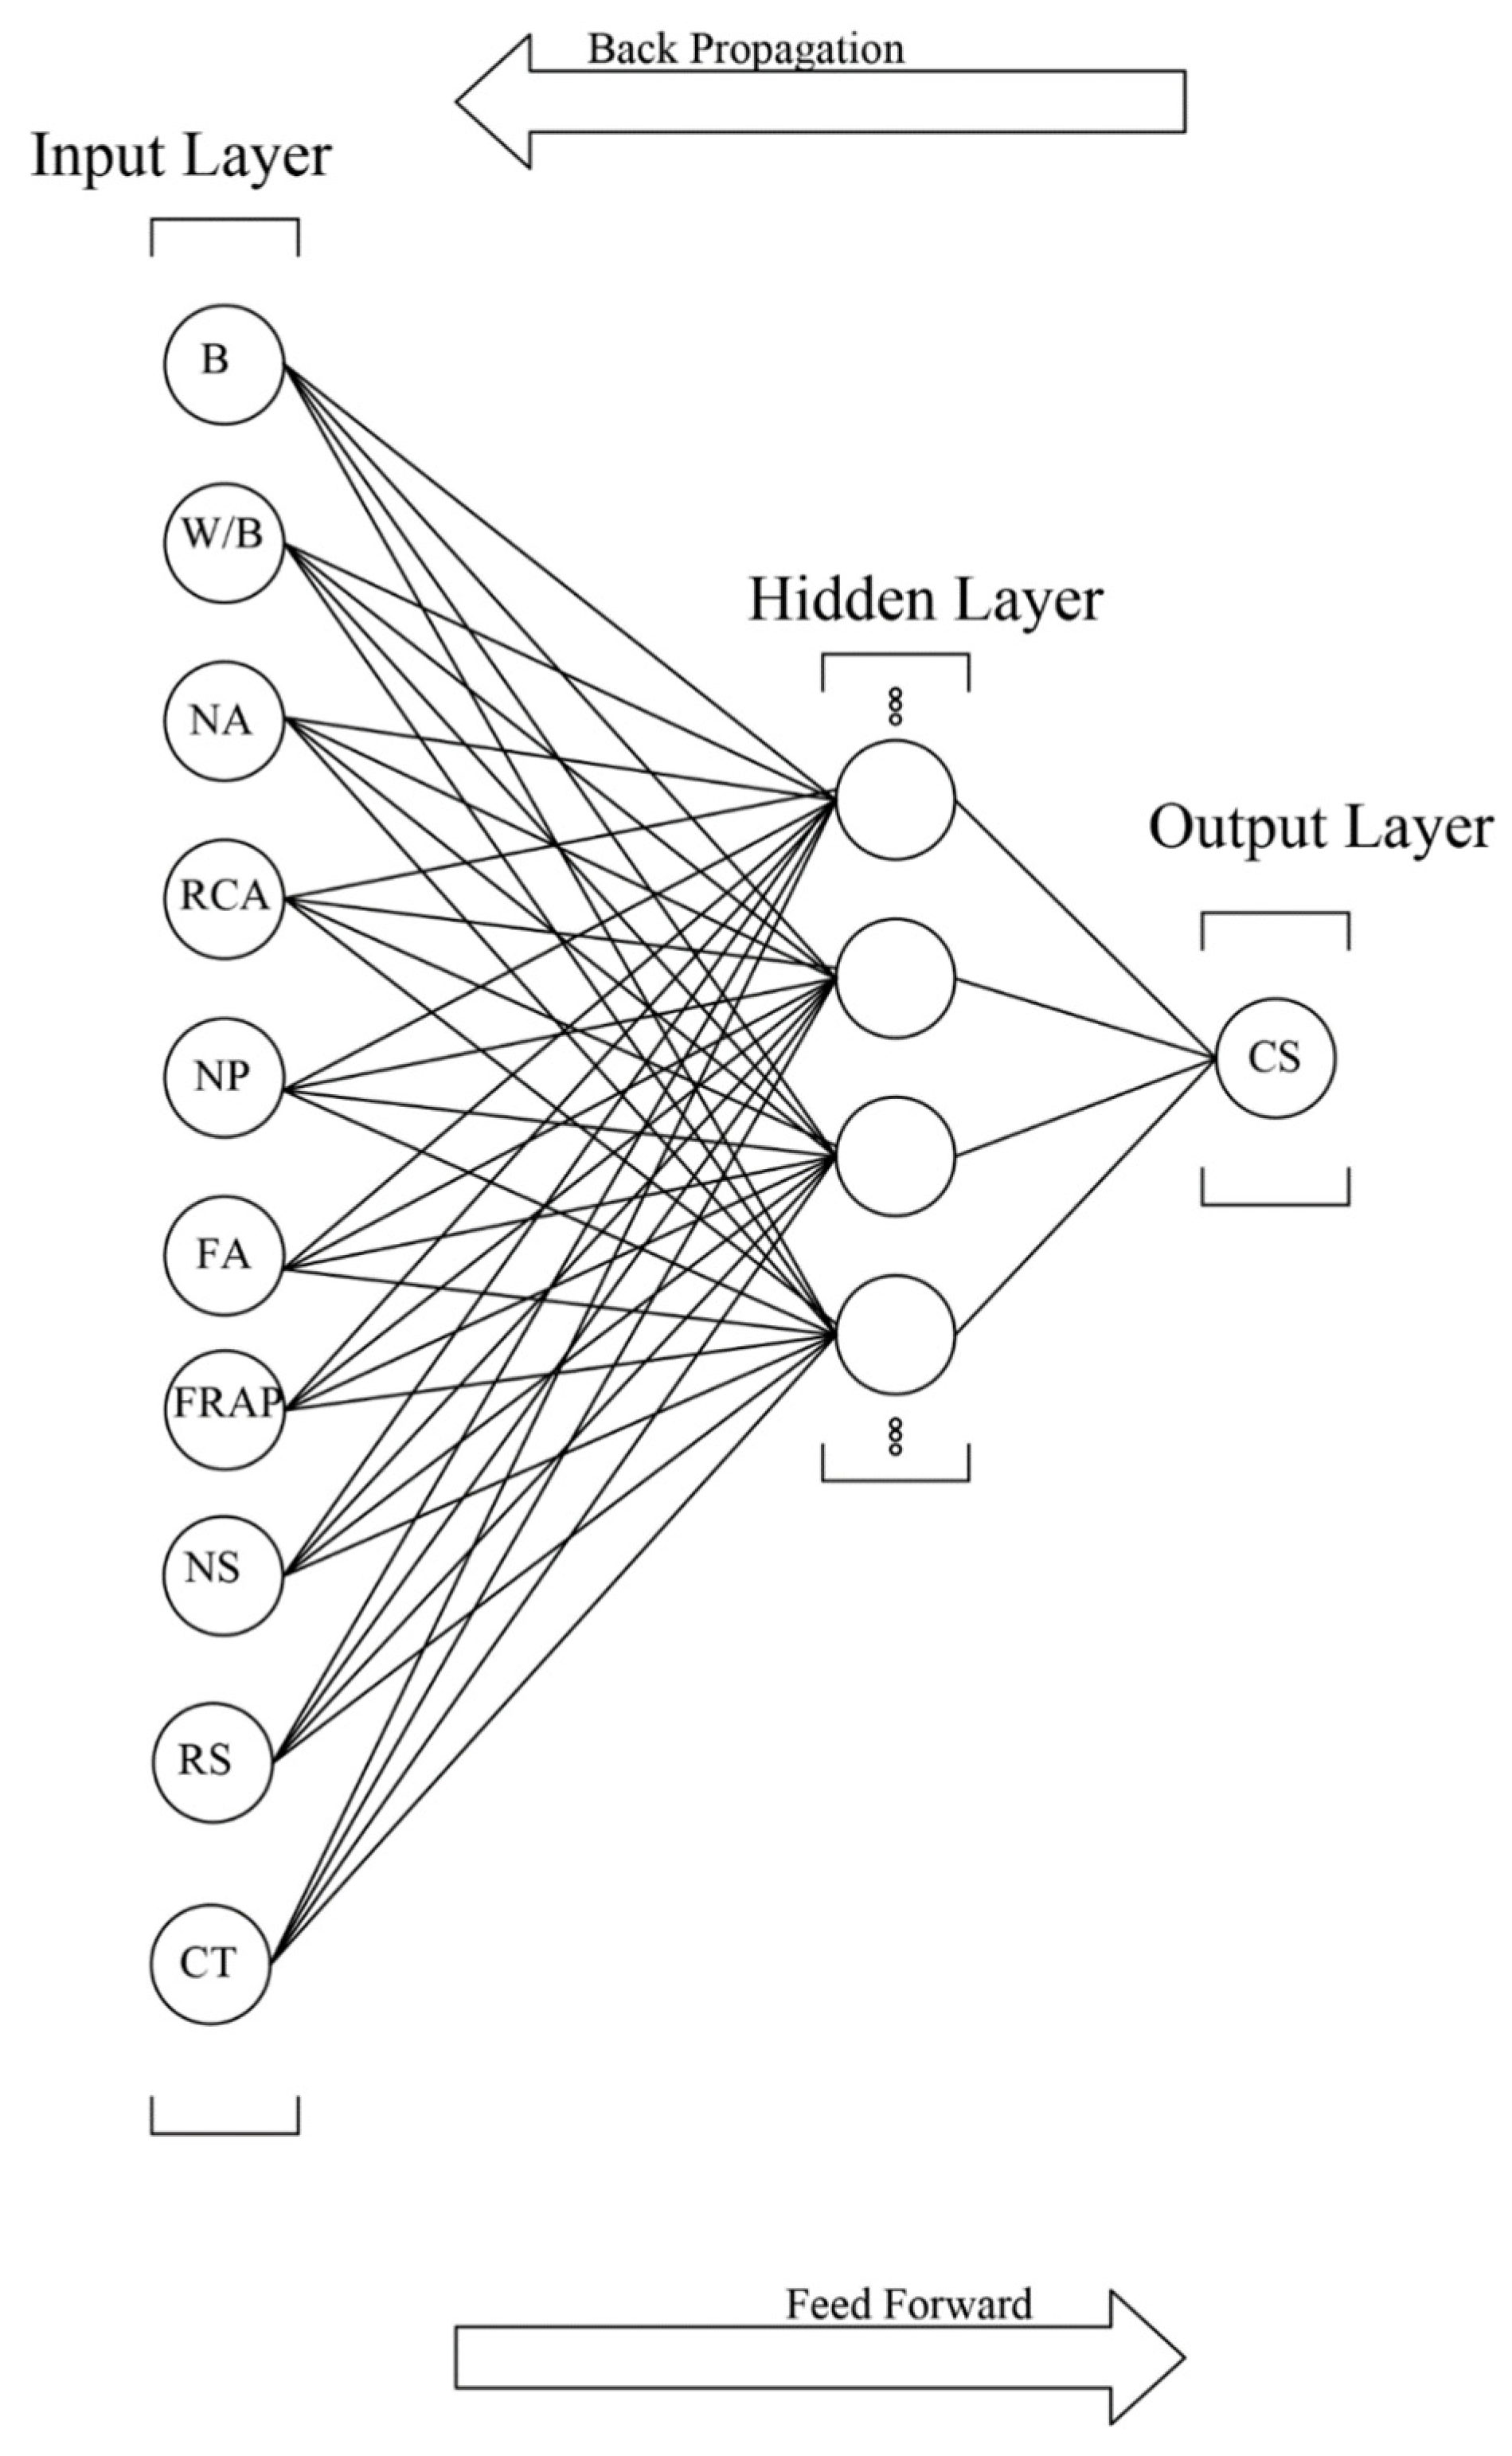
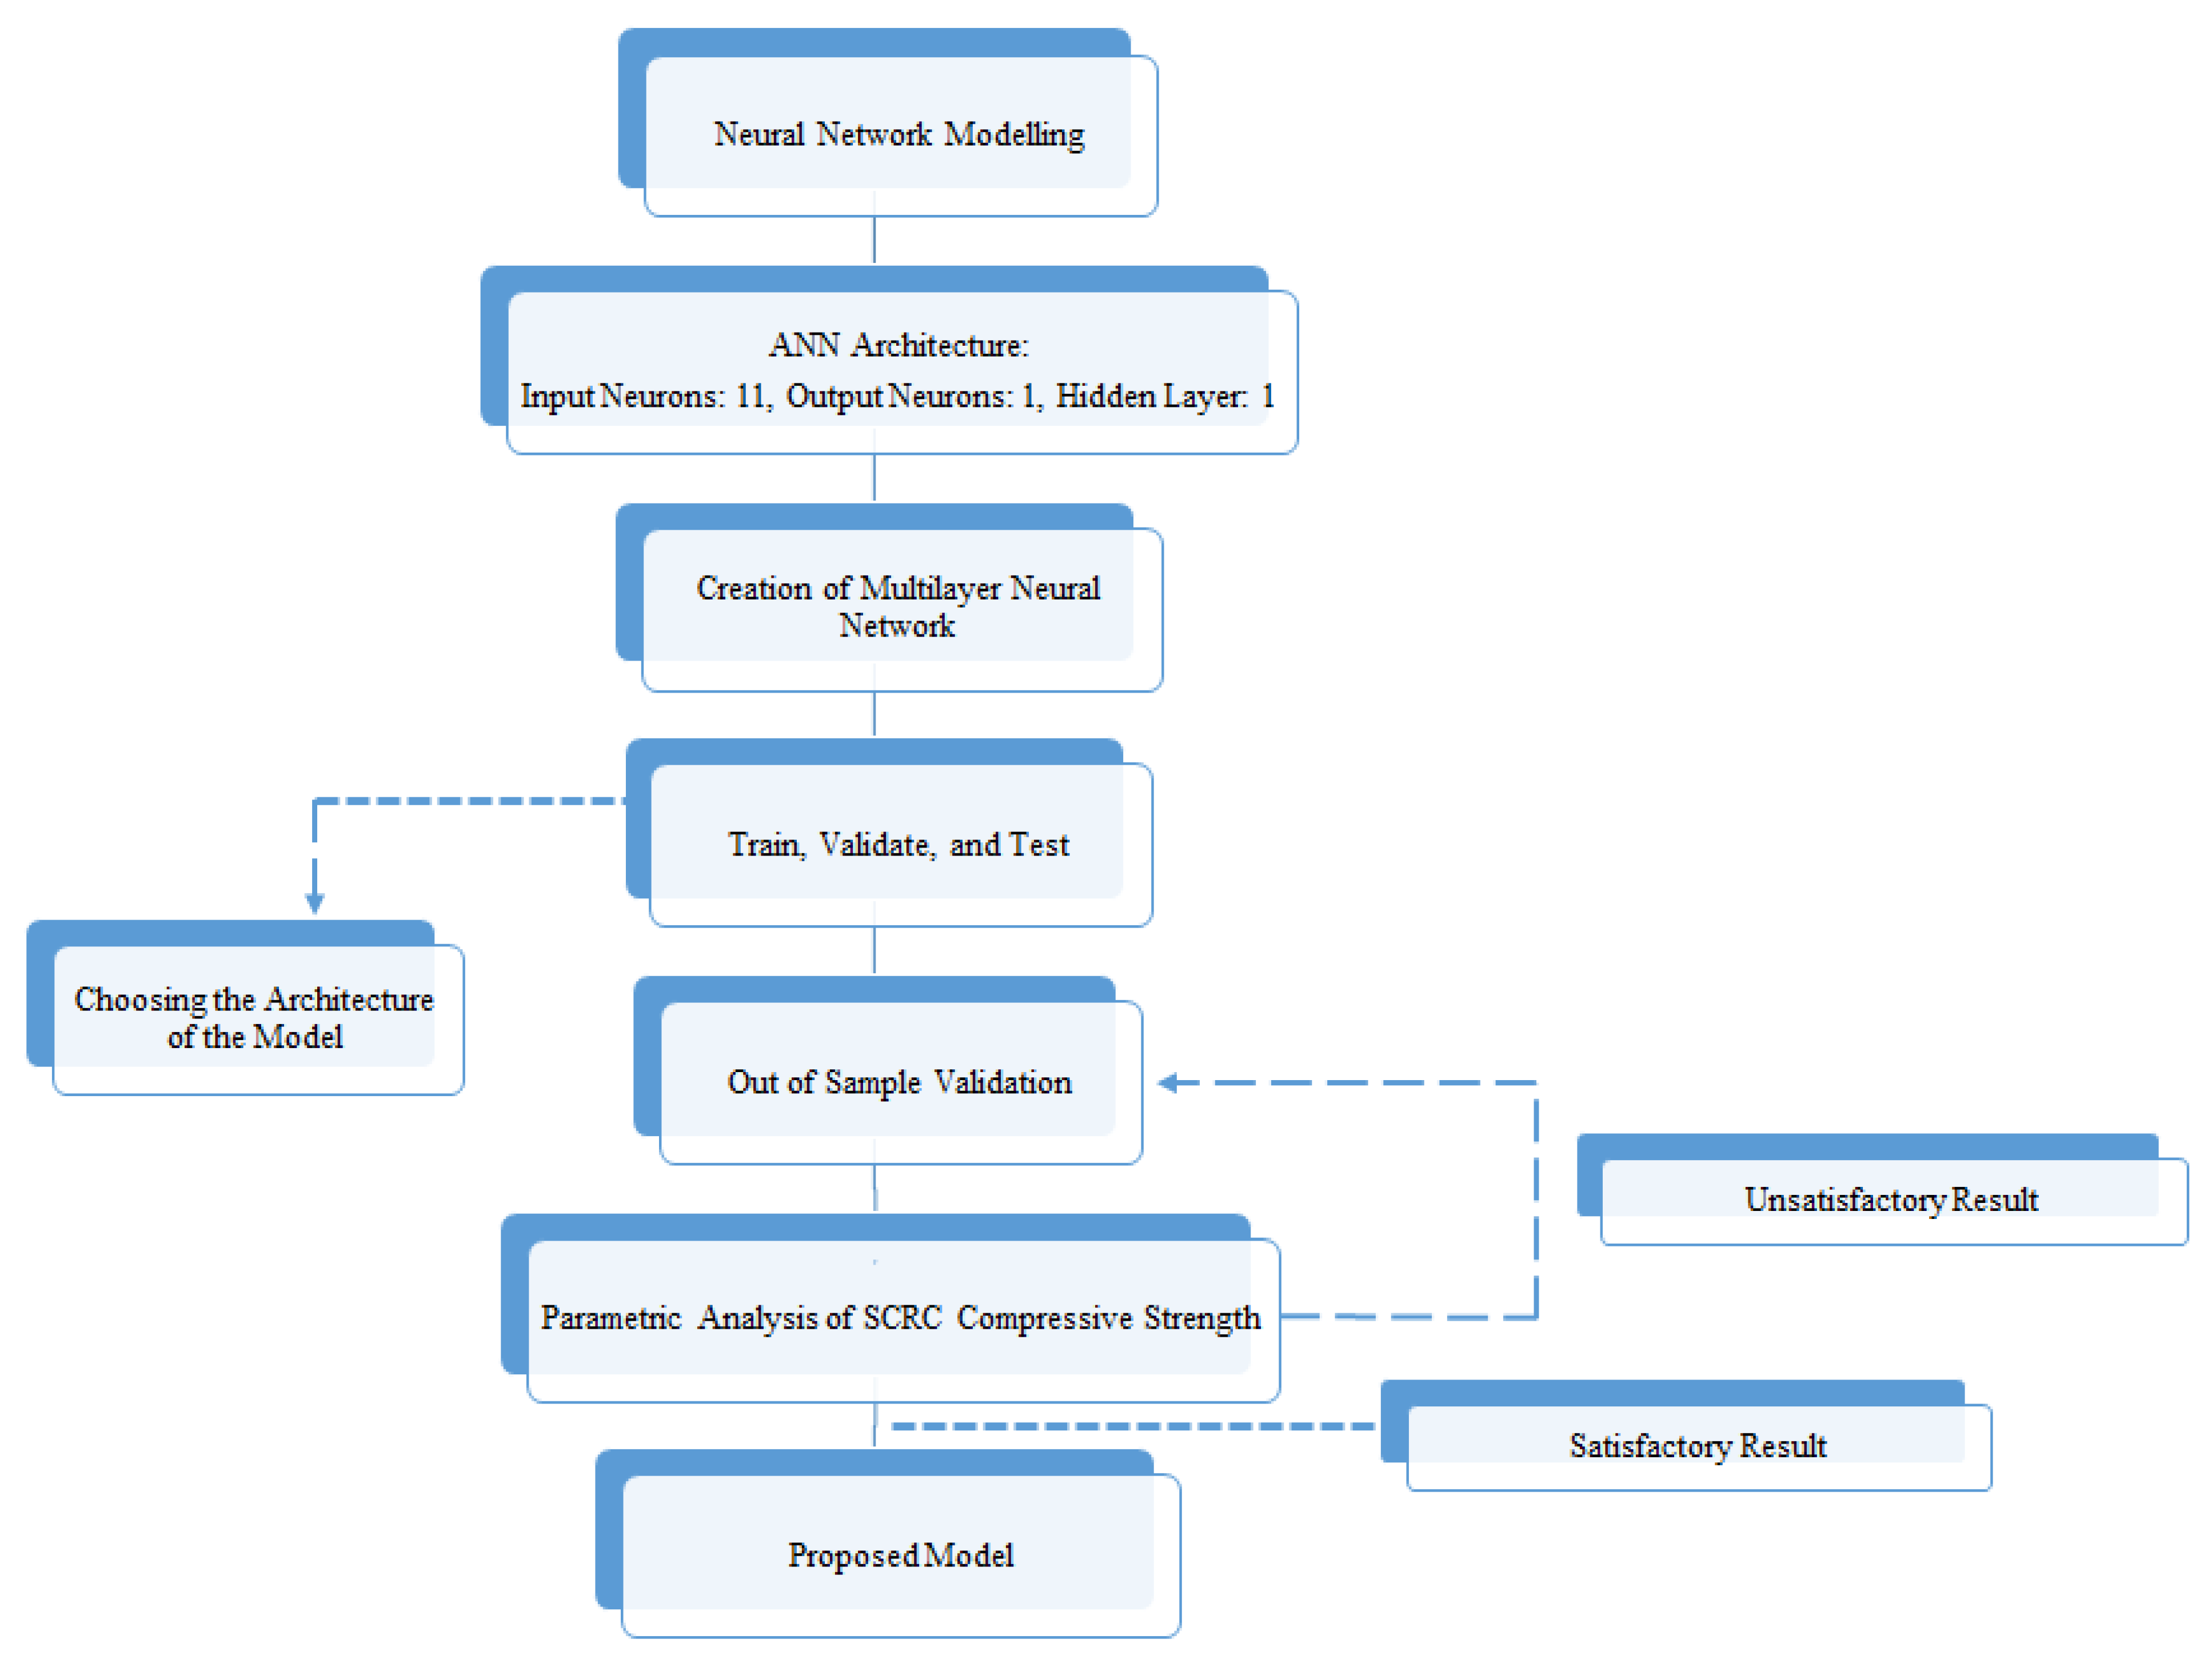
2.3. Proposed ANN Model
3. Results and Discussion
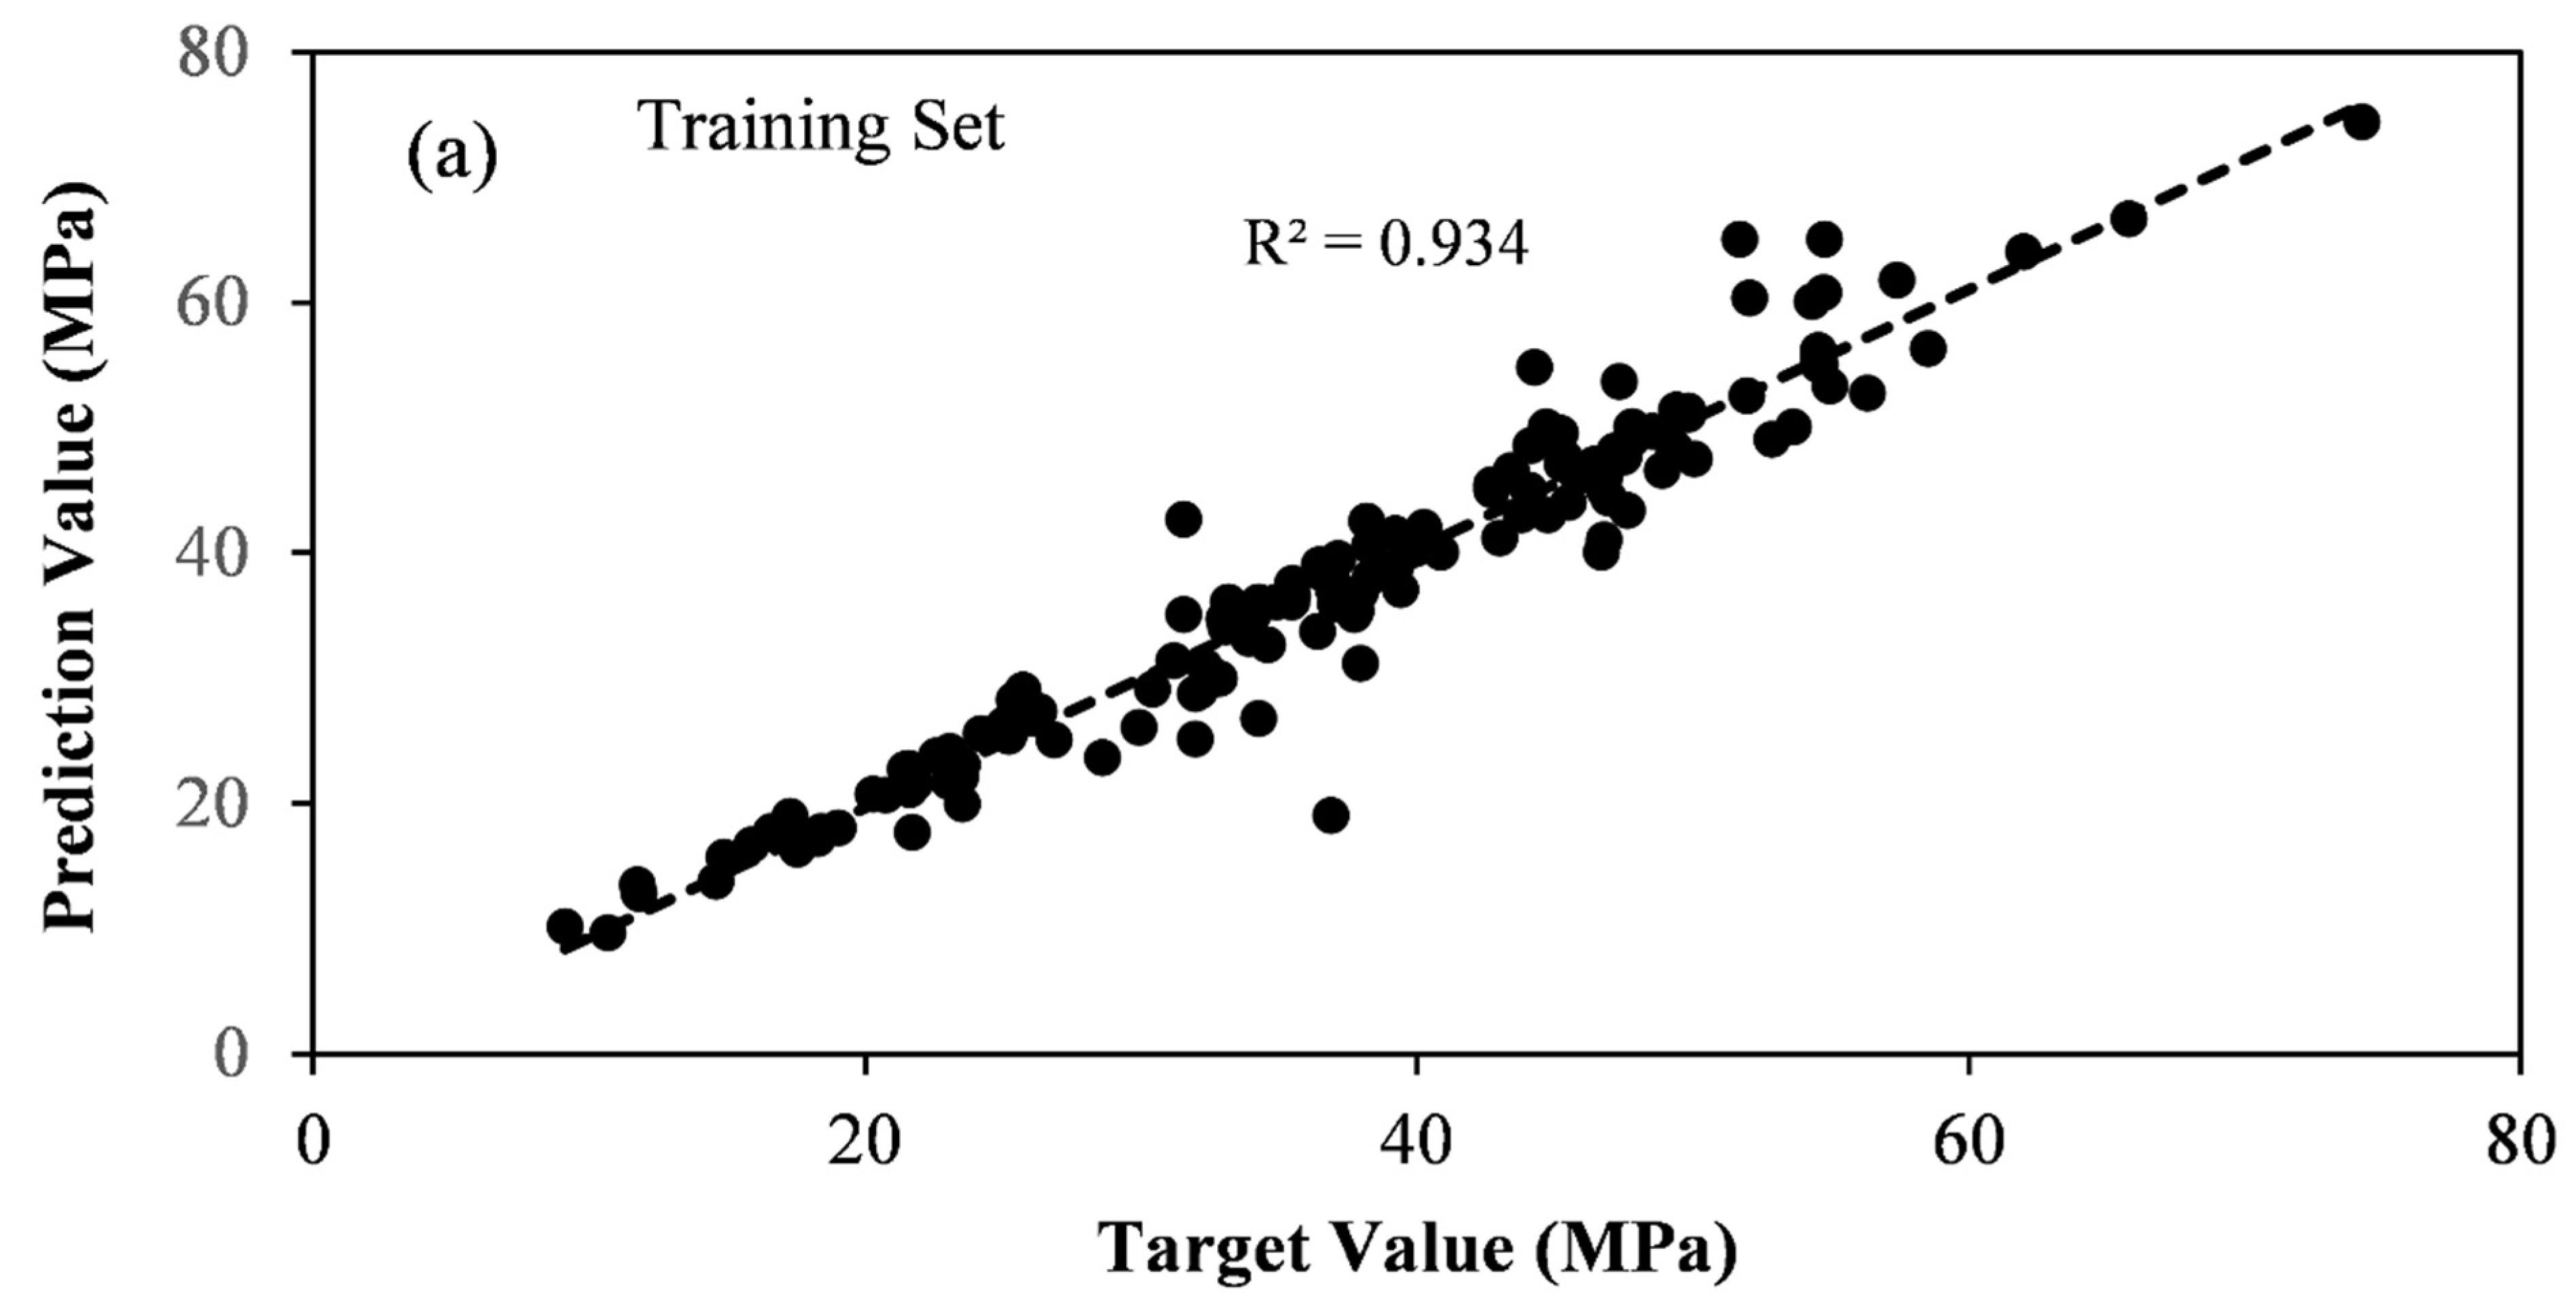
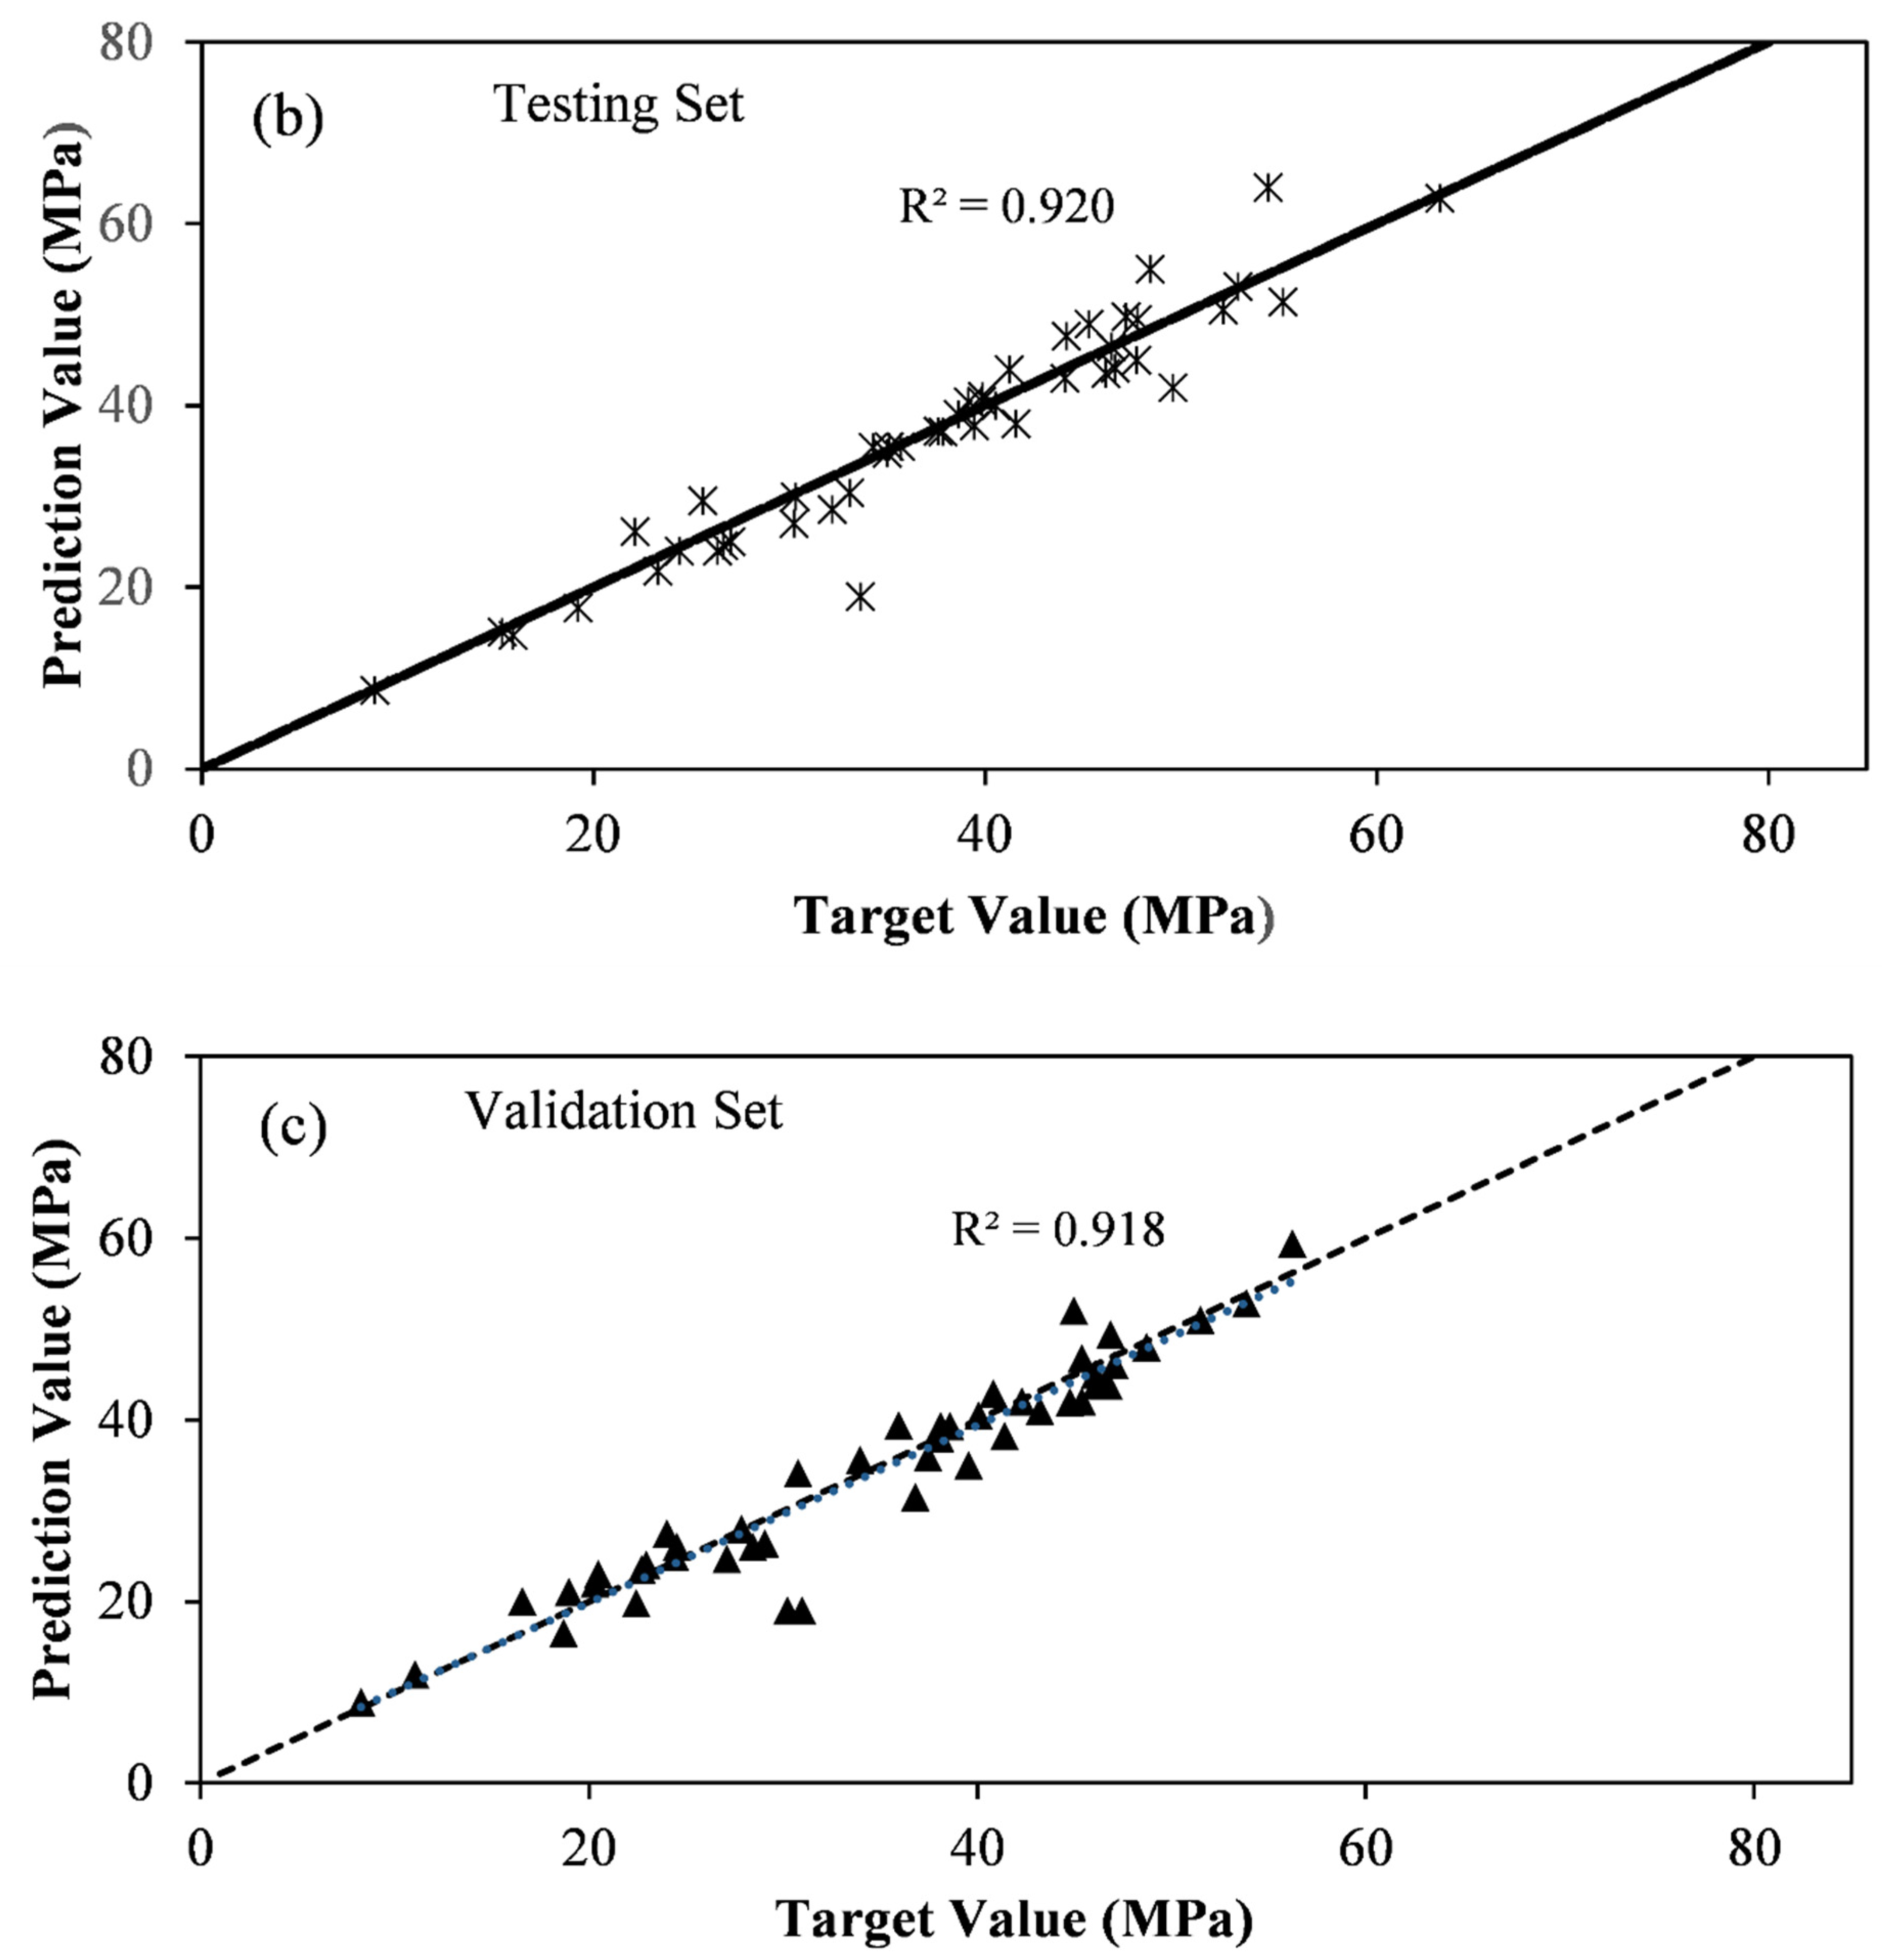
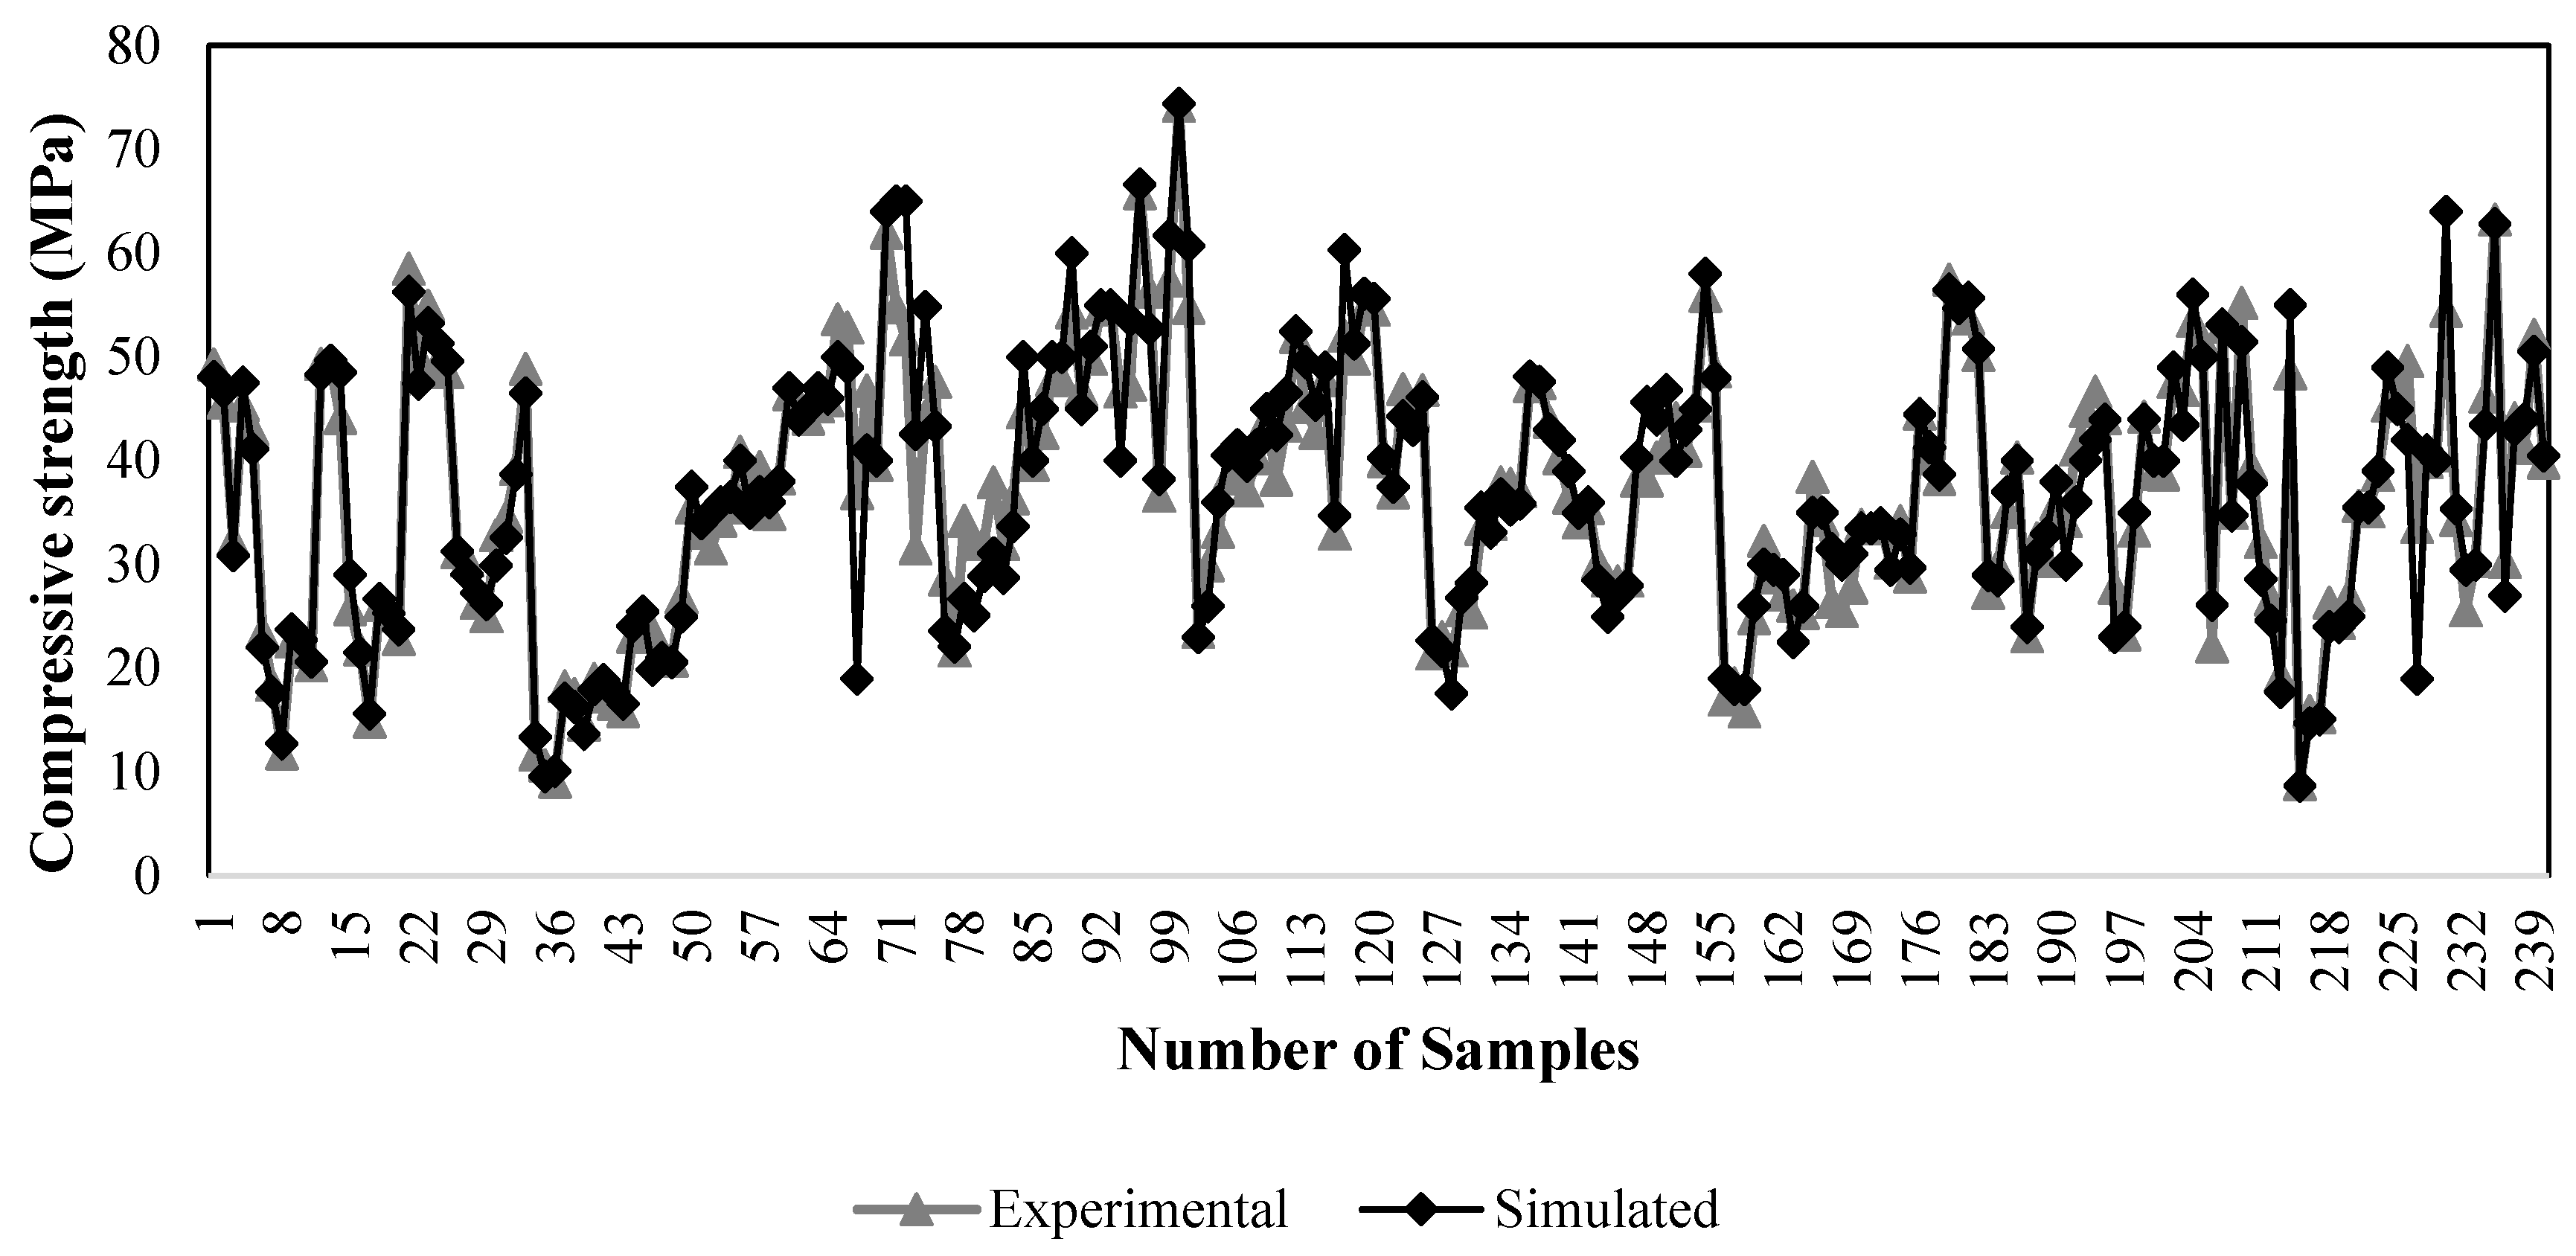
3.1. Model Performance
3.2. Experimental Study for Validation of the Model
3.3. Parametric Analysis
3.3.1. Effect of Recycled Fine Aggregate Powder on Strength
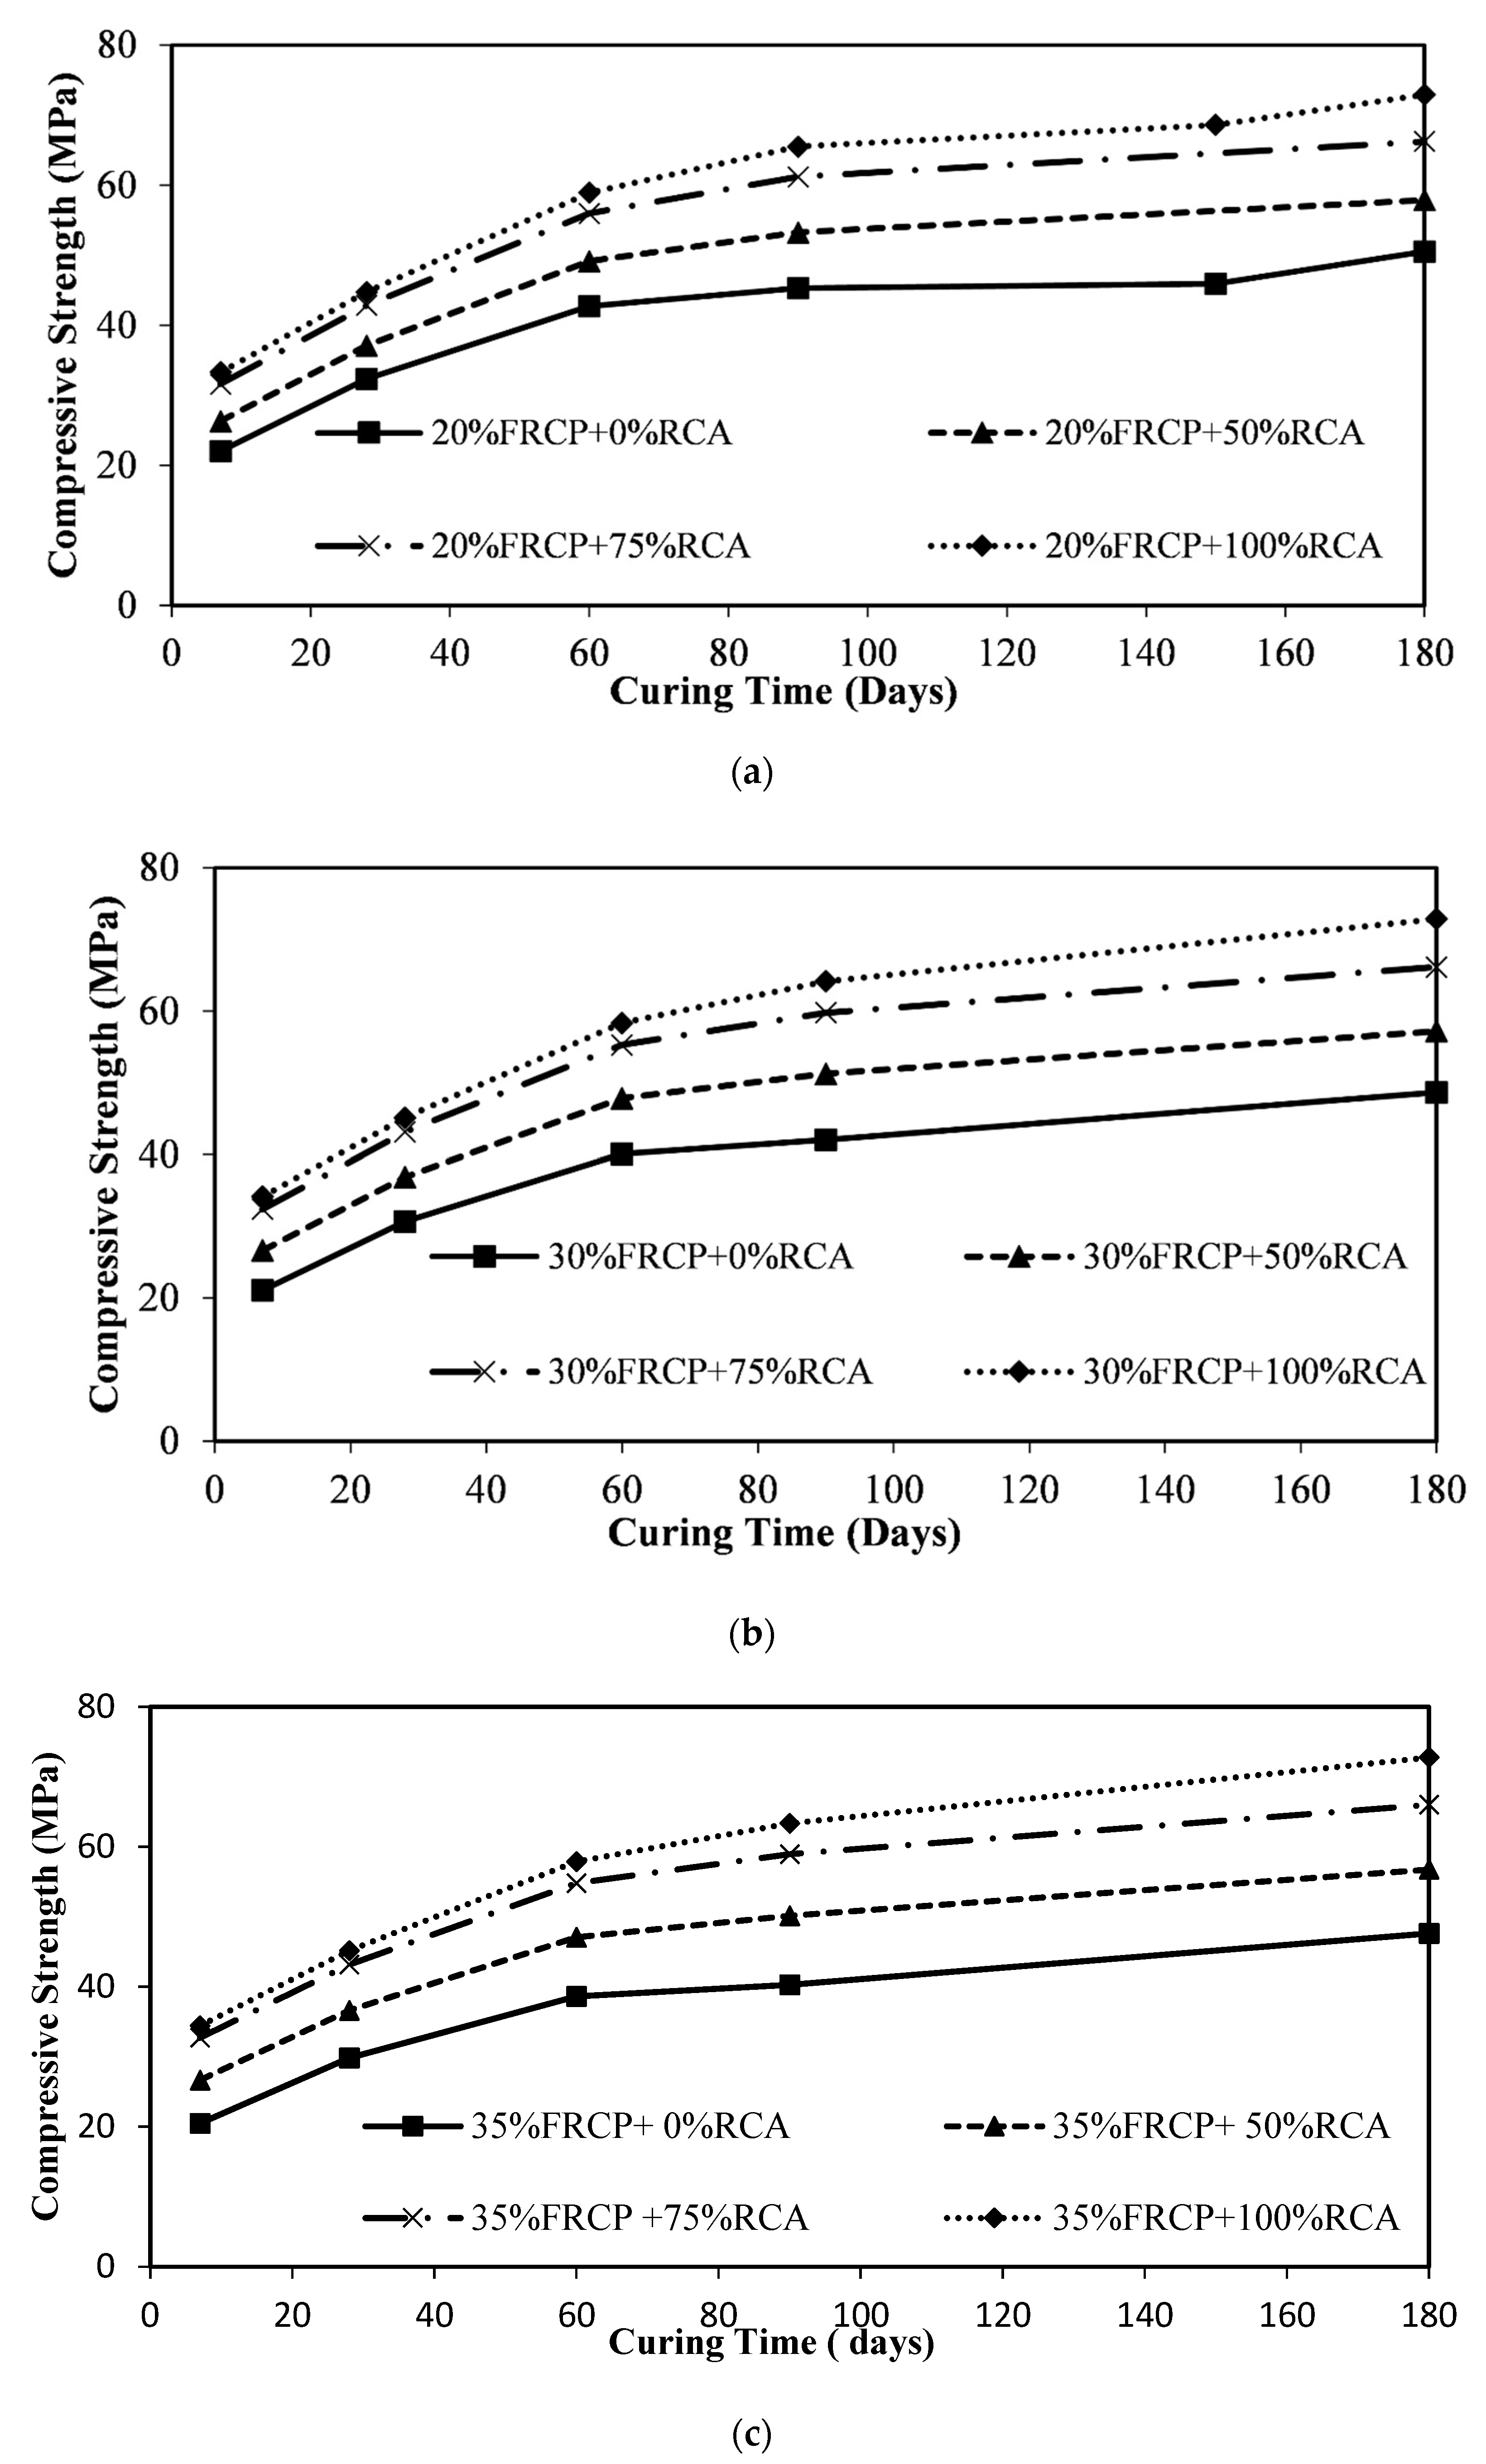
3.3.2. Effect of Recycled Aggregate at Different FRAP Contents
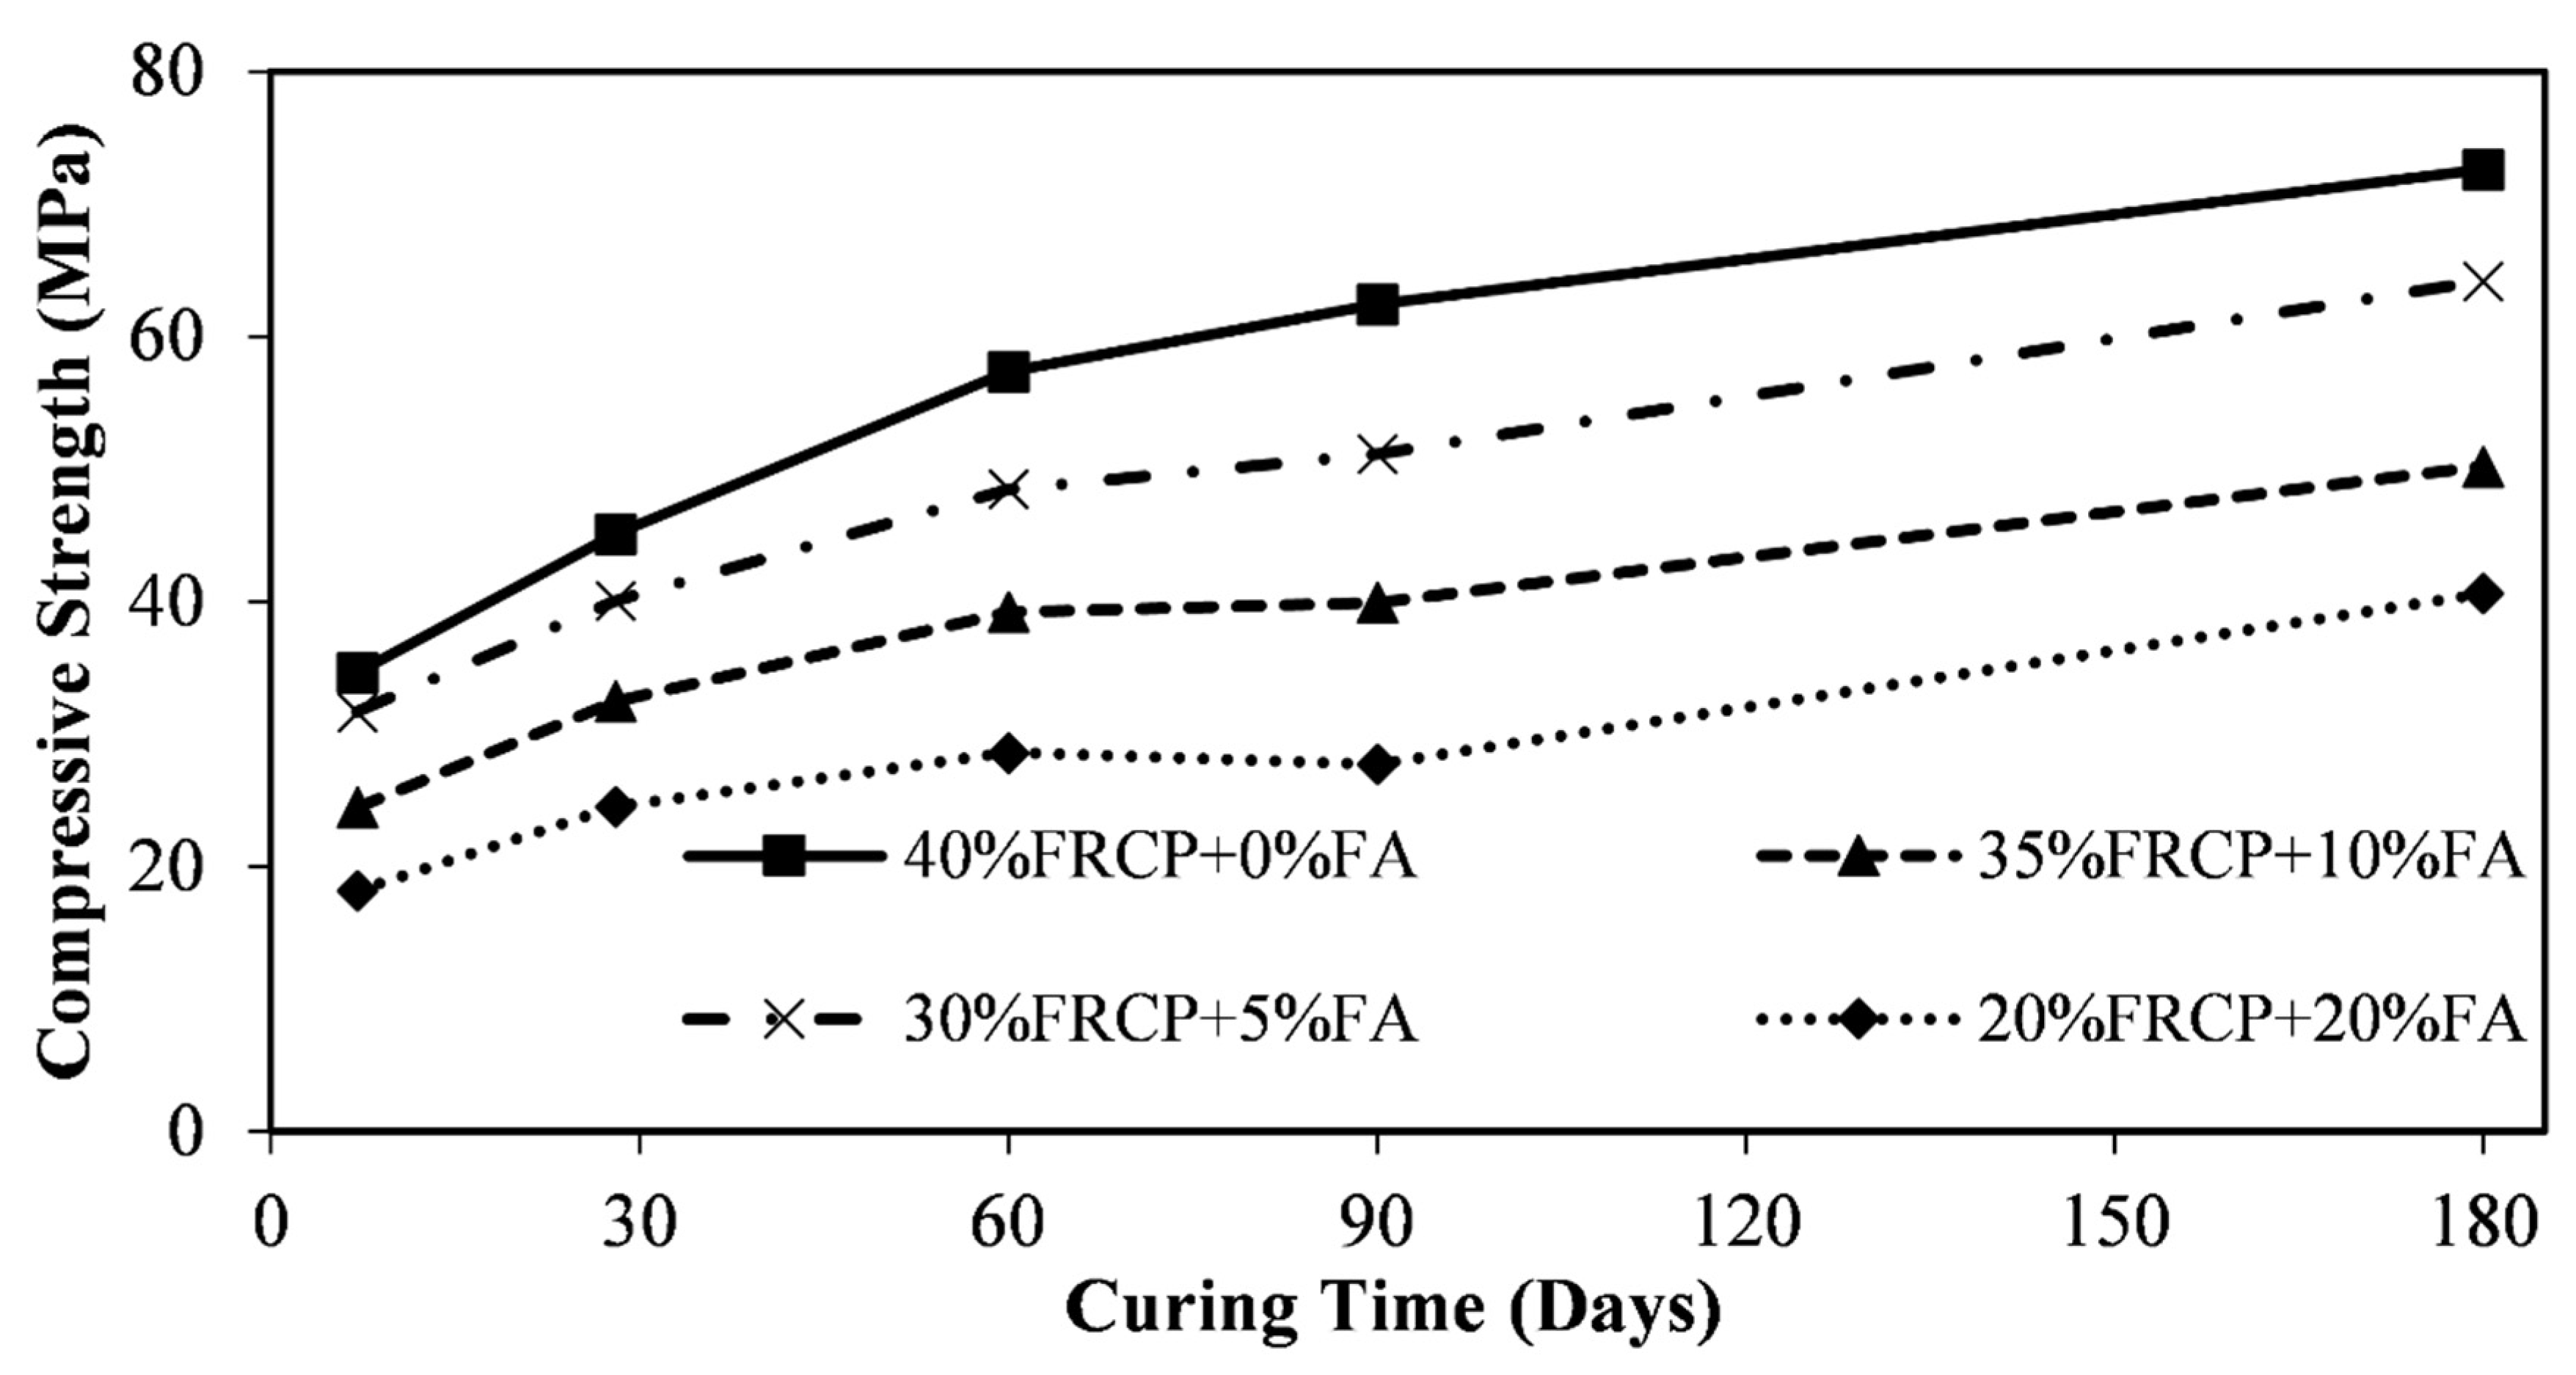
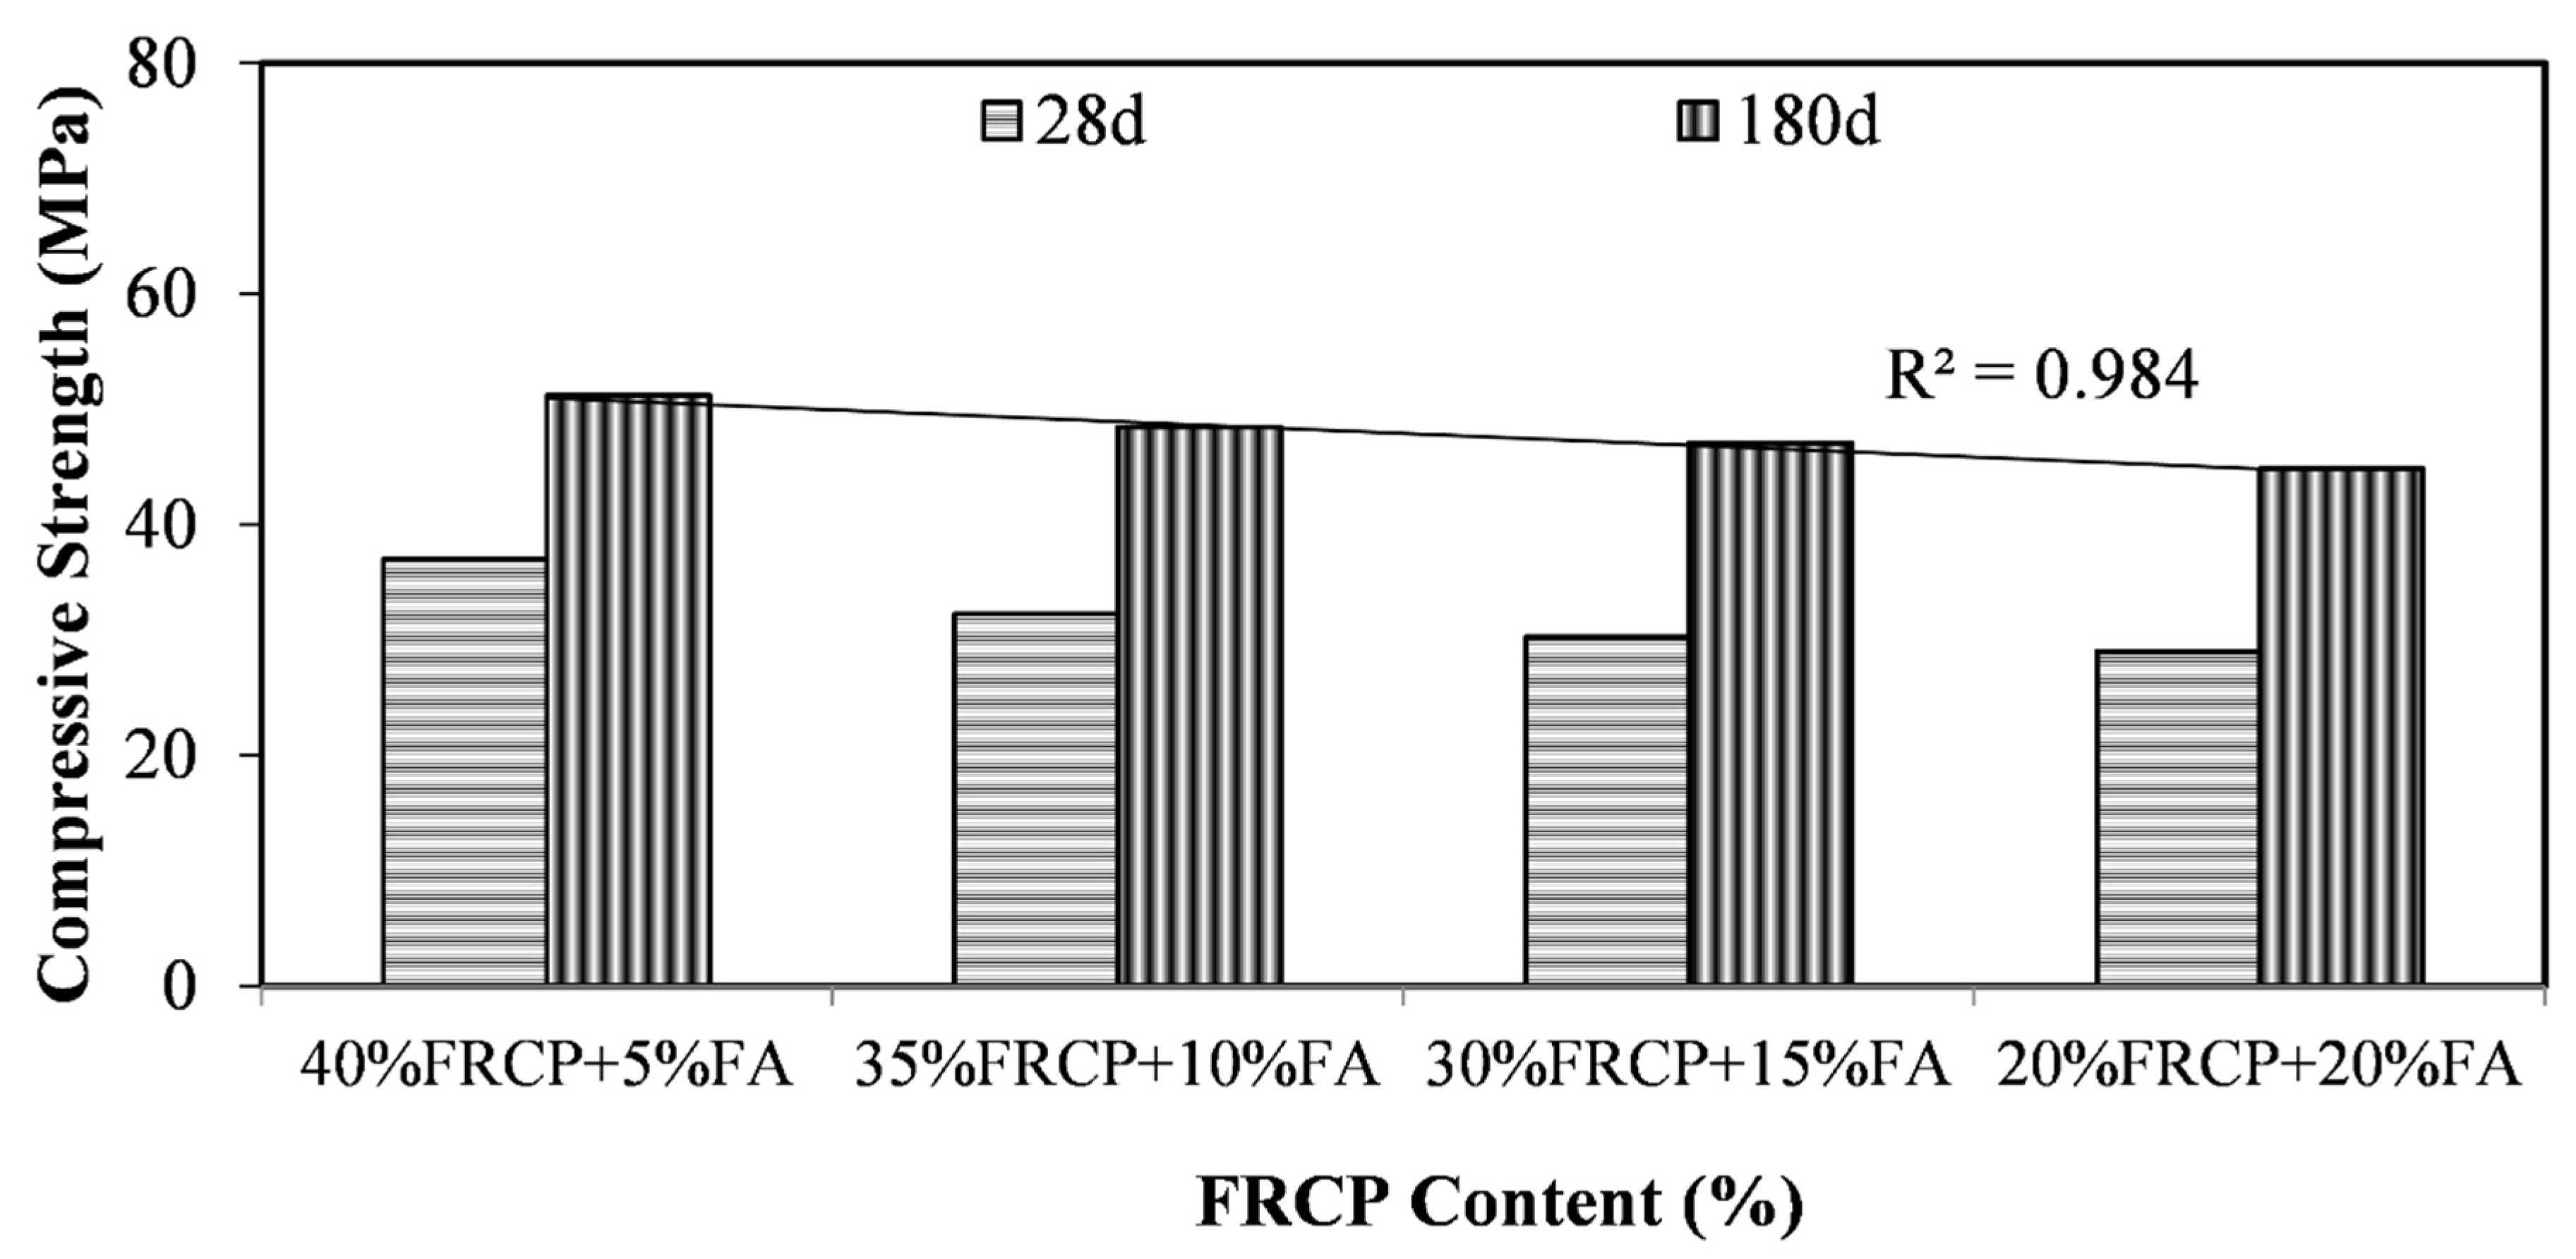
3.3.3. Combined Effect between FRAP and Fly Ash
4. Conclusions
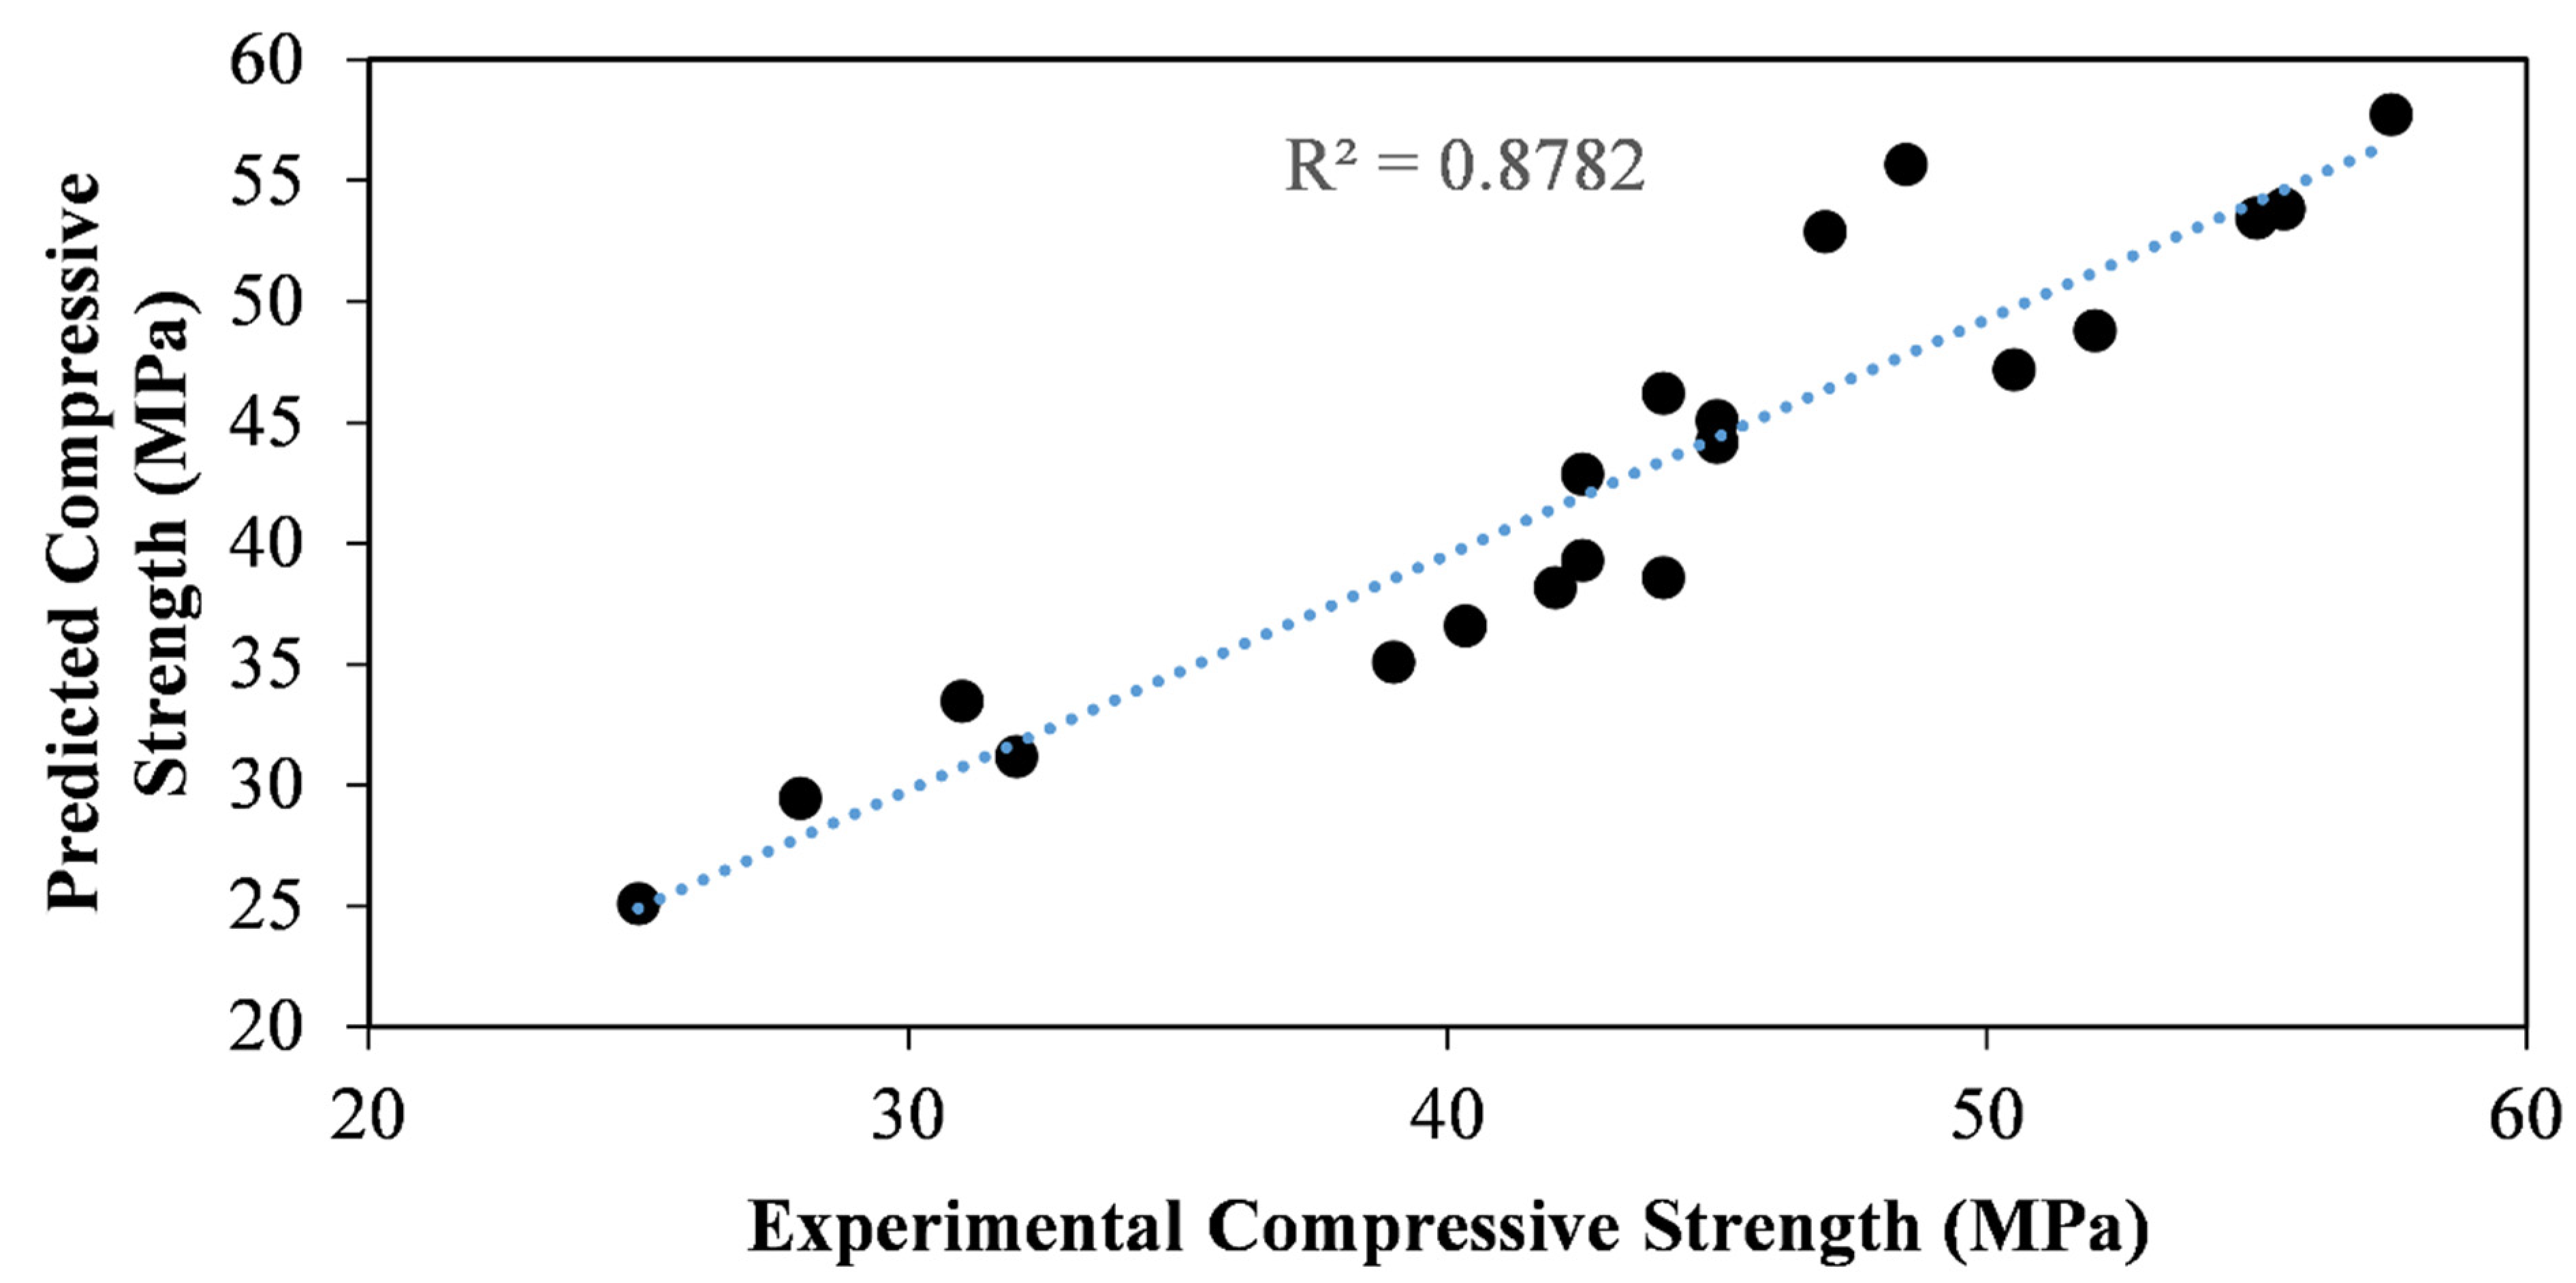
- The proposed ANN model provided good accuracy for the prediction of the compressive strength of RSCC in the data used for training. The regression values obtained for the training, testing, and validation steps were entirely satisfactory, namely, 0.97, 0.96, and 0.96, respectively. The MSE of the model was 0.01. During the experimental validation, the regression value remained high (0.88). It can be expanded beyond the existing domain. Future experimental data are, however, required for such an extension.
- For validating the model, the actual experimental compressive strengths of RSCC were compared to the compressive strengths predicted by the model, showing a very good correlation (R2- value of 0.88). Therefore, the results showed that the developed model can predict the compressive strength of RSCC with high accuracy.
- The type of aggregates, water absorption values, replacement level of RA and FRCP, and curing age can generally affect the properties of recycled concrete.
- The recycled self-compacting concrete compressive strength with any level of recycled aggregates can be significantly improved by using at least 40% of FRCP as cement replacement.
- The combination of fine, recycled concrete powder and recycled aggregates can have a positive effect on the mechanical properties of RSCC.
Author Contributions
Funding
Institutional Review Board Statement
Informed Consent Statement
Data Availability Statement
Acknowledgments
Conflicts of Interest
Appendix A

| No | B (kg/m³) | W/B | NA (kg/m³) | NS (kg/m³) | RS | RCA (kg/m³) | FRCP (kg/m³) | NP (kg/m³) | FA (kg/m³) | CT (days) | Sample Size (mm) | CS (MPa) | Shape Correction | CS of Cubes (MPa) | Normalized Strength * | Refs |
|---|---|---|---|---|---|---|---|---|---|---|---|---|---|---|---|---|
| (kg/m³) | ||||||||||||||||
| 1 | 449 | 0.35 | 898 | 898 | 0 | 0 | 0 | 0 | 0 | 7 | (cylinder) 100 × 200 | 48.06 | 0.88 | 54.61 | 1.00 | [50] |
| 2 | 449 | 0.35 | 898 | 673 | 247.25 | 199 | 0 | 0 | 0 | 7 | 46.66 | 0.84 | 55.55 | 1.02 | ||
| 3 | 449 | 0.35 | 898 | 449 | 494.5 | 379 | 0 | 0 | 0 | 7 | 38.19 | 0.78 | 48.96 | 0.90 | ||
| 4 | 449 | 0.35 | 898 | 0 | 898 | 794 | 0 | 0 | 0 | 7 | 30.91 | 0.78 | 39.63 | 0.73 | ||
| 5 | 449 | 0.35 | 898 | 673 | 247.25 | 203 | 0 | 0 | 0 | 7 | 47.53 | 0.84 | 56.58 | 1.04 | ||
| 6 | 449 | 0.35 | 898 | 449 | 494.5 | 406 | 0 | 0 | 0 | 7 | 42.86 | 0.78 | 54.95 | 1.01 | ||
| 7 | 449 | 0.35 | 898 | 822 | 898 | 813 | 0 | 0 | 0 | 7 | 41.12 | 0.78 | 52.72 | 0.97 | ||
| 8 | 411 | 0.55 | 822 | 822 | 0 | 0 | 0 | 0 | 0 | 7 | 26.11 | 0.77 | 33.91 | 1.00 | ||
| 9 | 411 | 0.55 | 822 | 616 | 102.75 | 182 | 0 | 0 | 0 | 7 | 22.03 | 0.76 | 28.99 | 0.85 | ||
| 10 | 411 | 0.55 | 822 | 411 | 411 | 363 | 0 | 0 | 0 | 7 | 17.71 | 0.76 | 23.30 | 0.69 | ||
| 11 | 411 | 0.55 | 822 | 0 | 411 | 727 | 0 | 0 | 0 | 7 | 12.75 | 0.76 | 16.78 | 0.49 | ||
| 12 | 411 | 0.55 | 822 | 616 | 154 | 186 | 0 | 0 | 0 | 7 | 23.76 | 0.74 | 32.11 | 0.95 | ||
| 13 | 411 | 0.55 | 822 | 411 | 205.5 | 372 | 0 | 0 | 0 | 7 | 22.77 | 0.74 | 30.77 | 0.91 | ||
| 14 | 411 | 0.55 | 822 | 0 | 822 | 744 | 0 | 0 | 0 | 7 | 20.66 | 0.74 | 27.92 | 0.82 | ||
| 15 | 449 | 0.35 | 898 | 898 | 0 | 0 | 0 | 0 | 0 | 14 | 53.12 | 0.88 | 60.36 | 1.00 | ||
| 16 | 449 | 0.35 | 898 | 673 | 247.25 | 199 | 0 | 0 | 0 | 14 | 48.34 | 0.84 | 57.55 | 0.95 | ||
| 17 | 449 | 0.35 | 898 | 449 | 494.5 | 379 | 0 | 0 | 0 | 14 | 41.97 | 0.78 | 53.81 | 0.89 | ||
| 18 | 449 | 0.35 | 898 | 0 | 898 | 794 | 0 | 0 | 0 | 14 | 34.75 | 0.78 | 44.55 | 0.74 | ||
| 19 | 449 | 0.35 | 898 | 673 | 247.25 | 203 | 0 | 0 | 0 | 14 | 49.64 | 0.84 | 59.10 | 0.98 | ||
| 20 | 449 | 0.35 | 898 | 449 | 494.5 | 406 | 0 | 0 | 0 | 14 | 48.52 | 0.84 | 57.76 | 0.96 | ||
| 21 | 449 | 0.35 | 898 | 822 | 898 | 813 | 0 | 0 | 0 | 14 | 46.73 | 0.84 | 55.63 | 0.92 | ||
| 22 | 411 | 0.55 | 822 | 822 | 0 | 0 | 0 | 0 | 0 | 14 | 29 | 0.77 | 37.66 | 1.00 | ||
| 23 | 411 | 0.55 | 822 | 616 | 102.75 | 182 | 0 | 0 | 0 | 14 | 24.72 | 0.74 | 33.41 | 0.89 | ||
| 24 | 411 | 0.55 | 822 | 411 | 411 | 363 | 0 | 0 | 0 | 14 | 21.51 | 0.74 | 29.07 | 0.77 | ||
| 25 | 411 | 0.55 | 822 | 0 | 411 | 727 | 0 | 0 | 0 | 14 | 15.64 | 0.76 | 20.58 | 0.55 | ||
| 26 | 411 | 0.55 | 822 | 616 | 154 | 186 | 0 | 0 | 0 | 14 | 26.71 | 0.74 | 36.09 | 0.96 | ||
| 27 | 411 | 0.55 | 822 | 411 | 205.5 | 372 | 0 | 0 | 0 | 14 | 25.32 | 0.74 | 34.22 | 0.91 | ||
| 28 | 411 | 0.55 | 822 | 0 | 822 | 744 | 0 | 0 | 0 | 14 | 23.78 | 0.74 | 32.14 | 0.85 | ||
| 29 | 449 | 0.35 | 898 | 898 | 0 | 0 | 0 | 0 | 0 | 28 | 56.28 | 0.88 | 63.95 | 1.00 | ||
| 30 | 449 | 0.35 | 898 | 673 | 247.25 | 199 | 0 | 0 | 0 | 28 | 51.44 | 0.84 | 61.24 | 0.96 | ||
| 31 | 449 | 0.35 | 898 | 449 | 494.5 | 379 | 0 | 0 | 0 | 28 | 47.44 | 0.84 | 56.48 | 0.88 | ||
| 32 | 449 | 0.35 | 898 | 0 | 898 | 794 | 0 | 0 | 0 | 28 | 37.77 | 0.78 | 48.42 | 0.76 | ||
| 33 | 449 | 0.35 | 898 | 673 | 247.25 | 203 | 0 | 0 | 0 | 28 | 53.27 | 0.84 | 63.42 | 0.99 | ||
| 34 | 449 | 0.35 | 898 | 449 | 494.5 | 406 | 0 | 0 | 0 | 28 | 51.34 | 0.84 | 61.12 | 0.96 | ||
| 35 | 449 | 0.35 | 898 | 822 | 898 | 813 | 0 | 0 | 0 | 28 | 49.63 | 0.84 | 59.08 | 0.92 | ||
| 36 | 411 | 0.55 | 822 | 822 | 0 | 0 | 0 | 0 | 0 | 28 | 34.1 | 0.82 | 41.59 | 1.00 | ||
| 37 | 411 | 0.55 | 822 | 616 | 102.75 | 182 | 0 | 0 | 0 | 28 | 28.58 | 0.74 | 38.62 | 0.93 | ||
| 38 | 411 | 0.55 | 822 | 411 | 411 | 363 | 0 | 0 | 0 | 28 | 24.6 | 0.74 | 33.24 | 0.80 | ||
| 39 | 411 | 0.55 | 822 | 0 | 411 | 727 | 0 | 0 | 0 | 28 | 17.76 | 0.76 | 23.37 | 0.56 | ||
| 40 | 411 | 0.55 | 822 | 616 | 154 | 186 | 0 | 0 | 0 | 28 | 31.31 | 0.78 | 40.14 | 0.97 | ||
| 41 | 411 | 0.55 | 822 | 411 | 205.5 | 372 | 0 | 0 | 0 | 28 | 29.09 | 0.74 | 39.31 | 0.95 | ||
| 42 | 411 | 0.55 | 822 | 0 | 822 | 744 | 0 | 0 | 0 | 28 | 27.26 | 0.74 | 36.84 | 0.89 | ||
| 43 | 379 | 0.5 | 1171 | 379 | 0 | 0 | 0 | 0 | 0 | 7 | (cube)100 × 100 × 100 | 26.2 | 1 | 26.2 | 1 | [44] |
| 44 | 379 | 0.5 | 0 | 379 | 0 | 1171 | 0 | 0 | 0 | 7 | 29.9 | 1 | 29.9 | 1.14 | ||
| 45 | 379 | 0.5 | 1171 | 379 | 0 | 0 | 0 | 0 | 0 | 28 | (cube)100 × 100 × 100 | 32.6 | 1 | 32.6 | 1 | [44] |
| 46 | 379 | 0.5 | 0 | 379 | 0 | 1171 | 0 | 0 | 0 | 28 | 38.7 | 1 | 38.7 | 1.19 | ||
| 47 | 379 | 0.5 | 1171 | 379 | 0 | 0 | 0 | 0 | 0 | 90 | (cube)100 × 100 × 100 | 46.5 | 1 | 46.5 | 1 | [44] |
| 48 | 379 | 0.5 | 0 | 379 | 0 | 1171 | 0 | 0 | 0 | 90 | 55 | 1 | 55 | 1.18 | ||
| 49 | 208 | 0.72 | 1040.7 | 807.6 | 0 | 0 | 0 | 0 | 52 | 7 | (Cylinder) 100 × 200 | 12 | 0.84 | 14.29 | 1.00 | [51] |
| 50 | 208 | 0.72 | 728.5 | 807.6 | 0 | 312.2 | 0 | 0 | 52 | 7 | 13.4 | 0.76 | 17.63 | 1.23 | ||
| 51 | 208 | 0.72 | 624.4 | 807.6 | 0 | 416.3 | 0 | 0 | 52 | 7 | 9.6 | 0.76 | 12.63 | 0.88 | ||
| 52 | 208 | 0.72 | 520.4 | 807.6 | 0 | 520.4 | 0 | 0 | 52 | 7 | 10.1 | 0.76 | 13.29 | 0.93 | ||
| 53 | 208 | 0.72 | 780.5 | 807.6 | 0 | 780.5 | 0 | 0 | 52 | 7 | 8.7 | 0.76 | 11.45 | 0.80 | ||
| 54 | 208 | 0.72 | 1070.7 | 807.6 | 0 | 1040.7 | 0 | 0 | 52 | 7 | 8.9 | 0.76 | 11.71 | 0.82 | ||
| 55 | 208 | 0.72 | 1040.7 | 807.6 | 0 | 0 | 0 | 0 | 52 | 28 | 17.1 | 0.81 | 21.11 | 1.00 | ||
| 56 | 208 | 0.72 | 728.5 | 807.6 | 0 | 312.2 | 0 | 0 | 52 | 28 | 16.5 | 0.76 | 21.71 | 1.03 | ||
| 57 | 208 | 0.72 | 624.4 | 807.6 | 0 | 416.3 | 0 | 0 | 52 | 28 | 16.3 | 0.76 | 21.45 | 1.02 | ||
| 58 | 208 | 0.72 | 520.4 | 807.6 | 0 | 520.4 | 0 | 0 | 52 | 28 | 14.7 | 0.76 | 19.34 | 0.92 | ||
| 59 | 208 | 0.72 | 780.5 | 807.6 | 0 | 780.5 | 0 | 0 | 52 | 28 | 15.1 | 0.76 | 19.87 | 0.94 | ||
| 60 | 208 | 0.72 | 1070.7 | 807.6 | 0 | 1040.7 | 0 | 0 | 52 | 28 | 13.7 | 0.76 | 18.03 | 0.85 | ||
| 61 | 208 | 0.72 | 1040.7 | 807.6 | 0 | 0 | 0 | 0 | 52 | 56 | 23 | 0.74 | 31.08 | 1.00 | ||
| 62 | 208 | 0.72 | 728.5 | 807.6 | 0 | 312.2 | 0 | 0 | 52 | 56 | 22 | 0.76 | 28.95 | 0.93 | ||
| 63 | 208 | 0.72 | 624.4 | 807.6 | 0 | 416.3 | 0 | 0 | 52 | 56 | 18 | 0.76 | 23.68 | 0.76 | ||
| 64 | 208 | 0.72 | 520.4 | 807.6 | 0 | 520.4 | 0 | 0 | 52 | 56 | 18.9 | 0.76 | 24.87 | 0.80 | ||
| 65 | 208 | 0.72 | 780.5 | 807.6 | 0 | 780.5 | 0 | 0 | 52 | 56 | 17.7 | 0.76 | 23.29 | 0.75 | ||
| 66 | 208 | 0.72 | 1070.7 | 807.6 | 0 | 1040.7 | 0 | 0 | 52 | 56 | 16.6 | 0.76 | 21.84 | 0.70 | ||
| 67 | 208 | 0.72 | 1040.7 | 807.6 | 0 | 0 | 0 | 0 | 52 | 148 | 24.1 | 0.77 | 31.30 | 1.00 | ||
| 68 | 208 | 0.72 | 728.5 | 807.6 | 0 | 312.2 | 0 | 0 | 52 | 148 | 25.5 | 0.74 | 34.46 | 1.10 | ||
| 69 | 208 | 0.72 | 624.4 | 807.6 | 0 | 416.3 | 0 | 0 | 52 | 148 | 19.9 | 0.76 | 26.18 | 0.84 | ||
| 70 | 208 | 0.72 | 520.4 | 807.6 | 0 | 520.4 | 0 | 0 | 52 | 148 | 19.8 | 0.76 | 26.05 | 0.83 | ||
| 71 | 208 | 0.72 | 780.5 | 807.6 | 0 | 780.5 | 0 | 0 | 52 | 148 | 21 | 0.76 | 27.63 | 0.88 | ||
| 72 | 208 | 0.72 | 1070.7 | 807.6 | 0 | 1040.7 | 0 | 0 | 52 | 148 | 20.6 | 0.76 | 27.11 | 0.87 | ||
| 73 | 430 | 0.64 | 602 | 846 | 0 | 0 | 0 | 0 | 185 | 7 | (Cube)100 × 100 × 100 | 26 | 1 | 26 | 1 | [53] |
| 74 | 430 | 0.64 | 301 | 846 | 0 | 278 | 0 | 0 | 185 | 7 | 23.5 | 1 | 23.5 | 0.90 | ||
| 75 | 430 | 0.64 | 301 | 635 | 193 | 278 | 0 | 0 | 185 | 7 | 24 | 1 | 24 | 0.92 | ||
| 76 | 430 | 0.64 | 301 | 423 | 386 | 278 | 0 | 0 | 185 | 7 | 24 | 1 | 24 | 0.92 | ||
| 77 | 430 | 0.64 | 0 | 846 | 0 | 556 | 0 | 0 | 185 | 7 | 24 | 1 | 24 | 0.92 | ||
| 78 | 430 | 0.64 | 0 | 556 | 193 | 556 | 0 | 0 | 185 | 7 | 25 | 1 | 25 | 0.96 | ||
| 79 | 430 | 0.64 | 0 | 423 | 386 | 556 | 0 | 0 | 185 | 7 | 25 | 1 | 25 | 0.96 | ||
| 80 | 430 | 0.64 | 602 | 846 | 0 | 0 | 0 | 0 | 185 | 28 | 37.5 | 1 | 37.5 | 1.00 | ||
| 81 | 430 | 0.64 | 301 | 846 | 0 | 278 | 0 | 0 | 185 | 28 | 34 | 1 | 34 | 0.91 | ||
| 82 | 430 | 0.64 | 301 | 635 | 193 | 278 | 0 | 0 | 185 | 28 | 35.5 | 1 | 35.5 | 0.95 | ||
| 83 | 430 | 0.64 | 301 | 423 | 386 | 278 | 0 | 0 | 185 | 28 | 35 | 1 | 35 | 0.93 | ||
| 84 | 430 | 0.64 | 0 | 846 | 0 | 556 | 0 | 0 | 185 | 28 | 36 | 1 | 36 | 0.96 | ||
| 85 | 430 | 0.64 | 0 | 556 | 193 | 556 | 0 | 0 | 185 | 28 | 36.5 | 1 | 36.5 | 0.97 | ||
| 86 | 430 | 0.64 | 0 | 423 | 386 | 556 | 0 | 0 | 185 | 28 | 35.5 | 1 | 35.5 | 0.95 | ||
| 87 | 430 | 0.64 | 602 | 846 | 0 | 0 | 0 | 0 | 185 | 56 | 40 | 1 | 40 | 1.00 | ||
| 88 | 430 | 0.64 | 301 | 846 | 0 | 278 | 0 | 0 | 185 | 56 | 35 | 1 | 35 | 0.88 | ||
| 89 | 430 | 0.64 | 301 | 635 | 193 | 278 | 0 | 0 | 185 | 56 | 37 | 1 | 37 | 0.93 | ||
| 90 | 430 | 0.64 | 301 | 423 | 386 | 278 | 0 | 0 | 185 | 56 | 36 | 1 | 36 | 0.90 | ||
| 91 | 430 | 0.64 | 0 | 846 | 0 | 556 | 0 | 0 | 185 | 56 | 38 | 1 | 38 | 0.95 | ||
| 92 | 430 | 0.64 | 0 | 556 | 193 | 556 | 0 | 0 | 185 | 56 | 39 | 1 | 39 | 0.98 | ||
| 93 | 430 | 0.64 | 0 | 423 | 386 | 556 | 0 | 0 | 185 | 56 | 38 | 1 | 38 | 0.95 | ||
| 94 | 430 | 0.64 | 602 | 846 | 0 | 0 | 0 | 0 | 185 | 120 | 47 | 1 | 47 | 1.00 | ||
| 95 | 430 | 0.64 | 301 | 846 | 0 | 278 | 0 | 0 | 185 | 120 | 41 | 1 | 41 | 0.87 | ||
| 96 | 430 | 0.64 | 301 | 635 | 193 | 278 | 0 | 0 | 185 | 120 | 44 | 1 | 44 | 0.94 | ||
| 97 | 430 | 0.64 | 301 | 423 | 386 | 278 | 0 | 0 | 185 | 120 | 42 | 1 | 42 | 0.89 | ||
| 98 | 430 | 0.64 | 0 | 846 | 0 | 556 | 0 | 0 | 185 | 120 | 45 | 1 | 45 | 0.96 | ||
| 99 | 430 | 0.64 | 0 | 556 | 193 | 556 | 0 | 0 | 185 | 120 | 47 | 1 | 47 | 1.00 | ||
| 100 | 430 | 0.64 | 0 | 423 | 386 | 556 | 0 | 0 | 185 | 120 | 46 | 1 | 46 | 0.98 | ||
| 101 | 310 | 0.4 | 1200 | 650 | 0 | 0 | 0 | 0 | 0 | 28 | (Cube)100 × 100 × 100 | 50 | 1 | 50 | 1.00 | [54] |
| 102 | 310 | 0.4 | 920 | 650 | 0 | 140 | 0 | 0 | 0 | 28 | 49 | 1 | 49 | 0.98 | ||
| 103 | 310 | 0.4 | 840 | 645 | 0 | 360 | 0 | 0 | 0 | 28 | 49 | 1 | 49 | 0.98 | ||
| 104 | 310 | 0.4 | 590 | 640 | 0 | 590 | 0 | 0 | 0 | 28 | 45 | 1 | 45 | 0.90 | ||
| 105 | 310 | 0.4 | 0 | 625 | 0 | 1170 | 0 | 0 | 0 | 28 | 42 | 1 | 42 | 0.84 | ||
| 106 | 370 | 0.45 | 1215 | 650 | 0 | 0 | 0 | 0 | 0 | 7 | (Cube)100 × 100 × 100 | 19 | 1 | 19 | 1 | [55] |
| 107 | 370 | 0.45 | 850.5 | 650 | 0 | 364.5 | 0 | 0 | 0 | 7 | 19 | 1 | 19 | 1 | ||
| 108 | 370 | 0.45 | 607.5 | 650 | 0 | 607.5 | 0 | 0 | 0 | 7 | 19 | 1 | 19 | 1 | ||
| 109 | 370 | 0.45 | 0 | 650 | 0 | 1215 | 0 | 0 | 0 | 7 | 19 | 1 | 19 | 1 | ||
| 110 | 370 | 0.45 | 1215 | 650 | 0 | 0 | 0 | 0 | 0 | 28 | 41 | 1 | 41 | 1 | ||
| 111 | 370 | 0.45 | 850.5 | 650 | 0 | 364.5 | 0 | 0 | 0 | 28 | 40 | 1 | 40 | 0.98 | ||
| 112 | 370 | 0.45 | 607.5 | 650 | 0 | 607.5 | 0 | 0 | 0 | 28 | 41 | 1 | 41 | 1.00 | ||
| 113 | 370 | 0.45 | 0 | 650 | 0 | 1215 | 0 | 0 | 0 | 28 | 40 | 1 | 40 | 0.98 | ||
| 114 | 370 | 0.45 | 1215 | 650 | 0 | 0 | 0 | 0 | 0 | 90 | 64 | 1 | 64 | 1 | ||
| 115 | 370 | 0.45 | 850.5 | 650 | 0 | 364.5 | 0 | 0 | 0 | 90 | 65 | 1 | 65 | 1.02 | ||
| 116 | 370 | 0.45 | 607.5 | 650 | 0 | 607.5 | 0 | 0 | 0 | 90 | 64 | 1 | 64 | 1 | ||
| 117 | 370 | 0.45 | 0 | 650 | 0 | 1215 | 0 | 0 | 0 | 90 | 65 | 1 | 65 | 1.02 | ||
| 118 | 400 | 0.48 | 1290 | 523 | 0 | 0 | 0 | 0 | 0 | 28 | (cylinder) 160 × 300 | 42.6 | 0.78 | 54.62 | 1 | [56] |
| 119 | 400 | 0.43 | 1140 | 685 | 0 | 0 | 0 | 0 | 0 | 28 | 54.8 | 0.88 | 62.27 | 1 | ||
| 120 | 400 | 0.5 | 0 | 787 | 0 | 824 | 0 | 0 | 0 | 28 | 43.3 | 0.82 | 52.80 | 1 | ||
| 121 | 400 | 0.65 | 0 | 0 | 629 | 878 | 0 | 0 | 0 | 28 | 31.5 | 0.78 | 40.38 | 0.74 | ||
| 122 | 400 | 0.6 | 0 | 0 | 659 | 746 | 0 | 0 | 0 | 28 | 35.4 | 0.78 | 45.38 | 0.83 | ||
| 123 | 400 | 0.66 | 0 | 0 | 675 | 865 | 0 | 0 | 0 | 28 | 39.4 | 0.78 | 50.51 | 0.92 | ||
| 124 | 360 | 0.65 | 1100 | 705 | 0 | 0 | 0 | 0 | 0 | 7 | (Cube)100 × 100 × 100 | 17 | 1 | 17 | 1 | [3] |
| 125 | 360 | 0.65 | 0 | 705 | 0 | 1100 | 0 | 0 | 0 | 7 | 15 | 1 | 15 | 0.89 | ||
| 126 | 380 | 0.5 | 1100 | 705 | 0 | 0 | 0 | 0 | 0 | 7 | 21.2 | 1 | 21.2 | 1 | ||
| 127 | 380 | 0.5 | 0 | 705 | 0 | 1100 | 0 | 0 | 0 | 7 | 18.9 | 1 | 18.9 | 1.10 | ||
| 128 | 400 | 0.48 | 1100 | 705 | 0 | 0 | 0 | 0 | 0 | 7 | 24.7 | 1 | 24.7 | 1 | ||
| 129 | 400 | 0.48 | 0 | 705 | 0 | 1100 | 0 | 0 | 0 | 7 | 22.7 | 1 | 22.7 | 0.92 | ||
| 130 | 420 | 0.43 | 1100 | 705 | 0 | 0 | 0 | 0 | 0 | 7 | 32.5 | 1 | 32.5 | 1 | ||
| 131 | 420 | 0.43 | 0 | 705 | 0 | 1100 | 0 | 0 | 0 | 7 | 26.5 | 1 | 26.5 | 0.82 | ||
| 132 | 460 | 0.4 | 1100 | 705 | 0 | 0 | 0 | 0 | 0 | 7 | 37.3 | 1 | 37.3 | 1 | ||
| 133 | 460 | 0.4 | 0 | 705 | 0 | 1100 | 0 | 0 | 0 | 7 | 27.8 | 1 | 27.8 | 0.76 | ||
| 134 | 360 | 0.65 | 1100 | 705 | 0 | 0 | 0 | 0 | 0 | 28 | 22.7 | 1 | 22.7 | 1 | ||
| 135 | 360 | 0.65 | 0 | 705 | 0 | 1100 | 0 | 0 | 0 | 28 | 20.3 | 1 | 20.3 | 0.90 | ||
| 136 | 380 | 0.5 | 1100 | 705 | 0 | 0 | 0 | 0 | 0 | 28 | 32.3 | 1 | 32.3 | 1.00 | ||
| 137 | 380 | 0.5 | 0 | 705 | 0 | 1100 | 0 | 0 | 0 | 28 | 29.2 | 1 | 29.2 | 0.91 | ||
| 138 | 400 | 0.48 | 1100 | 705 | 0 | 0 | 0 | 0 | 0 | 28 | 36 | 1 | 36 | 1 | ||
| 139 | 400 | 0.48 | 0 | 705 | 0 | 1100 | 0 | 0 | 0 | 28 | 32.2 | 1 | 32.3 | 0.90 | ||
| 140 | 420 | 0.43 | 1100 | 705 | 0 | 0 | 0 | 0 | 0 | 28 | 46 | 1 | 46 | 1 | ||
| 141 | 420 | 0.43 | 0 | 705 | 0 | 1100 | 0 | 0 | 0 | 28 | 39.4 | 1 | 39.4 | 0.86 | ||
| 142 | 460 | 0.4 | 1100 | 705 | 0 | 0 | 0 | 0 | 0 | 28 | 53.5 | 1 | 53.5 | 1.34 | ||
| 143 | 460 | 0.4 | 0 | 705 | 0 | 1100 | 0 | 0 | 0 | 28 | 46.5 | 1 | 46.5 | 0.87 | ||
| 144 | 325 | 0.5 | 1206.4 | 710.5 | 0 | 0 | 0 | 0 | 0 | 7 | (Cube)100 × 100 × 100 | 50 | 1 | 50 | 1.00 | [57] |
| 145 | 325 | 0.5 | 0 | 660.7 | 0 | 1106.8 | 0 | 0 | 0 | 7 | 40 | 1 | 40 | 0.81 | ||
| 146 | 345 | 0.43 | 0 | 613.9 | 0 | 1109.4 | 0 | 0 | 0 | 7 | 45 | 1 | 45 | 0.90 | ||
| 147 | 365 | 0.4 | 0 | 586.8 | 0 | 1126.8 | 0 | 0 | 0 | 7 | 50 | 1 | 50 | 1 | ||
| 148 | 365 | 0.4 | 0 | 586.5 | 0 | 1126.8 | 0 | 0 | 0 | 7 | 50 | 1 | 50 | 1 | ||
| 149 | 325 | 0.5 | 0 | 660 | 0 | 1106.8 | 0 | 0 | 0 | 7 | 35 | 1 | 35 | 0.71 | ||
| 150 | 325 | 0.5 | 1206.4 | 710.5 | 0 | 0 | 0 | 0 | 0 | 28 | 60 | 1 | 60 | 1.00 | ||
| 151 | 325 | 0.5 | 0 | 660.7 | 0 | 1106.8 | 0 | 0 | 0 | 28 | 45 | 1 | 45 | 0.76 | ||
| 152 | 345 | 0.43 | 0 | 613.9 | 0 | 1109.4 | 0 | 0 | 0 | 28 | 51 | 1 | 51 | 0.85 | ||
| 153 | 365 | 0.4 | 0 | 586.8 | 0 | 1126.8 | 0 | 0 | 0 | 28 | 55 | 1 | 55 | 0.92 | ||
| 154 | 365 | 0.4 | 0 | 586.5 | 0 | 1126.8 | 0 | 0 | 0 | 28 | 55 | 1 | 55 | 0.92 | ||
| 155 | 325 | 0.5 | 0 | 660 | 0 | 1106.8 | 0 | 0 | 0 | 28 | 40 | 1 | 40 | 0.68 | ||
| 156 | 250 | 0.6 | 1188 | 795 | 0 | 0 | 0 | 0 | 0 | 7 | (Cylinder) 100 × 200 | 35.9 | 0.82 | 43.78 | 1.00 | [58] |
| 157 | 250 | 0.6 | 0 | 795 | 0 | 1021 | 0 | 0 | 0 | 7 | 30 | 0.74 | 40.54 | 0.93 | ||
| 158 | 350 | 0.45 | 1148 | 696 | 0 | 0 | 0 | 0 | 0 | 7 | 53.6 | 0.88 | 60.91 | 1.00 | ||
| 159 | 350 | 0.45 | 0 | 696 | 0 | 1016 | 0 | 0 | 0 | 7 | 43.8 | 0.82 | 53.41 | 0.88 | ||
| 160 | 450 | 0.35 | 1170 | 596 | 0 | 0 | 0 | 0 | 0 | 7 | 66.6 | 0.88 | 75.68 | 1.00 | ||
| 161 | 450 | 0.35 | 0 | 596 | 0 | 1027 | 0 | 0 | 0 | 7 | 52.7 | 0.84 | 62.74 | 0.83 | ||
| 162 | 350.25 | 0.45 | 861 | 696 | 0 | 254 | 0 | 0 | 0 | 7 | 52 | 0.84 | 61.90 | 1.02 | ||
| 163 | 350.5 | 0.45 | 574 | 696 | 0 | 507 | 0 | 0 | 0 | 7 | 49.4 | 0.84 | 58.81 | 0.97 | ||
| 164 | 250 | 0.6 | 1188 | 795 | 0 | 0 | 0 | 0 | 0 | 28 | 43.5 | 0.82 | 53.05 | 1.00 | ||
| 165 | 250 | 0.6 | 0 | 795 | 0 | 1021 | 0 | 0 | 0 | 28 | 38.2 | 0.82 | 46.59 | 0.88 | ||
| 166 | 350 | 0.45 | 1148 | 696 | 0 | 0 | 0 | 0 | 0 | 28 | 61.7 | 0.88 | 70.11 | 1.00 | ||
| 167 | 350 | 0.45 | 0 | 696 | 0 | 1016 | 0 | 0 | 0 | 28 | 52.8 | 0.84 | 62.86 | 0.90 | ||
| 168 | 450 | 0.35 | 1170 | 596 | 0 | 0 | 0 | 0 | 0 | 28 | 74.4 | 0.88 | 84.55 | 1.00 | ||
| 169 | 450 | 0.35 | 0 | 596 | 0 | 1027 | 0 | 0 | 0 | 28 | 62.8 | 0.84 | 74.76 | 0.88 | ||
| 170 | 350.25 | 0.45 | 861 | 696 | 0 | 254 | 0 | 0 | 0 | 28 | 60.7 | 0.84 | 72.26 | 1.00 | ||
| 171 | 350.5 | 0.45 | 574 | 696 | 0 | 507 | 0 | 0 | 0 | 28 | 59.4 | 0.84 | 70.71 | 1.01 | ||
| 172 | 350 | 0.5 | 791 | 627.81 | 0 | 0 | 0 | 140 | 0 | 7 | (Cube) 70 × 70 × 70 | 25 | 0.97 | 24.25 | 1.00 | [26] |
| 173 | 350 | 0.5 | 0 | 627.81 | 0 | 791 | 0 | 140 | 0 | 7 | 27 | 0.97 | 26.19 | 1.08 | ||
| 174 | 350 | 0.5 | 791 | 627.81 | 0 | 0 | 140 | 0 | 0 | 7 | 28 | 0.97 | 27.16 | 1.12 | ||
| 175 | 350 | 0.5 | 0 | 627.81 | 0 | 791 | 140 | 0 | 0 | 7 | 26 | 0.97 | 25.22 | 1.04 | ||
| 176 | 350 | 0.5 | 791 | 627.81 | 0 | 0 | 0 | 140 | 0 | 28 | 40.33 | 0.97 | 39.12 | 1.00 | ||
| 177 | 350 | 0.5 | 0 | 627.81 | 0 | 791 | 0 | 140 | 0 | 28 | 39.33 | 0.97 | 38.15 | 0.98 | ||
| 178 | 350 | 0.5 | 791 | 627.81 | 0 | 0 | 140 | 0 | 0 | 28 | 45.67 | 0.97 | 44.3 | 1.13 | ||
| 179 | 350 | 0.5 | 0 | 627.81 | 0 | 791 | 140 | 0 | 0 | 28 | 44 | 0.97 | 42.68 | 1.09 | ||
| 180 | 350 | 0.5 | 791 | 627.81 | 0 | 0 | 0 | 140 | 0 | 90 | 46.83 | 0.97 | 45.43 | 1.00 | ||
| 181 | 350 | 0.5 | 0 | 627.81 | 0 | 791 | 0 | 140 | 0 | 90 | 47.67 | 0.97 | 46.24 | 1.02 | ||
| 182 | 350 | 0.5 | 791 | 627.81 | 0 | 0 | 0 | 140 | 0 | 28 | 38 | 0.97 | 36.86 | 1.00 | ||
| 183 | 350 | 0.5 | 0 | 627.81 | 0 | 791 | 0 | 140 | 0 | 28 | 40 | 0.97 | 38.8 | 1.05 | ||
| 184 | 350 | 0.5 | 791 | 627.81 | 0 | 0 | 140 | 0 | 0 | 28 | 37 | 0.97 | 35.89 | 0.97 | ||
| 185 | 350 | 0.5 | 0 | 627.81 | 0 | 791 | 140 | 0 | 0 | 28 | 42 | 0.97 | 40.74 | 1.11 | ||
| 186 | 350 | 0.5 | 791 | 627.81 | 0 | 0 | 0 | 140 | 0 | 90 | 43 | 0.97 | 41.71 | 1.00 | ||
| 187 | 350 | 0.5 | 0 | 627.81 | 0 | 791 | 0 | 140 | 0 | 90 | 45 | 0.97 | 43.65 | 1.05 | ||
| 188 | 350 | 0.5 | 791 | 627.81 | 0 | 0 | 140 | 0 | 0 | 90 | 58 | 0.97 | 56.26 | 1.35 | ||
| 189 | 350 | 0.5 | 0 | 627.81 | 0 | 791 | 140 | 0 | 0 | 90 | 48 | 0.97 | 46.56 | 1.12 | ||
| 190 | 350 | 0.5 | 791 | 627.81 | 0 | 0 | 0 | 140 | 0 | 180 | 48 | 0.97 | 46.56 | 1.00 | ||
| 191 | 350 | 0.5 | 0 | 627.81 | 0 | 791 | 0 | 140 | 0 | 180 | 50.5 | 0.97 | 48.99 | 1.05 | ||
| 192 | 350 | 0.5 | 791 | 627.81 | 0 | 0 | 140 | 0 | 0 | 180 | 60.17 | 0.97 | 58.36 | 1.25 | ||
| 193 | 350 | 0.5 | 0 | 627.81 | 0 | 791 | 140 | 0 | 0 | 180 | 52 | 0.97 | 50.44 | 1.08 | ||
| 194 | 325 | 0.5 | 0 | 710.5 | 0 | 1206.5 | 0 | 0 | 0 | 7 | (cylinder) 100 × 200 | 49.5 | 0.84 | 58.93 | 1.00 | [49] |
| 195 | 325 | 0.2 | 0 | 660.7 | 0 | 1106.8 | 0 | 0 | 0 | 7 | 40.5 | 0.78 | 51.92 | 0.88 | ||
| 196 | 345 | 0.43 | 0 | 613.9 | 0 | 1109.4 | 0 | 0 | 0 | 7 | 45.4 | 0.84 | 54.05 | 0.92 | ||
| 197 | 365 | 0.4 | 0 | 586.8 | 0 | 1126.8 | 0 | 0 | 0 | 7 | 49 | 0.84 | 58.33 | 0.99 | ||
| 198 | 365 | 0.4 | 0 | 586.8 | 0 | 1126.8 | 0 | 0 | 0 | 7 | 49.5 | 0.84 | 58.93 | 1.00 | ||
| 199 | 325 | 0.52 | 0 | 660.7 | 0 | 1106.8 | 0 | 0 | 0 | 7 | 34.7 | 0.78 | 44.49 | 0.75 | ||
| 200 | 325 | 0.5 | 0 | 710.5 | 0 | 1206.5 | 0 | 0 | 0 | 28 | 60.3 | 0.88 | 68.52 | 1.16 | ||
| 201 | 325 | 0.2 | 0 | 660.7 | 0 | 1106.8 | 0 | 0 | 0 | 28 | 46.5 | 0.84 | 55.36 | 0.94 | ||
| 202 | 345 | 0.43 | 0 | 613.9 | 0 | 1109.4 | 0 | 0 | 0 | 28 | 51.3 | 0.84 | 61.07 | 1.04 | ||
| 203 | 365 | 0.4 | 0 | 586.8 | 0 | 1126.8 | 0 | 0 | 0 | 28 | 56.1 | 0.84 | 66.79 | 1.13 | ||
| 204 | 365 | 0.4 | 0 | 586.8 | 0 | 1126.8 | 0 | 0 | 0 | 28 | 55.6 | 0.84 | 66.19 | 1.12 | ||
| 205 | 325 | 0.52 | 0 | 660.7 | 0 | 1106.8 | 0 | 0 | 0 | 28 | 40.3 | 0.78 | 51.67 | 0.88 | ||
| 206 | 300 | 0.55 | 1206.97 | 765.13 | 0 | 0 | 0 | 0 | 0 | 7 | 37.13 | 0.82 | 45.28 | 1.00 | ||
| 207 | 300 | 0.55 | 787.4 | 765.1 | 0 | 1042.6 | 0 | 0 | 0 | 7 | 40.5 | 0.78 | 51.92 | 1.1 | ||
| 208 | 318 | 0.52 | 1145.3 | 739 | 0 | 888.7 | 0 | 0 | 0 | 7 | 37.5 | 0.78 | 48.08 | 1.1 | ||
| 209 | 325 | 0.5 | 1806.6 | 683.2 | 0 | 1123.4 | 0 | 0 | 0 | 7 | 40.4 | 0.78 | 51.79 | 1.1 | ||
| 210 | 300 | 0.55 | 1206.97 | 765.13 | 0 | 0 | 0 | 0 | 0 | 28 | 44.3 | 0.82 | 54.02 | 1 | ||
| 211 | 300 | 0.55 | 787.4 | 765.1 | 0 | 1042.6 | 0 | 0 | 0 | 28 | 46 | 0.84 | 54.76 | 1.01 | ||
| 212 | 318 | 0.52 | 1145.3 | 739 | 0 | 888.7 | 0 | 0 | 0 | 28 | 43 | 0.78 | 55.13 | 1.01 | ||
| 213 | 325 | 0.5 | 1806.6 | 683.2 | 0 | 1123.4 | 0 | 0 | 0 | 28 | 46.13 | 0.84 | 54.92 | 1.02 | ||
| 214 | 282.8 | 0.41 | 1050.5 | 757.6 | 0 | 0 | 0 | 0 | 70.7 | 3 | (cylinder)100 × 200 | 22.7 | 0.74 | 30.68 | 1.00 | [52] |
| 215 | 280 | 0.41 | 322.5 | 750 | 0 | 728 | 0 | 0 | 70 | 3 | 21.8 | 0.82 | 26.59 | 0.87 | ||
| 216 | 277.2 | 0.41 | 432.7 | 742.6 | 0 | 617.8 | 0 | 0 | 69.3 | 3 | 21.7 | 0.82 | 26.46 | 0.86 | ||
| 217 | 277.2 | 0.41 | 535.6 | 742.6 | 0 | 514.9 | 0 | 0 | 69.3 | 3 | 17.6 | 0.76 | 23.16 | 0.75 | ||
| 218 | 282.8 | 0.41 | 1050.5 | 757.6 | 0 | 0 | 0 | 0 | 70.7 | 7 | 27.5 | 0.77 | 35.71 | 1.00 | ||
| 219 | 280 | 0.41 | 322.5 | 750 | 0 | 728 | 0 | 0 | 70 | 7 | 26.8 | 0.74 | 36.22 | 1.01 | ||
| 220 | 277.2 | 0.41 | 432.7 | 742.6 | 0 | 617.8 | 0 | 0 | 69.3 | 7 | 28.2 | 0.74 | 38.11 | 1.07 | ||
| 221 | 277.2 | 0.41 | 535.6 | 742.6 | 0 | 514.9 | 0 | 0 | 69.3 | 7 | 24.9 | 0.74 | 33.65 | 0.94 | ||
| 222 | 282.8 | 0.41 | 1050.5 | 757.6 | 0 | 0 | 0 | 0 | 70.7 | 28 | 35.5 | 0.82 | 43.29 | 1.00 | ||
| 223 | 280 | 0.41 | 322.5 | 750 | 0 | 728 | 0 | 0 | 70 | 28 | 35.6 | 0.78 | 45.64 | 1.05 | ||
| 224 | 277.2 | 0.41 | 432.7 | 742.6 | 0 | 617.8 | 0 | 0 | 69.3 | 28 | 33.1 | 0.78 | 42.44 | 0.98 | ||
| 225 | 277.2 | 0.41 | 535.6 | 742.6 | 0 | 514.9 | 0 | 0 | 69.3 | 28 | 30.4 | 0.78 | 38.97 | 0.9 | ||
| 226 | 282.8 | 0.41 | 1050.5 | 757.6 | 0 | 0 | 0 | 0 | 70.7 | 56 | 36.8 | 0.82 | 44.88 | 1.00 | ||
| 227 | 280 | 0.41 | 322.5 | 750 | 0 | 728 | 0 | 0 | 70 | 56 | 37.2 | 0.78 | 47.69 | 1.06 | ||
| 228 | 277.2 | 0.41 | 432.7 | 742.6 | 0 | 617.8 | 0 | 0 | 69.3 | 56 | 35.3 | 0.78 | 45.26 | 1.00 | ||
| 229 | 277.2 | 0.41 | 535.6 | 742.6 | 0 | 514.9 | 0 | 0 | 69.3 | 56 | 35.9 | 0.78 | 46.03 | 1.02 | ||
| 230 | 282.8 | 0.41 | 1050.5 | 757.6 | 0 | 0 | 0 | 0 | 70.7 | 120 | 49.8 | 0.88 | 56.59 | 1.00 | ||
| 231 | 280 | 0.41 | 322.5 | 750 | 0 | 728 | 0 | 0 | 70 | 120 | 48.1 | 0.84 | 57.26 | 1.01 | ||
| 232 | 277.2 | 0.41 | 432.7 | 742.6 | 0 | 617.8 | 0 | 0 | 69.3 | 120 | 47.6 | 0.84 | 56.67 | 1.00 | ||
| 233 | 277.2 | 0.41 | 535.6 | 742.6 | 0 | 514.9 | 0 | 0 | 69.3 | 120 | 43.8 | 0.78 | 56.15 | 0.99 | ||
| 234 | 350 | 0.53 | 860 | 1050 | 0 | 0 | 0 | 0 | 0 | 28 | (Cube)100 × 100 × 100 | 44.1 | 1 | 44.1 | 1.00 | [59] |
| 235 | 350 | 0.53 | 860 | 946 | 105 | 0 | 0 | 0 | 0 | 28 | 43 | 1 | 43 | 0.98 | ||
| 236 | 350 | 0.53 | 860 | 840 | 210 | 0 | 0 | 0 | 0 | 28 | 42 | 1 | 42 | 0.95 | ||
| 237 | 350 | 0.53 | 860 | 735 | 315 | 0 | 0 | 0 | 0 | 28 | 39 | 1 | 39 | 0.88 | ||
| 238 | 350 | 0.53 | 860 | 630 | 420 | 0 | 0 | 0 | 0 | 28 | 35 | 1 | 35 | 0.79 | ||
| 239 | 350 | 0.53 | 860 | 525 | 525 | 0 | 0 | 0 | 0 | 28 | 36 | 1 | 36 | 0.82 | ||
| 240 | 350 | 0.53 | 860 | 0 | 1050 | 0 | 0 | 0 | 0 | 28 | 28.5 | 1 | 28.5 | 0.65 |
References
- Kou, S.C.; Poon, C.S.; Chan, D. Influence of fly ash as a cement addition on the hardened properties of recycled aggregate concrete. Mater. Struct. 2007, 41, 1191–1201. [Google Scholar] [CrossRef]
- Huseien, G.F.; Shah, K.W. Durability and life cycle evaluation of self-compacting concrete containing fly ash as GBFS replacement with alkali activation. Constr. Build. Mater. 2020, 235, 117458. [Google Scholar] [CrossRef]
- Rahal, K. Mechanical properties of concrete with recycled coarse aggregate. Build. Environ. 2007, 42, 407–415. [Google Scholar] [CrossRef]
- Chakkamalayath, J.; Joseph, A.; Al-Baghli, H.; Hamadah, O.; Dashti, D.; Abdulmalek, N. Performance evaluation of self-compacting concrete containing volcanic ash and recycled coarse aggregates. Asian J. Civ. Eng. 2020, 21, 815–827. [Google Scholar] [CrossRef]
- Sonebi, M. Medium strength self-compacting concrete containing fly ash: Modelling using factorial experimental plans. Cem. Concr. Res. 2004, 34, 1199–1208. [Google Scholar] [CrossRef]
- Panda, K.; Bal, P. Properties of Self Compacting Concrete Using Recycled Coarse Aggregate. Procedia Eng. 2013, 51, 159–164. [Google Scholar] [CrossRef]
- Wang, Y.L.; Wang, W.D.; Guan, X.M. Physical Filling Effects of Limestone Powders with Different Particle Size. Adv. Mater. Res. 2010, 163-167, 1419–1424. [Google Scholar] [CrossRef]
- Safiuddin, M.D.; Salam, M.A.; Jumaat, M.Z. Effects of recycled concrete aggregate on the fresh properties of self-consolidating concrete. Arch. Civ. Mech. Eng. 2011, 11, 1023–1041. [Google Scholar] [CrossRef]
- Kou, S.; Poon, C. Properties of self-compacting concrete prepared with coarse and fine recycled concrete aggregates. Cem. Concr. Compos. 2009, 31, 622–627. [Google Scholar] [CrossRef]
- Sasanipour, H.; Aslani, F. Durability properties evaluation of self-compacting concrete prepared with waste fine and coarse recycled concrete aggregates. Constr. Build. Mater. 2020, 236, 117540. [Google Scholar] [CrossRef]
- González-Taboada, I.; González-Fonteboa, B.; Martínez-Abella, F.; Pérez-Ordóñez, J.L. Prediction of the mechanical properties of structural recycled concrete using multivariable regression and genetic programming. Constr. Build. Mater. 2016, 106, 480–499. [Google Scholar] [CrossRef]
- Younis, K.H.; Pilakoutas, K. Strength prediction model and methods for improving recycled aggregate concrete. Constr. Build. Mater. 2013, 49, 688–701. [Google Scholar] [CrossRef]
- Féret, R. Sur la compacité des matériaux hydrauliques. Ann. Ponts Chaussées. 1982, 4, 5–164. [Google Scholar]
- Yang, J.; Du, Q.; Bao, Y. Concrete with recycled concrete aggregate and crushed clay bricks. Constr. Build. Mater. 2011, 25, 1935–1945. [Google Scholar] [CrossRef]
- Rebouh, R.; Boukhatem, B.; Ghrici, M.; Tagnit-Hamou, A. A practical hybrid NNGA system for predicting the compressive strength of concrete containing natural pozzolan using an evolutionary structure. Constr. Build. Mater. 2017, 149, 778–789. [Google Scholar] [CrossRef]
- Ni, H.-G.; Wang, J.-Z. Prediction of compressive strength of concrete by neural networks. Cem. Concr. Res. 2000, 30, 1245–1250. [Google Scholar] [CrossRef]
- Duan, Z.; Kou, S.; Poon, C. Prediction of compressive strength of recycled aggregate concrete using artificial neural networks. Constr. Build. Mater. 2013, 40, 1200–1206. [Google Scholar] [CrossRef]
- Topçu, İ.B.; Sarıdemir, M. Prediction of properties of waste AAC aggregate concrete using artificial neural network. Comput. Mater. Sci. 2007, 41, 117–125. [Google Scholar] [CrossRef]
- Kasperkiewicz, J.; Racz, J.; Dubrawski, A. HPC Strength Prediction Using Artificial Neural Network. J. Comput. Civ. Eng. 1995, 9, 279–284. [Google Scholar] [CrossRef]
- Yeh, I.-C. Design of High-Performance Concrete Mixture Using Neural Networks and Nonlinear Programming. J. Comput. Civ. Eng. 1999, 13, 36–42. [Google Scholar] [CrossRef]
- Uysal, M.; Tanyildizi, H. Predicting the core compressive strength of self-compacting concrete (SCC) mixtures with mineral additives using artificial neural network. Constr. Build. Mater. 2011, 25, 4105–4111. [Google Scholar] [CrossRef]
- Fan, C.-C.; Huang, R.; Hwang, H.; Chao, S.-J. The Effects of Different Fine Recycled Concrete Aggregates on the Properties of Mortar. Materials 2015, 8, 2658–2672. [Google Scholar] [CrossRef]
- Zhou, C.; Chen, Z. Mechanical properties of recycled concrete made with different types of coarse aggregate. Constr. Build. Mater. 2017, 134, 497–506. [Google Scholar] [CrossRef]
- Lee, B.Y.; Kim, J.H.; Kim, J.-K. Optimum concrete mixture proportion based on a database considering regional characteristics. J. Comput. Civ. Eng. 2009, 23, 258–265. [Google Scholar] [CrossRef]
- Transportation Research Circulars. Use of Artificial Neural Networks in Geomechanical and Pavement Systems; Number E-C012; Transportation Research Board, National Research Council: Washington, DC, USA, 1999. [Google Scholar]
- Boudali, S.; Kerdal, D.; Ayed, K.; Abdulsalam, B.; Soliman, A. Performance of self-compacting concrete incorporating recycled concrete fines and aggregate exposed to sulphate attack. Constr. Build. Mater. 2016, 124, 705–713. [Google Scholar] [CrossRef]
- Haykin, S. Neural Networks: A Comprehensive Foundation; Prentice Hall: Upper Saddle River, NJ, USA, 1999. [Google Scholar]
- Trabelsi, S.; Hafid, M.; Poncet, S.; Poirier, M.; Lacroix, M. Rheology of ethylene- and propylene-glycol ice slurries: Experiments and ANN model. Int. J. Refrig. 2017, 82, 447–460. [Google Scholar] [CrossRef]
- Samui, P.; Das, S.D.; Sitharam, T.G. Intelligent and Soft Computing in Infrastructure Systems Engineering; Intel. & Soft Comp. in Infra. Sys. Eng., SCI 259; Gopalakrishnan, K., Ceylan, H., Attoh-Okine, N.O., Eds.; Springer: Berlin, Germany, 2009; pp. 305–323. [Google Scholar]
- Sarıdemir, M. Predicting the compressive strength of mortars containing metakaolin by artificial neural networks and fuzzy logic. Adv. Eng. Softw. 2009, 40, 920–927. [Google Scholar] [CrossRef]
- Nehdi, M.L.; Soliman, A.M. Artificial Intelligence Model for Early-Age Autogenous Shrinkage of Concrete. ACI Mater. J. 2012, 109, 353–361. [Google Scholar]
- Nehdi, M.L.; El Chabib, H.; El Naggar, M.H. Predicting Performance of Self-Compacting Concrete Mixtures Using Artificial Neural Networks. Mater. J. 2001, 98, 394–401. [Google Scholar]
- Comité Européen de Normalisation (CEN). EN-1992-1-1: Eurocode 2: Design of Concrete Structures: Part 1-1: General Rules and Rules for Buildings; Comité Européen de Normalisation (CEN): Brussels, Belgium, 2008; p. 259. [Google Scholar]
- João Nuno, P.; de Jorge, B.; Carlos, C.; Luís, E. Probabilistic Conversion of the Compressive Strength of Cubes to Cylinders of Natural and Recycled Aggregate Concrete Specimens. Mater. J. 2009, 12, 1–11. [Google Scholar]
- Zain, M.F.M.; Abd, S.M. Multiple Regression Model for Compressive Strength Prediction of High Performance Concrete. J. Appl. Sci. 2008, 9, 155–160. [Google Scholar] [CrossRef]
- Demuth, H.; Beale, M. Neural Network Toolbox 5, User’s Guide; MathWorks Inc.: Natick, MA, USA, 2007. [Google Scholar]
- Smith, G.N. Probability and Statistics in Civil Engineering: An Introduction; Collins: London, UK, 1986. [Google Scholar]
- Boudali, S.; Abdulsalam, B.; Soliman, A.M.; Ayed, K.; Kerdal, D.E. Green Self-Compacting Sand Concrete Exposed to Sulfate Attack; CSCE Resilient Infrastructure: London, UK, 2016; pp. 1–11. [Google Scholar]
- DIN Standards Committee Building and Civil Engineering, European Standard Norme EN. Cement—Part 1: Composition, Specifications and Conformity Criteria for Common Cements 197-1; European Committee for Standardization: Brussels, Belgium, 2000; pp. 1–29. [Google Scholar]
- American Society for Testing and Materials (ASTM) C494. Standard Specification for Chemical Admixtures for Concrete; American Society for Testing and Materials (ASTM): West Conshohocken, PA, USA, 2015. [Google Scholar]
- ASTM C192. Standard Practice for Making and Curing Concrete Test Specimens in the Laboratory; American Society for Testing and Materials: West Conshohocken, PA, USA, 2012. [Google Scholar]
- NF P 18-400 Concretes—Moulds for Cylindrical and Prismatic Test; Association Française de NORmalisation AFNOR: Paris, France, 1981; ISBN 978-2-12-131871-4.
- ACI Committee 318. Building Code Requirements for Structural Concrete and Commentary; American Concrete Institute: Farmington Hills, MI, USA, 2014; p. 520. [Google Scholar]
- Poon, C.; Shui, Z.; Lam, L. Effect of microstructure of ITZ on compressive strength of concrete prepared with recycled aggregates. Constr. Build. Mater. 2004, 18, 461–468. [Google Scholar] [CrossRef]
- Boudali, S.; Soliman, A.M.; Abdulsalam, B.; Ayed, K.; Kerdal, D.E.; Poncet, S. Microstructural Properties of the Interfacial Transition Zone and Strength Development of Concrete Incorporating Recycled Concrete Aggregate. Int. J. Civil Envir. Struct. Constr. Archit. Eng. 2017, 11, 966–970. [Google Scholar]
- Señas, L.; Priano, C.; Marfil, S. Influence of recycled aggregates on properties of self-consolidating concretes. Constr. Build. Mater. 2016, 113, 498–505. [Google Scholar] [CrossRef]
- Gayarre, F.L.; Serna, P.; Cabo, A.D.; López, M.; Ángel, S.; López-Colina, C. Influence of recycled aggregate quality and proportioning criteria on recycled concrete properties. Waste Manag. 2009, 29, 3022–3028. [Google Scholar] [CrossRef] [PubMed]
- Sim, J.; Park, C. Compressive strength and resistance to chloride ion penetration and carbonation of recycled aggregate concrete with varying amount of fly ash and fine recycled aggregate. Waste Manag. 2011, 31, 2352–2360. [Google Scholar] [CrossRef]
- Yaprak, H.; Aruntas, H.Y.; Demir, I.; Simsek, O. Effects of the fine recycled concrete aggregates on the concrete properties. Int. J. Phys. Sci. 2011, 6, 2455–2461. [Google Scholar]
- Fan, C.-C.; Huang, R.; Hwang, H.; Chao, S.-J. Properties of concrete incorporating fine recycled aggregates from crushed concrete wastes. Constr. Build. Mater. 2016, 112, 708–715. [Google Scholar] [CrossRef]
- Huda, S.B. Mechanical and Durability Properties of Recycled and Repeated Recycled Coarse Aggregate Concrete. Ph.D. Thesis, University of Britsh Columbia, Vancouver, BC, Canada, 2014. [Google Scholar]
- Huda, S.B.; Alam, M.S. Mechanical and Freeze-Thaw Durability Properties of Recycled Aggregate Concrete Made with Recycled Coarse Aggregate. J. Mater. Civ. Eng. 2015, 27, 04015003. [Google Scholar] [CrossRef]
- Kapoor, K.; Singh, S.P.; Singh, B. Water Permeation Properties of Self Compacting Concrete Made with Coarse and Fine Recycled Concrete Aggregates. Int. J. Civ. Eng. 2016, 16, 47–56. [Google Scholar] [CrossRef]
- Corinaldesi, V. Mechanical and elastic behaviour of concretes made of recycled-concrete coarse aggregates. Constr. Build. Mater. 2010, 24, 1616–1620. [Google Scholar] [CrossRef]
- Limbachiya, M.C.; Leelawat, T.; Dhir, R.K. Use of recycled concrete aggregate in high-strength concrete. Mater. Struct. 2000, 33, 574–580. [Google Scholar] [CrossRef]
- Buyle-Bodin, F.; Hadjieva-Zaharieva, R. Influence of industrially produced recycled aggregates on flow properties of concrete. Mater. Struct. 2002, 35, 504–509. [Google Scholar] [CrossRef]
- Etxeberria, M.; Vázquez, E.; Marí, A.; Barra, M. Influence of amount of recycled coarse aggregates and production process on properties of recycled aggregate concrete. Cem. Concr. Res. 2007, 37, 735–742. [Google Scholar] [CrossRef]
- Corinaldesi, V.; Moriconi, G. The role of industrial by-products in self-compacting concrete. Constr. Build. Mater. 2011, 25, 3181–3186. [Google Scholar] [CrossRef]
- Etxeberria Larrañaga, M. Experimental Study on Microstructure and Structural Behaviour of Recycled Aggregate Concrete. Ph.D. Thesis, Universitat Politecnica de Catalunya, Barcelona, Spain, 2004. [Google Scholar]


| Parameters (Unit) | Min | Max | Mean | Standard Deviation | |
|---|---|---|---|---|---|
| Inputs | Binder content (B) (kg/m³) | 208 | 460 | 363.22 | 72.33 |
| Water/binder ratio (W/B) | 0.4 | 0.65 | 0.49 | 0.08 | |
| Natural aggregates (NA) (kg/m³) | 0 | 1290 | 504.89 | 454.11 | |
| Recycled concrete aggregates (RCA) (kg/m³) | 0 | 1215 | 396.78 | 398.34 | |
| Natural pozzolana (NP) (kg/m³) | 0 | 140 | 7 | 30.51 | |
| Fly ash (FA) (kg/m³) | 0 | 185 | 30.12 | 61.23 | |
| Fine recycled concrete powder (FRCP) (kg/m³) | 0 | 140 | 5.83 | 27.98 | |
| Natural sand (NS) (kg/m³) | 0 | 1050 | 600.03 | 230.25 | |
| Recycled sand (RS) (kg/m³) | 0 | 1050 | 90.1 | 218.85 | |
| Curing time (days) | 3 | 180 | 35.04 | 38.61 | |
| Output | Compressive strength of RSCC (MPa) | 12 | 65 | 37.81 | 12.22 |
| Parameters | Values |
|---|---|
| Number of input layer units | 10 |
| Number of hidden layers | 1 |
| Number of hidden layer units | 10 |
| Number of output layer units | 1 |
| Learning rate | 0.01 |
| Performance goal | 10−5 |
| Parameter | Description |
|---|---|
| B (kg/m³) | Binder Content |
| W/B | Water/binder Ratio |
| NA (kg/m³) | Natural Aggregate |
| RCA (kg/m³) | Recycled Concrete Aggregates |
| NP (kg/m³) | Natural Pozzolana |
| FA (kg/m³) | Fly Ash |
| FRCP (kg/m³) | Fine Recycled Aggregate Powder |
| NS (kg/m³) | Natural Sand |
| RS (kg/m³) | Recycled Sand |
| CT (days) | Curing Time |
| Evaluation Parameters | R | R2 | MSE | RMSE | MAE | NMAE |
|---|---|---|---|---|---|---|
| Training | 0.97 | 0.93 | 0.01 | 0.1 | 0.043 | 2.49 |
| Testing | 0.96 | 0.92 | 0.01 | 0.1 | 0.066 | 4.61 |
| Sample | Fine Aggregates (kg/m³) | Coarse Aggregates (kg/m3) | Additives | |||||
|---|---|---|---|---|---|---|---|---|
| Binder (kg/m³) | W | W/B | S (kg/m³) | NA(kg/m3) | RCA (kg/m3) | FRCP (kg/m3) | NP (kg/m3) | |
| SCSC1 | 620 | 225 | 0.36 | 1213 | 303 | 0 | 0 | 170 |
| RSCSC2 | 620 | 225 | 0.36 | 1213 | 0 | 303 | 170 | 0 |
| RSCSC3 | 620 | 225 | 0.36 | 1213 | 303 | 0 | 0 | 170 |
| RSCSC4 | 620 | 225 | 0.36 | 1213 | 0 | 303 | 170 | 0 |
| CS (MPa) | ||||
|---|---|---|---|---|
| Times (Days) | SCSC1 | RSCSC2 | RSCSC3 | RSCSC4 |
| 7 | 24.25 | 25.22 | 26.19 | 27.16 |
| 28 | 38.8 | 37.83 | 38.8 | 45.6 |
| 60 | 43.65 | 43.65 | 47.53 | 53.35 |
| 90 | 45.6 | 46.56 | 50.44 | 54.32 |
| 180 | 47.53 | 49.5 | 53.35 | 55.94 |
Publisher’s Note: MDPI stays neutral with regard to jurisdictional claims in published maps and institutional affiliations. |
© 2021 by the authors. Licensee MDPI, Basel, Switzerland. This article is an open access article distributed under the terms and conditions of the Creative Commons Attribution (CC BY) license (http://creativecommons.org/licenses/by/4.0/).
Share and Cite
Boudali, S.; Abdulsalam, B.; Rafiean, A.H.; Poncet, S.; Soliman, A.; ElSafty, A. Influence of Fine Recycled Concrete Powder on the Compressive Strength of Self-Compacting Concrete (SCC) Using Artificial Neural Network. Sustainability 2021, 13, 3111. https://doi.org/10.3390/su13063111
Boudali S, Abdulsalam B, Rafiean AH, Poncet S, Soliman A, ElSafty A. Influence of Fine Recycled Concrete Powder on the Compressive Strength of Self-Compacting Concrete (SCC) Using Artificial Neural Network. Sustainability. 2021; 13(6):3111. https://doi.org/10.3390/su13063111
Chicago/Turabian StyleBoudali, Sara, Bahira Abdulsalam, Amir Hossein Rafiean, Sébastien Poncet, Ahmed Soliman, and Adel ElSafty. 2021. "Influence of Fine Recycled Concrete Powder on the Compressive Strength of Self-Compacting Concrete (SCC) Using Artificial Neural Network" Sustainability 13, no. 6: 3111. https://doi.org/10.3390/su13063111
APA StyleBoudali, S., Abdulsalam, B., Rafiean, A. H., Poncet, S., Soliman, A., & ElSafty, A. (2021). Influence of Fine Recycled Concrete Powder on the Compressive Strength of Self-Compacting Concrete (SCC) Using Artificial Neural Network. Sustainability, 13(6), 3111. https://doi.org/10.3390/su13063111