Article

Numerical Analysis of the Effect of Ground Dampness on Heat Transfer between Greenhouse and Ground

by
Grzegorz Nawalany
and
Paweł Sokołowski
*
Department of Rural Building, Faculty of Environmental Engineering, University of Agriculture in Krakow, al. Mickiewicza 24/28, 30-059 Krakow, Poland
*
Author to whom correspondence should be addressed.
Sustainability 2021, 13(6), 3084; https://doi.org/10.3390/su13063084
Submission received: 21 February 2021 / Revised: 5 March 2021 / Accepted: 7 March 2021 / Published: 11 March 2021
(This article belongs to the Special Issue Advances and Challenges in the Sustainable Water Management)

Abstract

:
This paper deals with the problem of the influence of ground dampness on heat exchange between greenhouse and ground. The effect of humidity on the distribution of ground temperature fields was analyzed. The analysis was performed based on the analytical numerical method in the WUFI®plus software. The computational tool was used after a validation process. Research and simulations were conducted on the example of a real single-span greenhouse located in Southern Poland. The results of indoor and outdoor air temperature measurements were used to determine the boundary conditions, while the measured ground temperatures were used to compare with the results of theoretical calculations. Three variants were used for calculation analysis, assuming different levels of ground dampness. Analysis of the test results showed that during the summer period, dry ground provides 8% more thermal energy to the interior of the greenhouse than the damp ground, and provides 30% more thermal energy than wet ground. In the transition period (autumn/spring), the ground temperature fields are arranged parallel to the floor level, while the heat flux is directed from the ground to the interior of the greenhouse, regardless of the ground dampness level. During this period, the ground temperature ranges from 4.0 °C to 13.0 °C. Beneficial effect of dry ground, which contributes to maintaining an almost constant temperature under the greenhouse floor, was found in winter.

1. Introduction

Greenhouse facilities are steadily increasing their share of crop production worldwide. According to statistics maintained by US company Cuesta Roble Consulting, the global area of greenhouse cultivation expanded by 34% over the last 40 years. As of January 2019, there is an estimated area of 496,800 hectares (1,228,000 acres) of the world’s greenhouse crops, accounting for 9% of all covered crops. Agricultural greenhouses greatly support the cultivation of crops in a controlled manner, thereby protecting crops from the random effects of natural weather conditions [1,2,3]. The operation of greenhouses is often associated with high heating costs [4,5]. As a result, it is necessary to look for technical and technological solutions that would allow us to optimize the plant production process in greenhouses, and thus reduce the maintenance cost of these facilities. One possibility is the use of renewable energy devices and conventional energy-saving devices [6,7,8,9].
Studies of greenhouse facilities are the area of interest to many researchers. Most are case studies based on previously conducted field studies [10,11,12,13,14,15]. The operation of greenhouse facilities is a very complex phenomenon, due to the dynamics of physical processes occurring inside and in their surroundings. The diversity of these processes is closely related, e.g., to the external weather conditions, the internal microclimate, the greenhouse design, the type of cultivation, the automation used, and the type of ground under and around the greenhouse. [10,16]. Numerical modeling, based on accurate physical models of existing buildings, should be used to gain an accurate understanding of the interaction between different conditions in a greenhouse and its surroundings. Numerical methods allow us to take into account the variables that directly affect the development of the microclimate inside the greenhouse, and its effect on the surrounding environment [17,18].
One of the elements directly affecting the microclimate inside a greenhouse is the ground underneath it and in its vicinity [11,19,20]. The temperature variation of the ground under the greenhouse is influenced by both the internal and external microclimate. The distribution of temperature fields in the ground, can be analyzed using mathematical models based on heat balance equations, and taking into account numerous important technical parameters, such as ground density, heat capacity, heat transfer coefficient, as well as diffusion resistance [21,22]. Computer simulations greatly support calculations of the natural temperature distribution in the ground, which in turn allows the interaction between the building and the underlying and surrounding ground to be demonstrated [23].
Moisture content is an important parameter that significantly affects the distribution of temperature fields in the ground [24]. In order to model the ground medium, two components should be considered, i.e., the constant component (mineralogical composition) and the dynamic component (varying ground moisture and temperature) [25,26]. On the other hand, the variable ground moisture affects the technical parameters of the ground, especially its heat transfer coefficient. Increased moisture content of the ground significantly increases its heat transfer [26].
The aim of this study was to present the effect of the ground moisture level on heat transfer between the greenhouse and the ground, as well as the distribution of temperature fields in the ground. The analysis was performed based on the analytical numerical method in the WUFI®plus software.

2. Materials and Methods

The experimental study was conducted in a standalone, single-span greenhouse located in the southern part of Poland [11]. The object measuring 12.0 × 43.0 × 4.3 m3 was made with a steel construction. The foundation of the greenhouse was concrete, with dimensions of 0.3 × 1.3 m2. The foundation was made at a depth of 1.0 m below ground level. The walls and roof were made of single 4-mm thick glass sheets. The building was heated by a piped water system fed from a solid-fuel boiler room. The heating pipes were located 2.5 m above the floor.
The identification of the ground under and around the greenhouse showed that under the 0.1 m layer of fertile soil, there was a sandy clay with a thickness of 1.5 m.
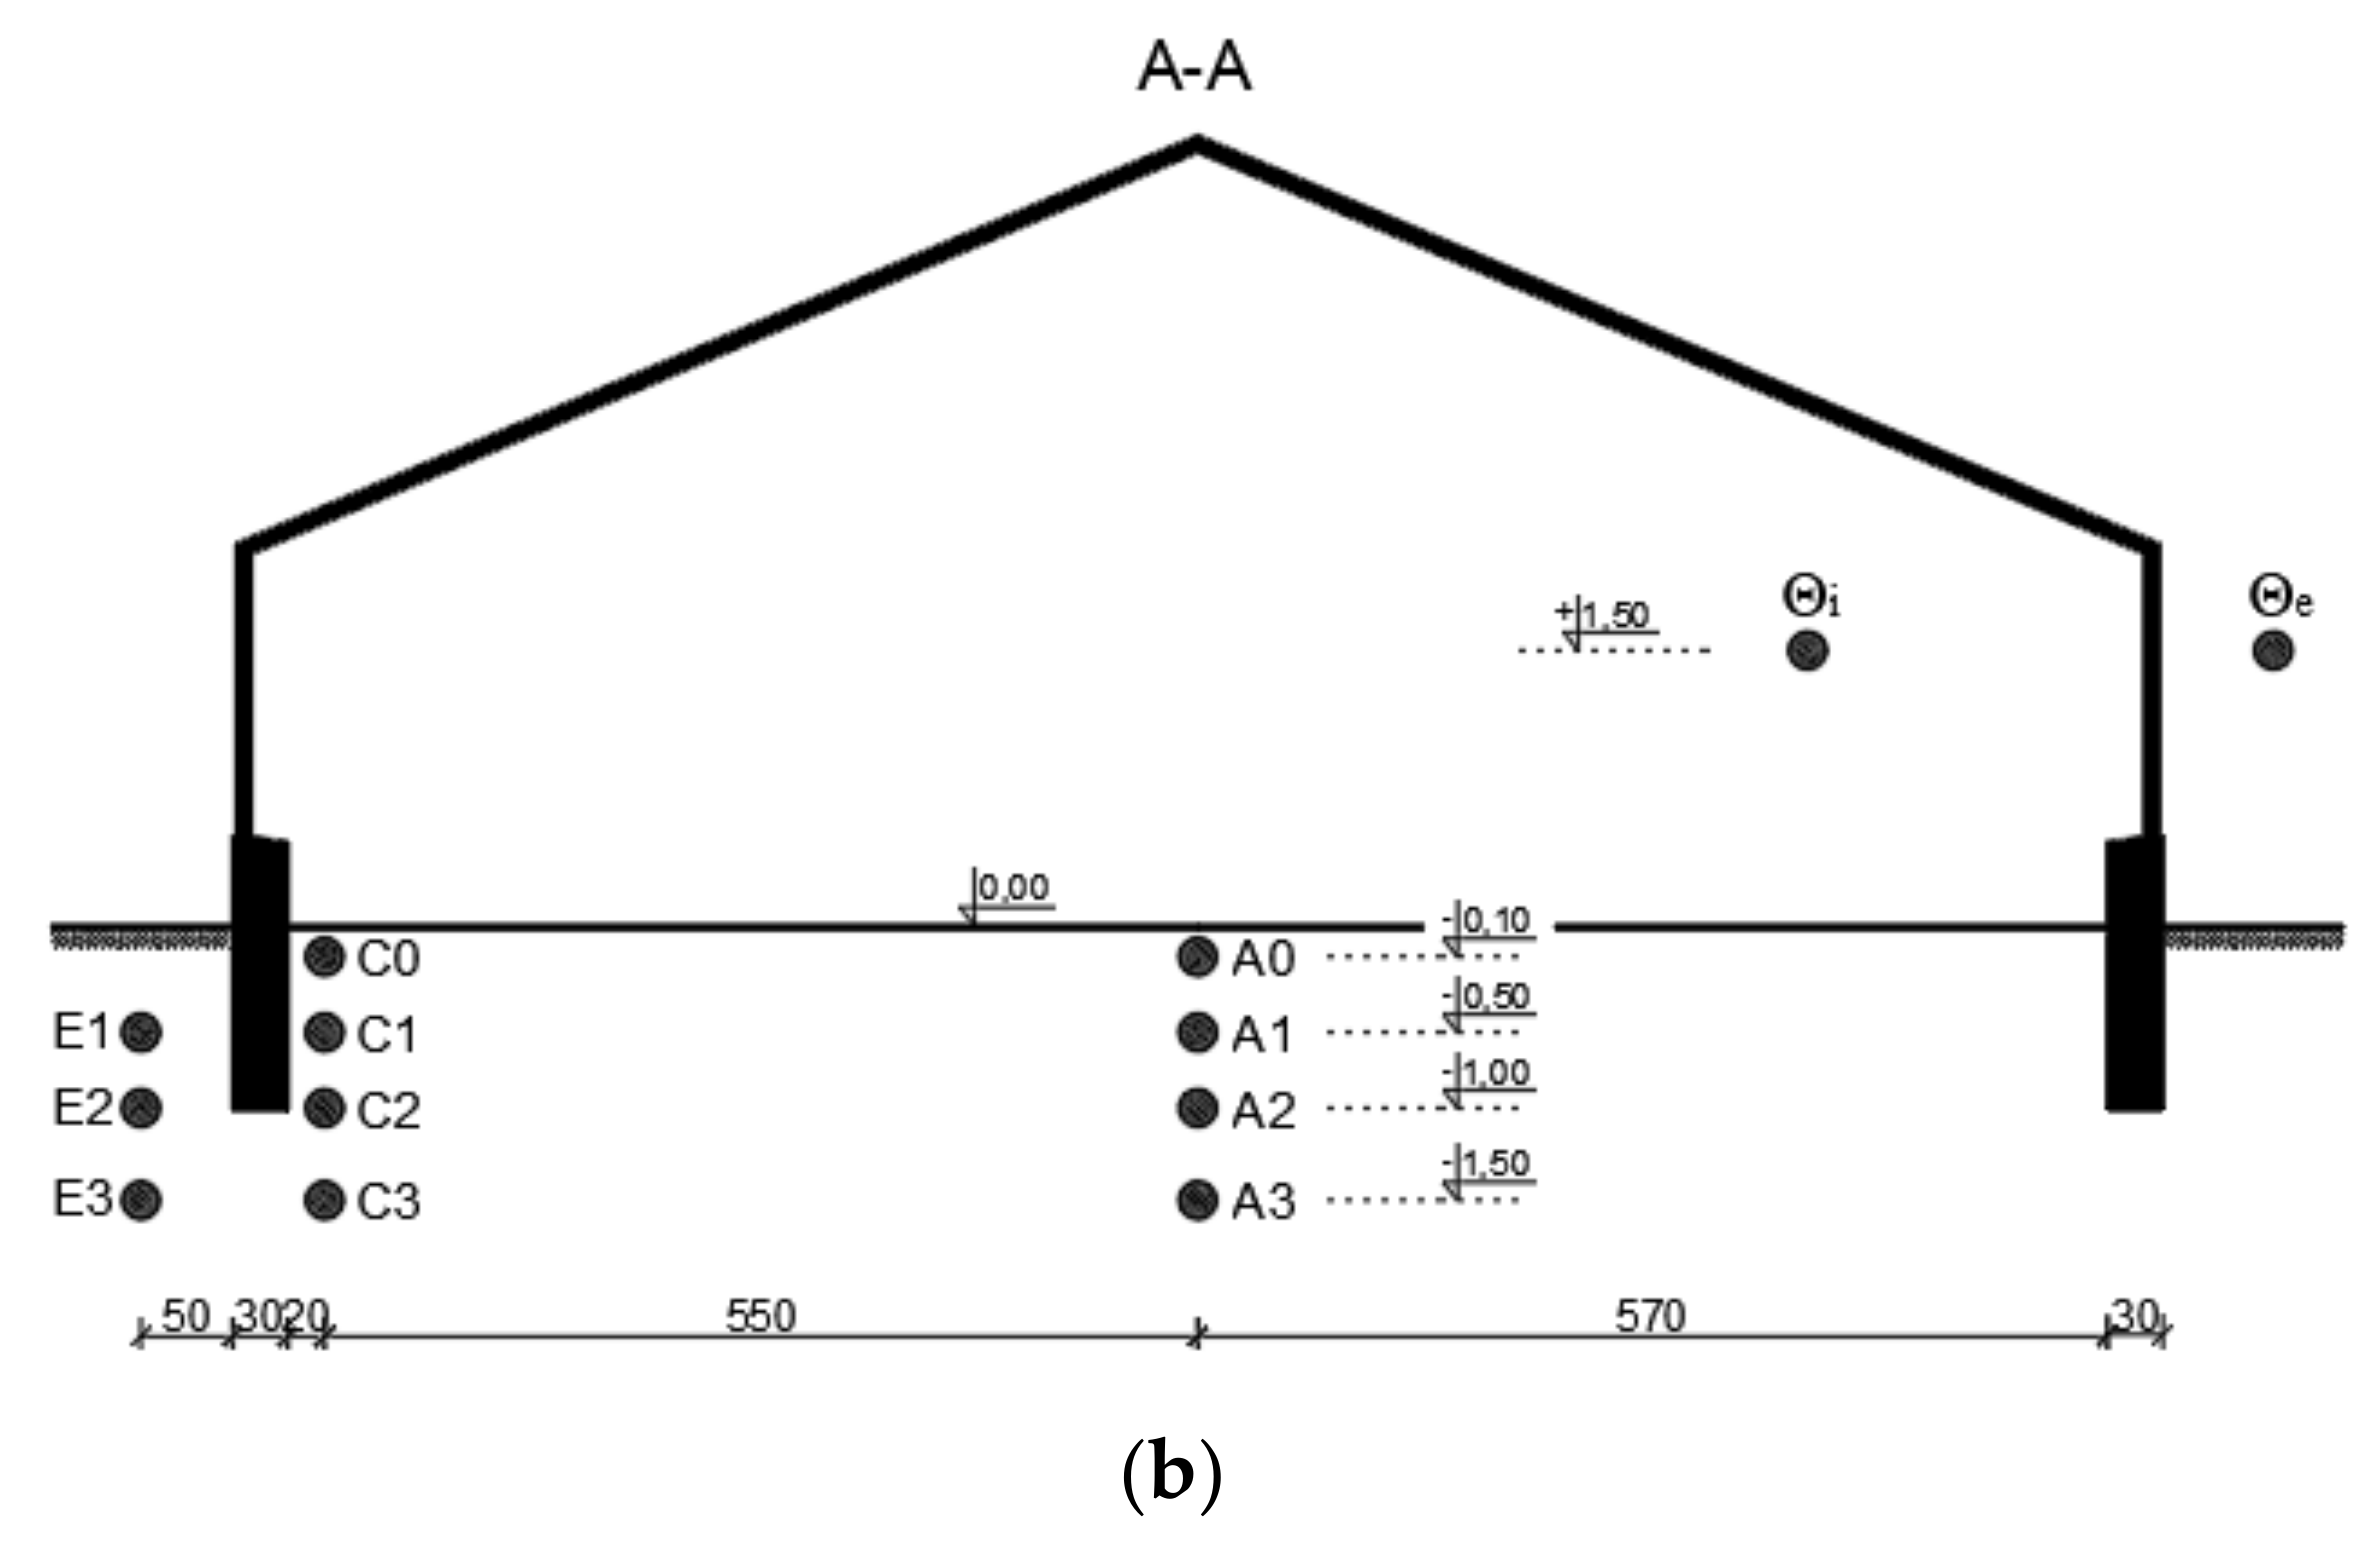
A measuring cross section A-A was established in the middle of the greenhouse length, with 3 vertical measuring sections (Figure 1).
Twelve PT-100 sensors with an accuracy of ±0.1 °C were used to measure the ground temperature. A PT-100 sensor placed at a height of 1.50 m was used to measure indoor air temperature. The outdoor temperature was measured with 1 PT-100 sensor placed in the meteorological instrument shelter. The time interval of ground and air temperature measurements was 1 h, and the results were recorded with HP’s multi-channel Data Logger.
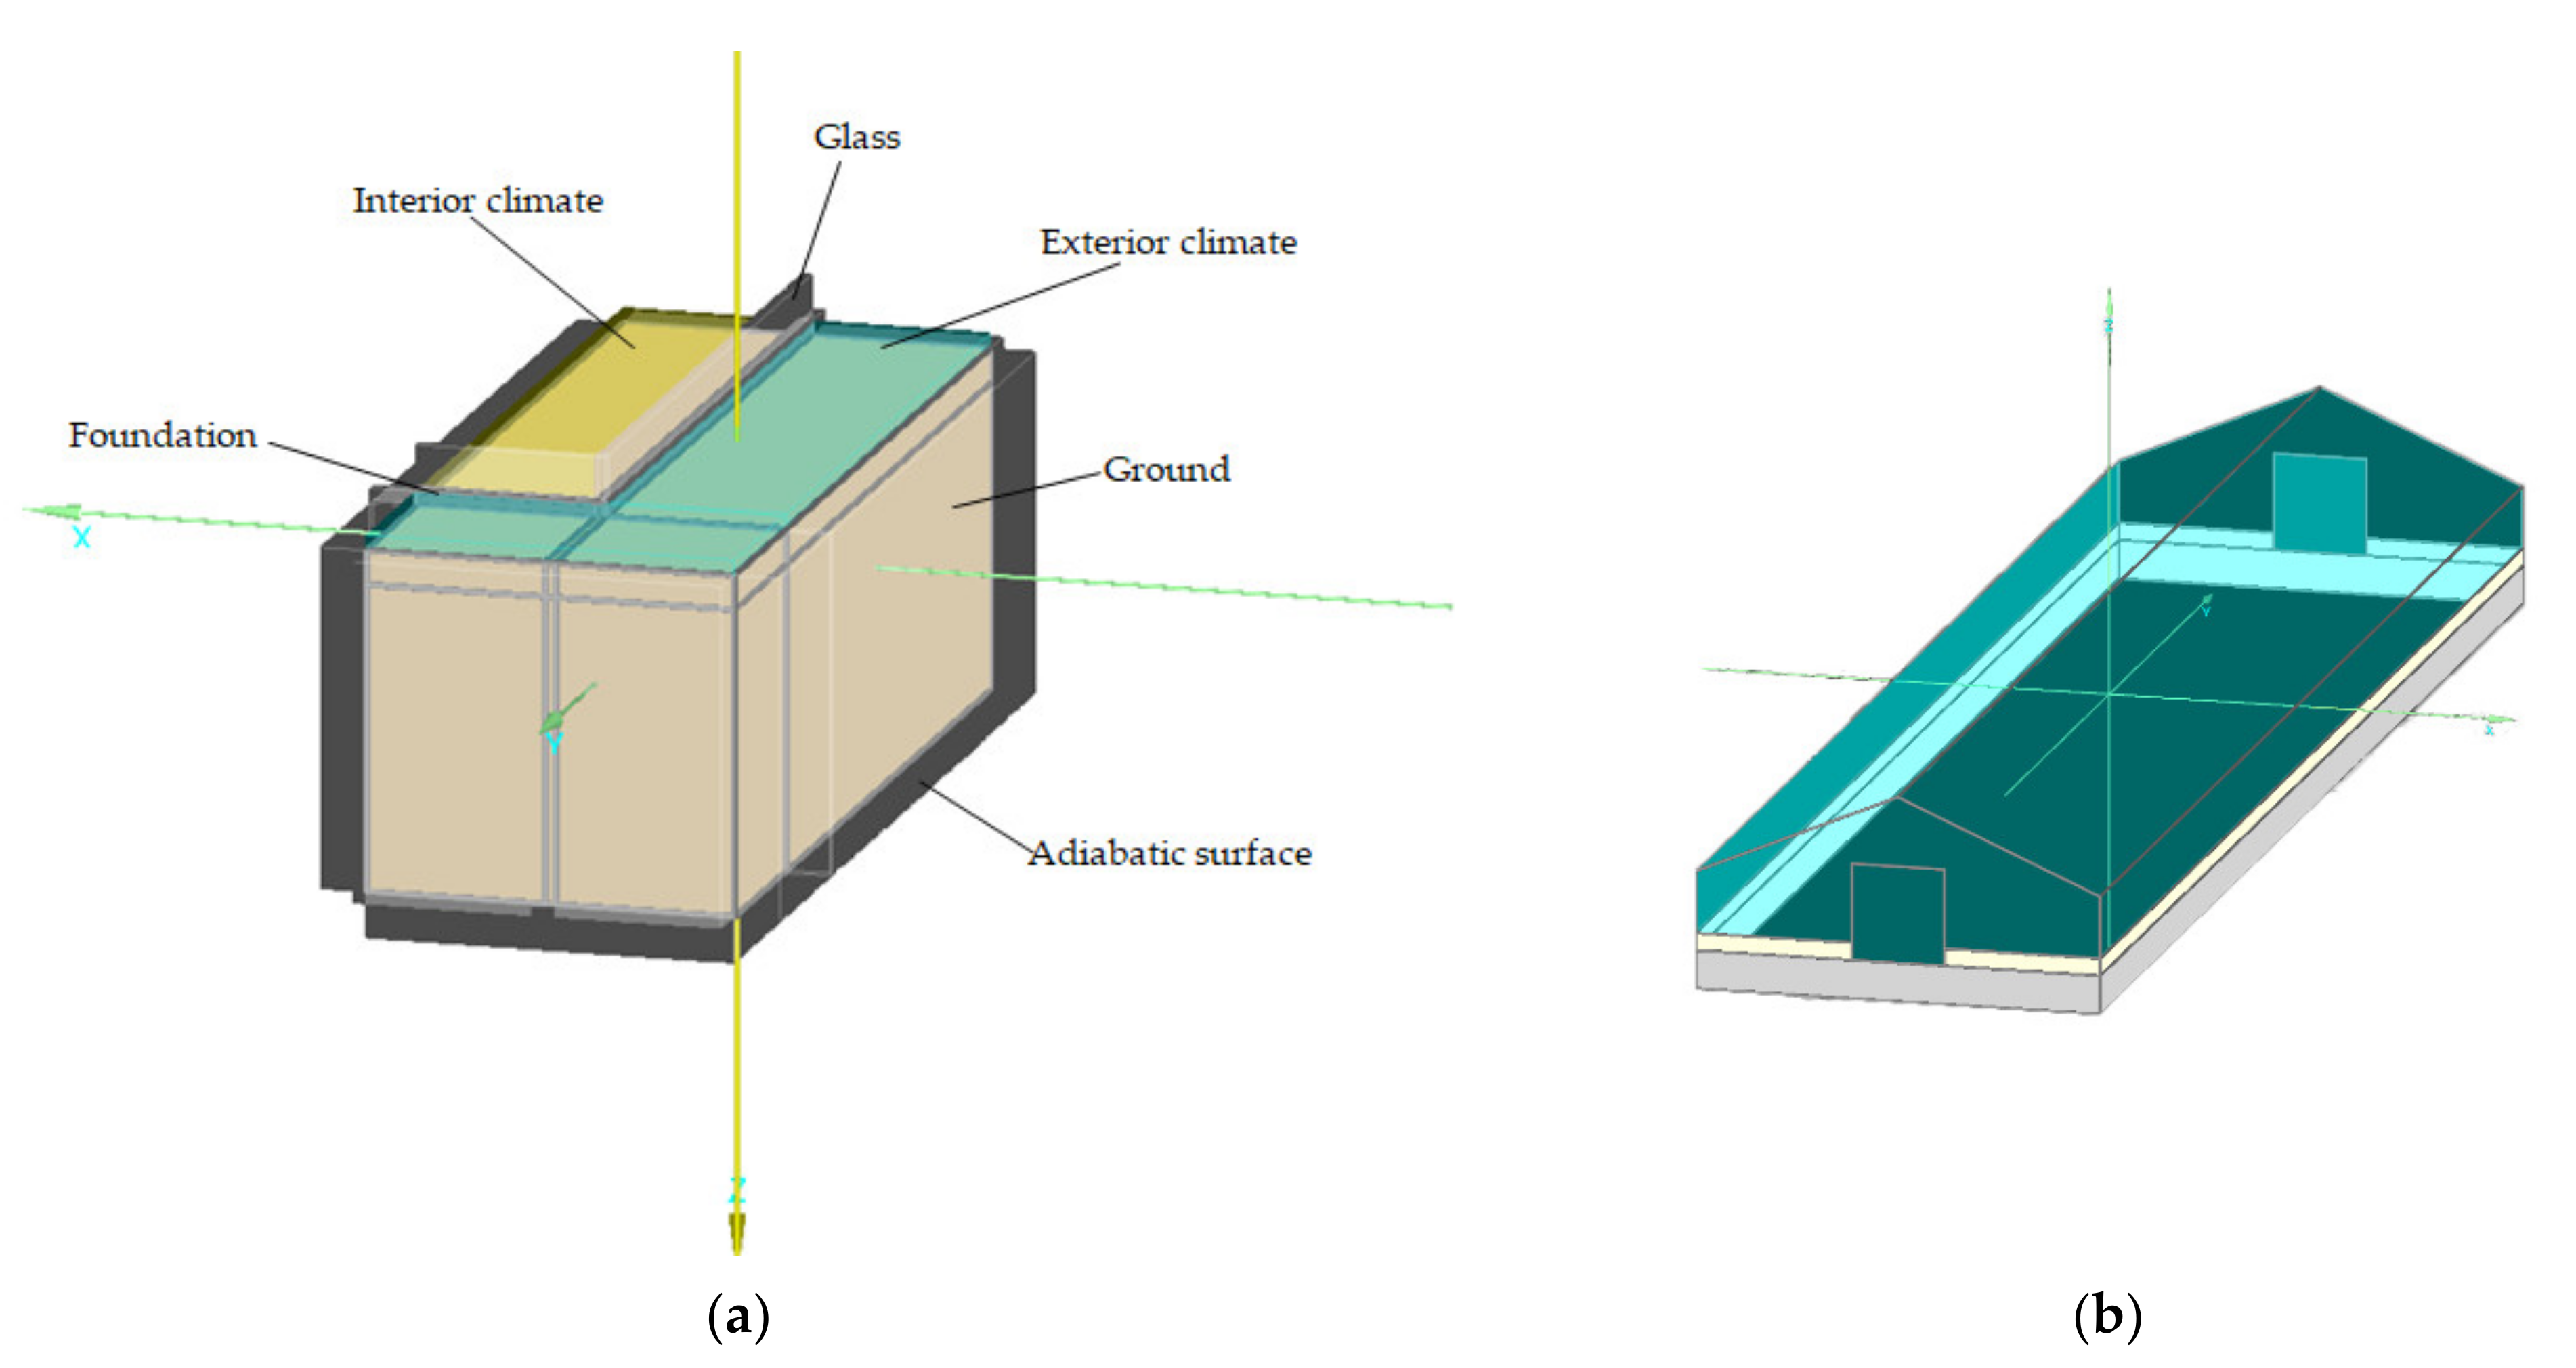
Calculations of the heat transfer in the ground were made using the WUFI®plus computer software. This software was developed at the Fraunhofer Institute for Building Physics in Holzkirchen, Germany. WUFI allows thermal, energy, and humidity simulations for buildings, taking into account the real technical parameters adopted according to European standards, or obtained from experimental studies. Calculations related to heat and moisture transfer were verified and confirmed by scientific studies [27]. The software is equipped with an independent panel of 3D objects, in which it is possible to precisely simulate the dynamics of the physical phenomena occurring in the ground in conjunction with the building, taking all thermal bridges into account. The 3D panel calculations are also verified in terms of the DIN EN ISO 10,211 standard (DIN, 2008), andareconfirmed in scientific studies [28,29]. The results of indoor and outdoor air temperature measurements were used to determine the boundary conditions, while the measured ground temperatures were used to compare with the results of theoretical calculations. The calculation model assumes the separation of a cuboid of ground under the building and in its surroundings, in which a three-dimensional heat transfer occurs (Figure 2).
In the calculation model, physical parameters of the greenhouse partitions and the ground were taken into account (Table 1), based on the PN-EN ISO 6946:2008 standard.
The computational analysis required validation of the computational tool. The model validation consisted of appropriate selection of heat transfer coefficient values for the ground and greenhouse external walls (Table 1), assuming the period preceding the proper calculation period (180 days were assumed), which allowed for the so-called model fitting, selection of appropriate ventilation, and air infiltration fluxes (0.5 h−1 infiltration and ventilation flux within 0.0–5.0 h−1 were assumed), and selection of the initial ground temperature (8.8 °C was assumed, corresponding to the average annual temperature of external air in the studied area) [10].
After validating the model, a variant analysis of the effect of ground dampness on the variation of temperature fields in the ground and the effect on heat exchange between the greenhouse and the ground was carried out. A medium sand was used for the variant analysis due to the possibility of obtaining a larger range of heat transfer coefficient with varying ground moisture. The physical parameters of the ground and the variants adopted are given in Table 2 [26].
The simulations were carried out for the entire year, assuming different ground moisture conditions. The obtained results were used to analyze the temperature fields in the ground under the greenhouse and in its surroundings. Temperature fields were also determined for each of the analyzed variants, for selected days of the year.

3. Results

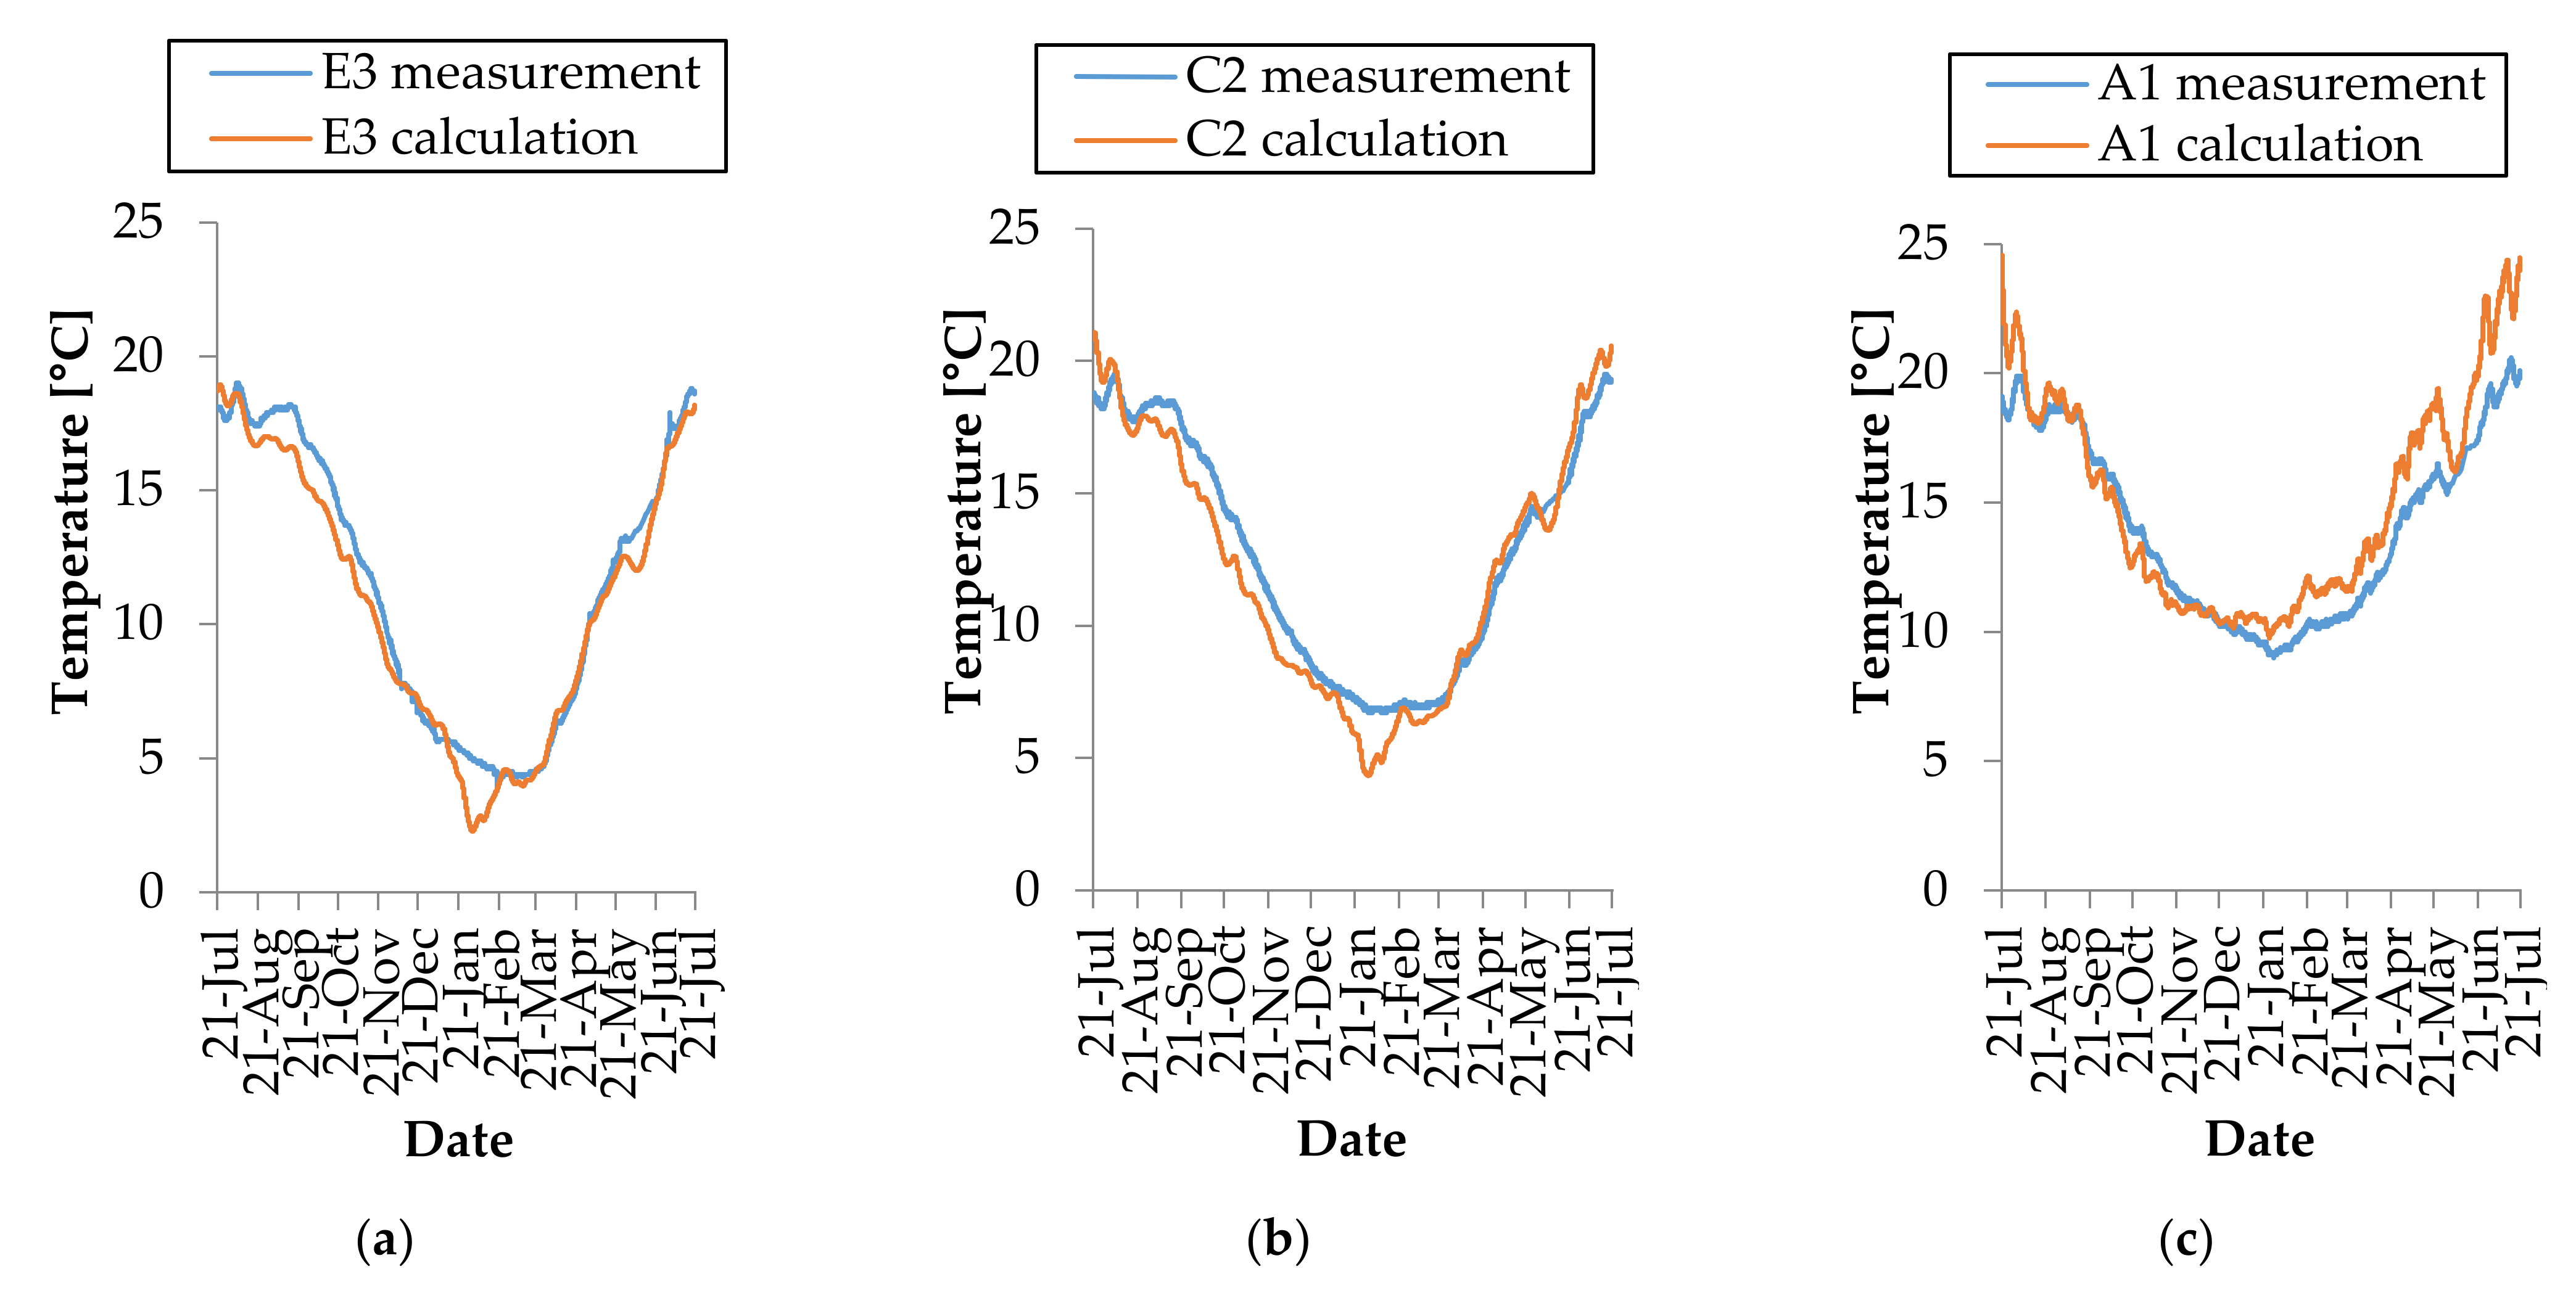
A previously validated computational tool was used for variance analysis, the validation results showed a strong correlation (Spearman’s test: 0.97) between experimental data and theoretical results [10]. Figure 3 shows selected calculated and measured ground temperature waveforms.
The calculation analysis carried out for three design variants showed the effect of ground moisture on the heat transfer intensity (Figure 4). Dry ground was characterized by a greater ability to accumulate energy, which flows inside the greenhouse during periods of decreasing exterior air temperature. The largest energy gains from the ground were found on 24 April. In case of dry ground (Variant 1), they amounted to 17.45 kW, while for wet ground (Variant 3), it was 15.37 kW (12% lower energy gain). Moist ground was characterized by increased energy losses, as compared to dry ground. On September 13, there were 85% higher losses for moist ground (2.82 kW), as compared to dry ground (1.53 kW). This was the result of increased heat transfer of the ground. By analyzing the all-year course of the heat transfer with the ground in the macro scale, one might state that the relation between energy losses and gains from the ground and the degree of the ground moisture was not linear. This was the result of other factors, such as solar radiation intensity, wind speed, indoor microclimate control, which significantly affected the heat exchange with the ground.
Detailed analysis of the numerical simulation results showed different effects of ground dampness on heat transfer for a specific season (Figure 5). In summer (July), dry ground (Variant 1) provides 8% more thermal energy to the greenhouse interior than moist ground (Variant 2), and 30% more thermal energy than wet ground (Variant 3). In transitional periods, particularly in autumn (November), this relationship reverses. Increased heat transfer of wet ground (Variant 3) and moist ground (Variant 2) contributes to the beneficial phenomenon of “reheating” the greenhouse interior to a much higher degree than dry ground (Variant 1). On November 26, there were 16 times (1600%) higher heat gains from wet ground than from dry ground. In the winter period (January), the effect of ground dampness on the heat transfer with the ground was the smallest. The course of heat transfer process for dry (Variant 1), moist (Variant 2), and wet (Variant 3) ground was similar. From a greenhouse facility operation perspective, it is more beneficial to adequately drain (dehumidify) the ground underneath the greenhouse and in its surroundings, because dry ground (Variant 1) provides more thermal energy in this period than moist ground (Variant 2) and wet ground (Variant 3).
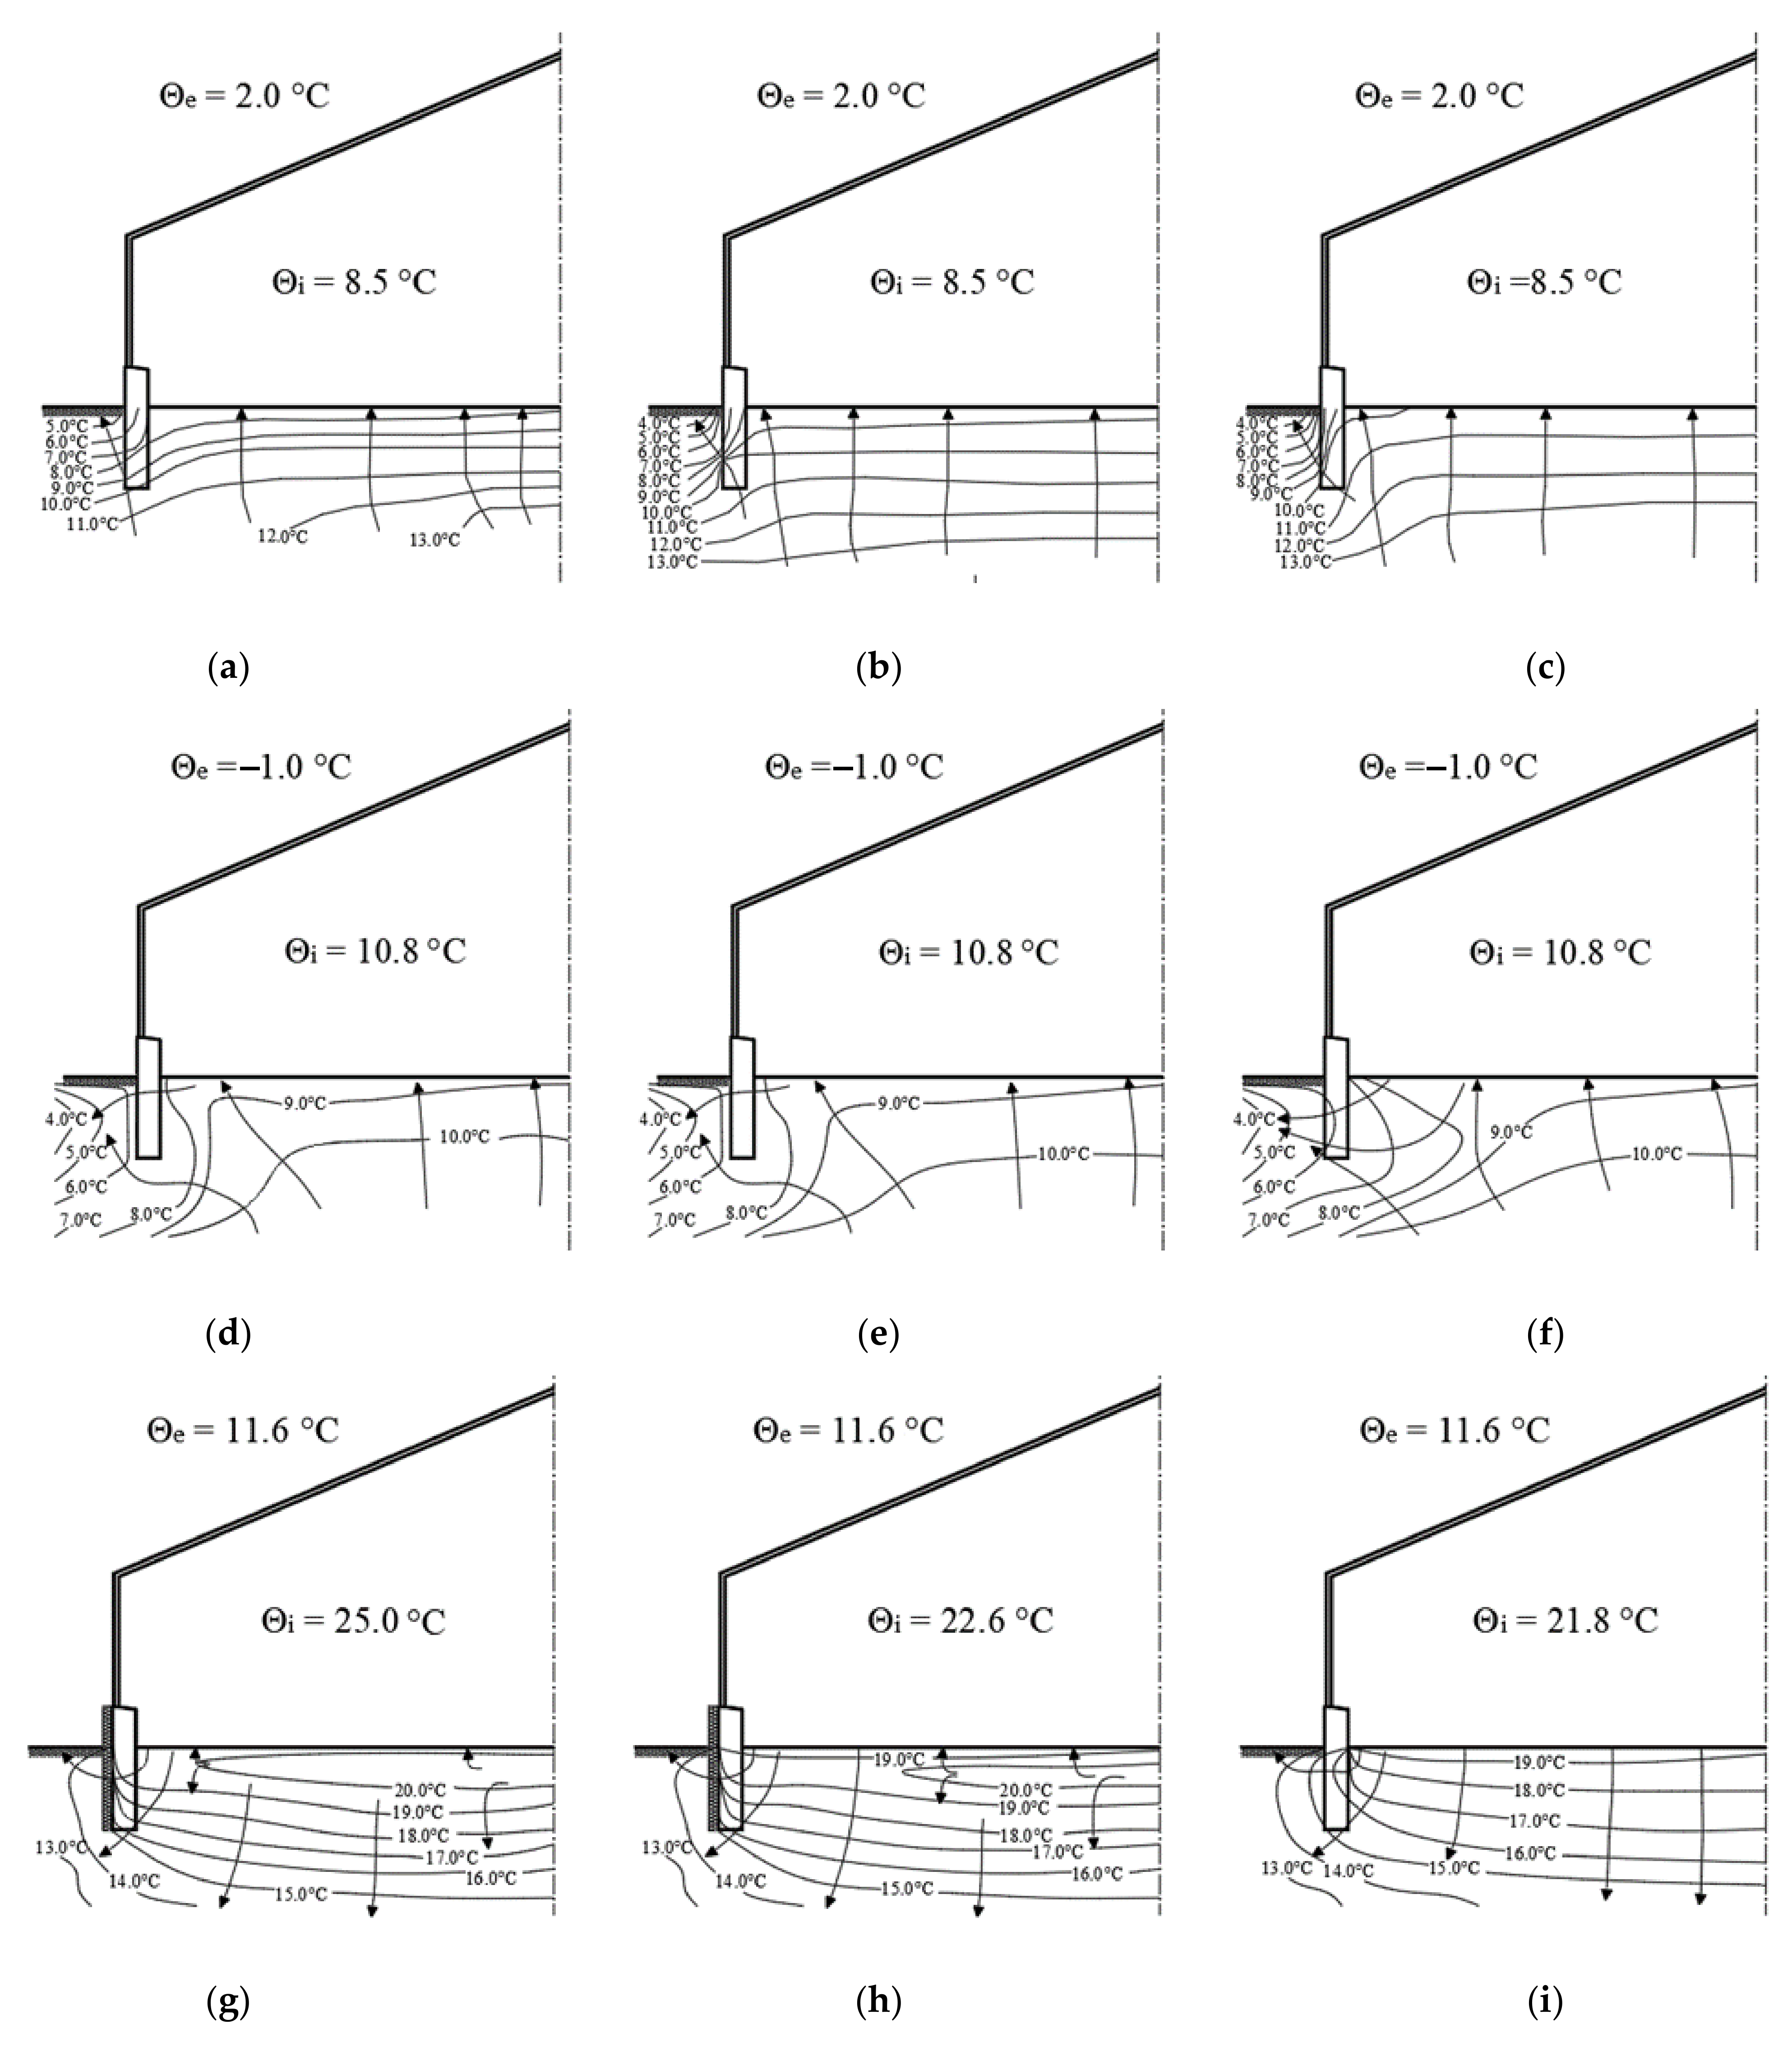
The aforementioned relations directly translated into the distribution of temperature fields in the ground and directions of heat flow (Figure 6). In the transition period (November), the ground temperature fields were arranged parallel to the floor level, while the heat flux was directed from the ground to the greenhouse interior (Figure 6a–c). The ground temperature range during this period was from 4.0 °C to 13.0 °C. In winter (January), the beneficial effect of dry ground (Variant 1) was quite evident, contributing to maintaining an almost constant temperature under the greenhouse floor. In case of moist ground (Variant 2) and wet ground (Variant 3), one can observe a strong tendency for ground cooling in the zone near the greenhouse foundation, by 1–2 °C. The effect of increased ground dampness on ground cooling was visible in summer. As a result of intense solar radiation, wet ground (Variant 3) more effectively removed heat from the heated greenhouse interior. The results of the detailed analysis showed that in the case of dry ground (Variant 1) lying under the greenhouse, the temperature field directly under the floor had a value 1–1.5 °C higher, as compared to Variant 3 (wet ground).

4. Discussion

Numerical modeling of the effect of the ground dampness level on heat exchange with the ground, and the formation of the temperature field distribution in the ground under the greenhouse, was used in this paper. Model-based approach to similar phenomena was successfully applied by other authors [3,10,12,26]. Staniec and Nowak [26] analyzed the effect of varying ground dampness on the temperature distribution, across its entire cross-section. The authors showed that accounting for varying ground moisture had little effect on the ground temperature field. This proved that the previous approach assuming homogeneous ground, and thus a constant distribution of moisture as a function of depth, gave a good result agreement for a ground, such as medium-grained sand. A similar approach was used in this study (constant dampness level in the ground profile). The applied WUFI®plus calculation tool was used repeatedly for non-stationary analyses, taking the coupling between the building and the ground into account [10,27,30,31,32,33,34].

5. Conclusions

The results of long-term experimental studies allowed the application of computational tools using numerical methods, to analyze the physical phenomena at hand. Achieving a high agreement between the measured and theoretical data, allowed us to obtain a validated computational model, which could be applied to a given case stage, assuming variables of selected factors and physical parameters. Despite the increasing popularization of computational methods, one should keep in mind some limitations that are associated with using these tools. This includes variable snow cover, which can affect the results obtained in the ground surrounding the studied building. The applied numerical method allowed for assessing the effect of ground dampness level on the formation of temperature fields in the ground, under the greenhouse and in its surroundings. Ground heat transfer results were also obtained for ground with different relative humidity. Water significantly increases the heat transfer coefficient of the ground, which has a beneficial effect in periods of excessive greenhouse interior overheating (summer). Wet ground allows more heat energy to be dissipated. In winter, however, it is preferable to keep the ground as dry as possible to reduce its heat transfer. The results of the performed simulation allow us to plan the extension of the study scope to include additional ground types and their dampness level. The validated greenhouse model can also be used to perform energy analysis for various types of external partitions, such as glass, polycarbonate, thermal insulation, and solar protection.

Author Contributions

Conceptualization, G.N. and P.S.; methodology, G.N. and P.S.; software, P.S.; validation, G.N. and P.S.; formal analysis, G.N. and P.S.; investigation, G.N.; resources, G.N.; data curation, G.N. and P.S.; writing—original draft preparation, G.N. and P.S.; writing—review and editing, G.N. and P.S.; visualization, G.N. and P.S.; supervision, G.N.; Both authors have read and agreed to the published version of the manuscript.

Funding

This research was funded by Faculty of Environmental Engineering, University of Agriculture in Krakow, through project “Subvention 031400-D014 Environmental Engineering, Mining and Energy”.

Institutional Review Board Statement

Not applicable.

Informed Consent Statement

Not applicable.

Data Availability Statement

Not applicable.

Conflicts of Interest

The authors declare no conflict of interest.

References

  1. Vadiee, A.; Martin, V. Energy management in horticultural applications through the closed greenhouse concept, state of the art. Renew. Sustain. Energy Rev. 2012, 16, 87–100. [Google Scholar] [CrossRef]
  2. Mohammadi, B.; Ranjbar, S.F.; Ajabshirchi, Y. Application of dynamic model to predict some inside environment variables in a semi-solar greenhouse. Inf. Process. Agric. 2018, 5, 279–288. [Google Scholar] [CrossRef]
  3. Taki, M.; Ajabshirchi, Y.; Ranjbar, S.F.; Rohani, A.; Matloobi, M. Modeling and experimental validation of heat transfer and energy consumption in an innovative greenhouse structure. Inf. Process. Agric. 2016, 3, 57–74. [Google Scholar] [CrossRef] [Green Version]
  4. Yang, L.-H.; Huang, B.-H.; Hsu, C.-Y.; Chen, S.-L. Performance analysis of an earth–air heat exchanger integrated into an agricultural irrigation system for a greenhouse environmental temperature-control system. Energy Build. 2019, 202. [Google Scholar] [CrossRef]
  5. Ghani, S.; Bakochristou, F.; ElBialy, E.M.A.A.; Gamaledin, S.M.A.; Rashwan, M.M.; Abdelhalim, A.M. Design challenges of agricultural greenhouses in hot and arid environments—A review. Eng. Agric. Environ. Food 2019, 12, 48–70. [Google Scholar] [CrossRef]
  6. Taki, M.; Rohani, A.; Rahmati-Joneidabad, M. Solar thermal simulation and applications in greenhouse. Inf. Process. Agric. 2018, 5, 83–113. [Google Scholar] [CrossRef]
  7. Menhoudj, S.; Mokhtari, A.M.; Benzaama, M.-H.; Maalouf, C.; Lachi, M.; Makhlouf, M. Study of the energy performance of an earth—Air heat exchanger for refreshing buildings in Algeria. Energy Build. 2018, 158, 2–12. [Google Scholar] [CrossRef]
  8. Choab, N.; Allouhi, A.; El Maakoul, A.; Kousksou, T.; Saadeddine, S.; Jamil, A. Review on greenhouse microclimate and application: Design parameters, thermal modeling and simulation, climate controlling technologies. Sol. Energy 2019, 191, 109–137. [Google Scholar] [CrossRef]
  9. Barbaresi, A.; Maioli, V.; Bovo, M.; Tinti, F.; Torreggiani, D.; Tassinari, P. Application of basket geothermal heat exchangers for sustainable greenhouse cultivation. Renew. Sustain. Energy Rev. 2020, 129. [Google Scholar] [CrossRef]
  10. Nawalany, G.; Radoń, J.; Bieda, W.; Sokołowski, P. Influence of selected factors on heat exchange with the ground in a greenhouse. Trans. Asabe 2017, 60, 479–487. [Google Scholar]
  11. Nawalany, G.; Bieda, W.; Radoń, J.; Herbut, P. Experimental study on development of thermal conditions In ground beneath a greenhouse. Energy Build. 2014, 69, 103–111. [Google Scholar] [CrossRef]
  12. Kittas, C.; Karamanis, M.; Katsoulas, N. Air temperature regime in a forced-ventilated greenhouse with rose crop. Energy Build. 2005, 37, 807–812. [Google Scholar] [CrossRef]
  13. Al-Kayssi, A.W. Spatial variability of soil temperature under greenhouse conditions. Renew. Energy 2002, 27, 453–462. [Google Scholar] [CrossRef]
  14. Nawalany, G.; Sokołowski, P.; Herbut, P.; Angrecka, S. Development of selected parameters of microclimate in a stand alone cellar plunged into soil. J. Ecol. Eng. 2017, 18, 156–161. [Google Scholar] [CrossRef]
  15. Nawalany, G.; Sokołowski, P. Analysis of hygrothermal conditions of external partitions in an underground fruit store. J. Ecol. Eng. 2016, 17, 75–82. [Google Scholar] [CrossRef]
  16. Sethi, V.P.; Sumathy, K.; Chiwon, L.; Pal, D.S. Thermal modelling aspects of solar greenhouse microclimate control: A review on heating technologies. Sol. Energy 2013, 96, 56–82. [Google Scholar] [CrossRef]
  17. Panwar, N.L.; Kaushik, S.C.; Kothari, S. Solar greenhouse an option for renewable and sustainable farming. Renew. Sustain. Energy Rev. 2011, 15, 34–45. [Google Scholar] [CrossRef]
  18. Liying, C.; Sanpeng, H.; Minghan, C.; Danfeng, H. Temperature-driven growth shape simulation and model of greenhouse melon leaves. Math. Comput. Model. 2011, 54, 1175–1180. [Google Scholar]
  19. Ghosal, M.K.; Tiwari, G.N.; Srivastava, N.S. Thermal modelling of a greenhouse with an integrated earth to air heat exchanger: An experimental validation. Energy Build. 2004, 36, 219–227. [Google Scholar] [CrossRef]
  20. Kurpaska, S.; Latała, H. Energy analysis of heat sur plus storage systems in plastic tunnels. Renew. Energy 2010, 35, 2656–2665. [Google Scholar] [CrossRef]
  21. Larwa, B. Heat transfer model to predict temperature distribution in the ground. Energies 2019, 12, 25. [Google Scholar] [CrossRef] [Green Version]
  22. Mihalakakou, G.; Santamouris, M.; Lewis, J.O.; Asimakopoulos, D.N. On the application of the energy balance equation to predict ground temperature profiles. Sol. Energy 1997, 60, 181–190. [Google Scholar] [CrossRef]
  23. Yilmaz, T.; Oezbek, A.; Yilmaz, A.; Bueyuekalaca, O. Influence of upper layer properties on the ground temperature distribution. J. Therm. Sci. Technol. 2009, 29, 43–51. [Google Scholar]
  24. Cosenza, P.; Guérin, R.; Tabbagh, A. Relationship Between Thermal Conductivity and Water Content of Soils Using Numerical Modeling. Eur. J. Soil Sci. 2003, 54, 581–588. [Google Scholar] [CrossRef]
  25. Usowicz, B.; Marczewski, W. Rozkładwłaściwościcieplnychglebynaczarnymugorze i pod murawą. Acta Agrophisica 2005, 5, 745–757. [Google Scholar]
  26. Staniec, M.; Nowak, H. The influence of different soil moisture content on its vertical temperature distribution. Build. Phys. Theory Pract. 2007, 2, 255–260. [Google Scholar]
  27. Künzel, H.M.; Holm, A.; Zirkelbach, D.; Karagiozis, A.N. Simulation of interior temperature and humidity conditions including hygrothermal interactions with the building envelope. Sol. Energy 2005, 78, 554–561. [Google Scholar] [CrossRef]
  28. Antretter, F.; Pazold, M.; Radoń, J.; Künzel, H.M. Kopplung von dynamischer Wärmebrückenberechnung mit hygrothermischer Gebäudesimulation. Bauphysik 2013, 35, 181–192. [Google Scholar] [CrossRef]
  29. Antretter, F.; Radon, J.; Pazold, M. Coupling of dynamic thermal bridge and whole-building simulation. In Proceedings of the 12th International Conference Thermal Performance of the Exterior Envelopes of Whole Buildings, Clearwater, FL, USA, 1–15 December 2013. [Google Scholar]
  30. Staszczuk, A.; Kuczyński, T.; Radoń, J. Effect of hot weather periods in moderate climate regions on approach to slab thermal design in residential buildings. Build. Phys. (Nsb) 2011, 2, 825–832. [Google Scholar]
  31. Staszczuk, A.; Radoń, J.; Holm, A. Evaluation of simplified calculation method of heat exchange between building and ground. In Proceedings of the 1st Central European Symposium on Building Physics, Cracow, Poland, 13–15 September 2010; pp. 371–376. [Google Scholar]
  32. Sokołowski, P.; Nawalany, G. Analysis of Energy Exchange with the Ground in a Two-Chamber Vegetable Cold Store, Assuming Different Lengths of Technological Break, with the Use of a Numerical Calculation Method—A Case Study. Energies 2020, 13, 4970. [Google Scholar] [CrossRef]
  33. Nawalany, G.; Sokołowski, P. Improved Energy Management in an Intermittently Heated Building Using a Large Broiler House in Central Europe as an Example. Energies 2020, 13, 1371. [Google Scholar] [CrossRef] [Green Version]
  34. Nawalany, G.; Sokołowski, P. Building–Soil Thermal Interaction: A Case Study. Energies 2019, 12, 2922. [Google Scholar] [CrossRef] [Green Version]
Figure 1. Location of the measurement points in the greenhouse—(a) plan layout;(b) A-A cross-section, where A0–A3, B0–B3, and C0–C3 are ground temperature measurement points; θi—indoor air temperature, θe—outdoor air temperature.
Sustainability 13 03084 g001aSustainability 13 03084 g001b
Figure 2. Perpendicularity of the ground under the building and its surroundings in which the three-dimensional heat flow occurs (a). Axonometric projection of the greenhouse model (b).
Sustainability 13 03084 g002
Figure 3. Measured and calculated temperatures for the selected measurement points—(a) measurement point E3; (b) measurement point C2; and (c) measurement point A1.
Sustainability 13 03084 g003
Figure 4. Heat exchange between greenhouse and ground for a ground with varying dampness level.
Sustainability 13 03084 g004
Figure 5. Heat exchange between greenhouse and ground for a ground with varying dampness level—(a) in July; (b) in January; and (c) in November.
Sustainability 13 03084 g005
Figure 6. Distribution of temperature fields in the ground and directions of heat flow. (a) Variant 1—November; (b) Variant 2—November; (c) Variant 3—November; (d) Variant 1—January; (e) Variant 2—January; (f) Variant 3—January; (g) Variant 1—July; (h) Variant 2—July; and (i) Variant 3—July.
Sustainability 13 03084 g006
Table 1. Physical parameters of greenhouse partitions and ground taken into account in the simulation.
SpecificationValueUnit
Concrete
Volumetric density2322kg·m−3
Specific heat850J·kg−1·K−1
Heat transfer coefficient1.70W·m−1·K−1
Single glazing
Sash section coefficient0.80-
Average permeability coefficient 0.60-
Emissivity coefficient0.80-
Mean heat transfer coefficient U3.50W·m−2·K−1
Sandy clay
Volumetric density1800kg·m−3
Specific heat1000J·kg−1·K−1
Thermal conductivity coefficient1.70W·m−1·K−1
Table 2. Computation variants and physical parameters of the medium sand adopted for the analysis.
Physical ParametersUnitVariant 1Variant 2Variant 3
Moisture status-drymoistwet
Relative humidity of the ground%4715
Volumetric densitykg·m−3175014681442
Specific heatJ·kg−1·K−18309801250
Thermal conductivity coefficientW·m−1·K−10.250.691.13
Publisher’s Note: MDPI stays neutral with regard to jurisdictional claims in published maps and institutional affiliations.