Article

Hydrologic Performance of an Extensive Green Roof under Intense Rain Events: Results from a Rain-Chamber Simulation

1
Department of Architecture and Arts, Iuav University of Venice, 30135 Venice, Italy
2
Department of Architecture, University of Bologna, 47521 Cesena, Italy
*
Author to whom correspondence should be addressed.
Sustainability 2021, 13(6), 3078; https://doi.org/10.3390/su13063078
Submission received: 12 February 2021 / Revised: 3 March 2021 / Accepted: 5 March 2021 / Published: 11 March 2021
(This article belongs to the Section Environmental Sustainability and Applications)

Abstract

:
The water storage capacity of a green roof generates several benefits for the building conterminous environment. The hydrologic performance is conventionally expressed by the runoff coefficient, according to international standards and guidelines. The runoff coefficient is a dimensionless number and defines the water retention performance over a long period. At the scale of single rain events, characterized by varying intensity and duration, the reaction of the green roof is scarcely investigated. The purpose of this study is to highlight how an extensive green roof—having a supposed minimum water performance, compared to an intensive one—responds to real and repetitive rain events, simulated in a rain chamber with controlled rain and runoff data. The experiment provides, through cumulative curve graphs, the behavior of the green roof sample during four rainy days. The simulated rain events are based on a statistical study (summarized in the paper) of 25 years of rain data for a specific location in North Italy characterized by an average rain/year of 1100 mm. The results prove the active response of the substrate, although thin and mineral, and quick draining, in terms of water retention and detention during intense rain events. The study raises questions about how to better express the water performance of green roofs.

1. Introduction and Background

The growth of sustainable design has occurred in the last decades due to the achievement of significant energy savings, the reduction of carbon emissions and of the environmental footprint in the building sector, reported by a wide range of papers in the scientific literature [1,2,3,4,5], and has been more recently been coupled with the issue of climate change and its impacts on the urban habit [6,7,8,9,10]. As evidenced by the Intergovernmental Panel on Climate Change (IPCC) [11], the correlation between the increase of average temperature and the recurrence of extreme weather events has been largely proven and many countries have already experienced problems of water scarcity or massive flooding that has become even more critical as a result of other very impacting phenomena, such as Urban Heat Islands (UHI) and heat waves [12,13,14,15]. These events are often dependent on human activities: the way cities and buildings are shaped, the design choices, the use of materials and, above all, the very limited availability of green spaces within the built environment. This strongly reduces the chance of benefitting from the capacity of the natural environment to mitigate the intensity of weather events and climate conditions, and that is why the adoption of Nature-Based Solutions (NBS) [16] are largely encouraged within the EU action framework. Among the suggested solutions, the adoption of green roofs is nowadays a consolidated option to contribute in several ways towards a green transition. Green roof technology integrates vegetated soil with a traditional building roof while exploiting the very specific behavior of the vegetation, particularly with reference to UHI mitigation [17,18], removal of pollution [19,20], gas exchanges [21,22] and ecological networks in dense city areas [23,24,25]. Furthermore, it is also a good solution to increase the thermal performance of the building envelope, actively contributing to meeting energy efficiency and indoor comfort standards both in new constructions and renovation actions [26,27,28]. The specific characteristics of green roofs have been explored in the scientific literature, particularly focusing of the following topics:
Thermal positive effects—The multi-layered configuration of a green roof can significantly contribute to indoor space insulation [29,30,31,32] depending on its thickness and vegetation typology, as well as levels of water absorption which in specific conditions enable the system to operate as a heat extractor and shading/protecting surface [33,34,35]. Additionally, green roofs are comparable to traditional urban green spaces in terms of capacity to reduce outdoor environmental hazards, such as UHI [36,37,38,39].
Removal of pollution—Although definitive research data are still not available, the results of several studies confirmed that green roofs positively contribute to reducing air pollution and absorbing fine dust [40], depending on plant species and dimensions. Currie and Bass [41] estimated that a grass roof could remove between 5.92 × 10⁻³ kg/m2 of pollutants (O3, PM10, SO2) per annum and, in the case of intensive green roofs (with shrubs), this value increases to 6.58 × 10⁻³ kg/m2. Yang et al. [42] calculated that the annual removal of air pollutants by 19.8 ha of green roofs in Chicago is 1.675 kg.
CO2 sequestration—Many studies demonstrated that green roofs, if widely adopted, can be considered a promising technology for the CO2 sequestration in plants and soils [43,44,45]. Indeed, a noticeable concentration decrease of CO2 can be found on closed green roofs. Kuronuma et al. [46] discovered that the energy savings of the grass green roofs, considering both the CO2 reduction and energy saved, is 1.703 Kg·CO2·m−2·yr−1 with a LAI (Leaf Area Index) of 2.21 and 1.889 Kg·CO2·m−2·yr−1 with a LAI of 3.71.
Ecological network and bio-diversity—Green roofs are largely adopted to support biodiversity by providing an alternative naturalized habitat for generic but also some rare species [47,48,49,50,51]. Moreover, green roofs offer a habitat for many bee species [52] with positive impacts on pollinator conservation, which is a key element in natural and urban biodiversity.
Runoff regulation—The capacity to contribute to rainwater management can be counted among one of the most relevant benefits of green roof technology [53,54,55,56]. One of the main features is indeed the ability to retain part of the rainwater for the vegetated surface, becoming a collector at a roof level that reduces the amount of water directly impacting the ground level. This is where a compromised hydrological cycle is often unable to effectively drain due to the widespread paved surfaces and soil sealing that often affect the urban environment [57,58].
The hydrologic performance of a green roof is typically expressed by the runoff coefficient (ψ or C) [59,60]. The runoff coefficient is a dimensionless value resulting from the ratio between the runoff (drained water) and rainfall (intercepted water) by a surface. In the case of green roofs, according to the FLL Green Roof Guidelines [61] (pp. 58–59; pp. 129–130), it is measured after a block rain of 27 L/m2 intensity during a time of 15 min preceeds soaking irrigation and drains within 24 h. The runoff coefficient is typically measured in a laboratory without considering the role of plants, and this usually leads to underestimated data. If this can be theoretically discussed, it does not have a negative impact in practical conditions because it is during intense or extreme events that green roofs may quickly become saturated and a greater detention capacity is more suitable [62]. The reaction of the green roof to rain is influenced by an interaction of several parameters dealing with the roof layers’ characteristics: number of plants, dimension of plants, water content in the substrate, thickness and composition of the substrate, structure of drainage layers, water accumulation and slope. All these elements also interact with the climatic boundary conditions, such as air temperature and humidity, that affect the evaporation-transpiration process [63,64,65,66].
Since the runoff coefficient describes the hydric performance of the green roof as a constant—which does not happen in real conditions—it is particularly interesting to investigate how the green roofs perform during real meteoric events, especially in the case of intense or extreme events, whose duration and intensity are, of course, various. In order to achieve this purpose, different rain events have to be simulated in a rain chamber in order to properly monitor all the involved variables and possibly register differences and address more promising design choices. However, this approach has been rarely reported in the scientific literature due to the difficulties in properly considering the climatic variables and the resources required to perform a time-consuming process within the rain chamber (that usually serves to test technical options investigating specific issues). The paper focuses on this specific field of research, assuming that a long-term evaluation based on real meteoric events characterizing a territory (selected on a statistical basis) is not commonly performed. Furthermore, an appropriate interpretation of the runoff coefficient (ψ) can be considered of relevant interest especially after it was introduced in the technical international standards and manuals some years ago. As Table 1 summarizes, ψ values of the green roofs are not even homogeneous in the main scientific standards and guidelines documents, evidencing a gap in the understanding of the hydrological performance of green roofs within this specific field of research.

2. Scope

The study reported in this paper is aimed at investigating the behavior of green roofs in real raining condition to achieve a better understanding and interpretation of the runoff coefficient, according to a case of real rain event trends. Thus, a methodological approach including an experimental campaign with the use of a rain chamber was defined and carried out on different green roof options.
The main objective of the study was to analyze the effects of rainfall in a given test-bed site particularly focusing on duration, frequency and distribution of intense meteoric events during the year. This evaluation campaign, on a statistical basis, is used for comparing heavy rains values in real conditions, with the peak value used to calculate the runoff coefficient ψ (i.e., 9 mm of rain in 5 min for 15 min, according to FLL Green Roof Guidelines [61]) and understanding if it is properly characterizing intense rains or if it is underestimating/overestimating the effects and, in that case, which is the entity of deviation from the real behavior. The intention to explore the hydrological response and the properties of an extensive green roof in high stress conditions, when the retention capacity reaches the maximum level and at the same time water collectors of the city network are critically solicited due to intense or extreme weather events, led to the need to identify an appropriate test-bed site for simulation purposes. On the one hand, it was required that the case study would be representative of a quite acceptable range of recurring situations, but on the other hand the specific characterization and climatic profile of any territory was to be accepted as a structural part of the study. The adoption of a case study was needed to compare the simulation input and output with monitored values in real conditions with the purpose to clearly define possible gaps.

3. Methodology

The behavior of a green roof during and after intense meteoric events (that normally last for a short period of time) depends on a number of interrelated variables which are quite difficult to fix in the natural environment. That is why a laboratory test is a viable and a preferable solution to select the varied parameters and those assumed to be fixed or constant during the experimental session. This approach generally ensures objective and commensurable data in a relatively short time. It is very important to remark that the laboratory test provides different results from the one carried out on test roofs in outdoor spaces which is addressed to monitor variations in the mid-long term. Green roofs are wet systems and the water content continuously varies due to the evapotranspiration process (evaporation from the substrate, transpiration of plants), thus in outdoor conditions it is very hard to define the water content when a meteoric event starts. Consequently, the interpretation of results may become difficult, leading to approximated outcomes.
A laboratory test allows to adequately control the involved parameters, especially if the test roof is designed to make the differences more evident. For the purposes of this study, a quite basic and conventional solution, in terms of technical layers in the roof section, was adopted to describe the water performance assumed as the “minimum” to define the “basic” water control capacity. The properties expected from the investigated system, together with the simulation of intense meteoric events, should correspond to largely precautionary values of the hydrological response of an extensive green roof, which, by its own definition, is a typology characterized by a low water inertia compared to semi-intensive or intensive roofs.
The runoff coefficient ψ of the test roof is then calculated according to [61]. The runoff coefficient ψ is universally measured according to the German procedure, therefore, in the experimental session it is assumed as the reference value to which data regarding the hydrological response of the investigated green roof are compared.
The scope of the testing session is to measure the water detention and the consequent reduction and delay of the runoff peak, describing the decrease in the intensity with which the gravitational water is supposed to reach the urban drainage networks during the occurrence of intense and repeated events.
This represents the most significant parameter expressing the behavior of a solicited green roof. Accordingly, the different hydrological response of flat and sloping green roofs was explored.
For validation purposes, the testing session is then addressed to verify the hydrological response of the investigated green roof, comparing the runoff coefficient ψ with the outflows of real intense meteoric events, selected in a given area according to a statistical evaluation among different locations.

3.1. Methodological Structure and Phases

The proposed research activity required some operational steps corresponding to the main phases of the process:
Phase 1—Preliminary analysis—Once a specific test-bed site was selected, a statistical analysis of the meteoric events was performed on periodic datasets with the purpose to obtain a description of the intensity, the duration and recurrence of phenomena.
Phase 2—Input data—According to the framework obtained during the first phase, a set of meteoric events was selected in order to recreate their characteristics during the testing sessions.
Phase 3—Green roof design—A green roof solution was then chosen, fixing the specific technical features of all the layers included in the typical cross section to keep the related parameters constant and possibly under control during the whole testing process. It has to be remarked that the green roof is prepared for testing in dry conditions at the beginning of the cycle using a new and packaged vegetation stratum (substrate). Any possible moisture content can be considered negligible with reference to the scope of the experimental session.
Phase 4—Testing session—The experimental session was carried out in a rain chamber which allows for control of the whole set of involved parameters correlated to input data, being the technological solution appropriately designed and the meteoric events to be simulated specifically selected.
Phase 5—Output data—Once the testing session was completed, the collected output data were analyzed and compared to be further discussed.
Figure 1 provides a graphical flow chart of the main phases of the methodology. The following subsections describe in detail the envisaged activities applied to a selected case study according to the defined methodological structure.

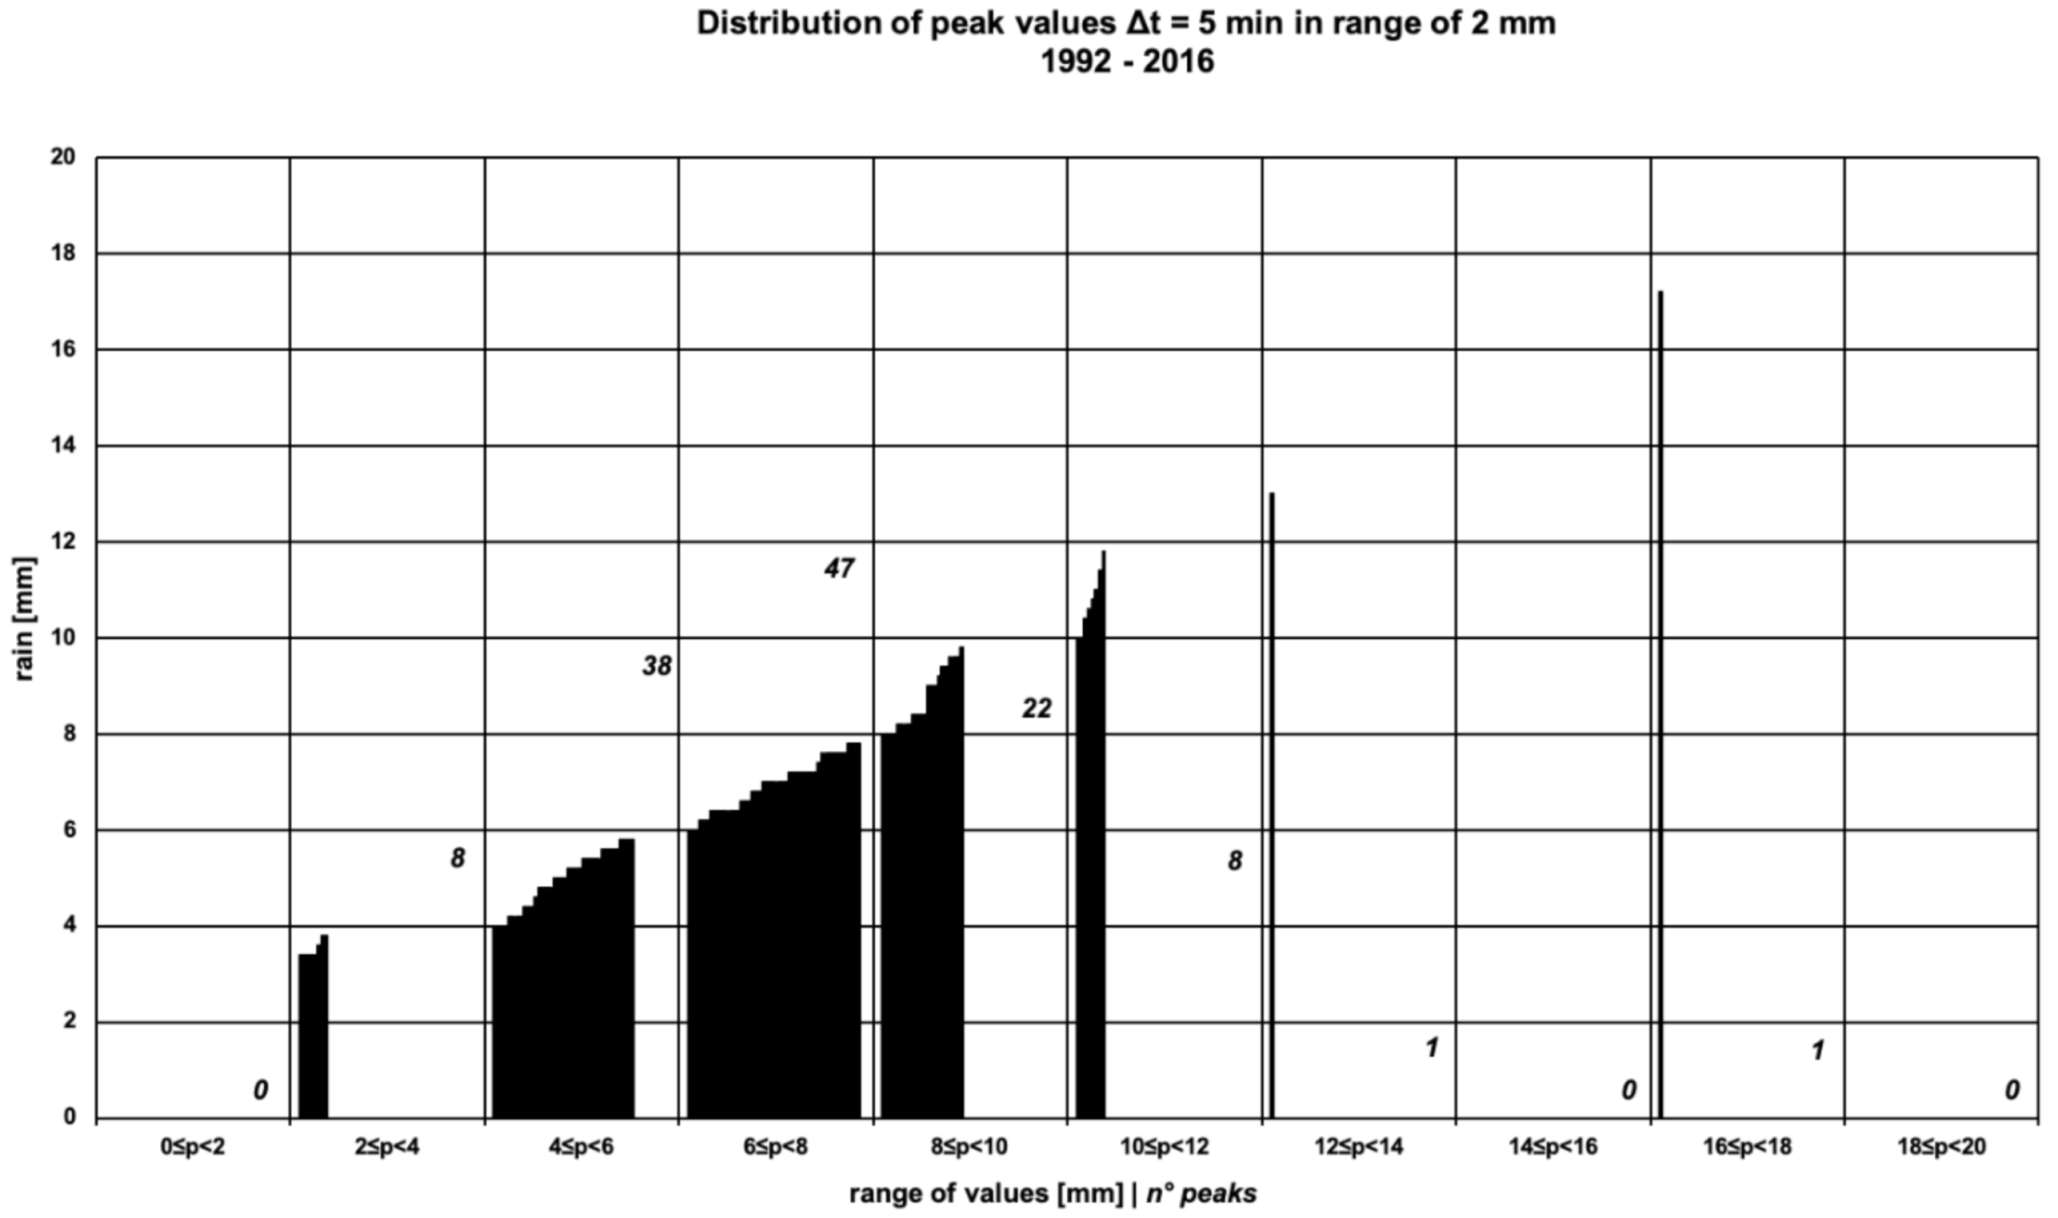
3.1.1. Phase 1—Preliminary Analysis

In order to evaluate the overall behavior of green roofs in dynamic conditions and to particularly investigate the relationship between the runoff coefficient ψ and the hydrological response of the system during intense meteoric events, the conditions of the experimental session to be performed on a selected green roof solution has to be comparable with the measurements of real meteoric events in natural conditions. After a number of different locations were considered, a representative location of the northern-east Italy meteoric trends was identified in Quinto Vicentino (in the middle of Veneto Region) and rain data were analyzed over 25 years (1992–2016). Figure 2 shows that if the whole central belt of the region is considered, the average annual rainfall is 1100 mm. As it can be noted in Figure 3, and differently from other Italian areas, winter is the least rainy season, while rainfall during spring and summer is almost equal and autumn is the rainiest season.
Given that the water retention value, expressed by the runoff coefficient ψ, is obtained through a simulation process on a testing roof according to [61], the experimental session requires significant input data regarding the meteoric events to be simulated if they are properly provided. That is why a specific location has to be selected for testing purposes, even if violent showers and storms may have a similar intensity in geographical areas characterized by different rainfall regimes. A different distribution and recurrence may influence the outcomes of the study and therefore a contextualization is required to perform a correct input data extraction.
Once the location is selected and a proper description of its climatic profile is completed, an accessible and reliable data source must be identified. With regard to the specific case study, data are made available by Arpav (Regional Agency for Environmental Protection and Prevention of Veneto) meteorological station of Quinto Vicentino (Vicenza). Data records from 1992 to 2016 were statistically processed to obtain:
  • the 5 highest annual values referring to intense rains in a time interval of 5 min among a corresponding set of 125 events.
  • the 2 periods (of ten days each and precisely from 8 to 17 September 1994 and from 4 to 13 August 2002) in which the highest concentration of heavy rains occurred during the analyzed 25 years.
  • the rainfall values, recorded on a 5 min interval basis, for each of the two periods describing the progression of meteoric events.

3.1.2. Phase 2—Input Data

Observing the value distribution and the peaks average, the trend of intense rains in the case study area can be drafted in a more comprehensive way. As represented in Figure 4, the analyzed rain intensity peaks show an average value of 6.81 mm. The monthly distribution of peaks reported in Figure 5 highlights that the totality of the peaks of maximum rain intensity was distributed in the months ranging from May to September, with a higher distribution in July and August (60 peaks out of 120). The distribution of the highest values and the daily rainfall referred to the peaks were observed to choose the value to be recreated for the testing purpose. As Figure 6 highlights, the highest peak is equal to 17.2 mm, followed by nine values greater than 10 mm. Of all these, the ones chosen are the highest, namely those occurring in September 1994 and the peak in August 2002.
The choice to use the highest peak values instead of their average can be explained with their frequency over the years, as reported in Figure 7, demonstrating the relevant differences with relation to the distribution trends. Although a probabilistic analysis of intense meteoric events capable of providing the return times is not available, the simple statistical distribution in 25 years of measurements reports that peaks over 10 mm occur with a regular frequency every two or three years. For the testing session purposes, the meteoric events occurred on 8 September 1994 and 4 August 2002 were chosen, including the peak values of 13.0, 11.0, 9.2, 8.0 and 5.4 mm, all during the rain events of the 8 September 1994, and 17.2 mm during the rain events of the 4 August 2002.

3.1.3. Phase 3—Green Roof Design

The tested green roof (sample roof) belongs to the so-called extensive typology. A green roof is classified as “extensive” when its vegetation is “largely self-sustaining and evolving. Plants with special adaptation to extreme site conditions and high regeneration capacity are used.” [61] (p. 22). This choice is also related to the fact that the extensive segment is the leading type of the product in the green roofs sector for several reasons:
  • extensive green roofs are easier to maintain due to the high resistance, small dimensions and high adaptation capacity of installed plants;
  • they are lighter in terms of weight: the build-up layers above the waterproofing membrane are thinner and drain more. The weight of extensive green roofs varies considering a range of 30–200 kg/m2 instead of 300/1.500 kg/m2 for the intensive green roofs; Lightweight is a suitable characteristic in cases of upgrade, renovation and refurbishment actions, because the structure of the existing building does not allow a significant load increase;
  • due to the structural characteristics, they are cheaper and that is why, in the case of polices and incentives, extensive green roofs are largely preferable.
The sample roof can be defined as a typical extensive green roof, built according to the Italian Standard UNI 11235 on green roofs [67]. Its system is 15 cm thick, without vegetation (which is omitted for the testing purpose), and it includes the following layers:
  • Vegetation stratum (substrate): it is a bulk material of mineral aggregates with a low percentage of organic material. This type of substrate is used for extensive green roofs. It is 10 cm thick and the expected water performance is high drainage and low water storage. Table 2 lists the characteristics of the vegetation stratum;
  • Filter layer: it is a geo-textile sheet in polypropylene (0.6 mm thick) installed in a separate operation on the drainage (not prefabricated as part of the drainage mat);
  • Drainage layer: it is a shaped rigid plastic panel, in recycled polypropylene, 4 cm thick, characterized by a water storage capacity of 4 L/m2 as effect of the retention cups shaped for both functions of drainage and water accumulation. The plastic panels are widely used for extensive green roofs because, compared to aggregates, they are lighter, easier to assemble and cheaper;
  • Protection against damage to waterproofing/root barrier layer: it is a synthetic mat in recycled polypropylene 5 mm thick.

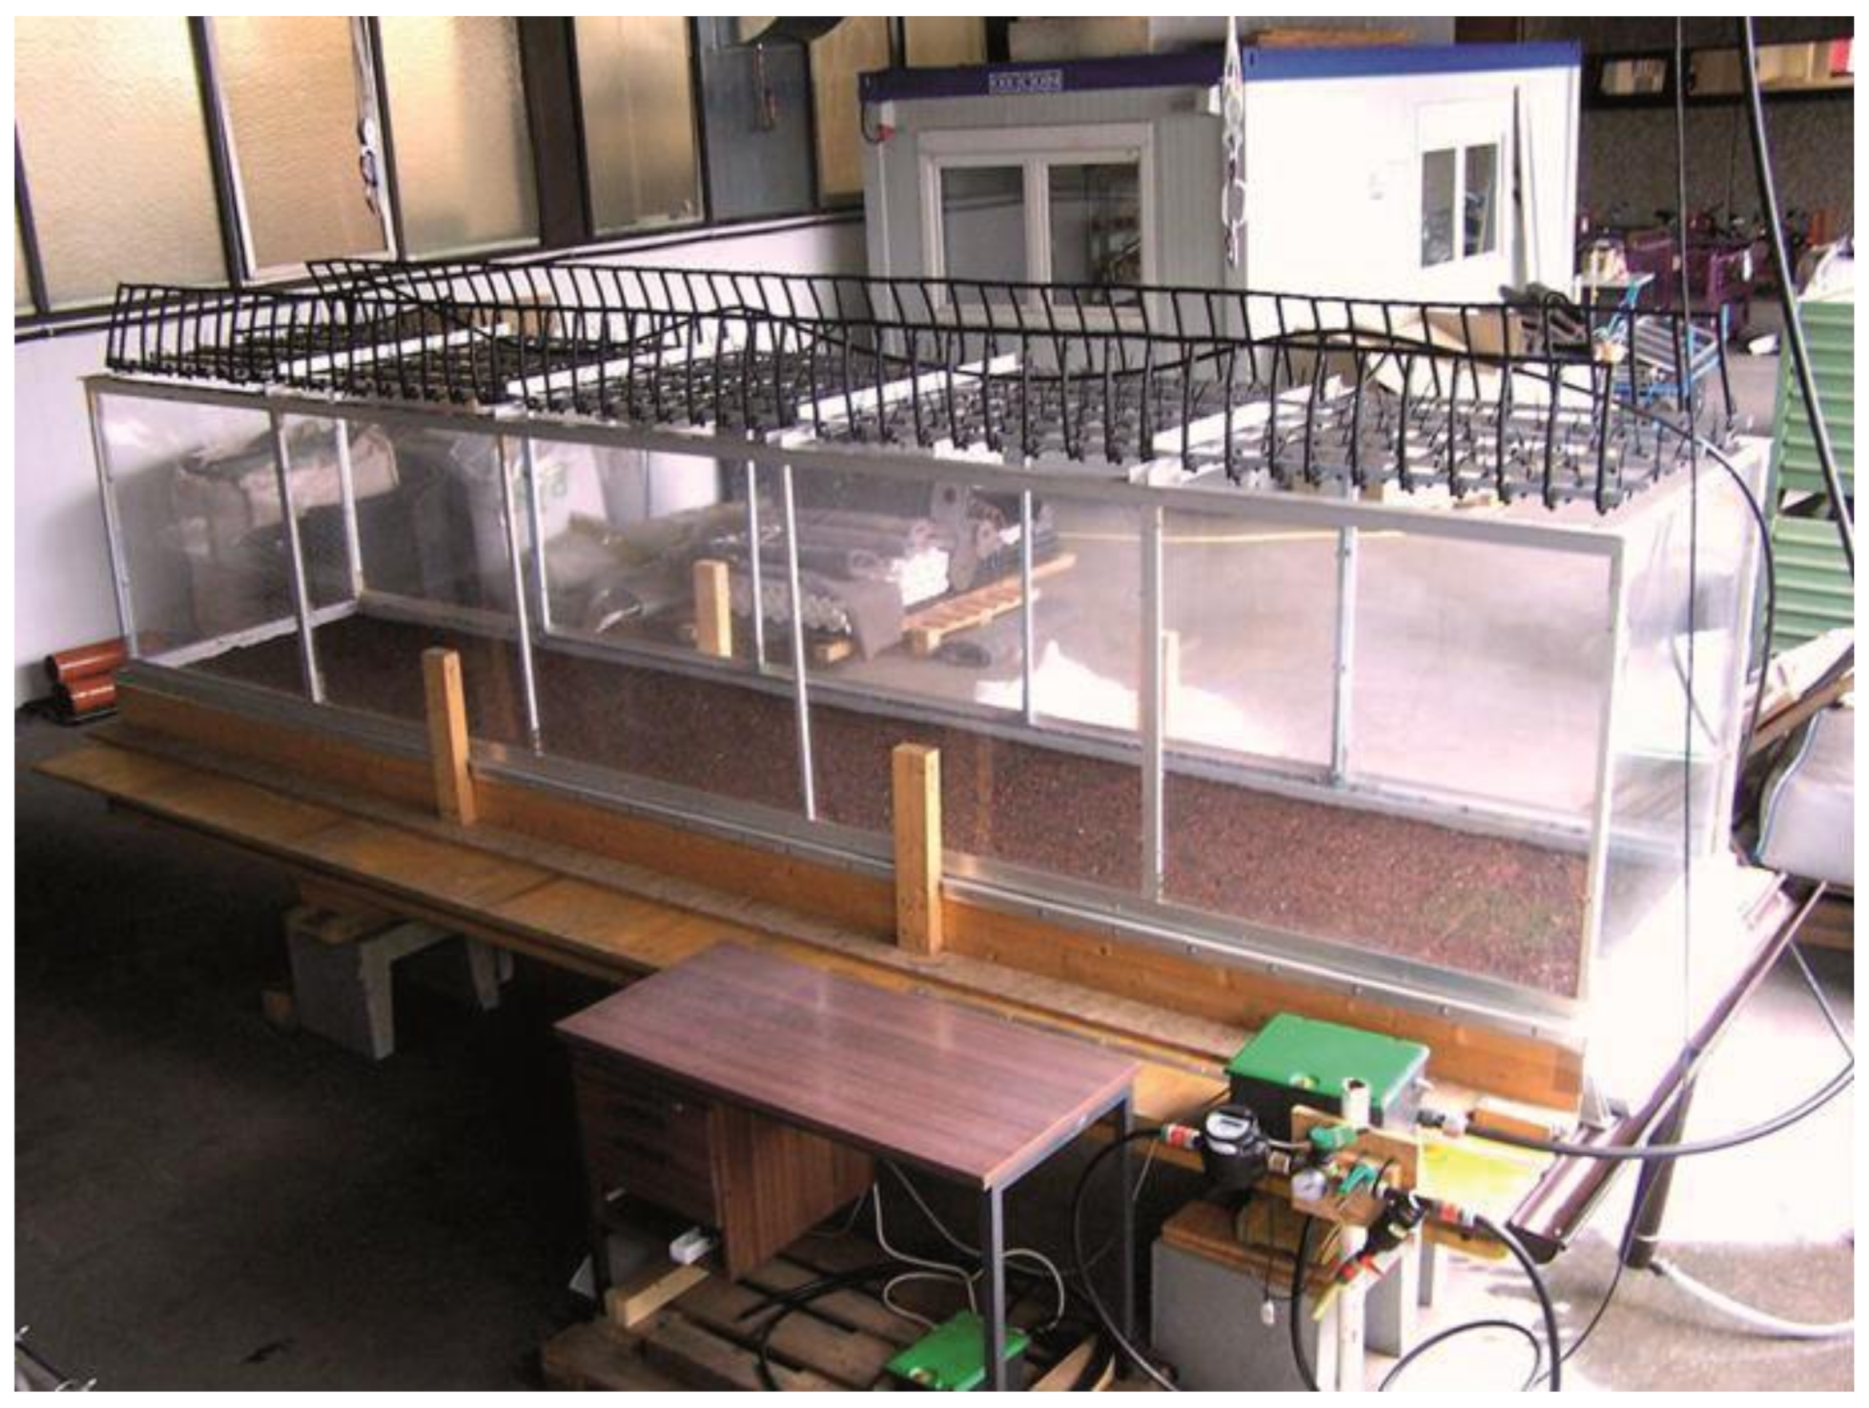
3.1.4. Phase 4—Testing session

In order to perform the testing session, a rain chamber was used to recreate the meteoric conditions of the selected events on the designed green roof solution with the purpose of observing its behavior and measuring the corresponding runoff coefficient (ψ) according to the different situations.
The rain chamber includes the following components:
  • A chamber of 5 × 1 × 1 m where the base (flooring) is a waterproof pitch on which the green roof layers (sample roof) lie. The four vertical sides of the room are enclosed by transparent glass walls while on the top side the rain-simulator is installed. One end of the roof pitch is open and equipped with a gutter to collect the water.
  • A rain simulator that is basically an irrigation system equipped with 60 nozzles/m2, corresponding to 300 nozzles for the entire room surface (Figure 8, Figure 9 and Figure 10).
  • Two flow meters for measuring the water entering the rain chamber through the rain simulator and leaving the rain chamber.
  • A valve and a pressure gauge for regulating the water flow inlet.
  • A computer connected to the flow meters for data collection.
The rain chamber operation diagram is represented in Figure 9.
Simulations were carried out over a period of four days and scheduled with 18 h inter-events for each session except for the FLL-Green Roof Guidelines [61] test in which it was extended to 24 h in accordance with German regulations.
The rain chamber was located in a laboratory in Germany, at ZinCo Green Roof Systems laboratory, and was not heated. The tests were conducted in February and the temperature of the laboratory was between 4 and 12 °C. Table 3 summarizes the sequence of the experimental sessions.
Simulation 1.a was considered of particular interest as the humidity starting conditions of the substrate were exactly known. The substrate was arid, allowing an assessment of the maximum water storage capacity of the roof sample. The simulated meteoric event was the one of 4 August 2002 during which a peak of 17.2 mm was recorded.
Simulation 1.b was conducted reproducing the same meteoric event of simulation 1.a, 3 h after it was completed.
Simulation 2 recreated the meteoric event from 8 September 1994 characterized by a repeated series of peaks. This simulation was started after an inter-event of 18 h from simulation 1.b.
Simulation 3 was carried out to calculate the runoff coefficient (ψ), thus reproducing an intensity peak of 9 mm for the duration of 15 min, as envisaged by FLL-Green Roof Guidelines [61]. Finally, during simulation 4 the meteoric event of simulation 2 was repeated on the same roof sample but using a 9% inclined plane. This allowed an evaluation of the difference between the hydrological response of a flat roof and a sloping roof.

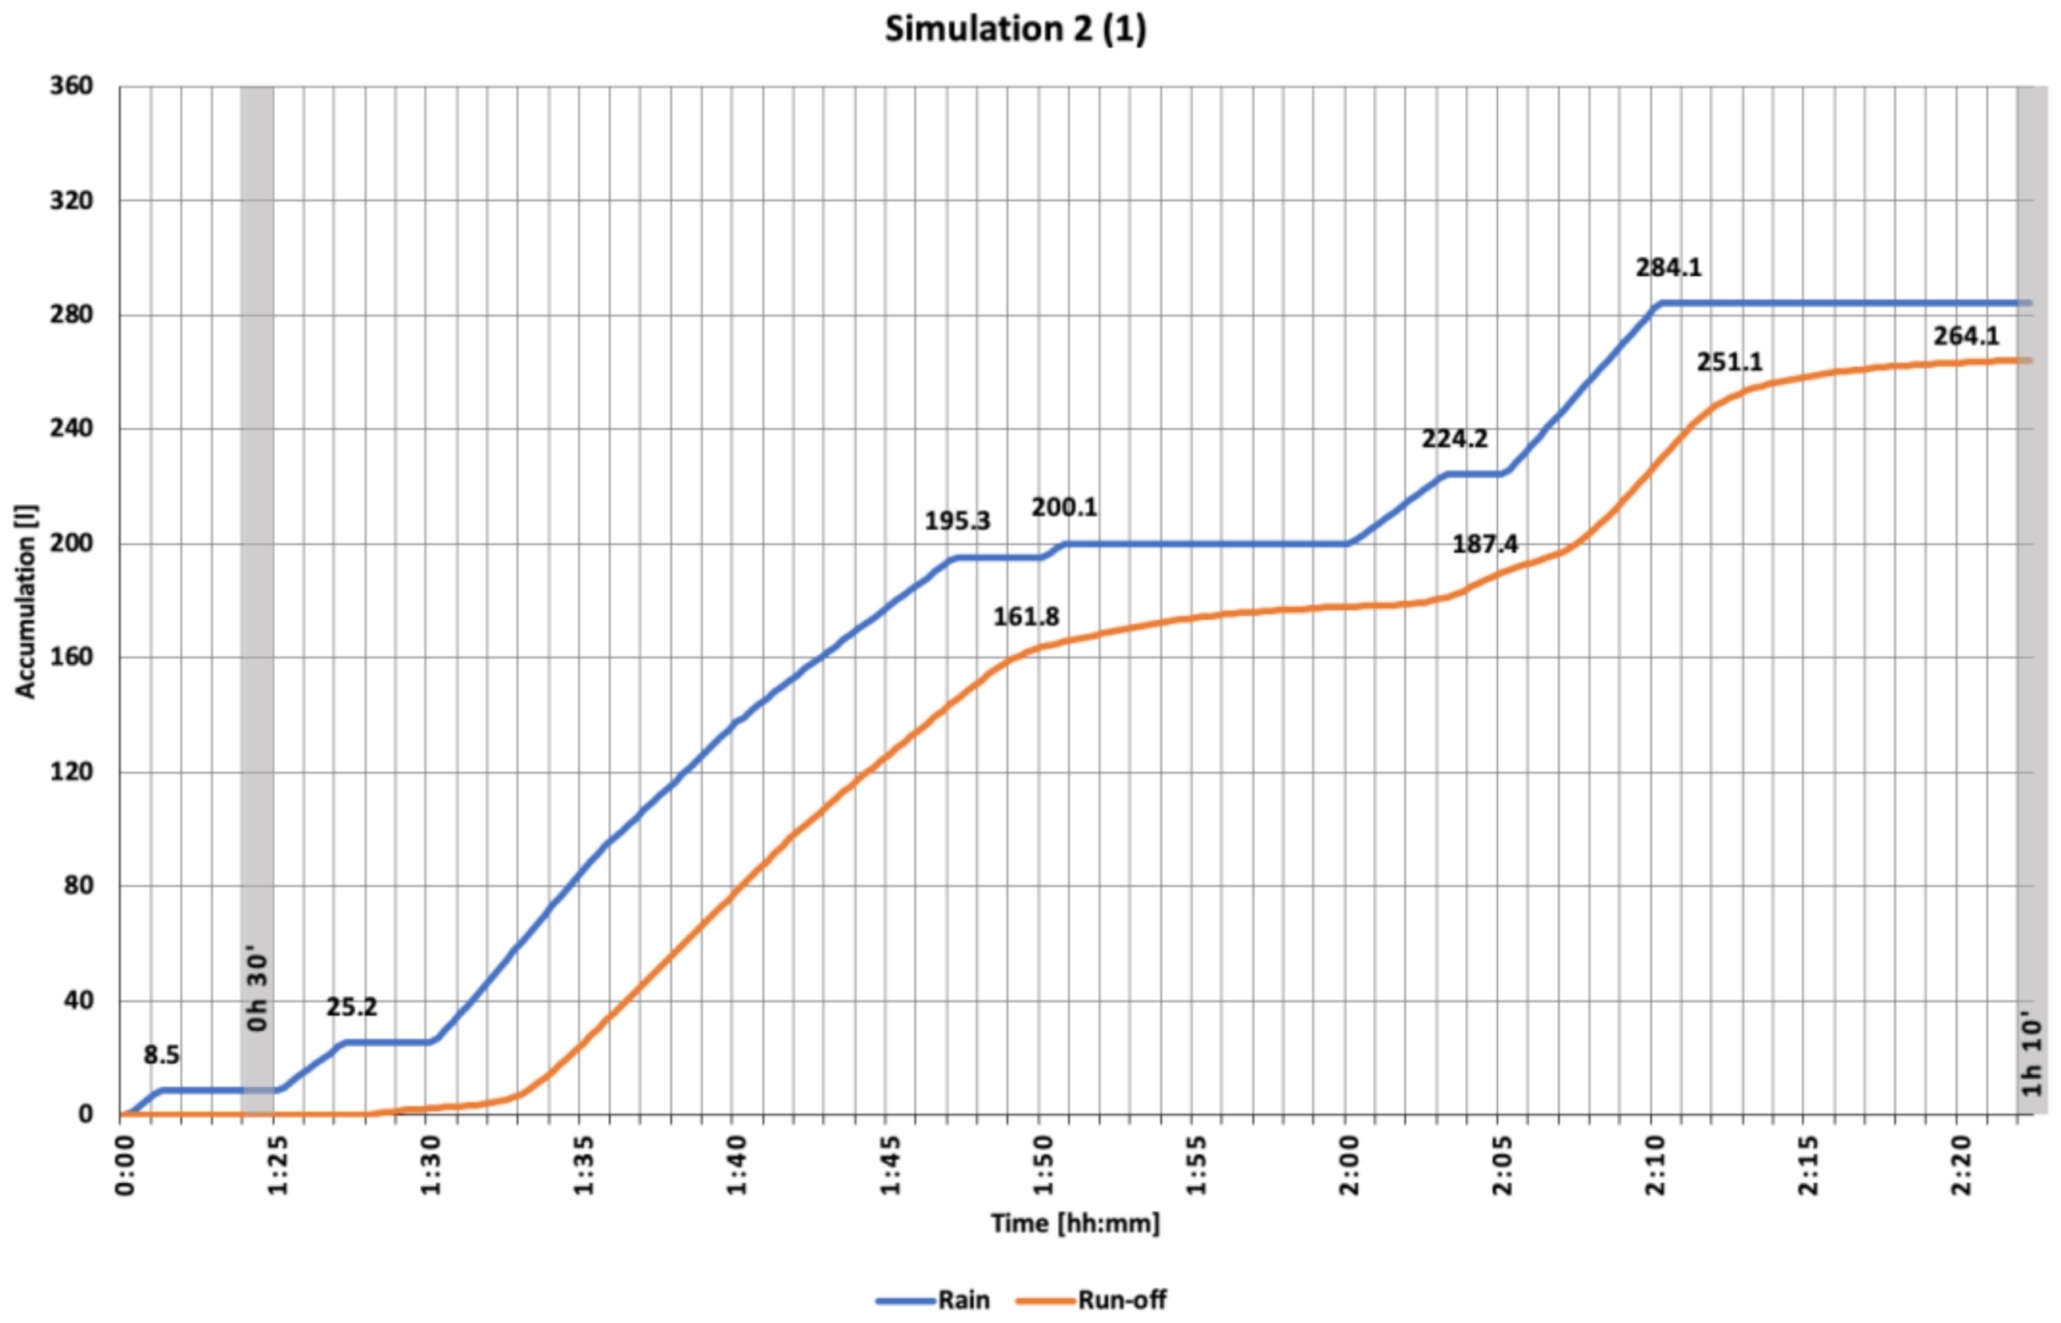
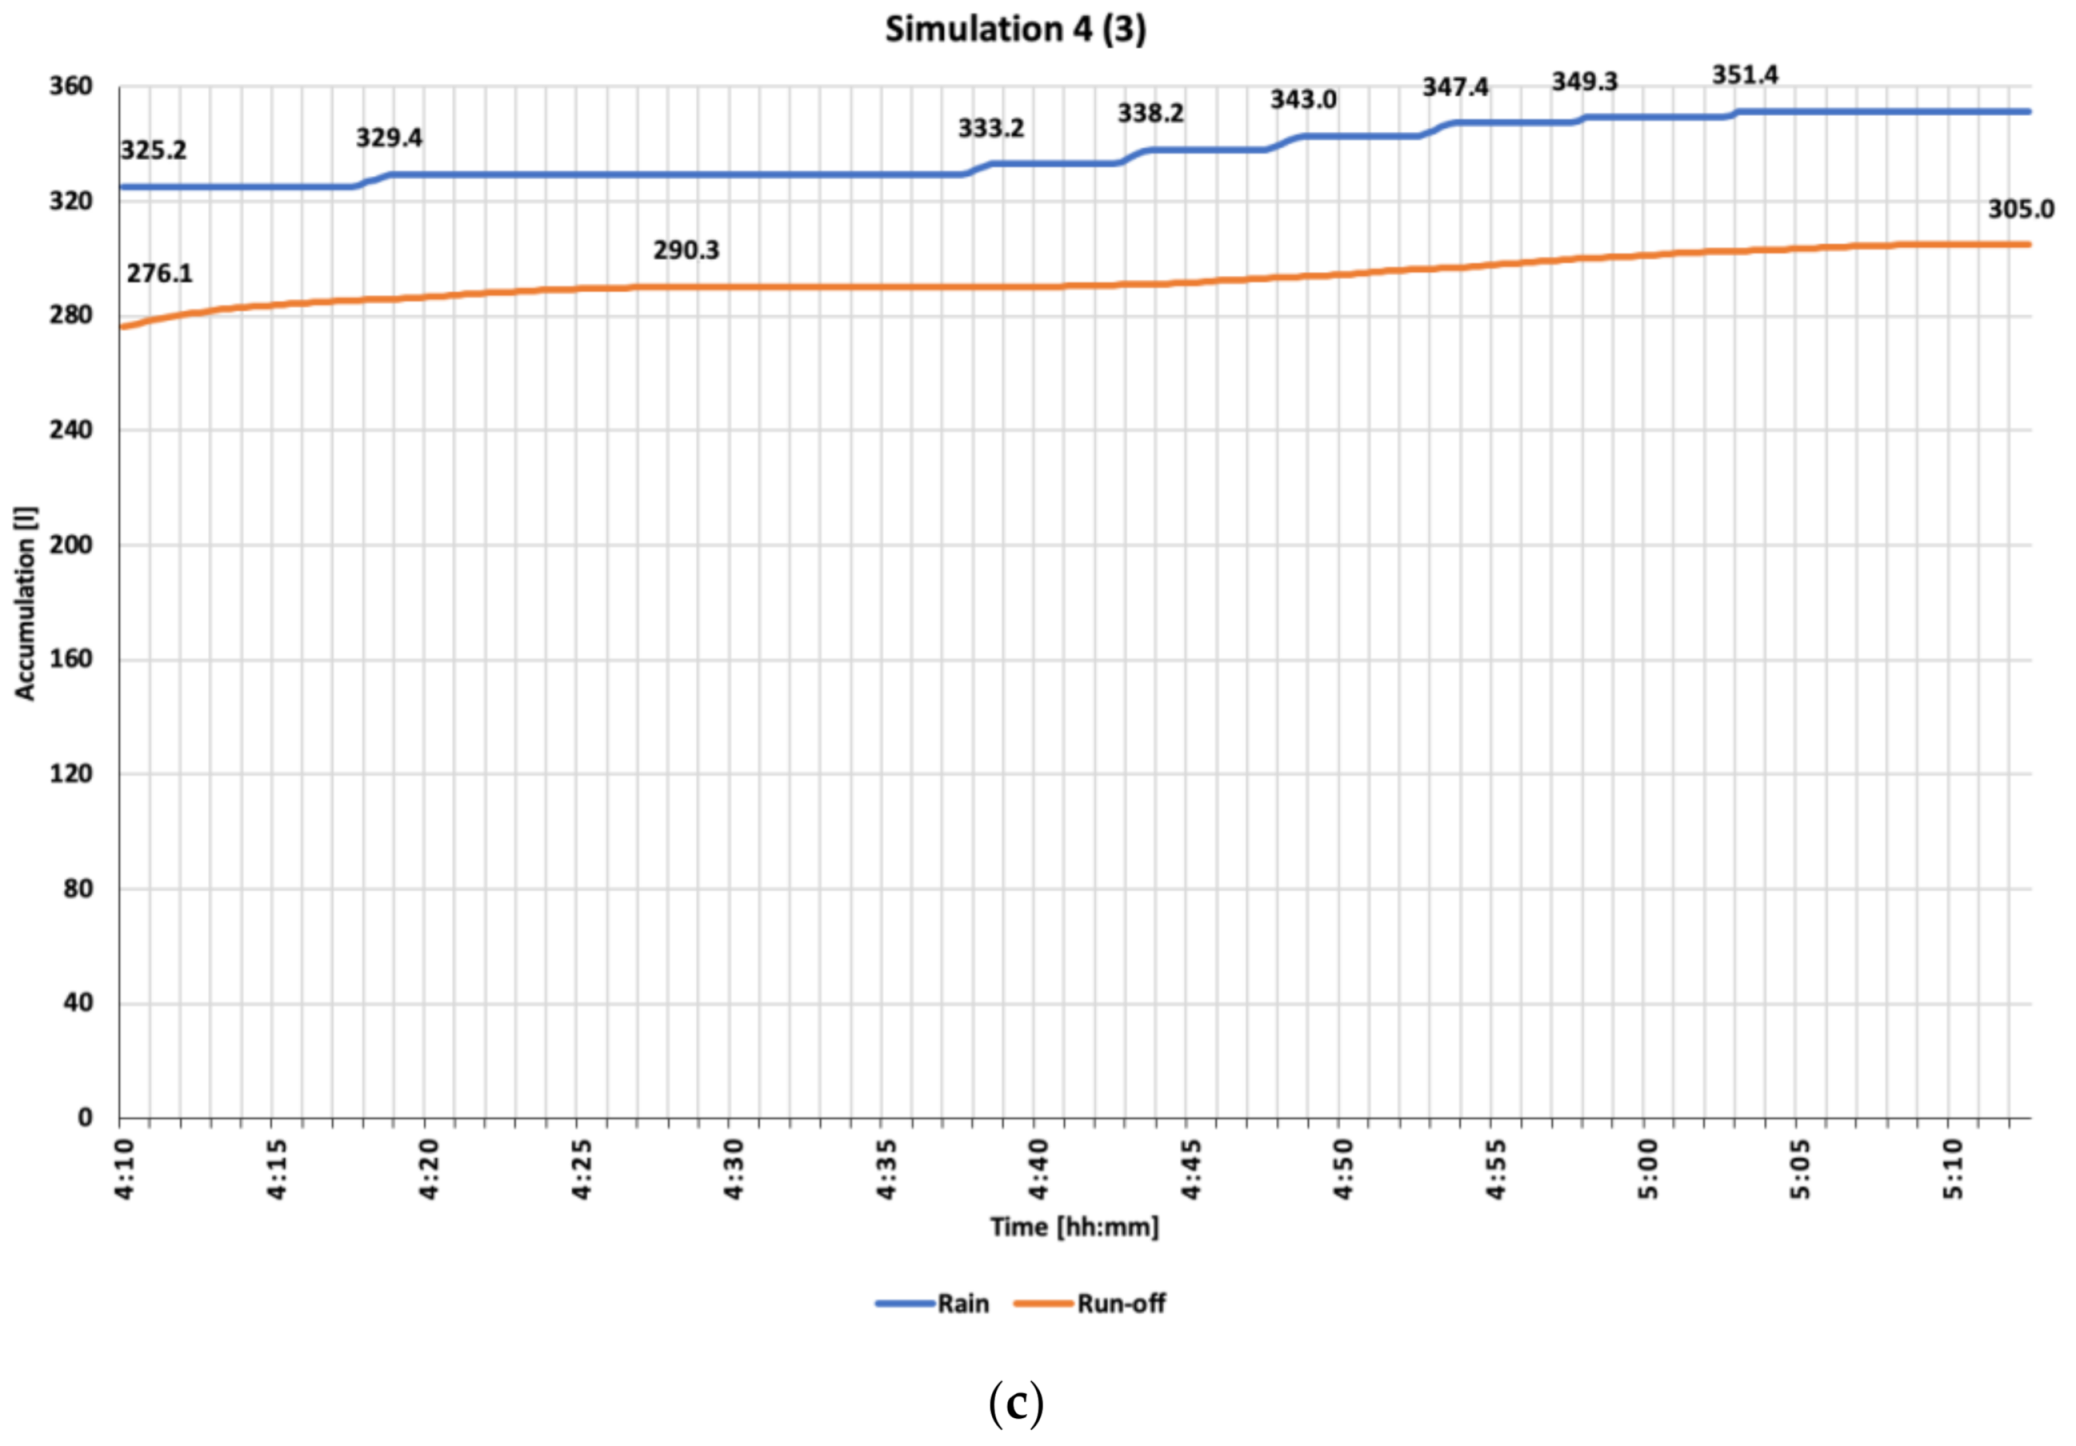
3.1.5. Phase 5—Output Data

During simulation 1.a, the roof had 170 L of water, however, only 6.5 L were released, corresponding to 3.8% of the water totally introduced during this session.
The cumulative curve of intercepted water, corresponding to the meteoric event, is represented by the blue curve in the upper part of the graph in Figure 11, while the amount of the outflow is represented by the red curve in the lower part. The beginning and the end of the single meteoric events are highlighted, in both cases, by points indicating the values, expressed in liters, of both the single meteoric event and the cumulative one, respectively represented by the number to the left and right of each point. The very low proportion of gravitational water was due to the arid condition of the substrate at the beginning of the simulation. In this phase no intense peak of runoff was therefore conferred, in fact the maximum recorded runoff value was 1.6 mm/5 min. The substrate managed to retain 163.5 L of water. Accordingly, the maximum storage capacity was calculated in 32.7 L per square meter (Table 4).
In simulation 1.b, carried out 3 h after the end of simulation 1.a, the water-saturated roof sample responded with a delay of about 3 min. After this time interval, a slight increase in the outflow was registered. After 8 min and 45 s, the green roof began to release significant volumes of water. However, the intensity was lower than that of introduced water: 11.6 mm/5 min of outflow versus 14 mm/5 min of rain. This can be clearly observed in the slopes of the two curves of Figure 12. It should also be emphasized that intense outflows are characterized not only by a delay, but also by a shorter duration compared to heavy rain (Table 5).
Simulation 2 recorded the presence of gravitational water from the cover after 1 h and 27 min from the beginning of the first meteoric event and after 3 min from the beginning of the second meteoric event. With the substrate reaching and exceeding the maximum saturation capacity 18 h earlier, it was not able to properly retain the water when the new simulation started, realizing the received water more quickly than in simulation 1.a. During the entire 5 h session, in which several events of varying intensity were simulated, high runoff peak values—almost equal to rain—were recorded. Nevertheless, even in these extreme stress conditions, the sample roof was able to reduce the total flow rates and to delay the outflow and the peaks (Table 6, Figure 13(1)–(3)).
Simulation 3 provided the water retention coefficient (Ψ) of the designed and adopted green system that represents a major outcome of the testing session. This value corresponds to 0.68 and is the ratio between the runoff and the water intercepted by the roofing system when exposed to a meteoric event of the intensity of 9 mm/5 min for 15 min. The obtained value is lower than expected and consistent with the values of equivalent roof systems with the same thickness described in the standards [Table 1].
Table 7 compares the obtained value with other coefficients of different surface typologies [68]; a green roof of 10 centimetres should have a coefficient between 0.4 and 0.5, while the one from the performed simulation is close to values typical of flat roofs covered with a layer of gravel. This can be explained not only by the mineral nature of the substrate, but also by the exceptional amount of water to which the sample roof was exposed during the previous three-day sessions. Since there are no regulatory requirements regarding the humidity state of the substrate during the 24 h before the test occurs, the obtained value can be considered appropriate with relation to the entire experimental activity.
It can be observed that also during the third day of simulations, a delay of 3 min from the beginning of the outflow is registered and its intensity reaches to the one of the meteoric event after 8 min from the beginning (Table 8, Figure 14).
Simulation 4 repeats simulation 2 with a 9% pitch roof. The difference between the hydrological response of the flat and the sloped roof is less significant than expected. The two curves describing the simulations are quite similar except for an advance in the generation of outflows by the inclined one of about 20 s compared to the flat one. Peak outflow occurred after 7 min and 30 s in both cases and intensities were nearly identical. This demonstrates that a particularly draining substrate does not significantly alter its behavior with relation to the different conditions, respectively a 2% and 9% slope (Table 9, Figure 15(1)–(3)).

4. Outcomes Discussion

The performed 4 days of simulations with the use of rain chamber led to the following results describing the behavior of the green roof solution under investigation, demonstrating the consistency of the assumptions with real operational conditions which were carefully recreated for testing purposes.
The runoff coefficient (ψ) of the roof was 0.68, consistent with anticipated expectations and the literature. This coefficient represents an “upper limit value” (lower for performance) of the water retention capacity of an extensive green roof. The green roof retained 20% of the water collected during all the simulations carried out.
Holding volumes in humid conditions close to the maximum storage capacity were registered and critically analyzed.
The average reduction in the intensity of outflows was equal to 15% of the intensity of meteoric events.
The delay in conferring rain intensity peaks had an average duration of about 3 min.
The reduction in flow rates, meaning the reduction of water drained from the green system during intense and prolonged meteoric events, was approximately equal to 13% of the intercepted water.
The hydrological response tested in the reported experimental activity can be considered precautionary in relation to the occurrence of real intense events. There are some additional comments regarding input data used and the temporal sequence adopted during the simulations that can be of help in clarifying the overall experience. The recreated meteoric events followed one another in a very short period of time. The tested green roof received 1589 L of water (meaning 318 mm of water, a value equal to 1/3 of the average annual rainfall of the location assumed in the case study) concentrated over only four days, releasing a total of 1271 L.
Comparing these data with the statistic records of the wettest months in the period between 1992 and 2016 in the city of Quinto Vicentino and those referring to the flood of November 2010, it is clear that the conditions created during the testing sessions were more severe than all extreme situations. The water introduced into the rain chamber during the sessions (Table 10) was higher than the highest statistical values recorded (second column), and even slightly higher than the values recorded during the flood of November 2010 (Table 9, sixth and seventh columns).
Given the due proportions with the real events described, it is possible to observe that the tested extensive green roof offered a significant active contribution. Over the four testing days, the substrate was constantly brought to the conditions of maximum storage capacity, obtaining appreciable reductions in the flow rates. The overall hydrological response of the extensive green roof tested during this study, specifically design with a draining substrate, was be positively evaluated in relation to retention values even in the case of particularly intense events.
It has to be remarked that the testing activity was carried out without the vegetal layer, as prescribed by FLL-Green Roof Guidelines [61], which is expected to positively contribute with its capacity to use the water contained in the substrate. Together with the lack of all the natural conditions that usually contribute to the evapotranspiration in the external environment (i.e., solar radiation or wind), the hydrological response of the tested roof can be considered partially underestimated. This is coherent with a prudential approach to design activity, but it has to be adequately considered when the overall performance potential is globally evaluated.

5. Conclusions

Very intense rain events, with peaks up to 17.2 mm/5 min, were simulated in a rain chamber on an extensive green roof layering during four consecutive days. The sample green roof was 15 cm thick, the substrate was 10 cm thick and composed prevalently by miner aggregates, according to the FLL Green Roof Guidelines [61] (the organic content was the 3% of the substrate mass). The estimated runoff coefficient was equal to 0.68; this value was lower than the runoff coefficient of extensive green roofs reported in green roof standards and guidelines, most likely due to the high water content in the substrate determined by previous days of rain simulations on the sample.
The experiment, providing the cumulative curves of rain and runoff, clearly shows the behavior of the sample roof under the simulated intense rain events.
Observing the cumulative curves of rain events and runoff, it is detectable that the sample green roof released a total amount of 80% intercepted water during the four days of intense rain events.
In the first simulation of the first day—in the condition of a dried substrate—the water performance was obviously excellent, because the water released was just the 4% of the intercepted rain. It is important to note that the second simulation of the first day, after an inter-event of just 3 h, registered a consistent release of water, equal to the 73% due to the high water content in the substrate.
Although the water performance of this extensive green roof was low, all the cumulative curves registered a reduction of the total amount of released water and a delay in the water release. A reduction of the peak intensity of the released water was detected just in the first day of the experiment, when the rain simulations started in a condition of dry substrate. In the next days, the peak intensities of the released water was equal to the peak intensities of the intercepted water or slightly superior. This means that:
  • after days of intense rain events, the sample extensive green roof was no more able to perform due to the repetition of the saturation process of the substrate;
  • possibly, inside the layering, the permeability did not exactly grow from the higher layers to the lower layers of the green roof (like it should be).
This study demonstrates that during and after a rain event green roofs have a mitigation capacity which is related to the water content of the substrate at the beginning of the rain event, besides the variable intensity of the rain event and the characteristics of the green roof layering.
The experiment points out a relevant observation: the water performance of green roofs were classified through the runoff coefficient (ψ). The runoff coefficient was obtained, with one value of intense rain (9 mm/5 min for 15 min with an inter-event of 24 h with runoff), without vegetation and in undetermined climatic elements. This possibly generated a precautionary assessment in terms of runoff and evapotranspiration amounts, but not a description of the green roof behavior under rain events.
The performed experimental session did not consider the water emptying time of the system, which is an interesting but not easily approached investigation issue. The evapotranspiration process was influenced by many parameters, which are partially forced or fixed according to the purpose of the study and to pre-determined ranges of input data of the green roof samples (in particular thickness and composition of the substrate, and others), the climatic factors (air temperature and humidity), and the rain events, so a separate testing session is suggested for this scope. Repeating rain simulations on different green roofs layering, with different input data, would help to analyze the water performance of this technology in real and dynamic contexts. In this framework, the use of a rain chamber to simulate real rain events would be very useful to evaluate the positive contribution of green roofs on the urban water management and also on the thermal effects on environment and the building due to the evapotranspiration. As most of draining surfaces with a high retention rate, green roofs can positively contribute to mitigating heatwaves and urban heat island effect due to the change of water state from liquid to vapor using latent energy.
Although several studies tried to investigate and estimate the potential capacity of green roofs to mitigate runoff and urban heat island effect, the main research gap still deals with the correlation between the scale of phenomena and the diffusion of green roofs within the urban environment. Predictive scenarios regarding the impact of green roofs (possibly associated to other types of drainage surfaces and nature base solutions) should be developed based on the diffusion rate properly taking into account the different capacities according to the available green roofs typologies. Future studies on this topic are therefore encouraged.
As required by FLL Green Roof Guidelines [61], rain simulations were tested without including the vegetation in the sample roofs, however, it is relevant to point out that the contribution of vegetation can positively influence the overall behavior, further reducing the runoff during and after rain events while increasing evapotranspiration.
So far it possible to state that—among the green roof typologies—the intensive ones are the highest performing due to the higher water retention capacity, however its diffusion is lower than the extensive ones, mostly as a consequence of their higher maintenance and operating energy costs.
The adopted methodology can be replicated in different conditions and contexts to possibly implement and refine the achieved outcomes. The value of the methodology lies in exploring the green roof capacity when correlating its characteristics with real local rain conditions. Considering that local climates can largely influence the seasonal rainfall events, it is particularly relevant to access reliable input data to properly tailor the study of the roof behavior and the transfer of water within its layers according to regional conditions. This would be helpful in addressing specific policies to support green roof adoption at local and regional scale in the test-bed sites as the experimental approach adopted in the case study evidenced.
Deeper knowledge of the drainage behavior of green roofs under real rain events would significantly help in understanding the potential response in case of extensive adoption within the urban environment, and possibly guide future planning actions according to more reliable performance-oriented design criteria.

Author Contributions

Conceptualization, E.G. and J.G.; methodology, E.G.; software, E.G.; validation, E.G.; formal analysis, E.G.; investigation, E.G.; resources, E.G.; data curation, E.G.; writing—original draft preparation, E.G.; writing—review and editing, E.G. and J.G.; visualization, E.G.; supervision, E.G. and J.G.; project administration, E.G. All authors have read and agreed to the published version of the manuscript.

Funding

This research received no external funding.

Data Availability Statement

All the data referred to rains occurred in Quinto Vicentino-Vicenza and Regione Veneto were provided by ARPAV-Servizio Centro Meteorologico of Padua (ARPAV-Regional Agency for Environmental Protection and Prevention of Veneto).

Acknowledgments

The rain chamber simulation was conducted at the Laboratory of ZinCo Green Roofs Systems, Germany. The authors express their gratitude for the received support.

Conflicts of Interest

The authors declare no conflict of interest.

References

  1. Blum, A.; Grant, M. Sustainable neighbourhoods: Assessment tools for renovation and development. J. Int. Res. Publ. 2006, 1, 37–54. [Google Scholar]
  2. Hermelink, A. SOLANOVA—Symbiosis for Sustainability. In Markets for Sustainable Construction, Proceedings of the 2nd European Forum on Eco-Innovation, Brussels, Belgium, 11 June 2007; Environmental Technologies Action Plan (ETAP): Brussels, Belgium, 2007. [Google Scholar]
  3. Keller, B.; Rutz, S. Pinpoint: Key Facts + Figures for Sustainable Buildings; Birkhäuser: Basel, Switzerland, 2010. [Google Scholar]
  4. Musterd, S.; Van Kempen, R. RESTATE—Restructuring Large Housing Estates in European Cities: Good Practices and New Visions for Sustainable Neighbourhoods and Cities; A-D Drk bv: Zeist; University of Utrecht: Utrecht, The Netherlands, 2005. [Google Scholar]
  5. European Environmental Agency (EEA). Progress on Energy Efficiency in EUROPE, Copenhagen. Available online: https://www.eea.europa.eu/data-and-maps/indicators/progress-on-energy-efficiency-in-europe-3/assessment (accessed on 1 July 2020).
  6. Cellura, M.; Guarino, F.; Longo, S.; Tumminia, G. Climate change and the building sector: Modelling and energy implications to an office building in southern Europe. Energy Sustain. Dev. 2018, 45, 46–65. [Google Scholar] [CrossRef]
  7. Zhai, Z.J.; Helman, J.M. Implications of climate changes to building energy and design. Sustain. Cities Soc. 2019, 44, 511–519. [Google Scholar] [CrossRef]
  8. Ferrao, P.; Fernandex, J.E. Sustainable Urban Metabolism; MIT Press: Cambridge, MA, USA, 2013; p. 264. [Google Scholar]
  9. Gercek, M.; Arsan, Z. Energy and environmental performance based decision support process for early design stages of residential buildings under climate change. Sustain. Cities Soc. 2019, 48. [Google Scholar] [CrossRef]
  10. Santucci, D.; Chokhachian, A.; Auer, T. Impact of Environmental Quality in Outdoor Spaces: Dependency Study between Outdoor Comfort and People’s Presence. In Proceedings of the 4th International Conference S.ARCH 2017, Sustainable Architecture Conference, Hong Kong, China, 7–9 June 2017. [Google Scholar]
  11. Rogelj, J.; Shindell, D.; Jiang, K.; Fifita, S.; Forster, P.; Ginzburg, V.; Handa, C.; Kheshgi, H.; Kobayashi, S.; Kriegler, E.; et al. 2018: Mitigation Pathways Compatible with 1.5 °C in the Context of Sustainable Development. In Global Warming of 1.5 °C; An IPCC Special Report on the Impacts of Global Warming of 1.5 °C above Pre-Industrial Levels and Related Global Greenhouse Gas Emission Pathways, in the Context of Strengthening the Global Response to the Threat of Climate Change, Sus-tainable Development, and Efforts to Eradicate Poverty; Masson-Delmotte, V.P., Zhai, H.-O., Pörtner, D., Roberts, J., Skea, P.R., Shukla, A., Pirani, W., Moufouma-Okia, C., Péan, R., Pidcock, S., et al., Eds.; Intergovernmental Panel on Climate Change: Geneva, Switzerland, 2018. [Google Scholar]
  12. Ren, F.M.; Trewin, B.; Brunet, B.; Dushmanta, P.; Walterf, A.; Baddourg, O.; Korber, M. A research progress review on regional extreme events. Adv. Clim. Chang. Res. 2018, 9, 161–169. [Google Scholar] [CrossRef]
  13. Held, I.M.; Soden, B.J. Robust Responses of the Hydrological Cycle to Global Warming. J. Clim. 2006, 19, 5686–5699. [Google Scholar] [CrossRef]
  14. Manabe, S.; Wetherald, R.T. Thermal Equilibrium of the Atmosphere with a Given Distribution of Relative Humidity. J. Atmos. Sci. 1967, 24, 241–259. [Google Scholar] [CrossRef] [Green Version]
  15. Madsen, H.; Lawrence, D.; Lang, M.; Martinkova, M.; Kjeldsen, T.R. Review of trend analysis and climate change projections of extreme precipitation and floods in Europe. J. Hydrol. 2014, 519, 3634–3650. [Google Scholar] [CrossRef] [Green Version]
  16. European Commission. Nature-Based Solutions for Flood Mitigation and Coastal Resilience-Analysis of EU-Funded Projects. 2020. Available online: https://op.europa.eu/fr/publication-detail/-/publication/d6e80dca-d530-11ea-adf7-01aa75ed71a1/language-en/format-PDF/source-142701485 (accessed on 31 July 2020).
  17. Akbari, H.; Kolokotsa, D. Three decades of urban heat islands and mitigation technologies research. Energy Build. 2016, 133, 834–842. [Google Scholar] [CrossRef]
  18. Dwivedi, A.; Mohan, B.K. Impact of green roof on micro climate to reduce Urban Heat Island. Remote Sens. Appl. Soc. Environ. 2018, 10, 56–69. [Google Scholar] [CrossRef]
  19. Li, Y.; Babcock, R.W., Jr. Green roofs against pollution and climate change. A review. Agron. Sustain. Dev. 2014, 34, 695–705. [Google Scholar] [CrossRef] [Green Version]
  20. Rowe, D.B. Green roofs as a means of pollution abatement. Environ. Pollut. 2011, 159, 2100–2110. [Google Scholar] [CrossRef] [Green Version]
  21. Getter, K.L.; Rowe, D.B.; Robertson, G.P.; Cregg, B.M.; Andresen, J.A. Carbon sequestration potential of extensive green roofs. Environ. Sci. Technol. 2009, 43, 7564–7570. [Google Scholar] [CrossRef]
  22. Whittinghill, L.J.; Rowe, D.B.; Schutzki, R.; Cregg, B.M. Quantifying carbon sequestration of various green roof and ornamental landscape systems. Landsc. Urban Plan. 2014, 123, 41–48. [Google Scholar] [CrossRef]
  23. Knapp, S.; Schmauck, S.; Zehnsdorf, A. Biodiversity Impact of Green Roofs and Constructed Wetlands as Progressive Eco-Technologies in Urban Areas. Sustainability 2019, 11, 5846. [Google Scholar] [CrossRef] [Green Version]
  24. Cook-Patton, S.C.; Bauerle, T.L. Potential benefits of plant diversity on vegetated roofs: A literature review. J. Environ. Manag. 2012, 106, 85–92. [Google Scholar] [CrossRef]
  25. Williams, N.S.G.; Lundholm, J.; Macivor, J.S. Do green roofs help urban biodiversity conservation? J. Appl. Ecol. 2014, 51, 1643–1649. [Google Scholar] [CrossRef] [Green Version]
  26. Maiolo, M.; Pirouz, B.; Bruno, R.; Palermo, S.A.; Arcuri, N.; Piro, P. The Role of the Extensive Green Roofs on Decreasing Building Energy Consumption in the Mediterranean Climate. Sustainability 2020, 12, 359. [Google Scholar] [CrossRef] [Green Version]
  27. Castleton, H.F.; Stovin, V.; Beck, S.B.M.; Davison, J.B. Green roofs; Building energy savings and the potential for retrofit. Energy Build. 2010, 42, 1582–1591. [Google Scholar] [CrossRef]
  28. La Roche, P.; Berardi, U. Comfort and energy savings with active green roof. Energy Build. 2014, 82, 492–504. [Google Scholar] [CrossRef]
  29. Niachou, A.; Papakonstantinou, K.; Santamouris, M.; Tsangrassoulis, A.; Mihalakakou, G. Analysis of the green roof thermal Properties and investigation of its energy performance. Energy Build. 2001, 33, 719–729. [Google Scholar] [CrossRef]
  30. He, Y.; Yu, H.; Ozaki, A.; Dong, N.; Zheng, S. Long-term thermal performance evaluation of green roof system based on two new indexes: A case study in Shanghai area. Build. Environ. 2017, 120, 13–28. [Google Scholar] [CrossRef]
  31. Del Barrio, E.P. Analysis of the green roofs cooling potential in buildings. Energy Build. 1998, 27, 179–193. [Google Scholar] [CrossRef]
  32. Ouldboukhitine, S.E.; Belarbi, R.; Jaffal, I.; Trabelsi, A. Assessment of green roof thermal behaviour: A coupled heat and mass transfer model. Build. Environ. 2011, 46, 2624–2631. [Google Scholar] [CrossRef]
  33. Theodosiou, T.G. Summer period analysis of the performance of a planted roof as a passive cooling technique. Energy Build. 2003, 35, 909–917. [Google Scholar] [CrossRef]
  34. La Roche, P.; Yeom, D.J.; Ponce, A. Passive cooling with a Hybrid green roof for extreme climates. Energy Build. 2020, 224. [Google Scholar] [CrossRef]
  35. Onmura, S.; Matsumoto, M.; Hoko, S. Study on evaporative cooling effect of roof lawn gardens. Energy Build. 2001, 33, 653–666. [Google Scholar] [CrossRef]
  36. Buchin, O.; Hoelscher, M.T.; Meier, F.; Nehls, T.; Ziegler, F. Evaluation of the Health-risk reduction potential of countermeasures to urban heat island. Energy Build. 2016, 114, 27–37. [Google Scholar] [CrossRef]
  37. Alcazar, S.S.; Olivieri, F.; Neila, J. Green roofs: Experimental and analytical study of its potential for urban microclimate regulation in Mediterranean-continental climates. Urban Clim. 2016, 17, 304–317. [Google Scholar] [CrossRef]
  38. Santamouris, M. Cooling the cities—A review of reflective and green roof mitigation technologies to fight heat island and improve comfort in urban environments. Sol. Energy 2014, 103, 682–703. [Google Scholar] [CrossRef]
  39. Bowler, D.E.; Buyung-Ali, L.; Knight, T.M.; Pullin, A.S. Urban greening to cool towns and cities: A systematic review of the empirical evidence. Landsc. Urban Plan. 2010, 97, 147–155. [Google Scholar] [CrossRef]
  40. Speak, A.F.; Rothwell, J.J.; Lindley, S.J.; Smith, C.L. Urban particulate pollution reduction by four species of green roof vegetation in a UK city. Atmos. Environ. 2012, 61, 283–293. [Google Scholar] [CrossRef]
  41. Currie, B.A.; Bass, B. Estimates of air pollution mitigation with green plants and green roofs using the UFORE model. Urban Ecosyst. 2008, 11, 409–422. [Google Scholar] [CrossRef]
  42. Yang, J.; Yu, Q.; Gong, P. Quantifying air pollution removal by green roofs in Chicago. Atmos. Environ. 2008, 42, 7266–7273. [Google Scholar] [CrossRef]
  43. Hirano, Y.; Ihara, T.; Gomi, K.; Fujita, T. Simulation-Based Evaluation of the Effect of Green Roofs in Office Building Districts on Mitigating the Urban Heat Island Effect and Reducing CO2 Emissions. Sustainability 2019, 11, 2055. [Google Scholar] [CrossRef] [Green Version]
  44. Shafique, M.; Xue, X.; Luo, X. An overview of carbon sequestration of green roofs in urban areas. Urban For. Urban Green. 2020, 47. [Google Scholar] [CrossRef]
  45. Lia, J.; Waib, O.W.H.; Lib, Y.S.; Zhana, J.; Hoc, Y.A.; Lid, J.; Lam, E. Effect of green roof on ambient CO2 concentration. Build. Environ. 2010, 45, 2644–2651. [Google Scholar] [CrossRef]
  46. Kuronuma, T.; Watanabe, H.; Ishihara, T.; Kou, D.; Toushima, K.; Ando, M.; Shindo, S. CO2 Payoff of Extensive Green Roofs with Different Vegetation Species. Sustainability 2018, 10, 2256. [Google Scholar] [CrossRef] [Green Version]
  47. Benvenuti, S. Wildflower green roofs for urban landscaping, ecological sustainability and biodiversity. Landsc. Urban Plan. 2014, 124, 151–161. [Google Scholar] [CrossRef]
  48. Blank, L.; Vasl, A.; Schindler, B.Y.; Kadas, G.J.; Blaustein, L. Horizontal and vertical island biogeography of arthropods on green roofs: A review. Urban Ecosyst. 2017, 20, 911–917. [Google Scholar] [CrossRef]
  49. Ksiazek-Mikenas, K.; Herrmann, J.; Menke, S.B.; Köhler, M. If You Build It, Will They Come? Plant and Arthropod Diversity on Urban Green Roofs Over Time. Urban Nat. 2018, 1, 52–72. [Google Scholar]
  50. MacIvor, J.S.; Lundholm, J. Insect species composition and diversity on intensive green roofs and adjacent level-ground habitats. Urban Ecosyst. 2011, 14, 225–241. [Google Scholar] [CrossRef]
  51. Madre, F.; Vergnes, A.; Machon, N.; Clergeau, P. Green roofs as habitats for wild plant species in urban landscapes: First insights from a large-scale sampling. Landsc. Urban Plan. 2014, 122, 100–107. [Google Scholar] [CrossRef]
  52. Tonietto, R.; Fant, J.; Ascher, K.E.; Larkin, D. A comparison of bee com-munities of Chicago green roofs, parks, and prairies. Landsc. Urban Plan. 2011, 103, 102–108. [Google Scholar] [CrossRef]
  53. Mentens, J.; Raes, D.; Hermy, M. Green roofs as a tool for solving the rainwater runoff problem in the urbanized 21st century? Landsc. Urban Plan. 2006, 77, 217–226. [Google Scholar] [CrossRef]
  54. Palla, A.; Gnecco, I.; Lanza, G. Hydrologic Restoration in the Urban Environment Using Green Roofs. Water 2010, 2, 140–154. [Google Scholar] [CrossRef]
  55. Carter, T.; Jackson, C.R. Vegetated roofs for stormwater management at multiple spatial scales. Landsc. Urban Plan. 2007, 80, 84–97. [Google Scholar] [CrossRef]
  56. Zhang, Q.; Miao, L.; Wang, X.; Liu, D.; Zhu, L.; Zhou, B.; Sun, J.; Liu, J. The capacity of greening roof to reduce storm water runoff and pollution. Landsc. Urban Plan. 2015, 144, 142–150. [Google Scholar] [CrossRef]
  57. Berndtsson, J.C.; Bengtsson, L.; Jinno, K. Runoff water quality from intensive and extensive vegetated roofs. Ecol. Eng. 2009, 35, 369–380. [Google Scholar] [CrossRef]
  58. Villarreal, E.L.; Semadeni, D.; Bengtsson, L. Inner city stormwater control using a combination of best management practices. Ecol. Eng. 2004, 22, 279–298. [Google Scholar] [CrossRef]
  59. Liu, W.; Feng, Q.; Chen, W.; Wei, W. Assessing the runoff retention of extensive green roofs using runoff coefficients and curve numbers and the impacts of substrate moisture. Hydrol. Res. 2020, 51, 51. [Google Scholar] [CrossRef]
  60. Gong, Y.; Yin, D.; Li, J.; Zhang, X.; Wang, W.; Fang, X.; Shi, H.; Wang, Q. Performance assessment of extensive green roof runoff flow and quality control capacity based on pilot experiments. Sci. Total Environ. 2019, 687, 505–515. [Google Scholar] [CrossRef]
  61. Forschungsgesellschaft Landschaftsentwicklung Landschaftsbau e.V. (Landscape Development and Landscaping Research Society). In Green Roof Guidelines. Guidelines for the Planning, Construction and Maintenance of Green Roofs; Landscape Development and Landscaping Research Socitety: Bonn, Germany, 2018. [Google Scholar]
  62. Teemusk, A.; Mander, U. Rainwater runoff quantity and quality performance from a green roof: The effects of short-term events. Ecol. Eng. 2007, 30, 271–277. [Google Scholar] [CrossRef]
  63. Cascone, S.; Coma, J.; Gagliano, A.; Pérez, G. The evapotranspiration process in green roofs: A review. Build. Environ. 2019, 147, 337–355. [Google Scholar] [CrossRef]
  64. Fassman-Beck, E.; Voyde, E.; Simcock, R.; Hong, Y.S. 4 Living roofs in 3 locations: Does configuration affect runoff mitigation? J. Hydrol. 2013, 490, 11–20. [Google Scholar] [CrossRef]
  65. Stovin, V.; Poë, S.; De-Ville, S.; Berretta, C. The influence of substrate and vegetation configuration on green roof hydrological performance. Ecol. Eng. 2015, 85, 159–172. [Google Scholar] [CrossRef] [Green Version]
  66. Cook, L.M.; Larsen, T.A. Towards a performance-based approach for multifunctional green roofs: An interdisciplinary review. Build. Environ. 2021, 188. [Google Scholar] [CrossRef]
  67. Italian National Unification. UNI 11235–Istruzioni per la Progettazione, l’esecuzione, il Controllo e la Manutenzione di Coperture a Verde [Criteria for Design, Execution, Testing and Maintenance of Roof Garden]; UNI: Rome, Italy, 2015. [Google Scholar]
  68. Giacomello, E. Copertura a Verde e Risorsa Idrica. Implicazioni Tecnologiche e Benefici per l’ambiente Urbano [Green Roofs and Water. Technological Implications and Benefits for the Urban Environment]; Franco Angeli: Milan, Italy, 2012; p. 160. [Google Scholar]
Figure 1. Flowchart of the proposed methodological approach.
Sustainability 13 03078 g001
Figure 2. Isoiete of annual average rainfall [mm] between 1992–2016 in Veneto Region. Source: ARPAV-Agenzia Regionale per la Prevenzione e Protezione Ambientale del Veneto (tr. Regional Agency for Environmental Protection and Prevention of Veneto). Elaborations by Maria Federica Checchetto, ARPAV.
Sustainability 13 03078 g002
Figure 3. Isoiete of seasonal average rainfall [mm] between 1992–2016 in Veneto Region. Source: ARPAV. Elaborations by Maria Federica Checchetto, ARPAV.
Sustainability 13 03078 g003
Figure 4. Annual average values of the first 5 rainfall peaks Δt = 5 min [mm] between 1992–2016.
Sustainability 13 03078 g004
Figure 5. Monthly distribution of rainfall peaks Δt = 5 min [mm] between 1992–2016.
Sustainability 13 03078 g005
Figure 6. Distribution of peaks values Δt = 5 min [mm] between 1992–2016 in a range of 2 mm.
Sustainability 13 03078 g006
Figure 7. Annual distribution of rain peaks of the first five rainfall peaks Δt = 5 min [mm] between 1992–2016.
Sustainability 13 03078 g007
Figure 8. Rain simulator above the rain the chamber.
Sustainability 13 03078 g008
Figure 9. Rain chamber diagram.
Sustainability 13 03078 g009
Figure 10. The rain chamber.
Sustainability 13 03078 g010
Figure 11. Simulation 1.a.
Sustainability 13 03078 g011
Figure 12. Simulation 1.b.
Sustainability 13 03078 g012
Figure 13. Simulation 2 (1). Simulation 2 (2). Simulation 2 (3).
Sustainability 13 03078 g013aSustainability 13 03078 g013b
Figure 14. Simulation 3.
Sustainability 13 03078 g014
Figure 15. (a) Simulation 4 (1); (b) Simulation 4 (2); (c) Simulation 4 (3).
Sustainability 13 03078 g015aSustainability 13 03078 g015b
Table 1. Comparison of runoff coefficient (ψ o C) per thickness of bulk materials, in different standards.
Thickness of
Bulk Material
FLL Green Roofing Guidelines 2018UNI 11235:2015
Italian Green Roof Standard
Maltese Standard SM 3700:2017
Green Roofs
6–10 cm0.500.600.5
10–15 cm0.450.450.4
15–25 cm0.400.350.3
25–50 cm0.300.25–0.200.3–0.2
≥50 cm0.10.10.1
Table 2. Substrate characteristics of the vegetation stratum (substrate) used in the sample green roof.
PropertyUnitValue
Apparent density—dry materialKg/m3980
Apparent density—maximum water storage capacityKg/m31.390
Porosity% Volume63
Maximum water storage capacity% Volume40
Air content at maximum water storage capacity% Volume23
Organic matter content% Mass3.2
pH 7.7
Table 3. Tested rain events and scheduled experimental sessions in the rain chamber.
Simulation [n]Day of Test [n°]Data of the Rain Event [dd/mm/yyyy]Green Roof Pitch [%]Duration of The Rain Event [Hour h—min’]Duration of the Inter-Event [Hour h—min’]Value of the Rain Peaks [mm]
1.a04/08/20022%1 h 35′3 h 00′17.2
1.b04/08/20022%1 h 35′18 h 30′17.2
218/09/19942%5 h 40′24 h 00′13.00; 11.00; 9.2; 8.0; 5.4
3FLL Test2%15′24 h 00′9.0
408/09/19949%5 h 40′ 13.00; 11.00; 9.2; 8.0; 5.4
Table 4. Simulation 1.a: Summary of input and output data.
SUMMARY OF INPUT DATA
Duration of the Rain Event [hour h—min ‘]Maximum Intensity of the Rain Peak [mm/5 min]Total Intercepted Rain [l]Green Roof Pitch [%]
1 h 22′18.0170.02
HUMIDITY OF THE SUBSTRATE AT THE BEGINNING OF THE SIMULATION
Arid substrate
SUMMARY OF OUTPUT DATA
Water Storage Capacity [L/m2]Runoff Delay [hour h—min ‘]Runoff Maximum Intensity [mm/5 min]Delay of Runoff Peak [min′ sec]Total Runoff [l]
32.71 h 23′1.6No runoff peak occurred6.5
Table 5. Simulation 1.b: Summary of input and output data.
SUMMARY OF INPUT DATA
Duration of the Rain Event
[hour h—min ‘]
Maximum Intensity of the Rain Peak
[mm/5 min]
Total Intercepted Rain
[l]
Green Roof Pitch
[%]
1 h 22′14.0170.02
HUMIDITY OF THE SUBSTRATE AT THE BEGINNING OF THE SIMULATIONINTER-EVENT FROM PREVIOUS RAIN EVENT
[hour h—min ‘]
Substrate left minimum volume of runoff,
inferiors to 0.4 L/min
3 h 00′
SUMMARY OF OUTPUT DATA
Runoff Delay
[hour h—min ‘]
Runoff Maximum Intensity
[mm/5 min]
Delay of Runoff Peak
[min′ sec]
Total Runoff
[l]
3′11.68′ 45″124.5
Table 6. Simulation 2: Summary of input and output data.
SUMMARY OF INPUT DATA
Duration of the Rain Event
[hour h—min ‘]
Maximum Intensity of the Rain Peak
[mm/5 min]
Total Intercepted Rain
[l]
Green Roof Pitch
[%]
5 h 05′12.0357.02
HUMIDITY OF THE SUBSTRATE AT THE BEGINNING OF THE SIMULATIONINTER-EVENT FROM PREVIOUS RAIN EVENT
[hour h—min ‘]
Substrate at the little less maximum water capacity18 h 30′
SUMMARY OF OUTPUT DATA
Runoff Delay
[hour h—min ‘]
Runoff Maximum Intensity
[mm/5 min]
Delay of Runoff Peak
[min′ sec]
Total Runoff
[l]
1 h 28′11.67′ 45″313.0
Table 7. Runoff coefficients of drainage surfaces.
Type of SurfaceRunoff Coefficient
Asphalt or pavement with sealed joints 0.85–0.90
Porphyry with sealed joint0.75–0.85
Porphyry with unsealed joint0.30–0.70
Sports facilities with synthetic material0.60
Pitched roofs > 3%0.90–1
Pitched roofs < 3%0.80
Roof with gravel ballast0.70
Intensive green roof (substrate = 25 cm)0.30
Natural land0.10
Table 8. Simulation 3: Summary of input and output data.
SUMMARY OF INPUT DATA
Duration of the Rain Event
[hour h—min ‘]
Maximum Intensity of the Rain Peak
[mm/5 min]
Total Intercepted Rain
[l]
Green Roof Pitch
[%]
15′9.0135.02
HUMIDITY OF THE SUBSTRATE AT THE BEGINNING OF THE SIMULATIONINTER-EVENT FROM PREVIOUS RAIN EVENT
[hour h—min ‘]
Substrate at the little less maximum water capacity. According to the FLL Green Roofing, 24 h before, the substrate was saturated and generated runoff24 h 00′
SUMMARY OF OUTPUT DATA
Runoff Coefficient Ψ
[n]
Runoff Maximum Intensity
[mm/5 min]
Total runoff
[l]
0.689.692.0
Table 9. Simulation 4: Summary of input and output data.
SUMMARY OF INPUT DATA
Duration of the Rain Event
[hour h—min ‘]
Maximum Intensity of the Rain Peak
[mm/5 min]
Total Intercepted Rain
[l]
Green Roof Pitch
[%]
5 h 05′12.8 mm351.09
HUMIDITY OF THE SUBSTRATE AT THE BEGINNING OF THE SIMULATIONINTER-EVENT FROM PREVIOUS RAIN EVENT
[hour h—min ‘]
Substrate at little less maximum water capacity18 h 00′
SUMMARY OF OUTPUT DATA
Runoff Delay
[hour h—min ‘]
Runoff Maximum Intensity
[mm/5 min]
Delay of Runoff Peak
[min′ sec]
Total Runoff
[l]
1 h 22′12.88′ 00″305.0
Table 10. Comparison between the rainfall values of the simulations and the highest daily rainfall values of Quinto Vicentino (34 m a.s.l.) and Asiago (35 km beeline from Quinto V. 1026 m a.s.l.).
n° of Consecutive DaysQuinto Vicentino
[mm]
[dd–dd/mm/yyyy]
Quinto Vicentino
Flood 2010
[mm]
[dd–dd/mm/yyyy]
Asiago
Flood 2010
[mm]
[dd–dd/mm/yyyy]
Rain Chamber Simulations
[mm]
1113.6
7 November 2005
49.8
31 October 2010
110.6
31 October 2010
108.0
2123.2
05–06 November 2005
98.8
31 October 2010–01 November 2010
202.2
31 October 2010–01 November 2010
179.4
3156.6
15–17 September 2006
135.0
31 October 2010–02 November 2010
242.6
31 October 2010–02 November 2010
249.4
4156.6
15–17 September /2006
135.0
31 October 2010–03 November 2010
242.6
31 October 2010–03 November 2010
318.0
Publisher’s Note: MDPI stays neutral with regard to jurisdictional claims in published maps and institutional affiliations.

