1. Introduction
While developed economies have created public service systems that collect and extract value from recyclable waste, developing economies often depend on informal, labor-intensive recycling systems that rely on independent waste pickers who collect and sell recyclables for a living [
1]. South Korea, despite its advanced economy with advanced government institutions, still relies on small-scale junk shops and independent collectors in order to process the majority of cities’ waste. Historically, following the Korean War, socio-economically vulnerable individuals such as orphans, elderly individuals, and those with low levels of education often collected discarded recyclables to sell to junk shops as a means of economic survival [
2]. Currently, elderly, low-income individuals make up the majority of waste pickers throughout Korean cities, collecting recyclables by foot and using handcarts to pull the waste through the streets. According to a case study of waste pickers in the Kwanak district of Seoul, 78% of handcart-pulling waste pickers were over 70 years old, and over half of those interviewed stated that they often work more than 8 hours each day, earning a monthly income of under 200,000 KRW, which is roughly equivalent to
$180 USD [
3].
The informal junk shops that buy from these waste pickers are commonly referred to as “Gomulsang” in Korea and have existed since the early 1960s. Initially, the Korean government mandated that these junk shops could only operate with strict permission from local authorities, but this requirement was abolished in 1993. In 2001, an additional revision to the country’s waste management law allowed for small junk shops occupying less than 1000 m
2 to operate freely without any form of registration other than the typically required business license [
2]. As cities continued to grow and Korea sought to achieve more environmentally sustainable outcomes under global scrutiny, the government continued to allow these informal networks of junk shops to exist in conjunction with the country’s more formalized waste-processing system. Over time, these organically occurring waste-processing networks were taken for granted as an additional, low-cost service that reduced solid waste flows and increased recycling rates across the country.
As a result, these informal junk shops play an essential role in Korean cities’ waste-processing infrastructure. With a recycling rate of 58.1%, Korea has one of the highest recycling rates among OECD countries, with this rate continuing to grow due to government programs such as the 2018 Plastic Waste Control Plan [
4,
5,
6]. The junk shops act as the smallest-unit facilities for collecting and sorting waste for further recycling processing, providing marketplaces where individual waste pickers can sell their collected recyclables. From 2006 to 2015, the number of registered waste-collecting businesses, mainly consisting of these informal junk shops, nearly doubled from 9984 to 18,707 [
7]. Local government authorities have also increased their involvement and investment within these networks of informal junk shops, creating programs that fund the upgrading of their physical appearances, as well as funding a variety of tax-reduction measures [
7,
8].
However, despite the continued ubiquity of junk shops in Korean cities, conflicts continue to arise between junk shops and local government officials, often due to the negative stigma associated with junk shops’ presence and the subsequent impact they have on the perceived reputation of their neighborhoods. As a result, the policies regulating these junk shops have continued to fluctuate over time, with the government alternating between providing administrative support for their continued operation while also approving laws that pressure them to leave most major urban areas [
9]. As South Korean cities focus on sustainability in the face of increasingly high levels of waste generation, the link between urban informatics and the pursuit of increased sustainability has been a growing topic amongst urban planners and stakeholders [
5,
6,
9]. As large data sources linked to the cities’ fabric become more widely available, the desire for “data-driven urbanism” that optimizes cities’ resource management systems has become more widespread [
10,
11]. In the context of waste management, there have been a range of examples where increased urban data has led to advances in smart waste management. In Barcelona and Stockholm, governments introduced smart bins that give signals to local waste authorities when full, while in Ha Giang City, Vietnam, planners used GIS, multi-agent modeling, and traffic flow capacity simulation in order to analyze potential waste routes and then create an optimized waste transportation network [
11,
12]. As the amount of data within cities increases over time, the ability to map out a city’s “urban metabolism” and increase the sustainability of a city’s processes has become a greater possibility [
13,
14].
In this paper, we use GIS analysis and field interviews in order to determine the variables that have the greatest power in predicting the spatial layout of Korea’s informal recycling system. We extracted the location of thousands of junk shops in Korea from online search engine application programming interfaces (APIs) and analyzed their spatial distribution in relation to different variables related to the city’s demographic and urban planning patterns. As a way to supplement and test the strength of our quantitative analysis, we also gathered qualitative data through interviews with junk shop owners, urban planning researchers, and government officials, collecting information on the factors they believed had most affected the nature and layout of the country’s informal waste management systems. We conclude by giving suggestions for how the usage of urban informatics could increase the sustainability, efficiency, and equity of the country’s waste management systems, while also discussing the possible pitfalls of using existing datasets on the country’s informal waste sector.
2. Methods
2.1. Spatial Analysis
Currently, there is a lack of publicly available data on the sizes and locations of Korea’s informal recycling junk shops, due to both the logistical difficulty of obtaining these data as well as an overall lack of interest by the government and research institutes. The few existing formal studies about Korea’s informal recycling focus primarily on their existence through an anthropological lens and do not examine the relationship between the junk shops’ spatial layout and the city’s urban planning and population patterns. While some information on junk shops, such as size and location, can be estimated using tax history, business claims, and transaction data, the Korean government’s privacy policies restrict access to this information and therefore make it unavailable for study.
Despite the lack of formally compiled data on these junk shops, the increasing amount of data provided by online mapping entities provides an alternative method for accessing data on the spatial layout of junk shops. Over the course of 2017, we accessed the application programming interface (API) of the Korean web portal Naver and scraped data on every junk shop listed within their online map directory. After inputting the term “Gomulsang” into the Naver search engine, the service API returned 8669 junk shop listings within Korea, including information such as their latitudinal and longitudinal coordinates, business names, phone numbers, and listed addresses, which we then geocoded into GIS layers for further analysis. In 2015, KOSIS (Korean Statistical Information Service) reported that the total number of waste-collecting businesses formally registered with the Korean government numbered at 18,707, 90% of which had fewer than five employees [
5]. Taking these KOSIS data into account, it is possible to infer that Naver’s service API includes waste-processing businesses that exist outside of formal government datasets and that the Naver dataset could therefore include junk shops that were potentially biased toward a certain size or type.
From the 2017 KOSIS database, we then obtained 16 variables for Korea’s 250 districts, distributed within the following categories: population demographics, waste and recycling levels, land use, and measures of health and economic welfare. Depending on their location within Korea, these 250 districts included rural regions, small cities, and the boroughs of major cities (“-si”, “-gun”, and “-gu” within the official Korean administrative classification, respectively). As certain groups of variables held high collinearity, we eliminated redundant variables in a series of linear regression models in order to create the most robust predictive model for junk shop spatial layout.
2.2. Interviews
To supplement our analysis of junk shops’ spatial patterns, we interviewed various junk shop owners in the cities of Seoul and Daejeon. Over the course of the study, we visited 20 junk shops in total and interviewed the business owners and employees with a set of questions focusing on three general areas: their primary source of income, their relationship with individual waste pickers, and the main types of recyclable waste their businesses handled. We carried out further interviews with three experts in this field of study: Young-kwang Kim, the President of the Junk Shop Federation, Dr. Ki-young Yoo, a Senior Researcher and Director in Planning and Coordination at the Seoul Institute, and Dr. Ko-un Kim, an Associate Research Fellow in the Department of Environment in the Seoul Institute.
3. Results
3.1. GIS Analysis
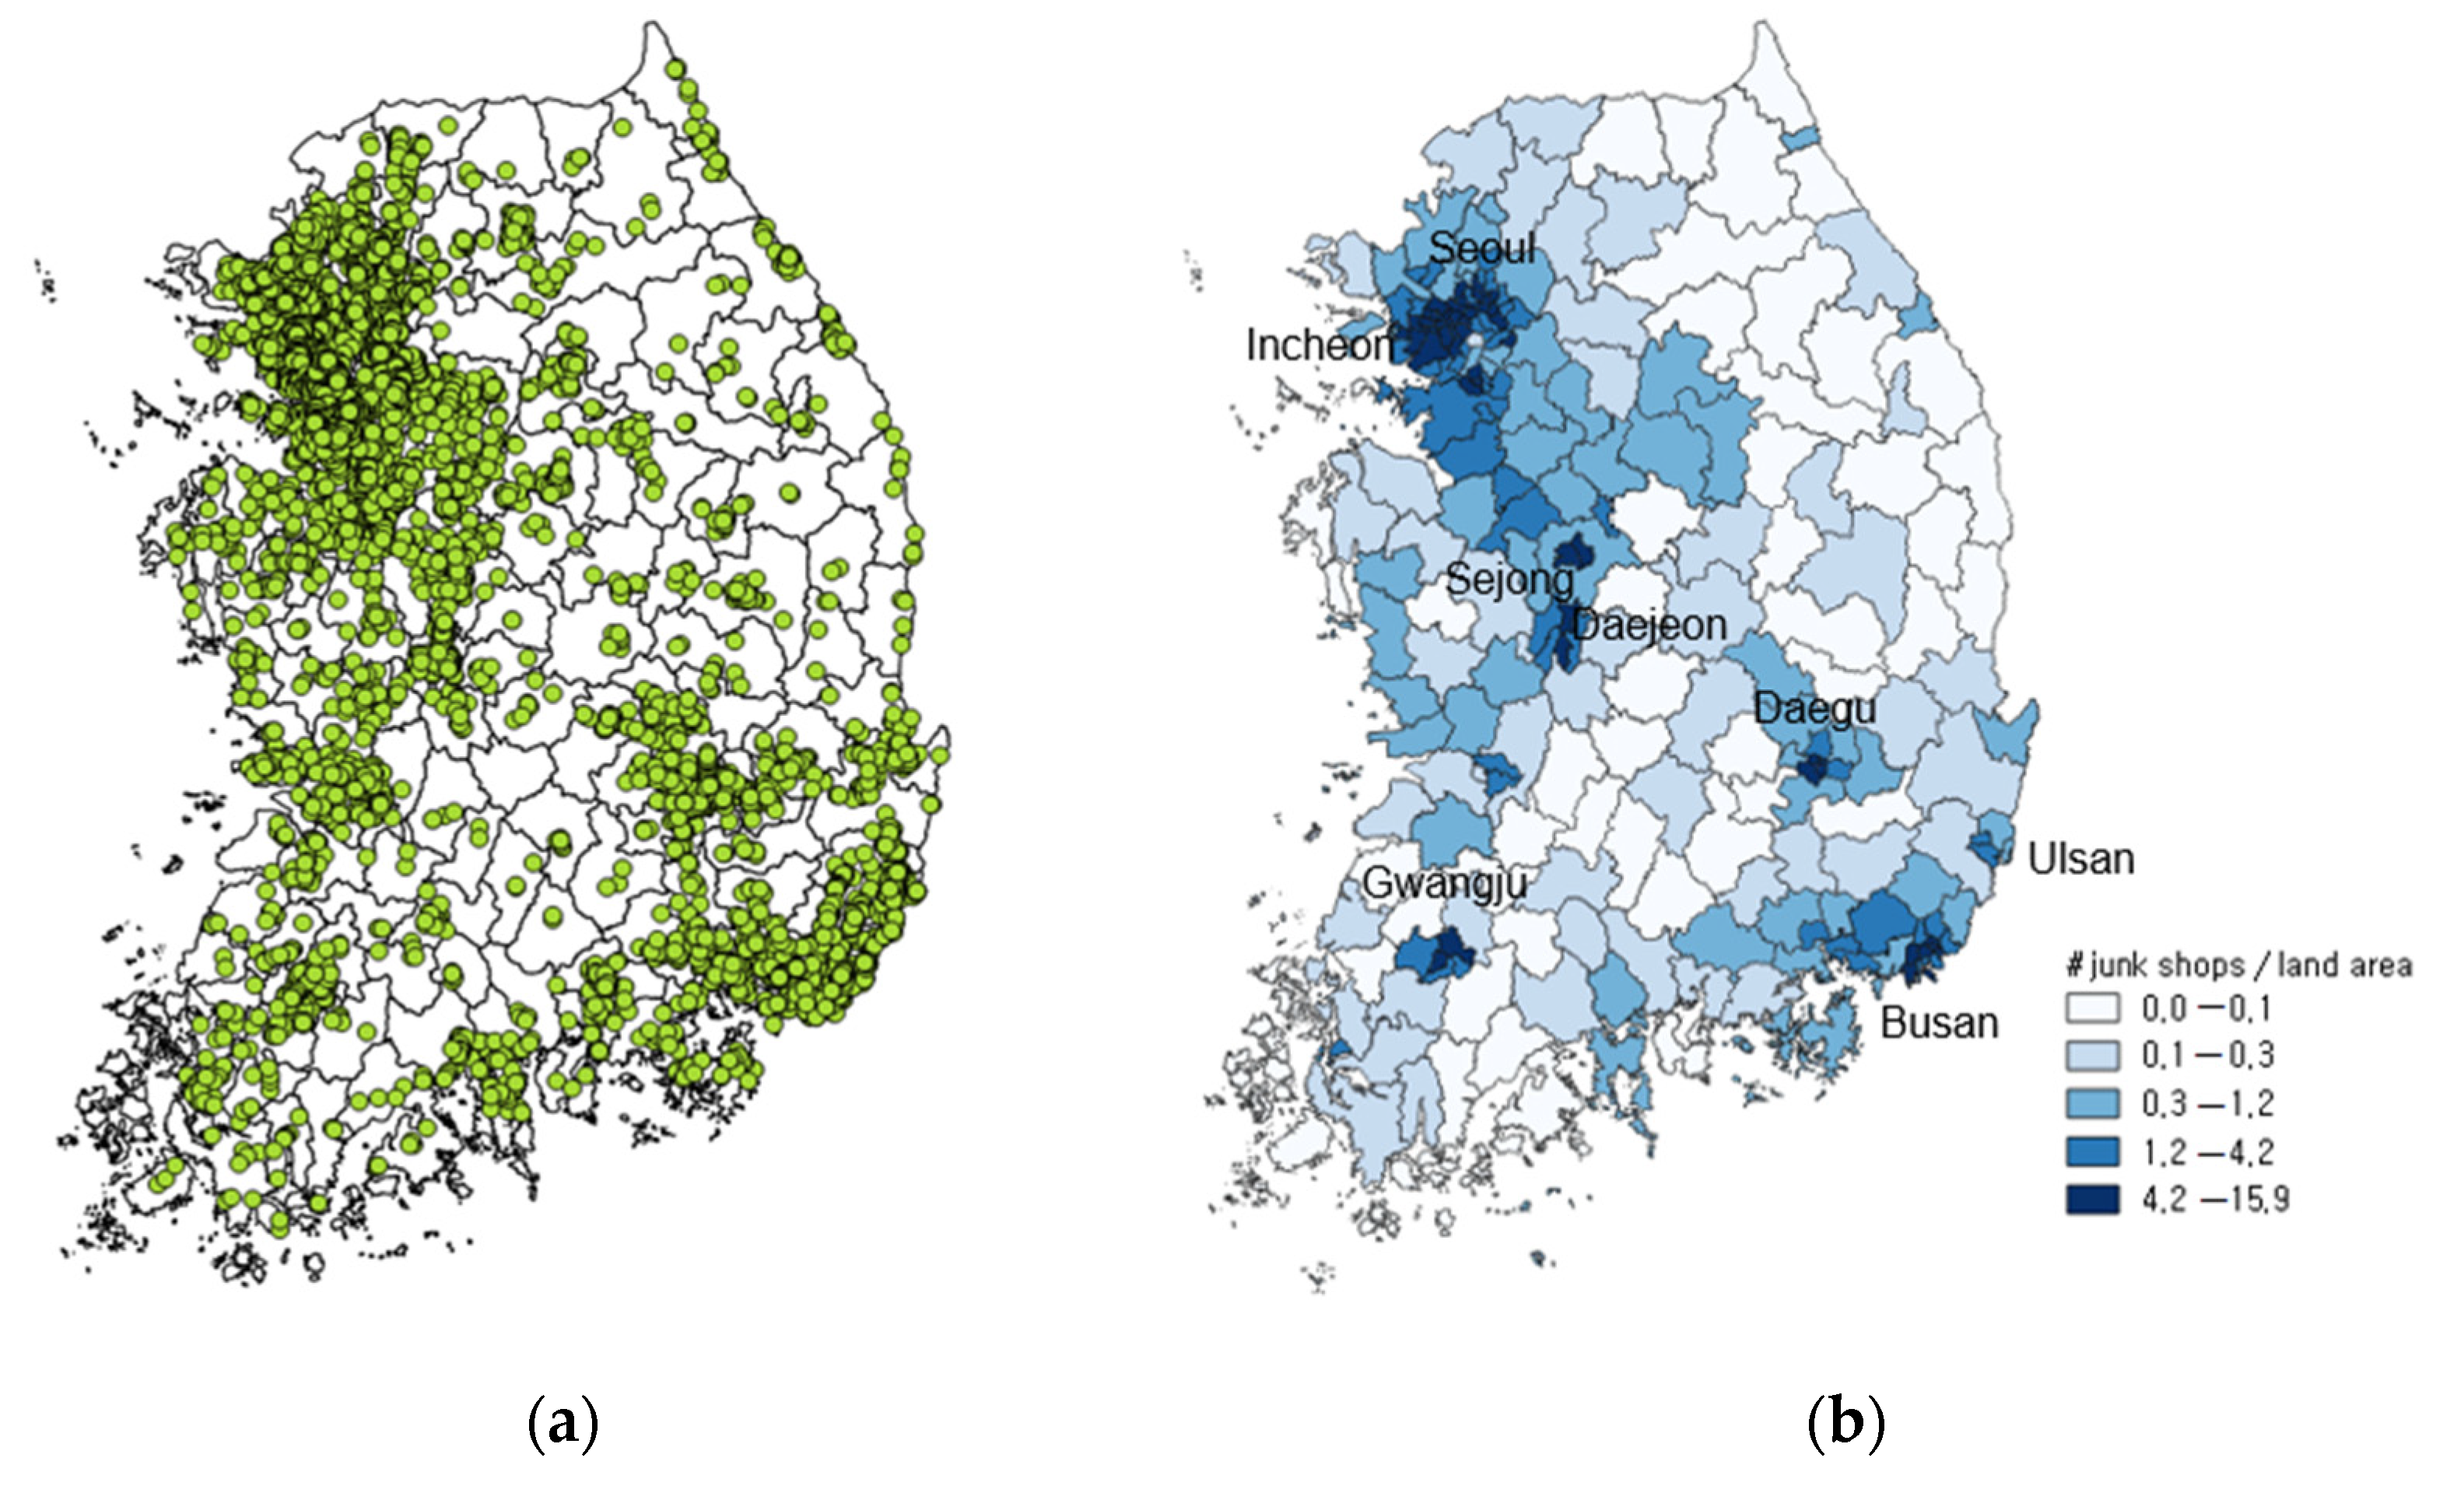
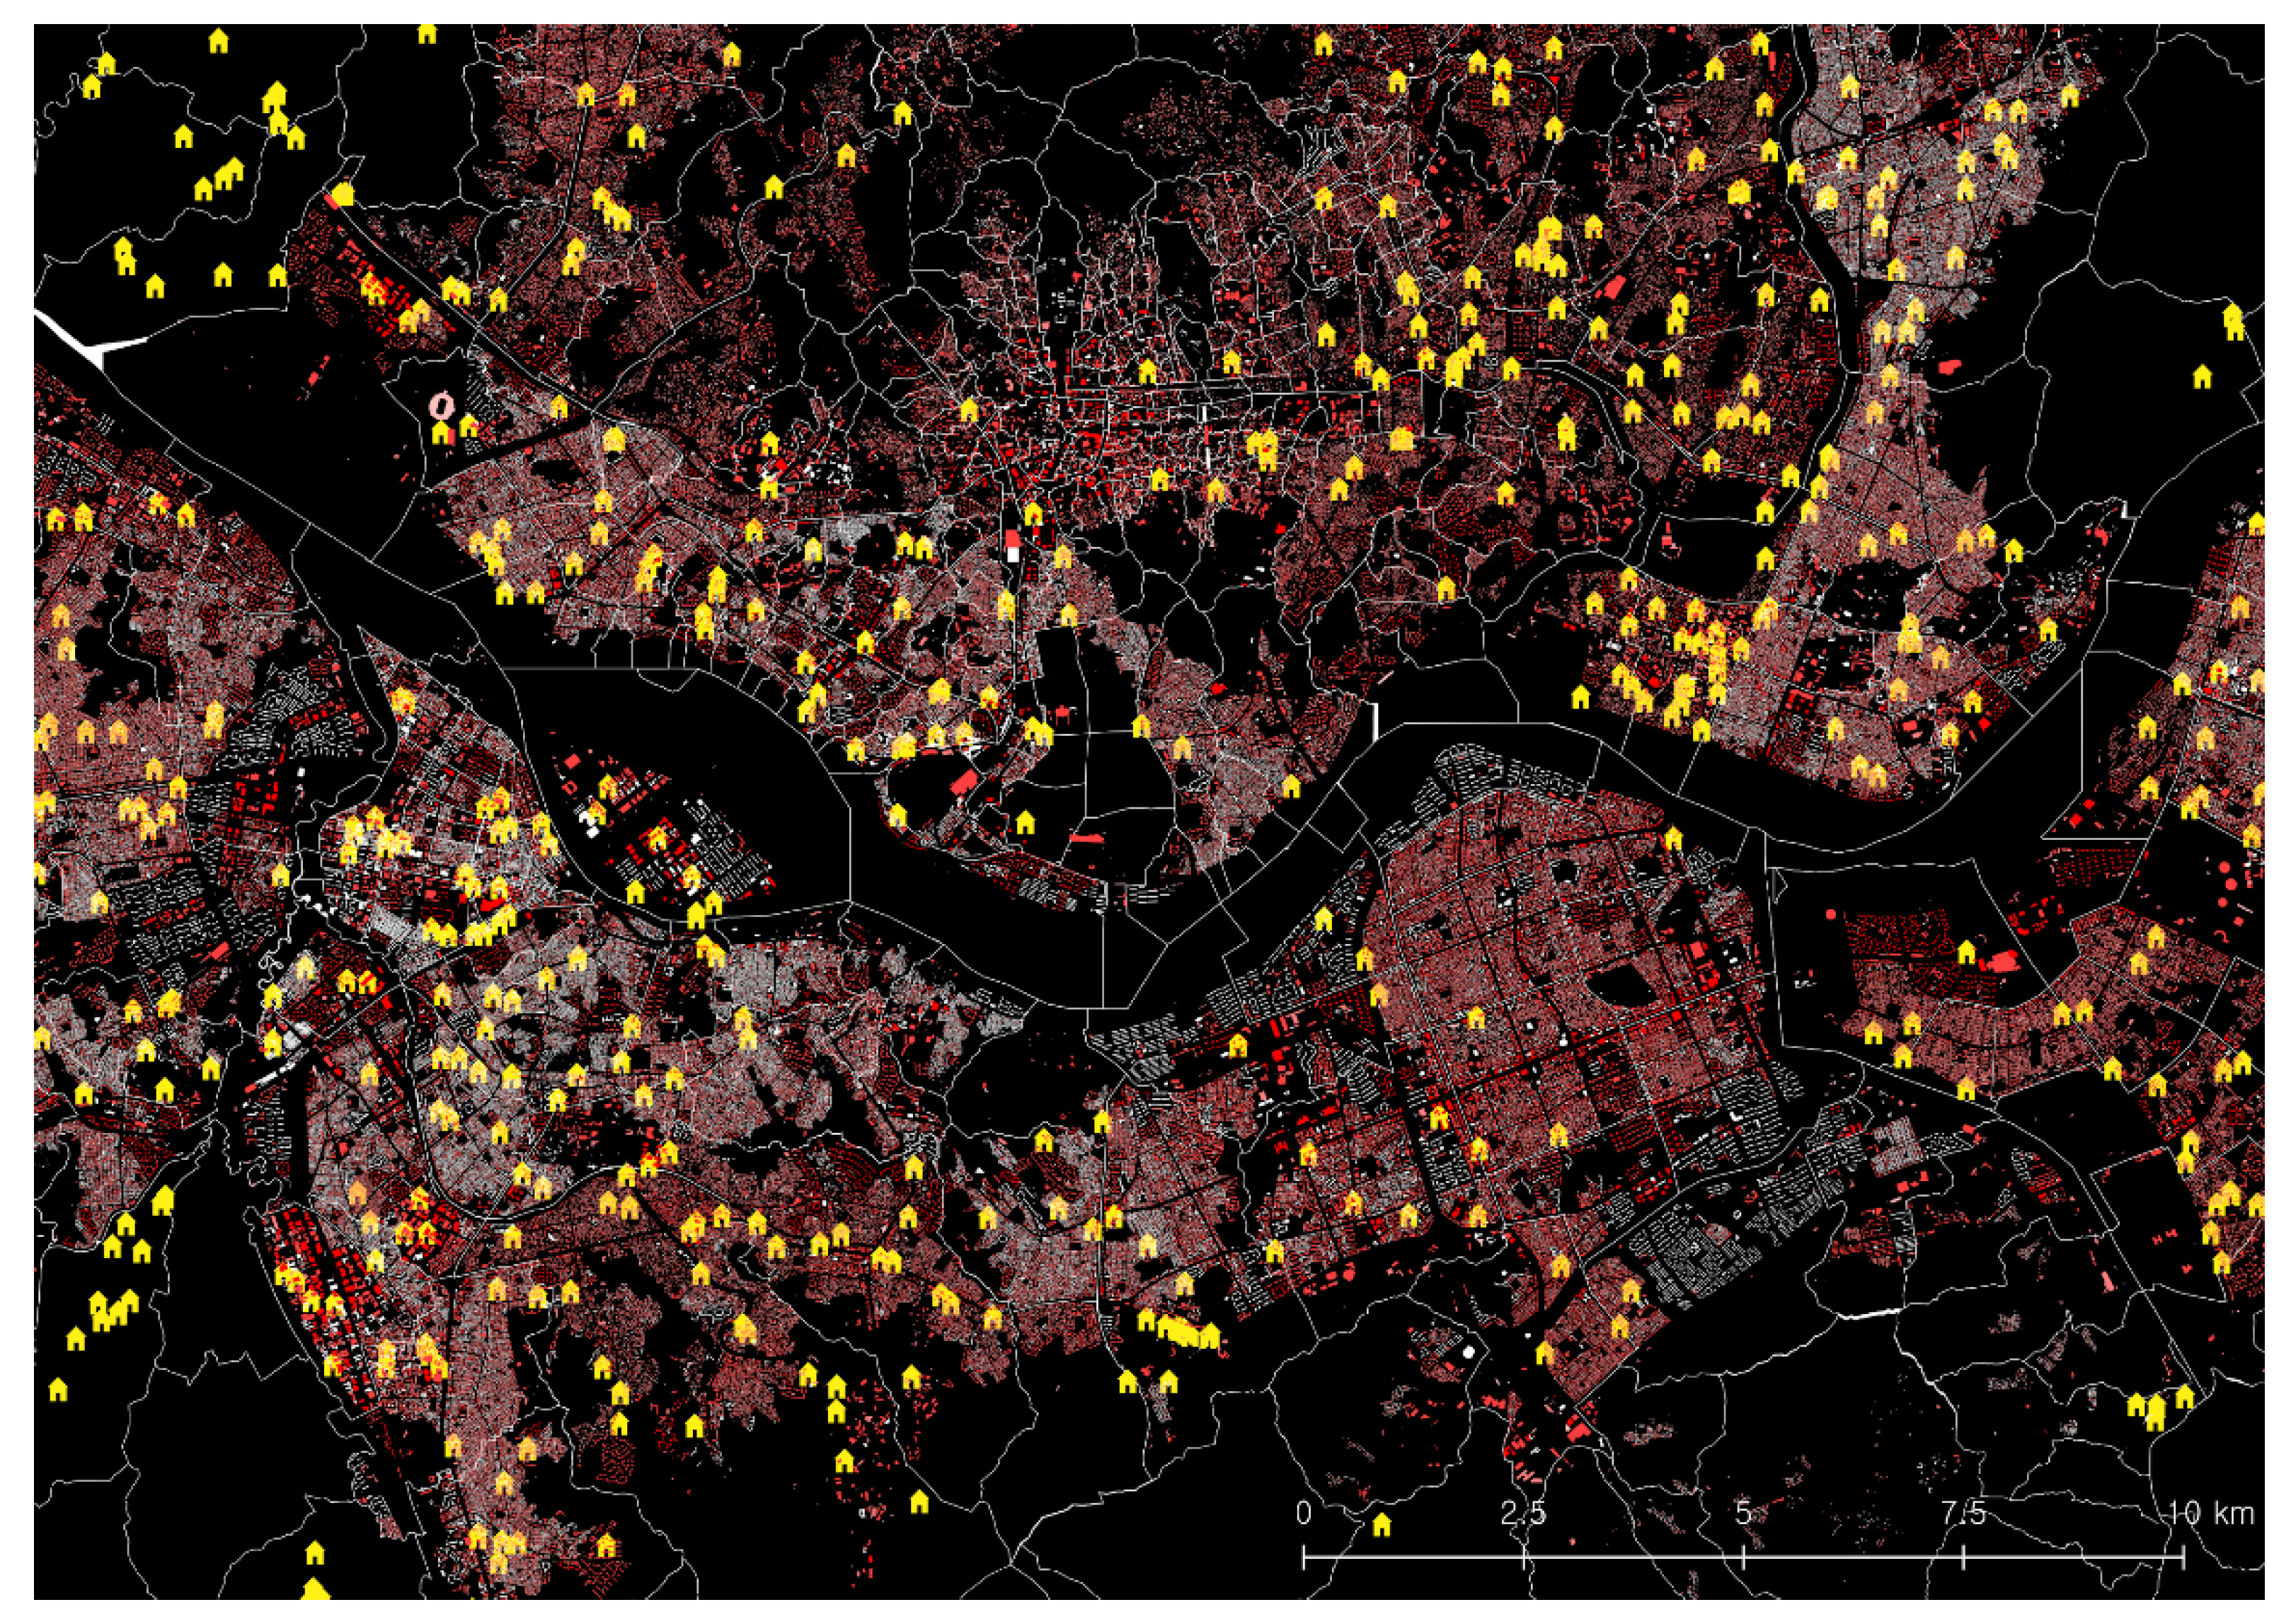
Figure 1a on the left shows the point layer of all junk shops documented within the Naver web search API, and
Figure 1b is the choropleth map, which represents the number of junk shops present within each square kilometer, with both layers mapped onto a polygon layer of all 250 districts in Korea. When the 8669 junk shops were overlaid on Korea’s districts, the map revealed that junk shops cluster more densely within all major cities and generally correlate with patterns of population density across the country. As Seoul, Busan, and Gyeonggi-do make up the country’s major metropolitan areas and hold some of the country’s most densely populated regions, it was expected that these areas would also contain the highest number of junk shops. Overall, the districts with the greatest number of junk shops included the majority of Seoul’s districts and a few districts in each of the other major cities in Korea, such as Busan and Daejeon. Conversely, the districts that were rural and held low population density had the fewest numbers of junk shops. Though the data generally suggested that urbanized and highly populated districts were more likely to have a greater number of junk shops, there were some notable exceptions. Certain districts with high degrees of urbanization and high population densities turned out to have relatively few junk shops, such as Busan’s Jung-gu district and Seoul’s Jongno-gu district, which each had 6 and 7 junk shops, respectively, both much lower than the median count of 24 junk shops. However, the surprisingly low number of junk shops in highly urbanized and highly populated districts may also be due to the districts’ urban fabric characteristics and dominant industries, a hypothesis that will be discussed later in the results section.
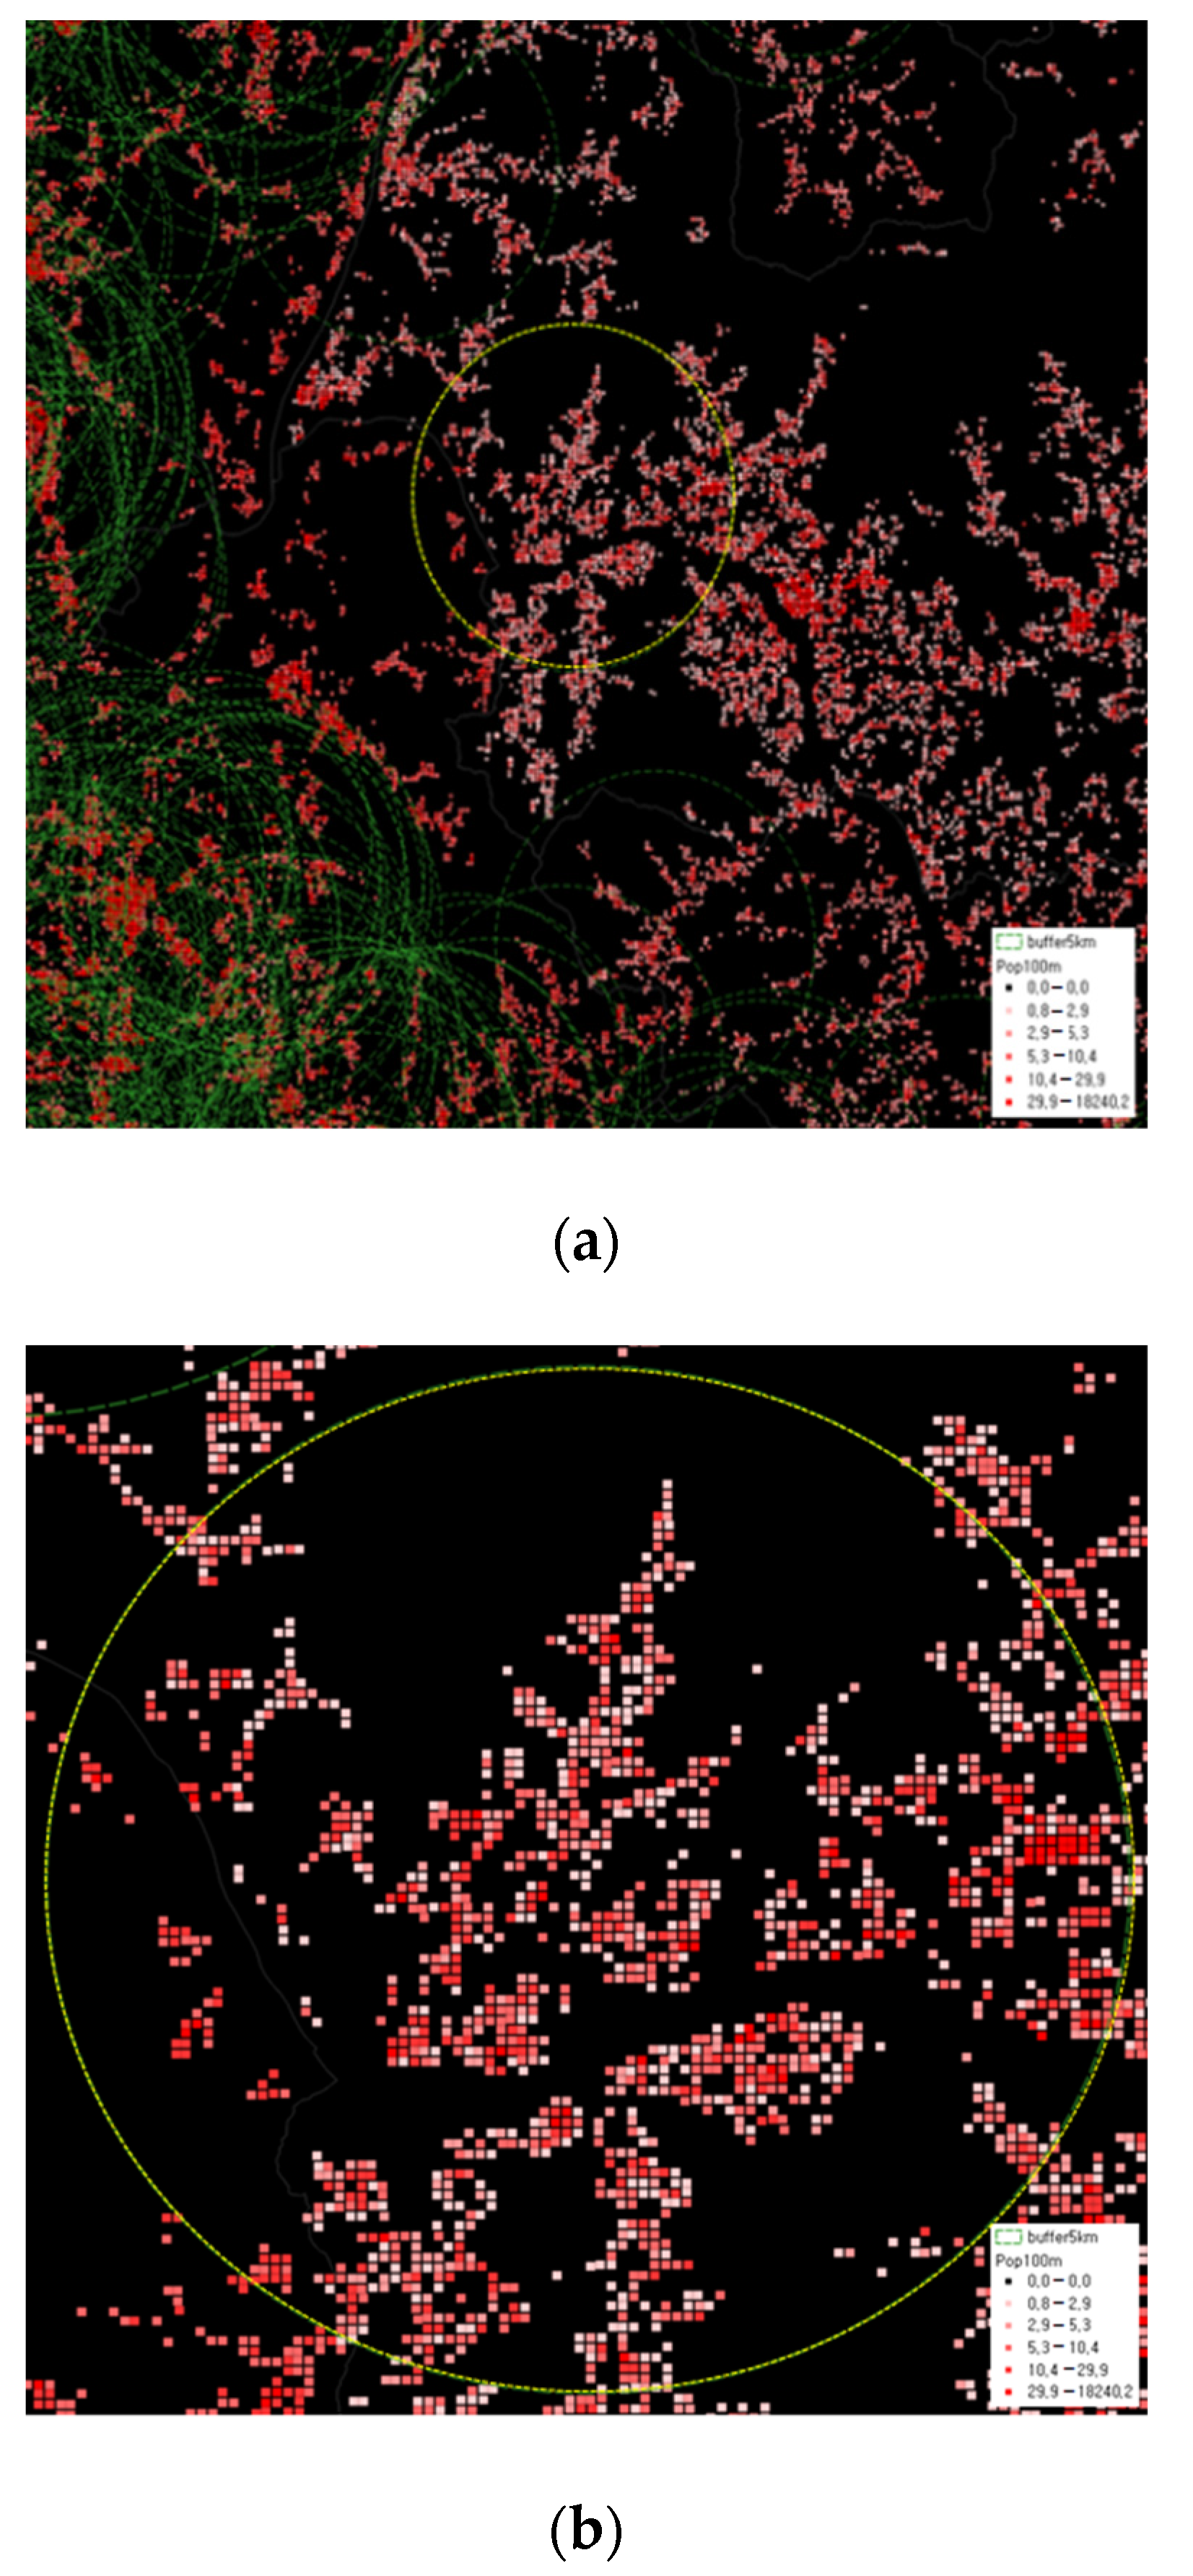
Figure 2a represents the distribution of population within the 5 km radius of each junk shop, which we assumed as the typical service area based on a number of interviews with junk shop owners and elderly waste pickers. In order to examine the relationship between the spatial distribution of junk shops and population distribution, we imported a point dataset aggregating the size of population within every cell of a 100 m grid. Each grid cell was then differentiated by color saturation in order to represent the cell’s population density, and in
Figure 2, the saturation levels of each grid cell correspond to the quartile ranges of the population. We then calculated the total population within each junk shop’s 5 km buffer area in order to study the characteristics of the population living within the junk shop’s service area.
Despite the fact that an estimated 80% of Korea’s population lives within cities and their urban peripheries, the 5 km buffers around each documented junk shop did not cover the country’s entire population. When looking at the distribution of the total population and the elderly population served by each junk shop, both figures skewed heavily toward the right due to junk shops’ tendency to concentrate in densely populated areas. Overall, most shops were located within smaller communities of 50,000–500,000 residents, but a few significant outliers, including a few junk shops whose buffer areas contained up to 2 million residents, accounted for the skew toward the right.
3.2. Multiple Regression Analysis
In addition to measures of population distribution, we also included other variables that may predict junk shop location, including measures of districts’ demographic characteristics, socioeconomic activity levels, waste and recycling patterns, community health, and land-use characteristics, all of which can be seen in
Table 1. We then categorized these 16 variables into five different groups and used regression analysis in order to investigate the relationship between these variables and the spatial pattern of junk shops across different districts. As a first step, we examined the variables by category in order to uncover possible collinearity and eliminate redundant variables from the model.
3.2.1. Group 1—Population
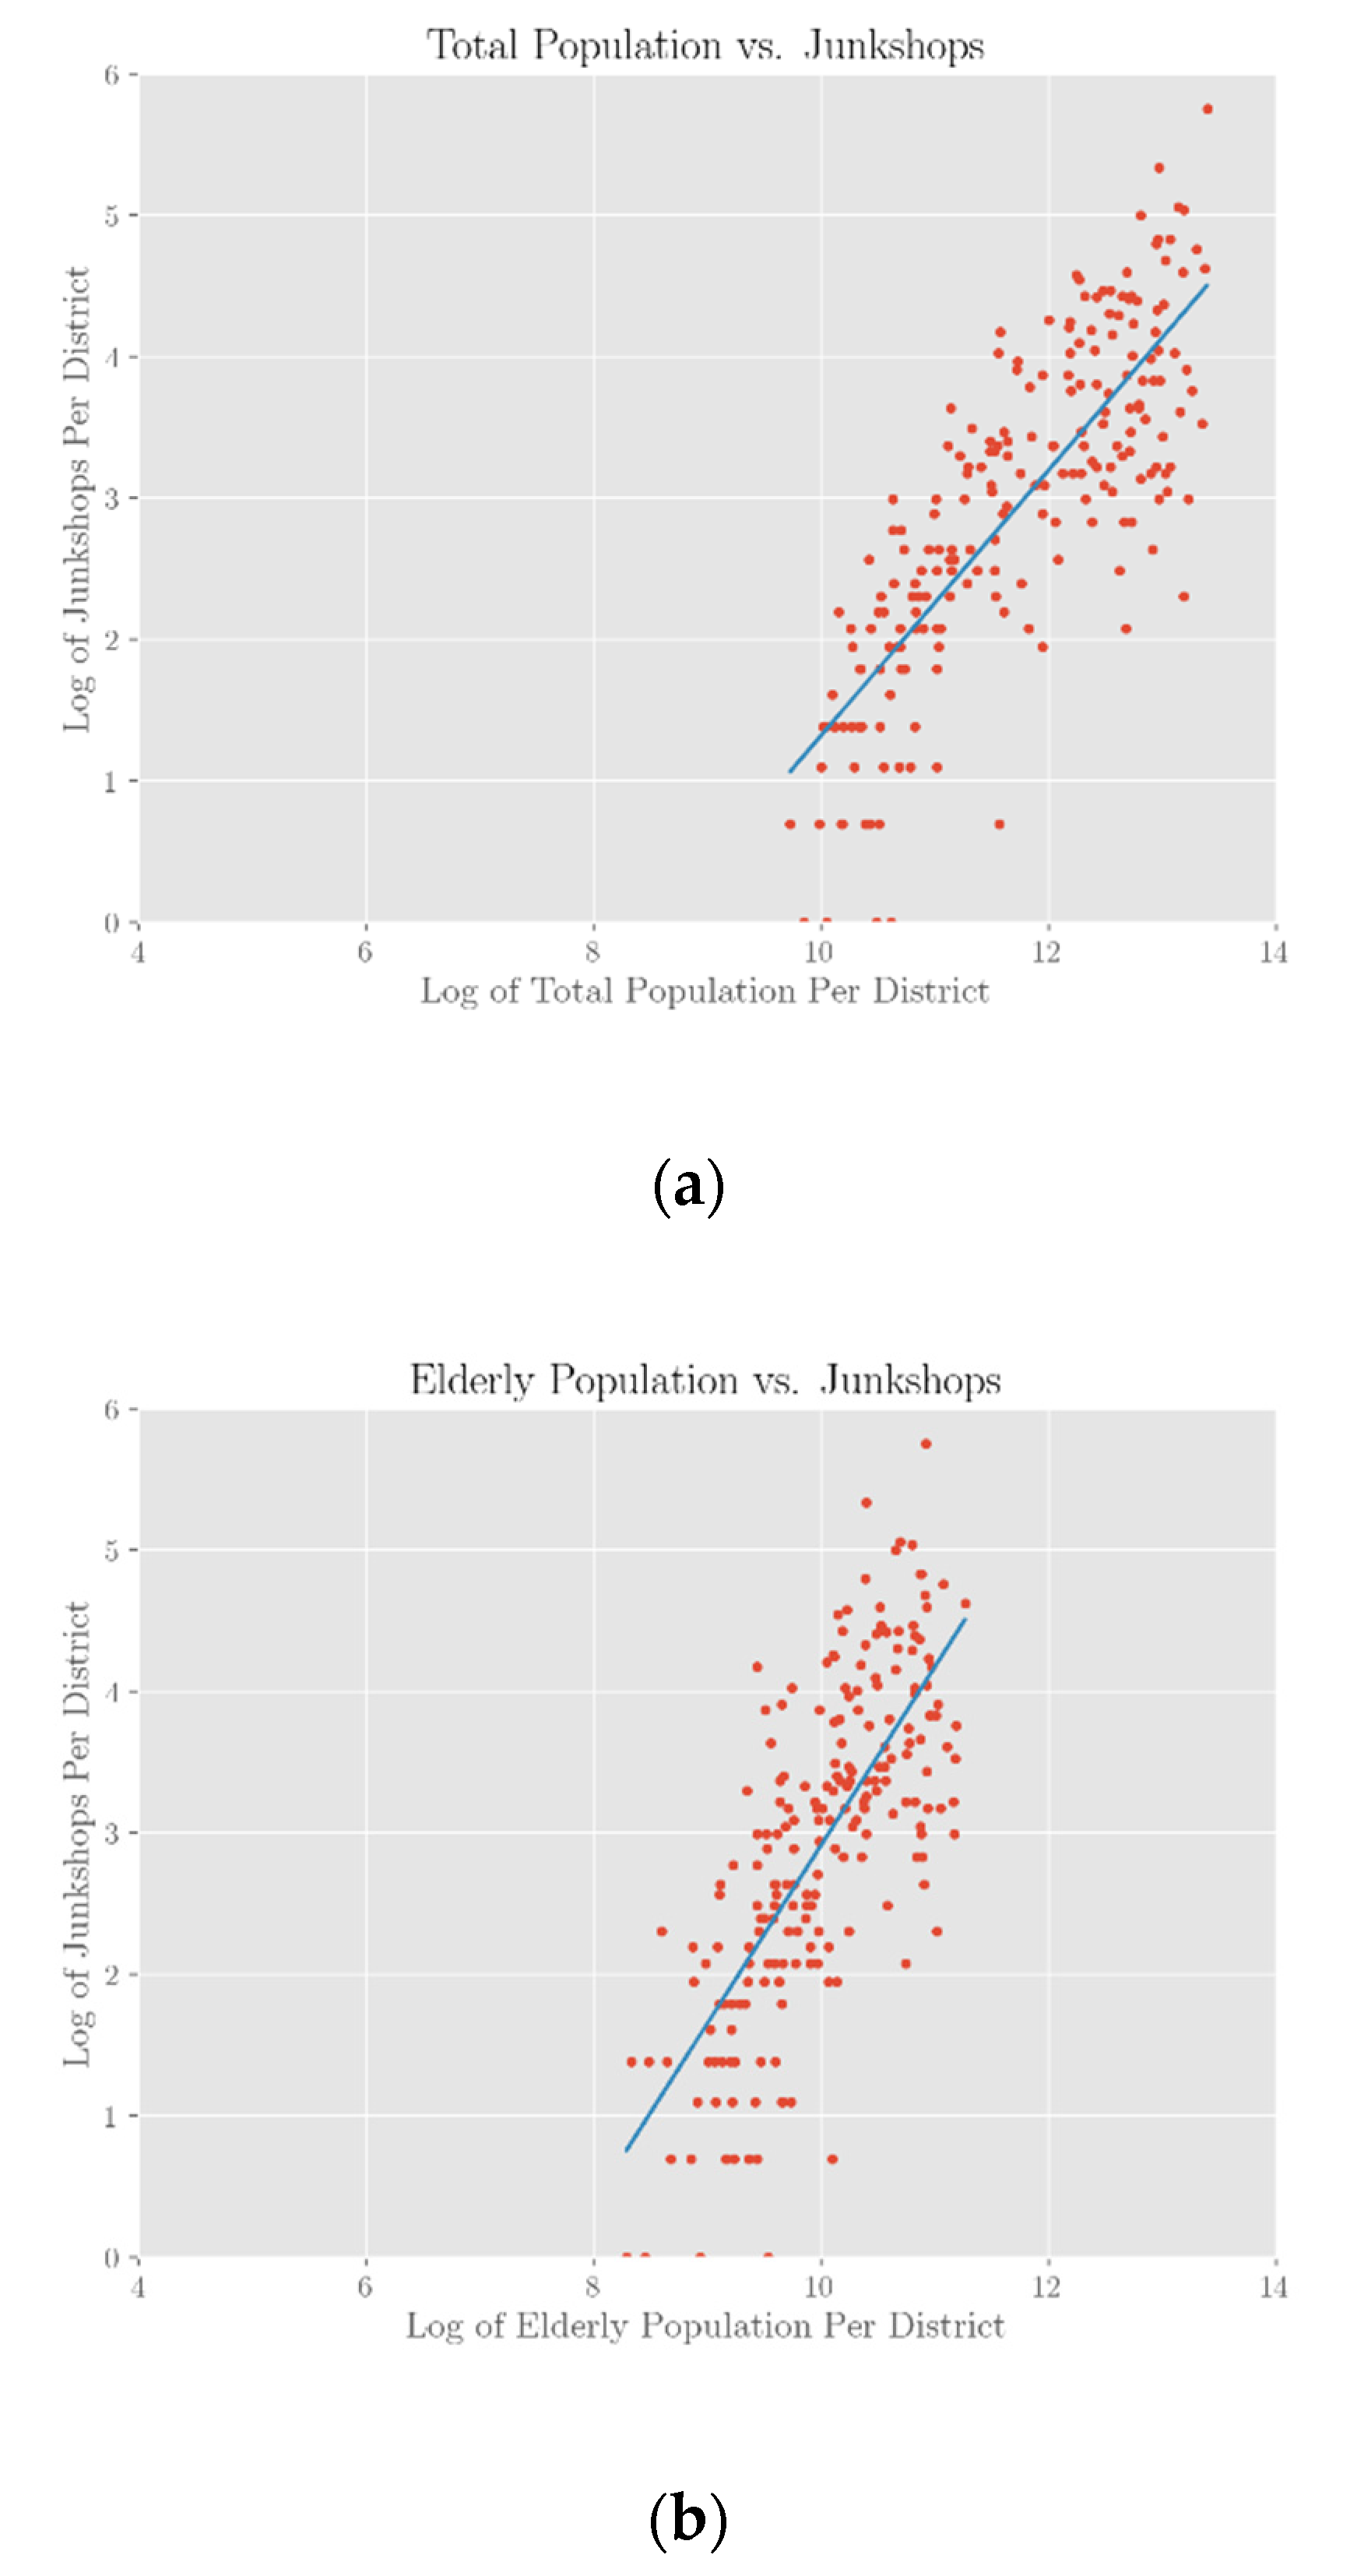
When looking at the relationship between junk shop prevalence and population patterns, the results reveal that population measures held strong explanatory power in predicting districts’ junk shop levels. This matches both previous studies and field interviews, where it was found that larger populations tended to produce higher levels of waste and recyclables, thereby increasing the demand for informal waste-pickers and junk shops. Unexpectedly, the models reveal that the size of a district’s total population was a stronger predictor of junk shop prevalence than a district’s elderly population. Though elderly population correlated strongly with junk shop presence, when controlling for the age variable, the graphs in
Figure 3 reveal that a district’s average age and junk shop number actually held a negative correlation.
This goes against a previously held hypothesis, where it was expected that the higher the proportion of elderly people, the greater the likelihood for more junk shops in a district. As the informal waste and recycling sector is often supported by low-income elderly individuals who often work near their residence, it was predicted that districts with higher proportions of elderly individuals would also have higher levels of junk shops. However, these results provide evidence that perhaps the driving factor for junk shops’ existence is not the existence of a larger possible workforce, but the existence of a population that is likely to create more trash for the system.
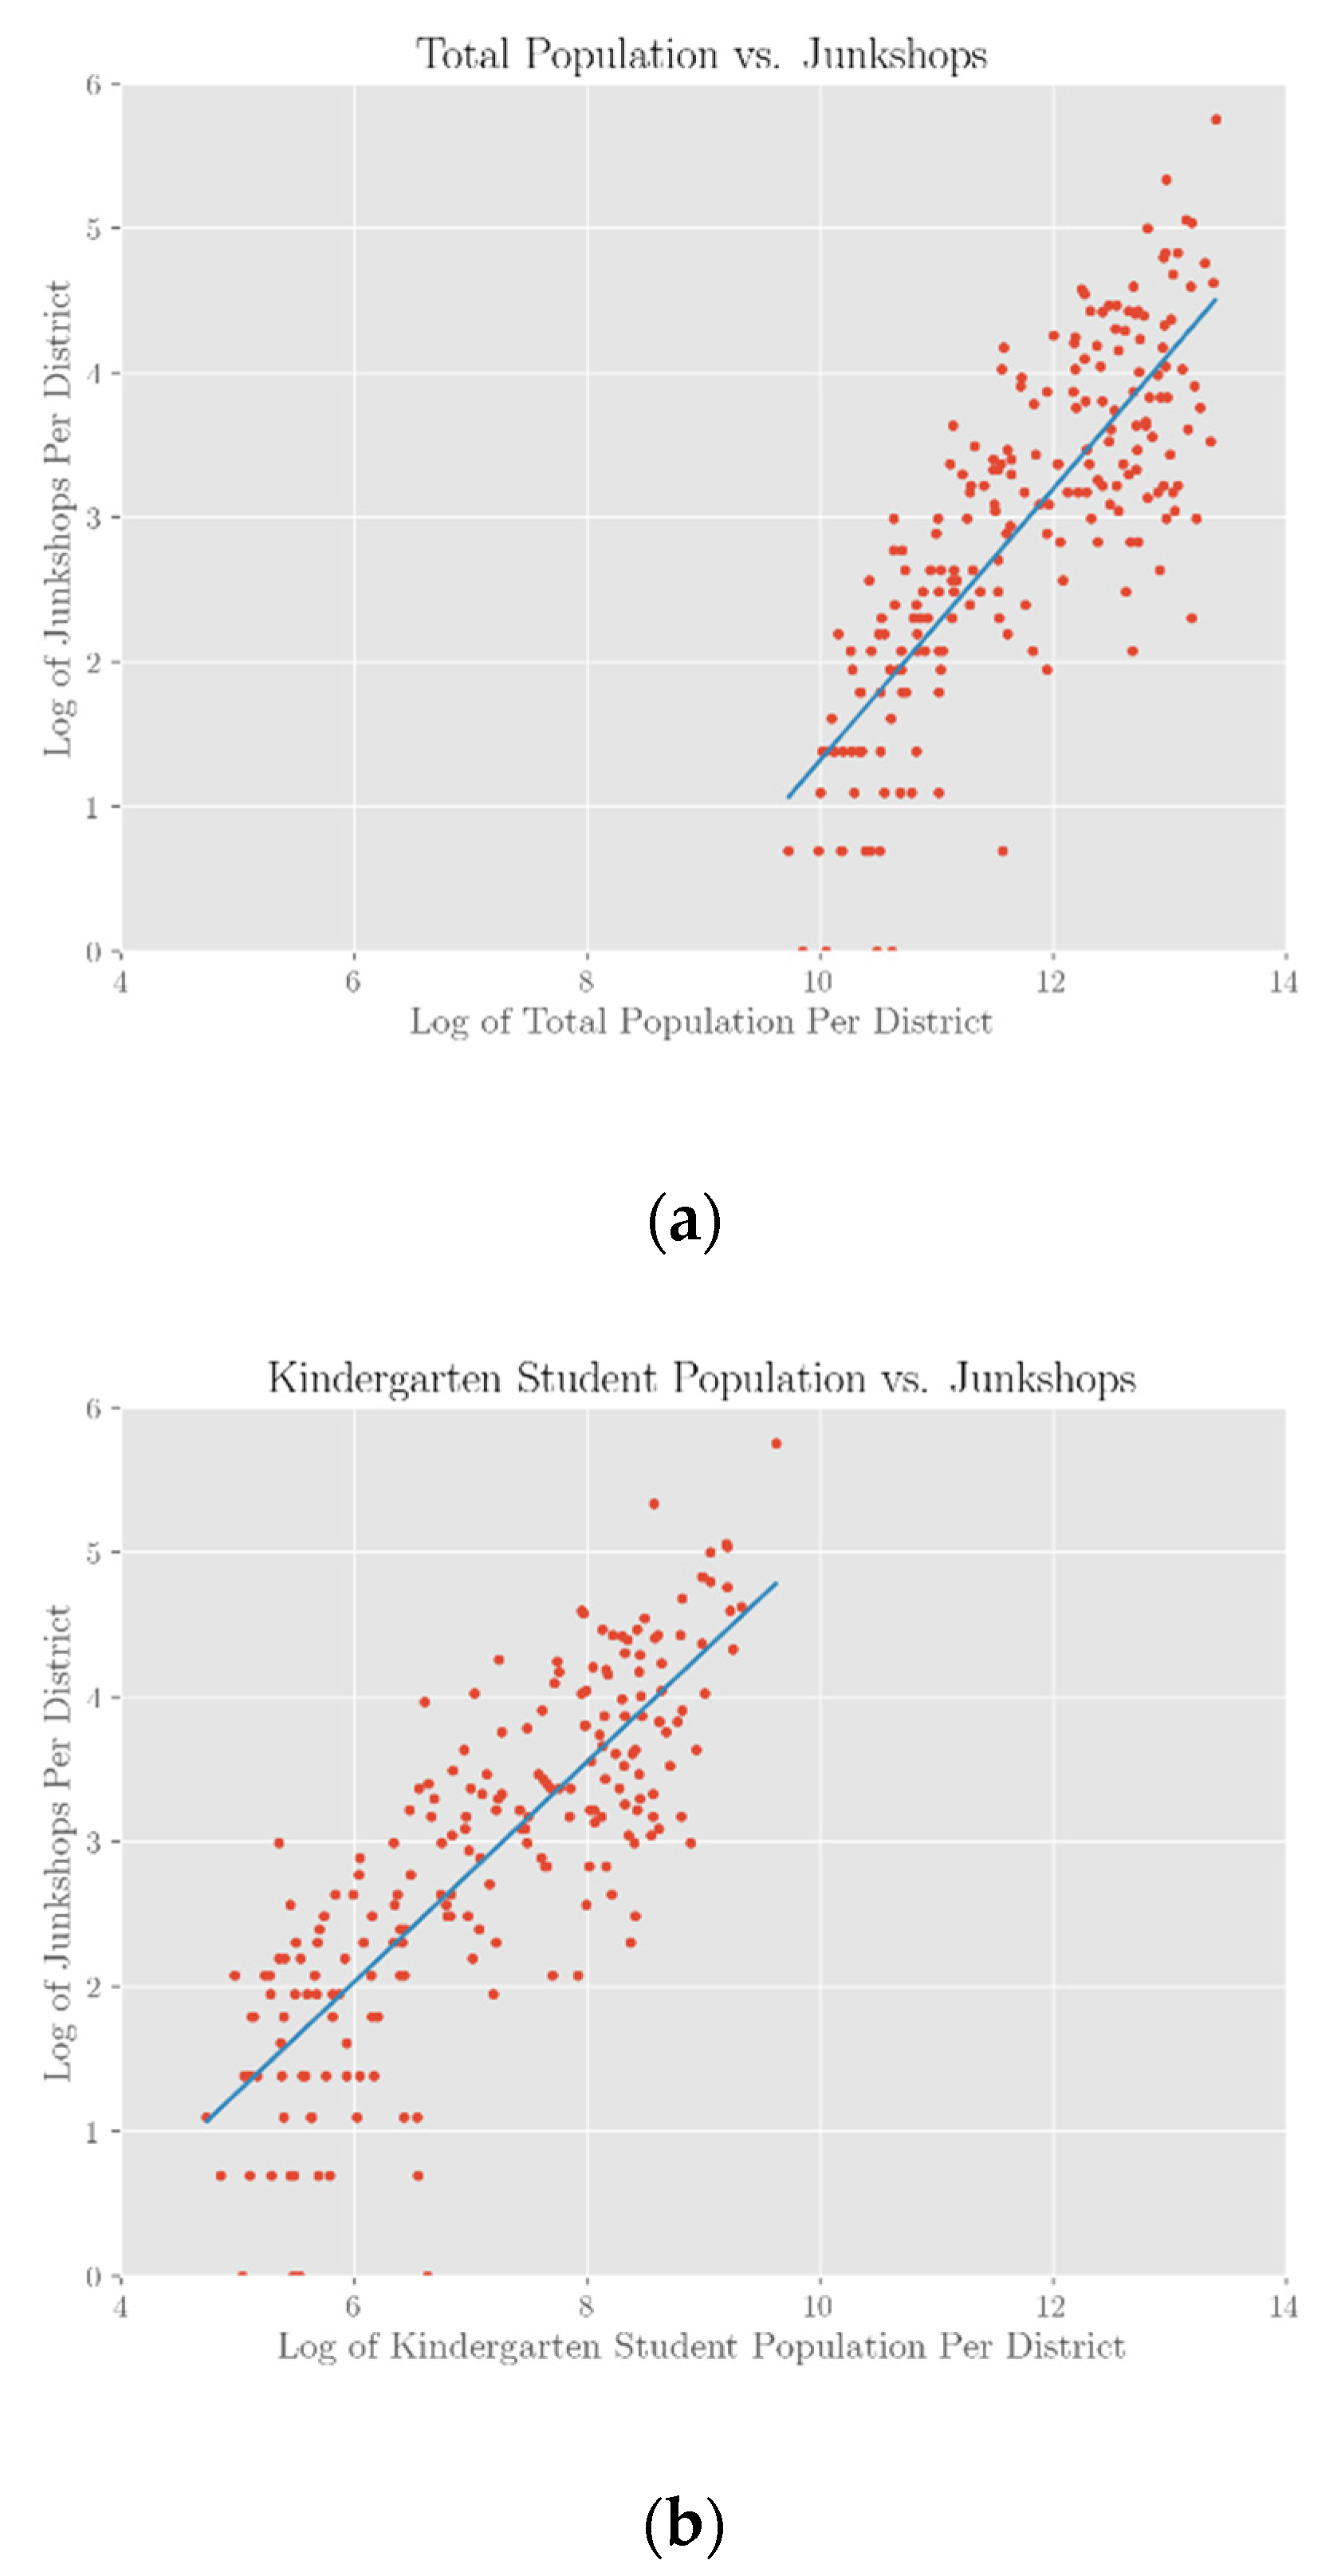
When looking more closely at the relationship between age demographics and junk shop prevalence, not only were higher proportions of younger individuals associated with higher numbers of junk shops, but higher numbers of kindergarten and elementary school students had an additionally strong effect on junk shop presence. Based on these results shown in
Figure 4, there is a possibility for an existing relationship between the number of families with children and the number of junk shops in a given district. Between the elementary school student and kindergarten student population variables, the number of kindergarten students held a stronger relationship with junk shop prevalence. As there is no concrete evidence that younger populations generate more trash than older populations, future studies could examine the differential waste-producing patterns of different demographics, and how they in turn affect the demand for junk shop services. Other studies in the past have shown that older individuals had lower rates of recycling, due to perhaps lower consumption patterns, though the evidence was not conclusive [
15,
16].
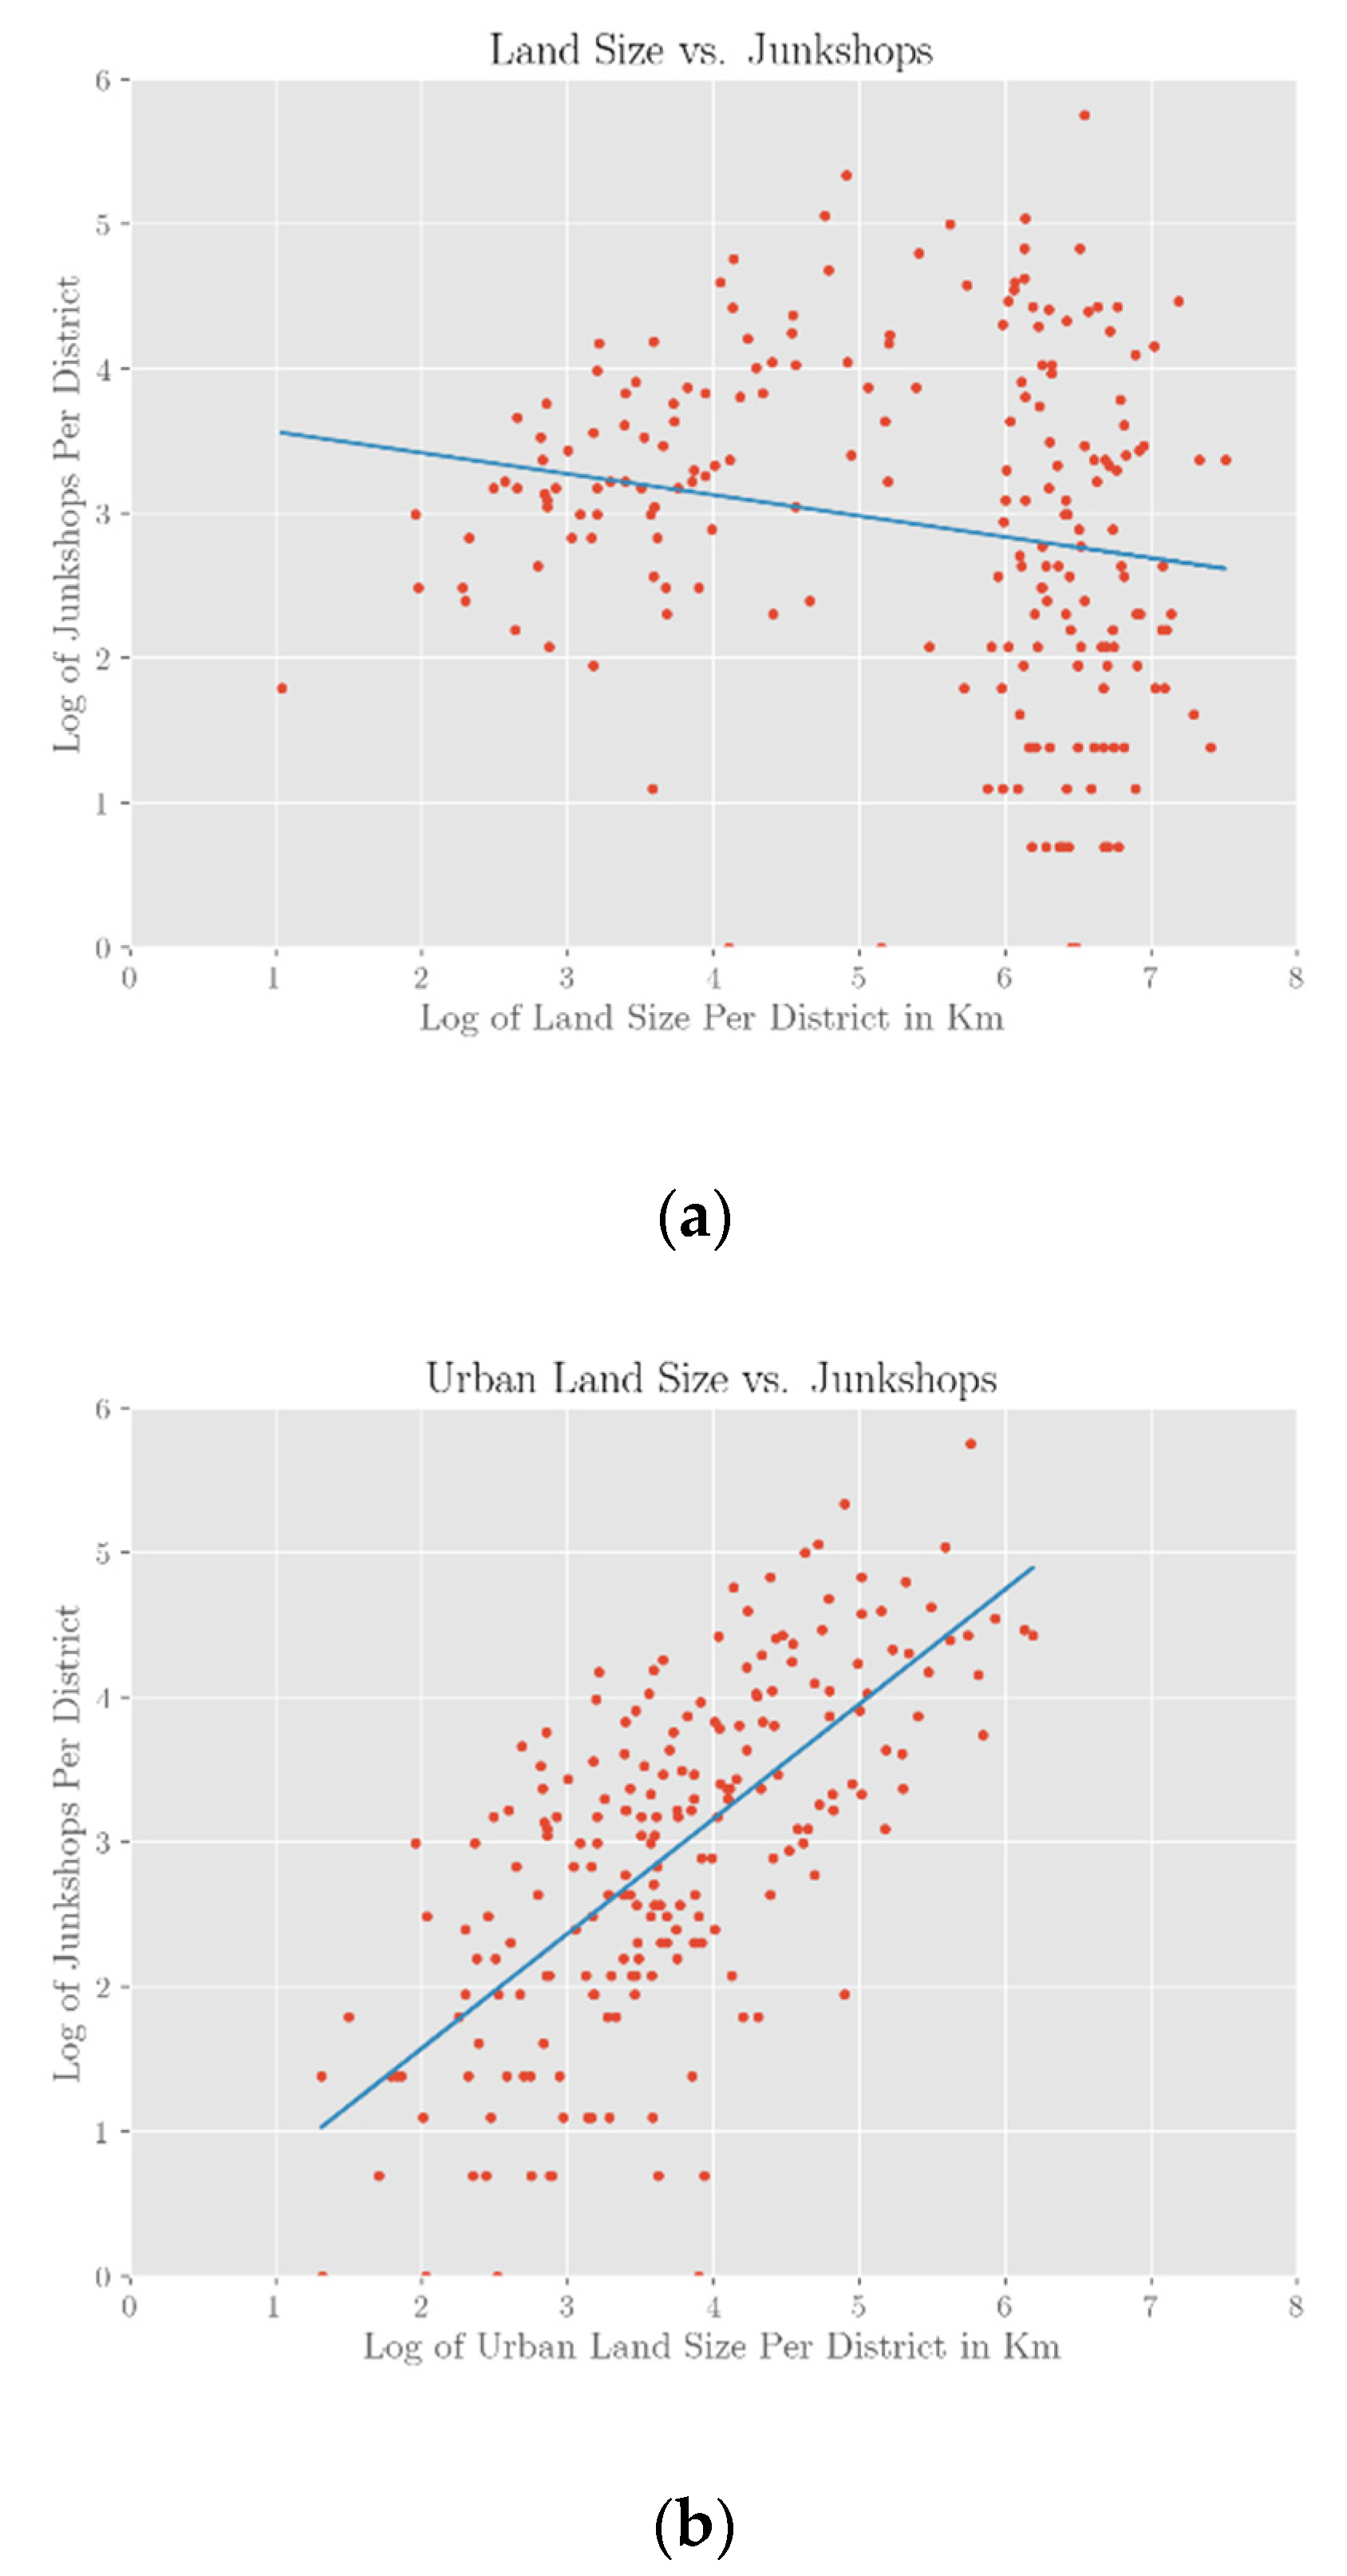
3.2.2. Group 2—Land Characteristics
Among the land variables, urban land size correlated the most strongly with the number of junk shops in any given district (see
Figure 5). This may be due to more highly urbanized districts having higher levels of population, which would in turn create the levels of waste and recycling that would create more business for more junk shops. Even when controlling for total population, urban land size continued to have a positive and significant relationship with a district’s number of junk shops, indicating that a district’s urbanization, regardless of its population level, had a positive relationship on junk shop prevalence.
The variable for land size held a positive relationship with the number of junk shops up until a certain point, after which an increase in a district’s land size did not result in an increase in junk shops. This can be attributed to the wide variety of geographic regions that are typified as districts under the Korean government’s classification system. The districts with the smallest land size, oftentimes the more urban districts of metropolitan areas with high levels of human activity, usually contain enough waste and recycling activity in order to support a larger number of junk shops. However, the districts with the largest land areas often include highly rural districts with lower population density, which tend to contain lower numbers of junk shops due to the lack of human demand for waste-processing.
When looking at the relationship between junk shop prevalence and housing capacity, there was some evidence for a relationship between higher housing capacity and higher junk shop presence. However, this relationship was quite weak, as the variable for housing capacity excludes apartments, which are often located in dense metropolitan areas where greater waste generation and recycling happens [
17].
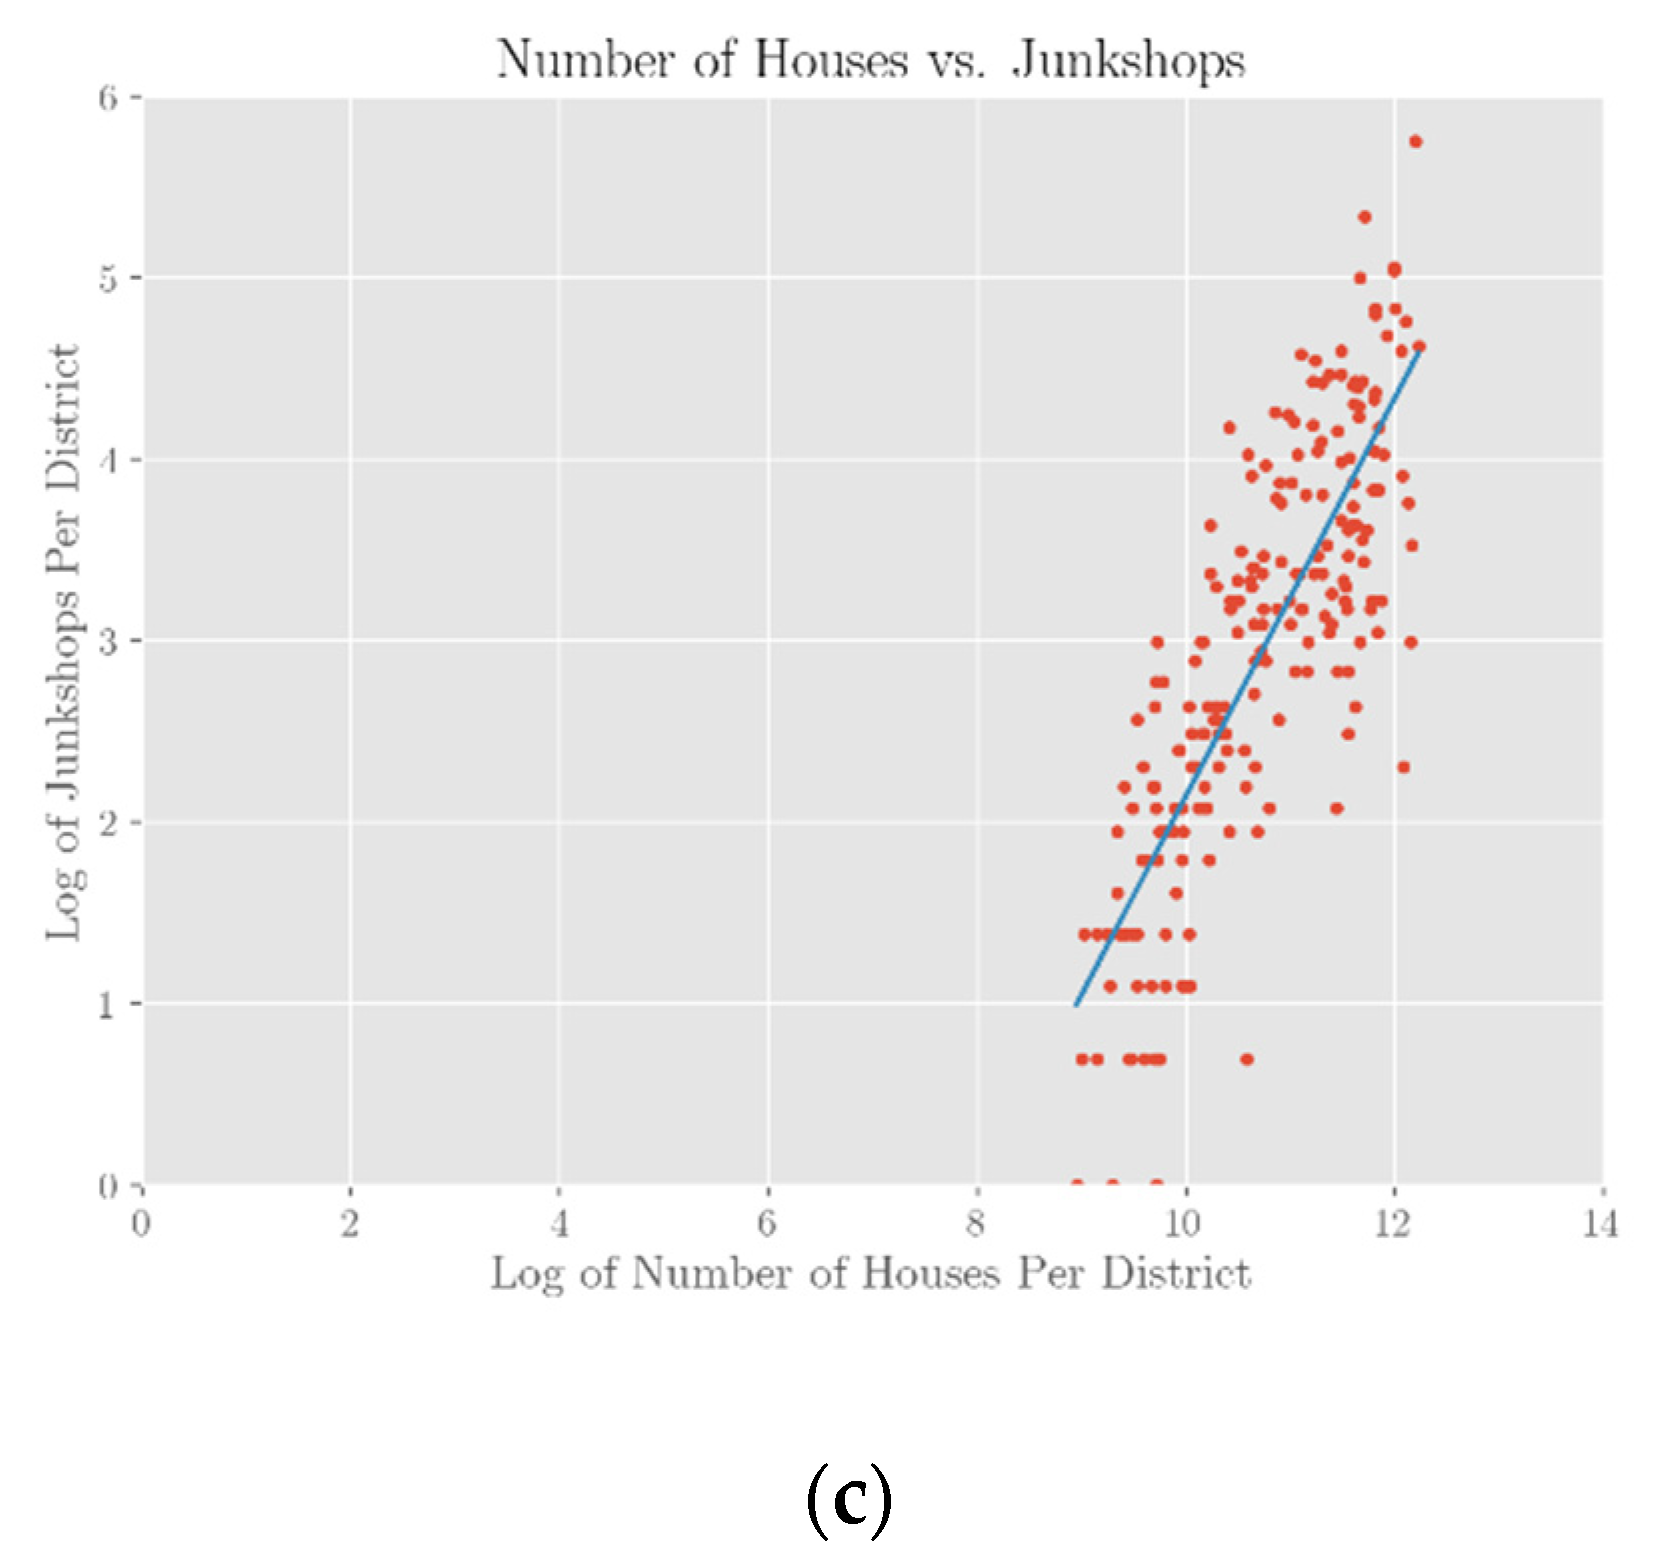
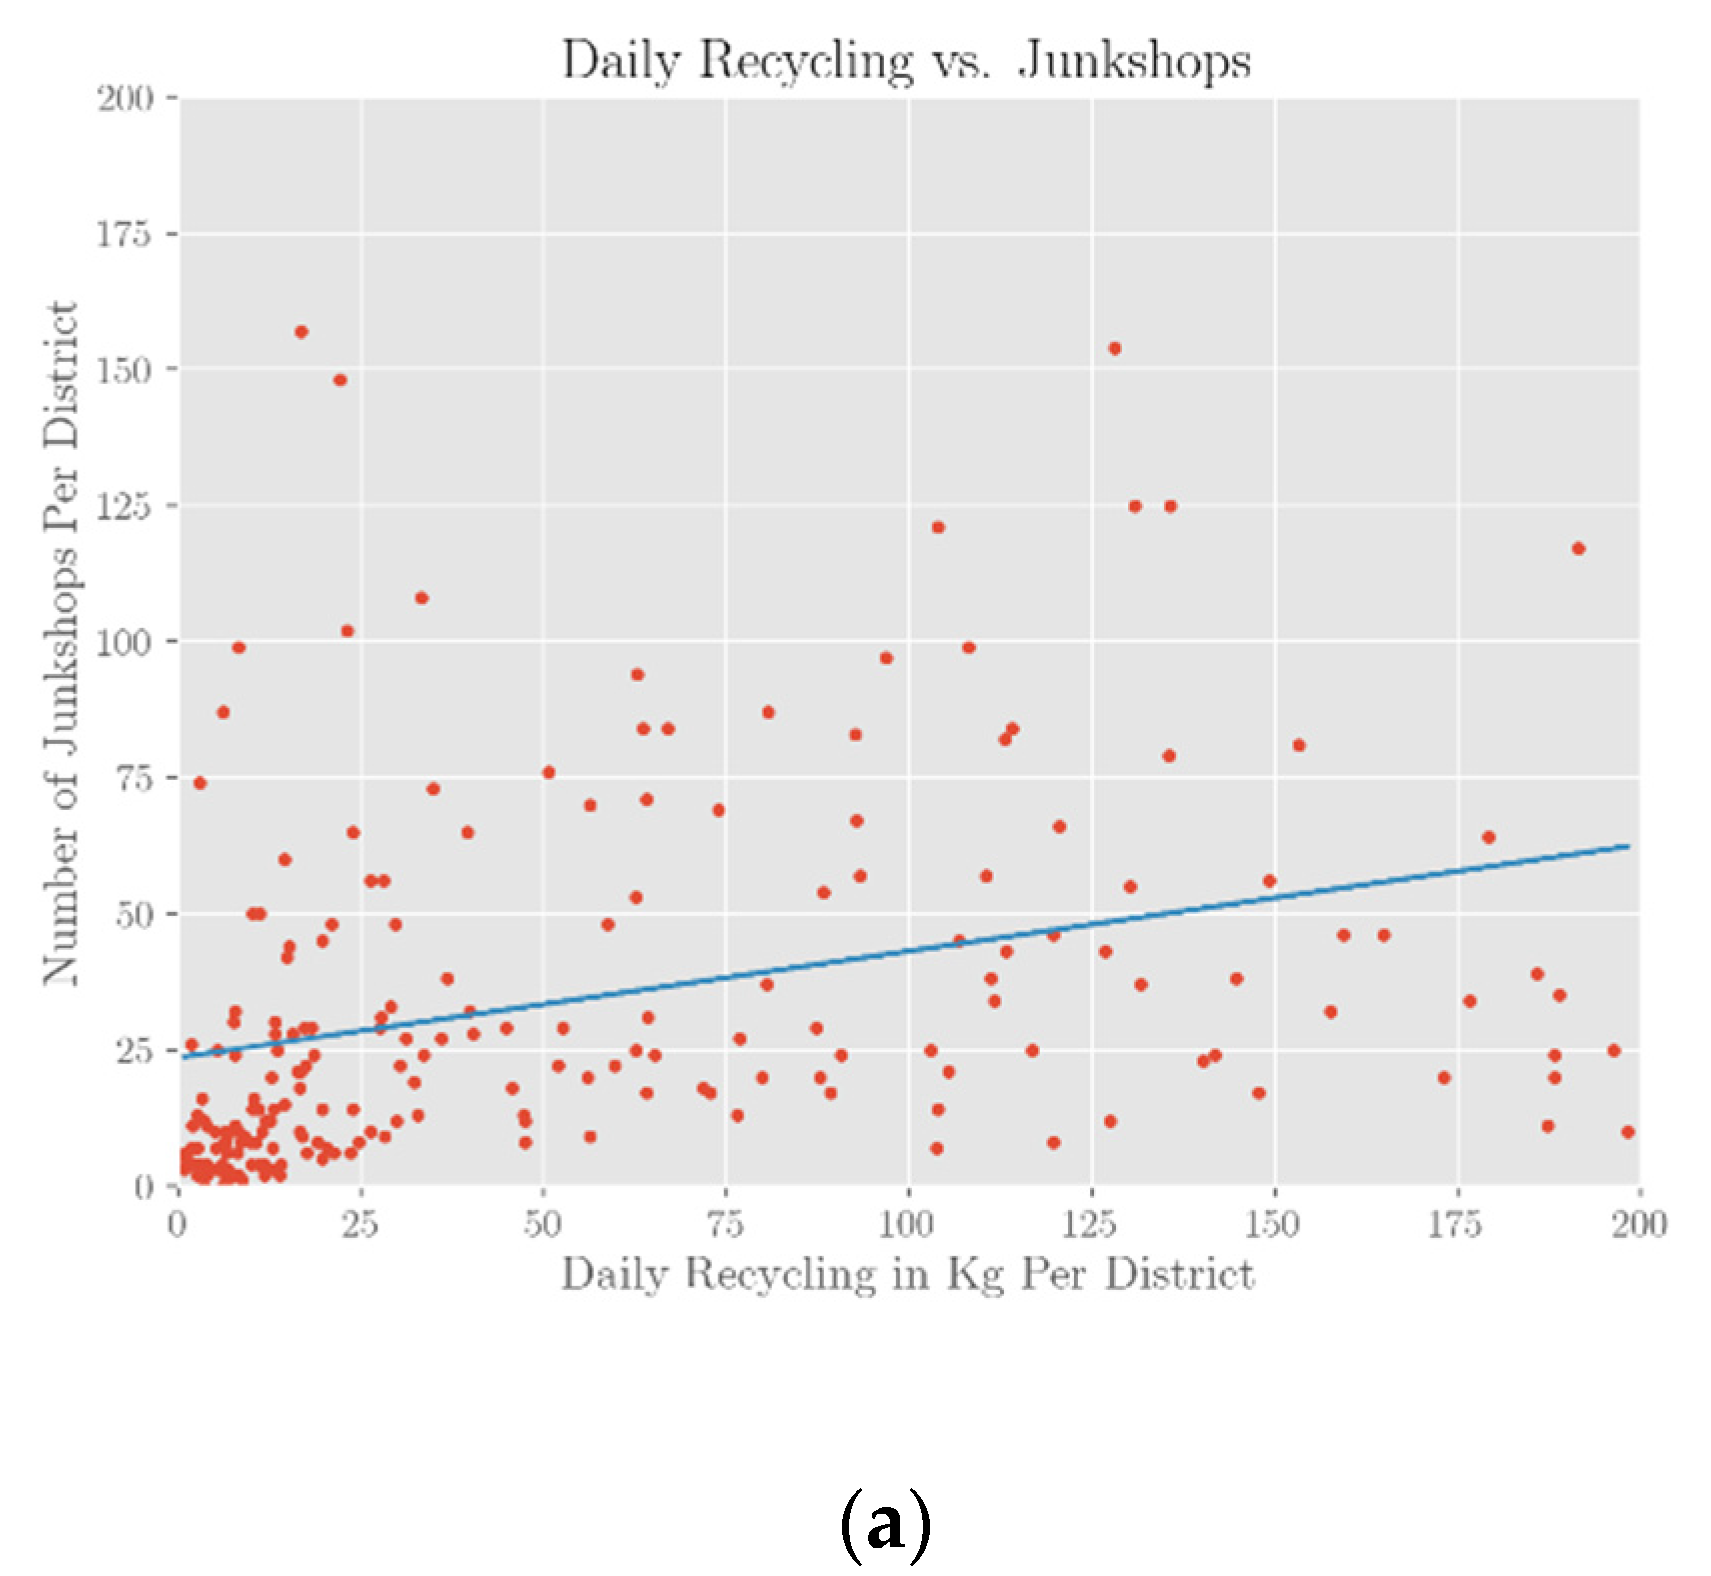
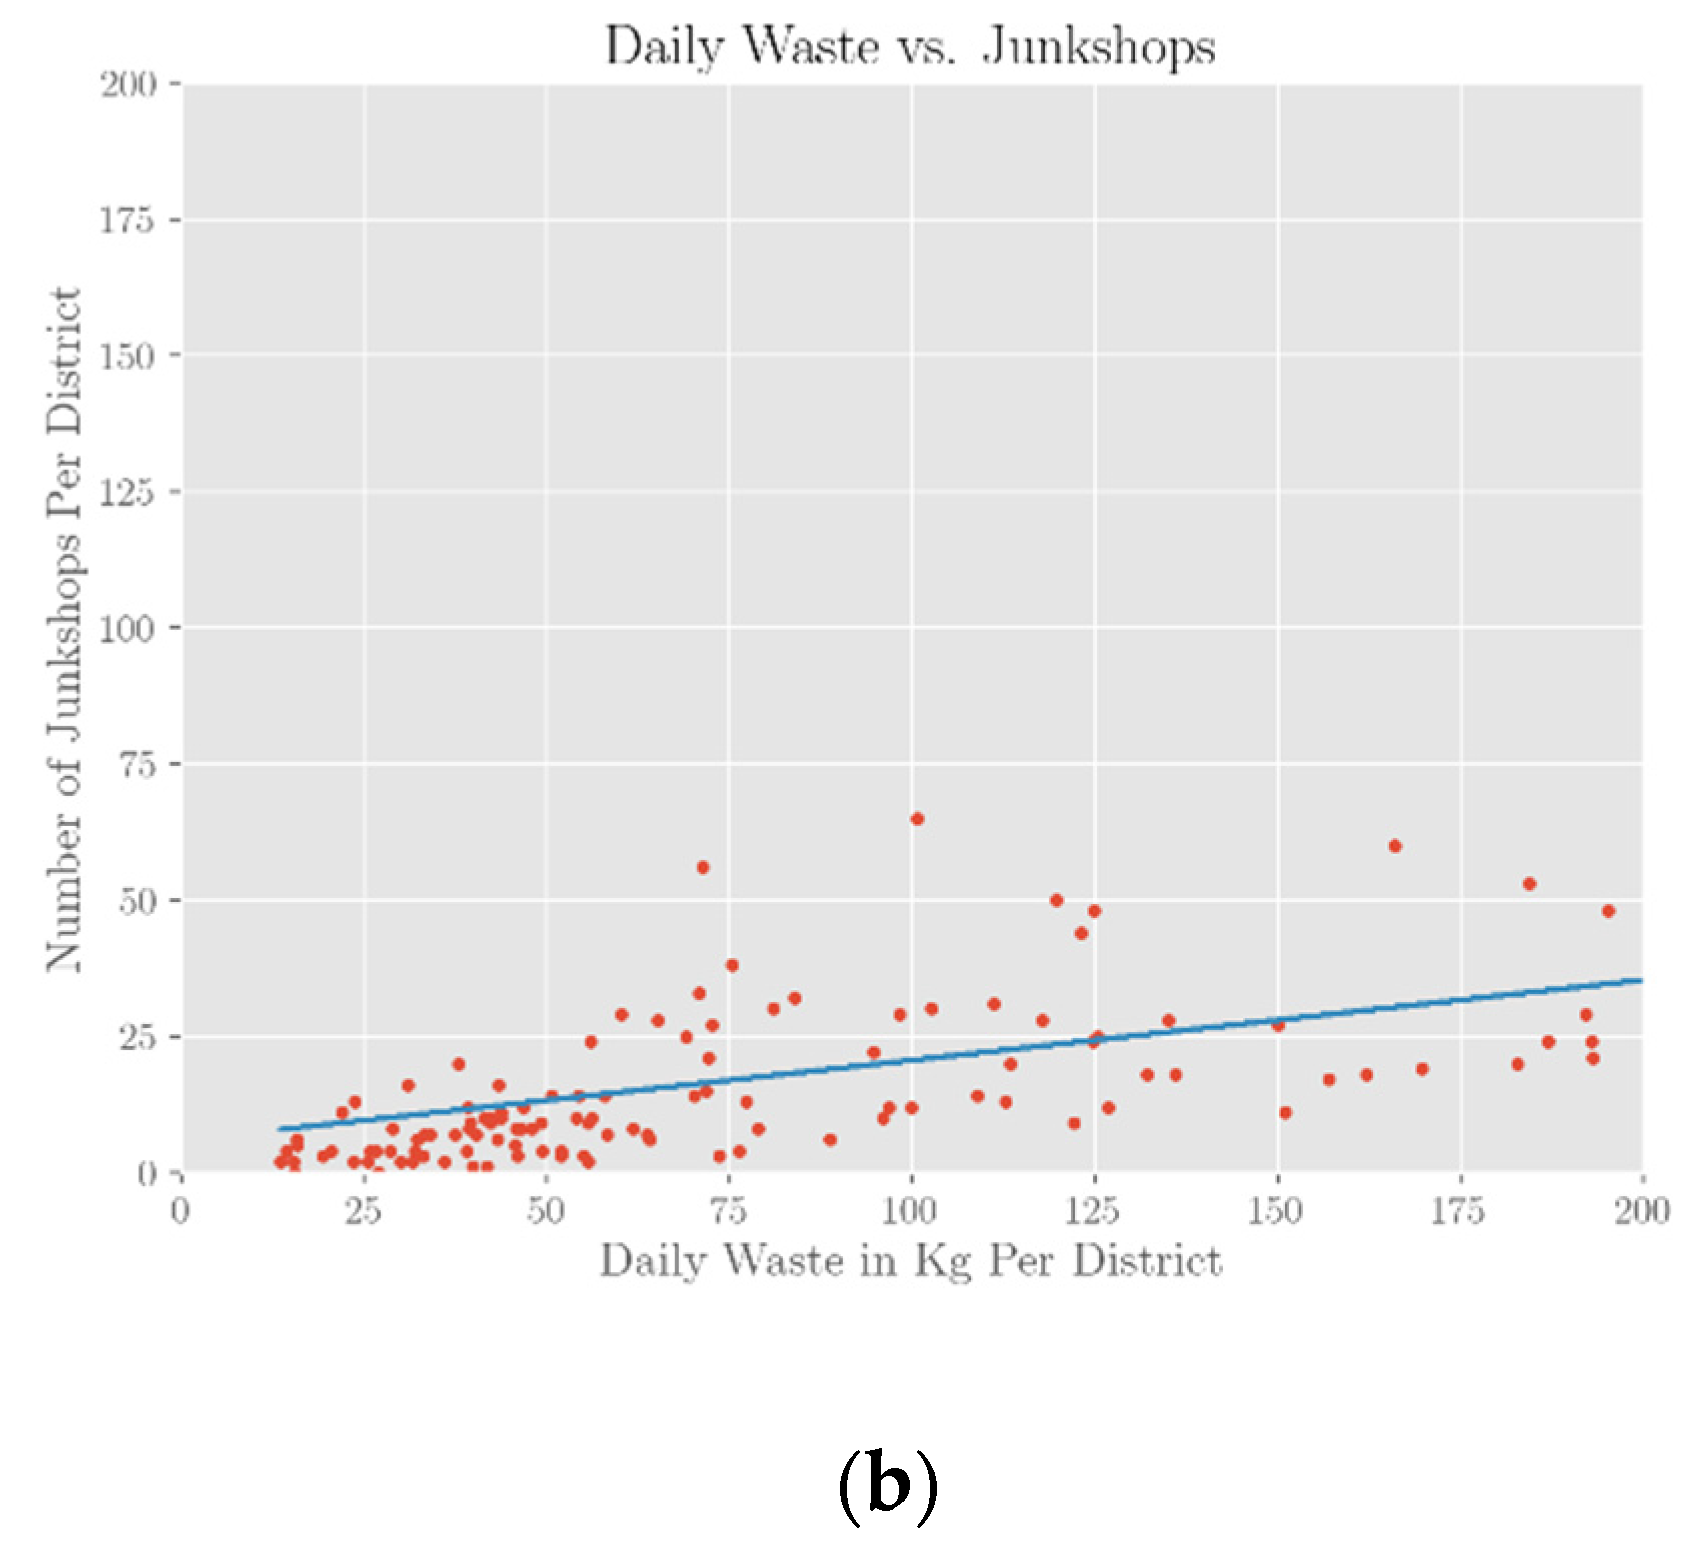
3.2.3. Group 3—Waste & Recycling Level Patterns
Daily recycling levels and daily waste generation levels are measured in units of kilograms per day and are measured by upper-level administrative districts as opposed to by local districts. When looking at the relationship between districts’ daily recycling and waste levels and the presence of junk shops, both the recycling and waste levels held somewhat weak relationships with junk shop prevalence, with daily waste level correlating more strongly with junk shop presence (see
Figure 6). Though it was expected that the variables for daily recycling and waste levels would be important predictors junk shop presence, these results are not completely surprising due to the overall difficulty in gathering accurate information about waste and recycling levels at the local district level [
18].
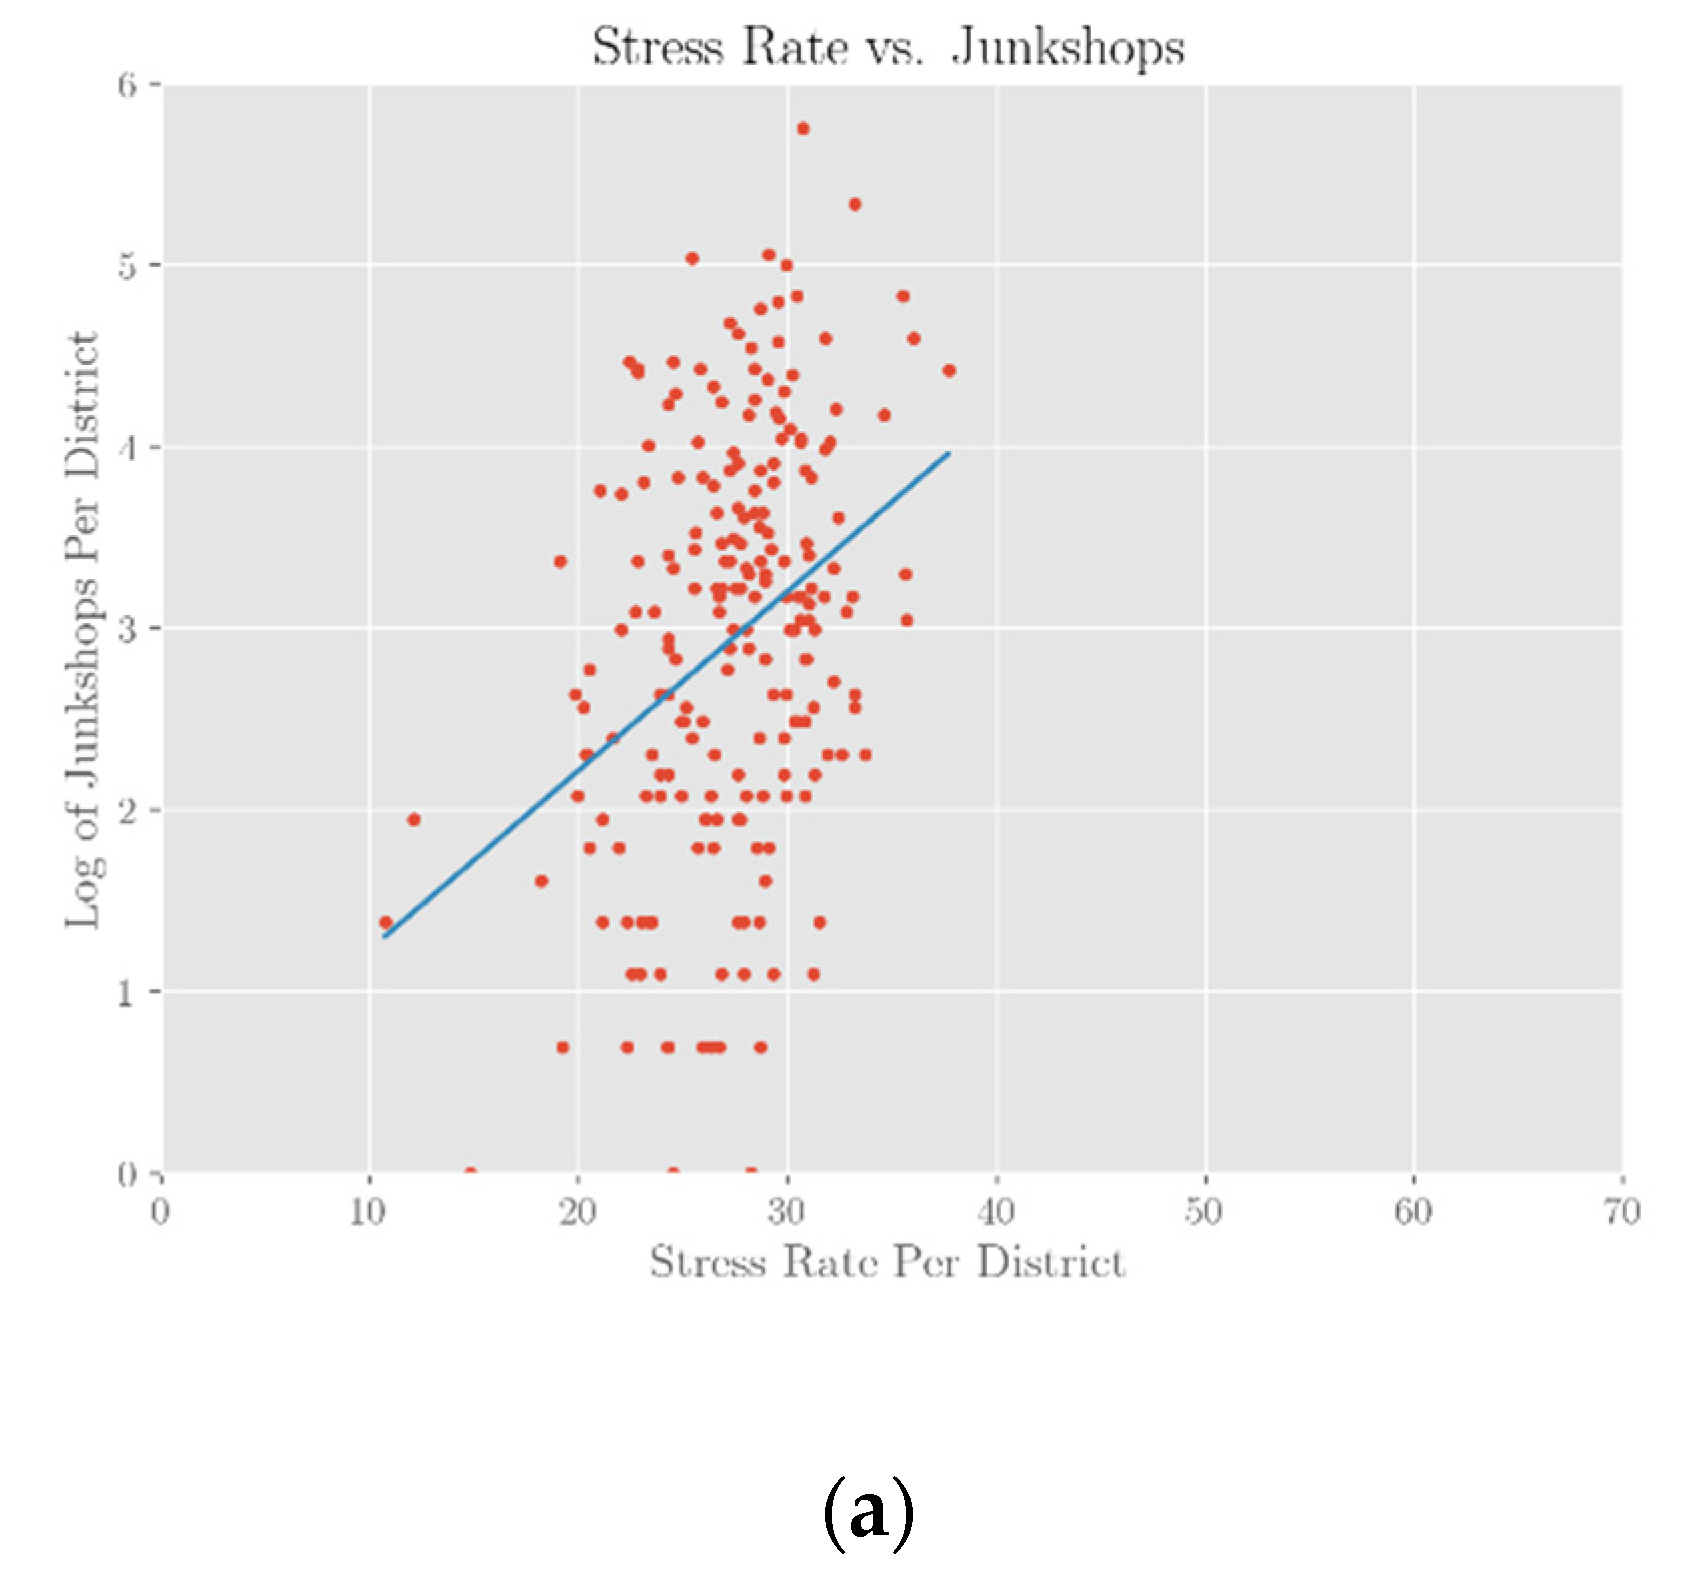
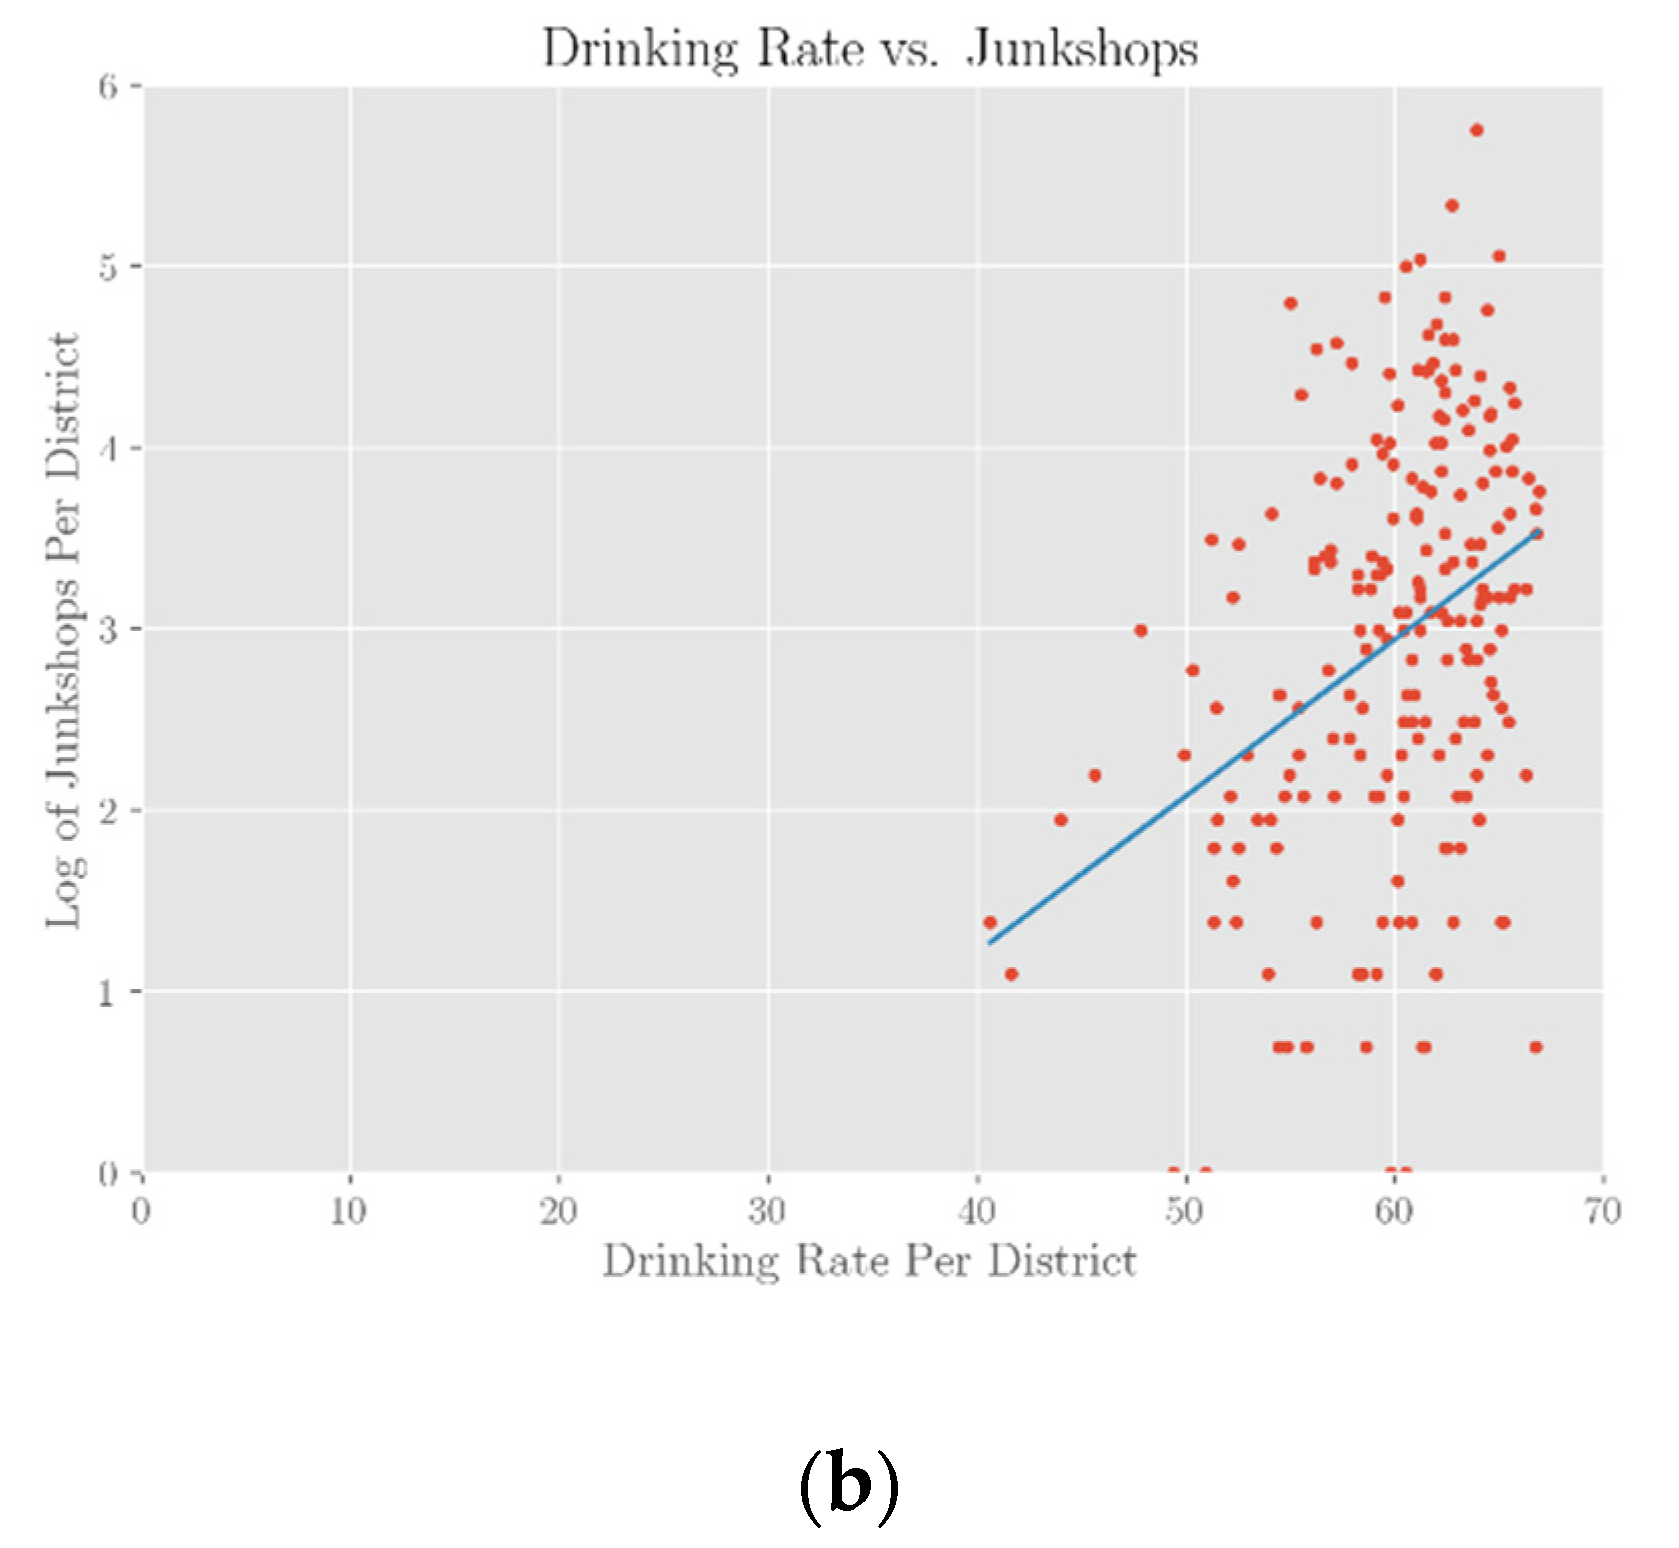
3.2.4. Group 4—Health Indicators
Due to the association between higher junk shop presence and more socially vulnerable neighborhoods, we included data on four health-related variables at the district level, which were measured through surveys administered by the national government and local district offices. The average district measures for stress rate, obesity rate, smoking rate, and drinking rate were measured in terms of population percentage, and of the four variables, only the stress rate and the drinking rate held any evidence of relationship with a district’s number of junk shops (see
Figure 7). However, the effects of these two variables disappeared once controlling for a district’s urban land level, indicating that these variables were perhaps only proxies for a district’s level of urbanization.
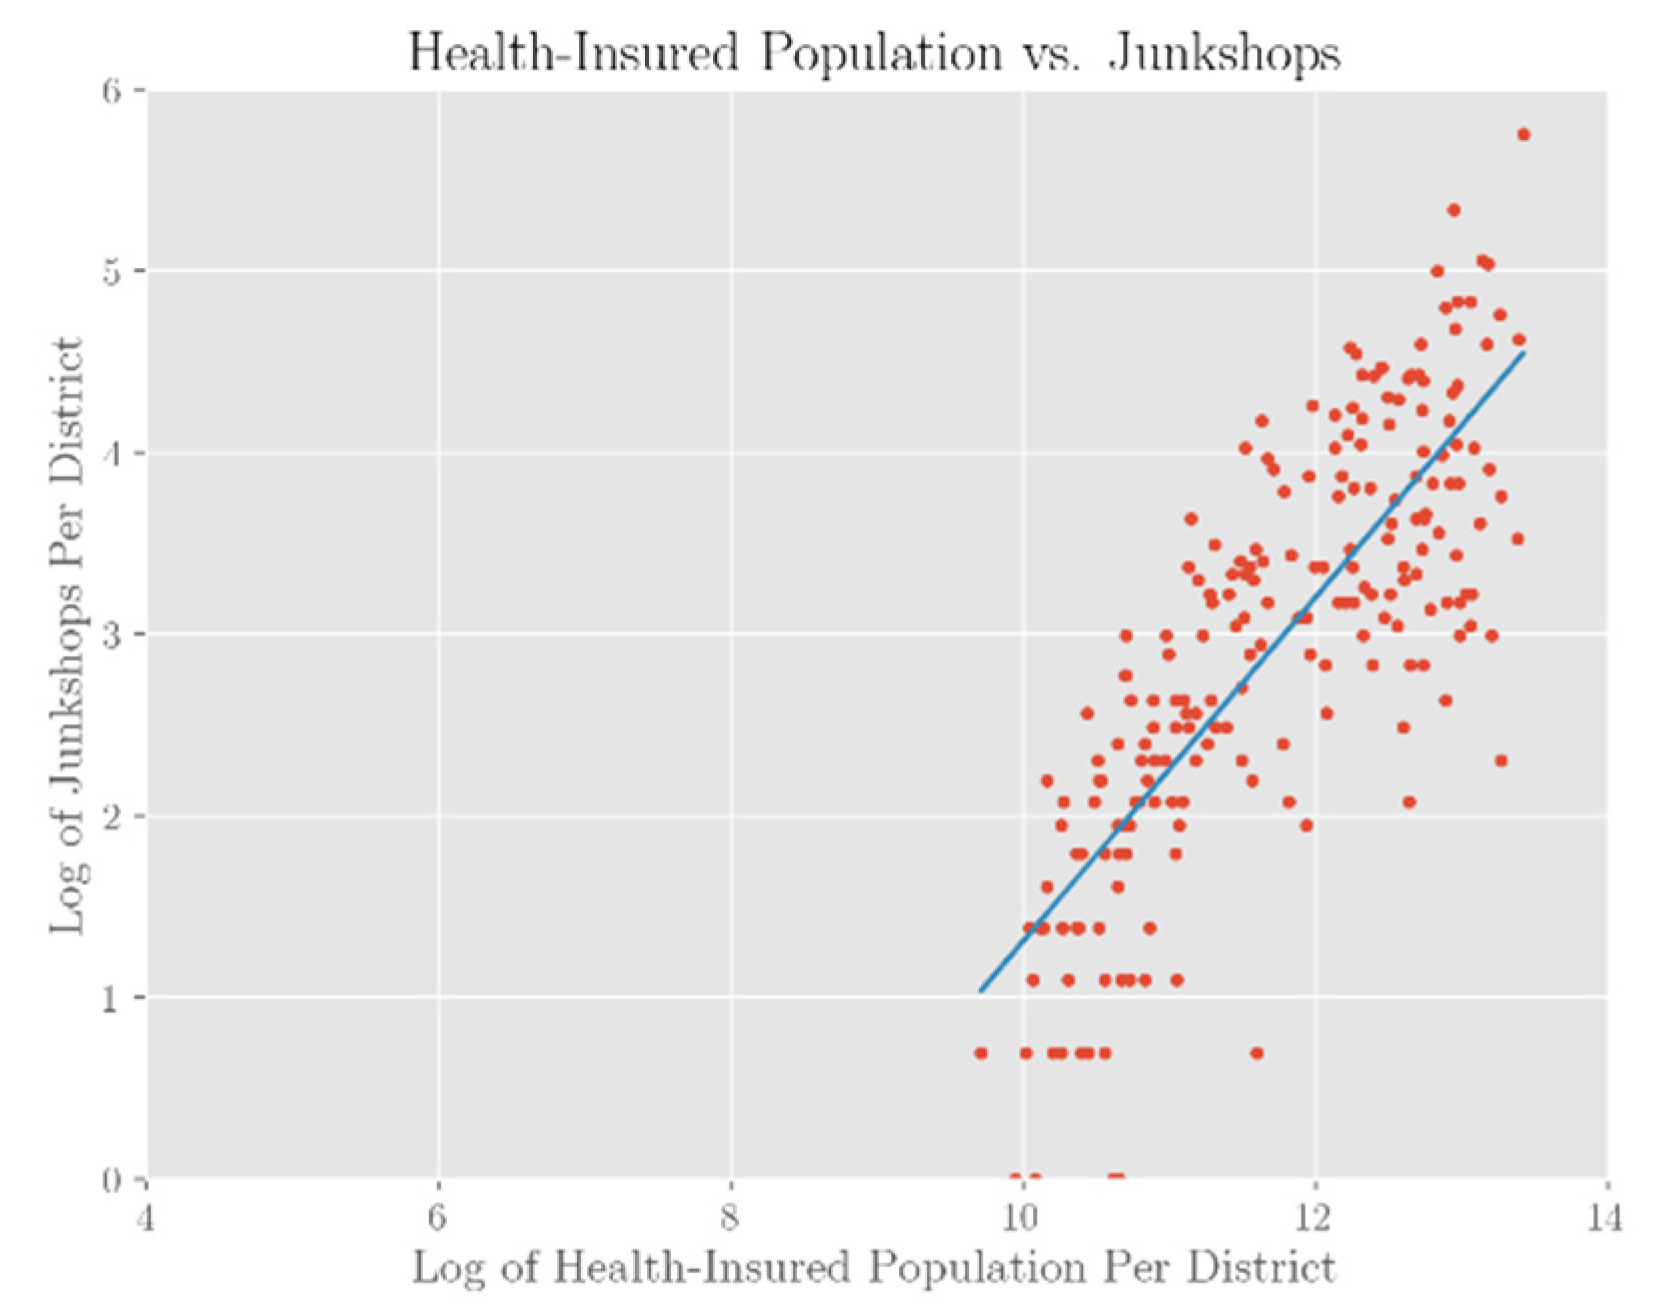
3.2.5. Group 5—Social Welfare Measure
Along with variables for health, we also included a variable to measure the average economic welfare of districts, as previous studies had shown links between more economically vulnerable populations and higher junk shop presence. The percentage of health insured-population represents one measure of economic health, as health insurance is the minimum welfare provided by the state. The results revealed a positive relationship between a health-insured population and junk shop presence, indicating that districts with higher economic health were more likely to contain junk shops (see
Figure 8). This evidence aligns with results from previous studies, which also show that higher income was linked to greater recycling rates due to factors such as higher consumption, higher education related to recycling, and differential attitudes towards environmentalism [
15,
19].
3.2.6. Final Model Results
The final regression model for predicting the number of junk shops in any given area was created after eliminating variables with high collinearity or weak significance in a series of rounds (see
Table 2.) For population-related variables, due to the high collinearity between the total and elderly population variables, elderly population was dropped, along with the variables for the number of kindergartens, elementary schools, and elementary school students in a district. Amongst the land-related variables, the total land size and land transaction variables were both dropped due to their overall weak relationship with junk shop prevalence, along with the housing variable, as the variable for urban land size captured most of the housing variable’s effect. Despite their weak relationship with junk shop prevalence, both the waste and recycling variables were kept, due to the large amount of qualitative literature and field studies that emphasize their importance as health indicators of the informal waste-processing industry. Amongst the health-related variables, the obesity rate and smoking rate variables were dropped due to their weak significance, while the drinking and stress rate variables were kept.
When the remaining variables were combined, they accounted for 75.6 percent of the variance in the number of junk shops in any given district in Korea. The results of the model reveal that the total population and the health-insured population of a district held the strongest explanatory power for junk shop prevalence, along with the urban land size of the district. Additionally, the statistical significance of the kindergarten student variable disappeared with the inclusion of other variables, with some evidence suggesting that the urban land variable captured the kindergarten student variable’s effect due to the clustering of kindergarten students in the most highly urbanized districts. However, most notably, the results of the regression reveal an absence of strong correlation between levels daily waste generation and recycling and the number of junk shops in a given area. This discrepancy between the regression results and the information gathered from qualitative methods highlights the complexity of Korea’s informal recycling industry and the overall difficulty in gathering accurate data on its activities.
3.3. Spatial Analysis on a Local Scale
Aside from quantitative analysis performed at the district-level, a closer analysis of the spatial distribution of junk shops in highly urbanized districts reveals micro-patterns at the local scale.
Figure 9 represents the spatial distribution of junk shops mapped onto the building layer of Seoul, which reveals a more detailed layout of the city’s urban form, consisting of both individual building blocks and the city’s networks of roads. The building layer is differentiated by color saturation based each building’s height, spanning from first story (“white”) to skyscrapers (“red”). From this layer, it can be seen that junk shops were well distributed throughout the city, with most of the city’s major districts containing an above-average number of junk shops.
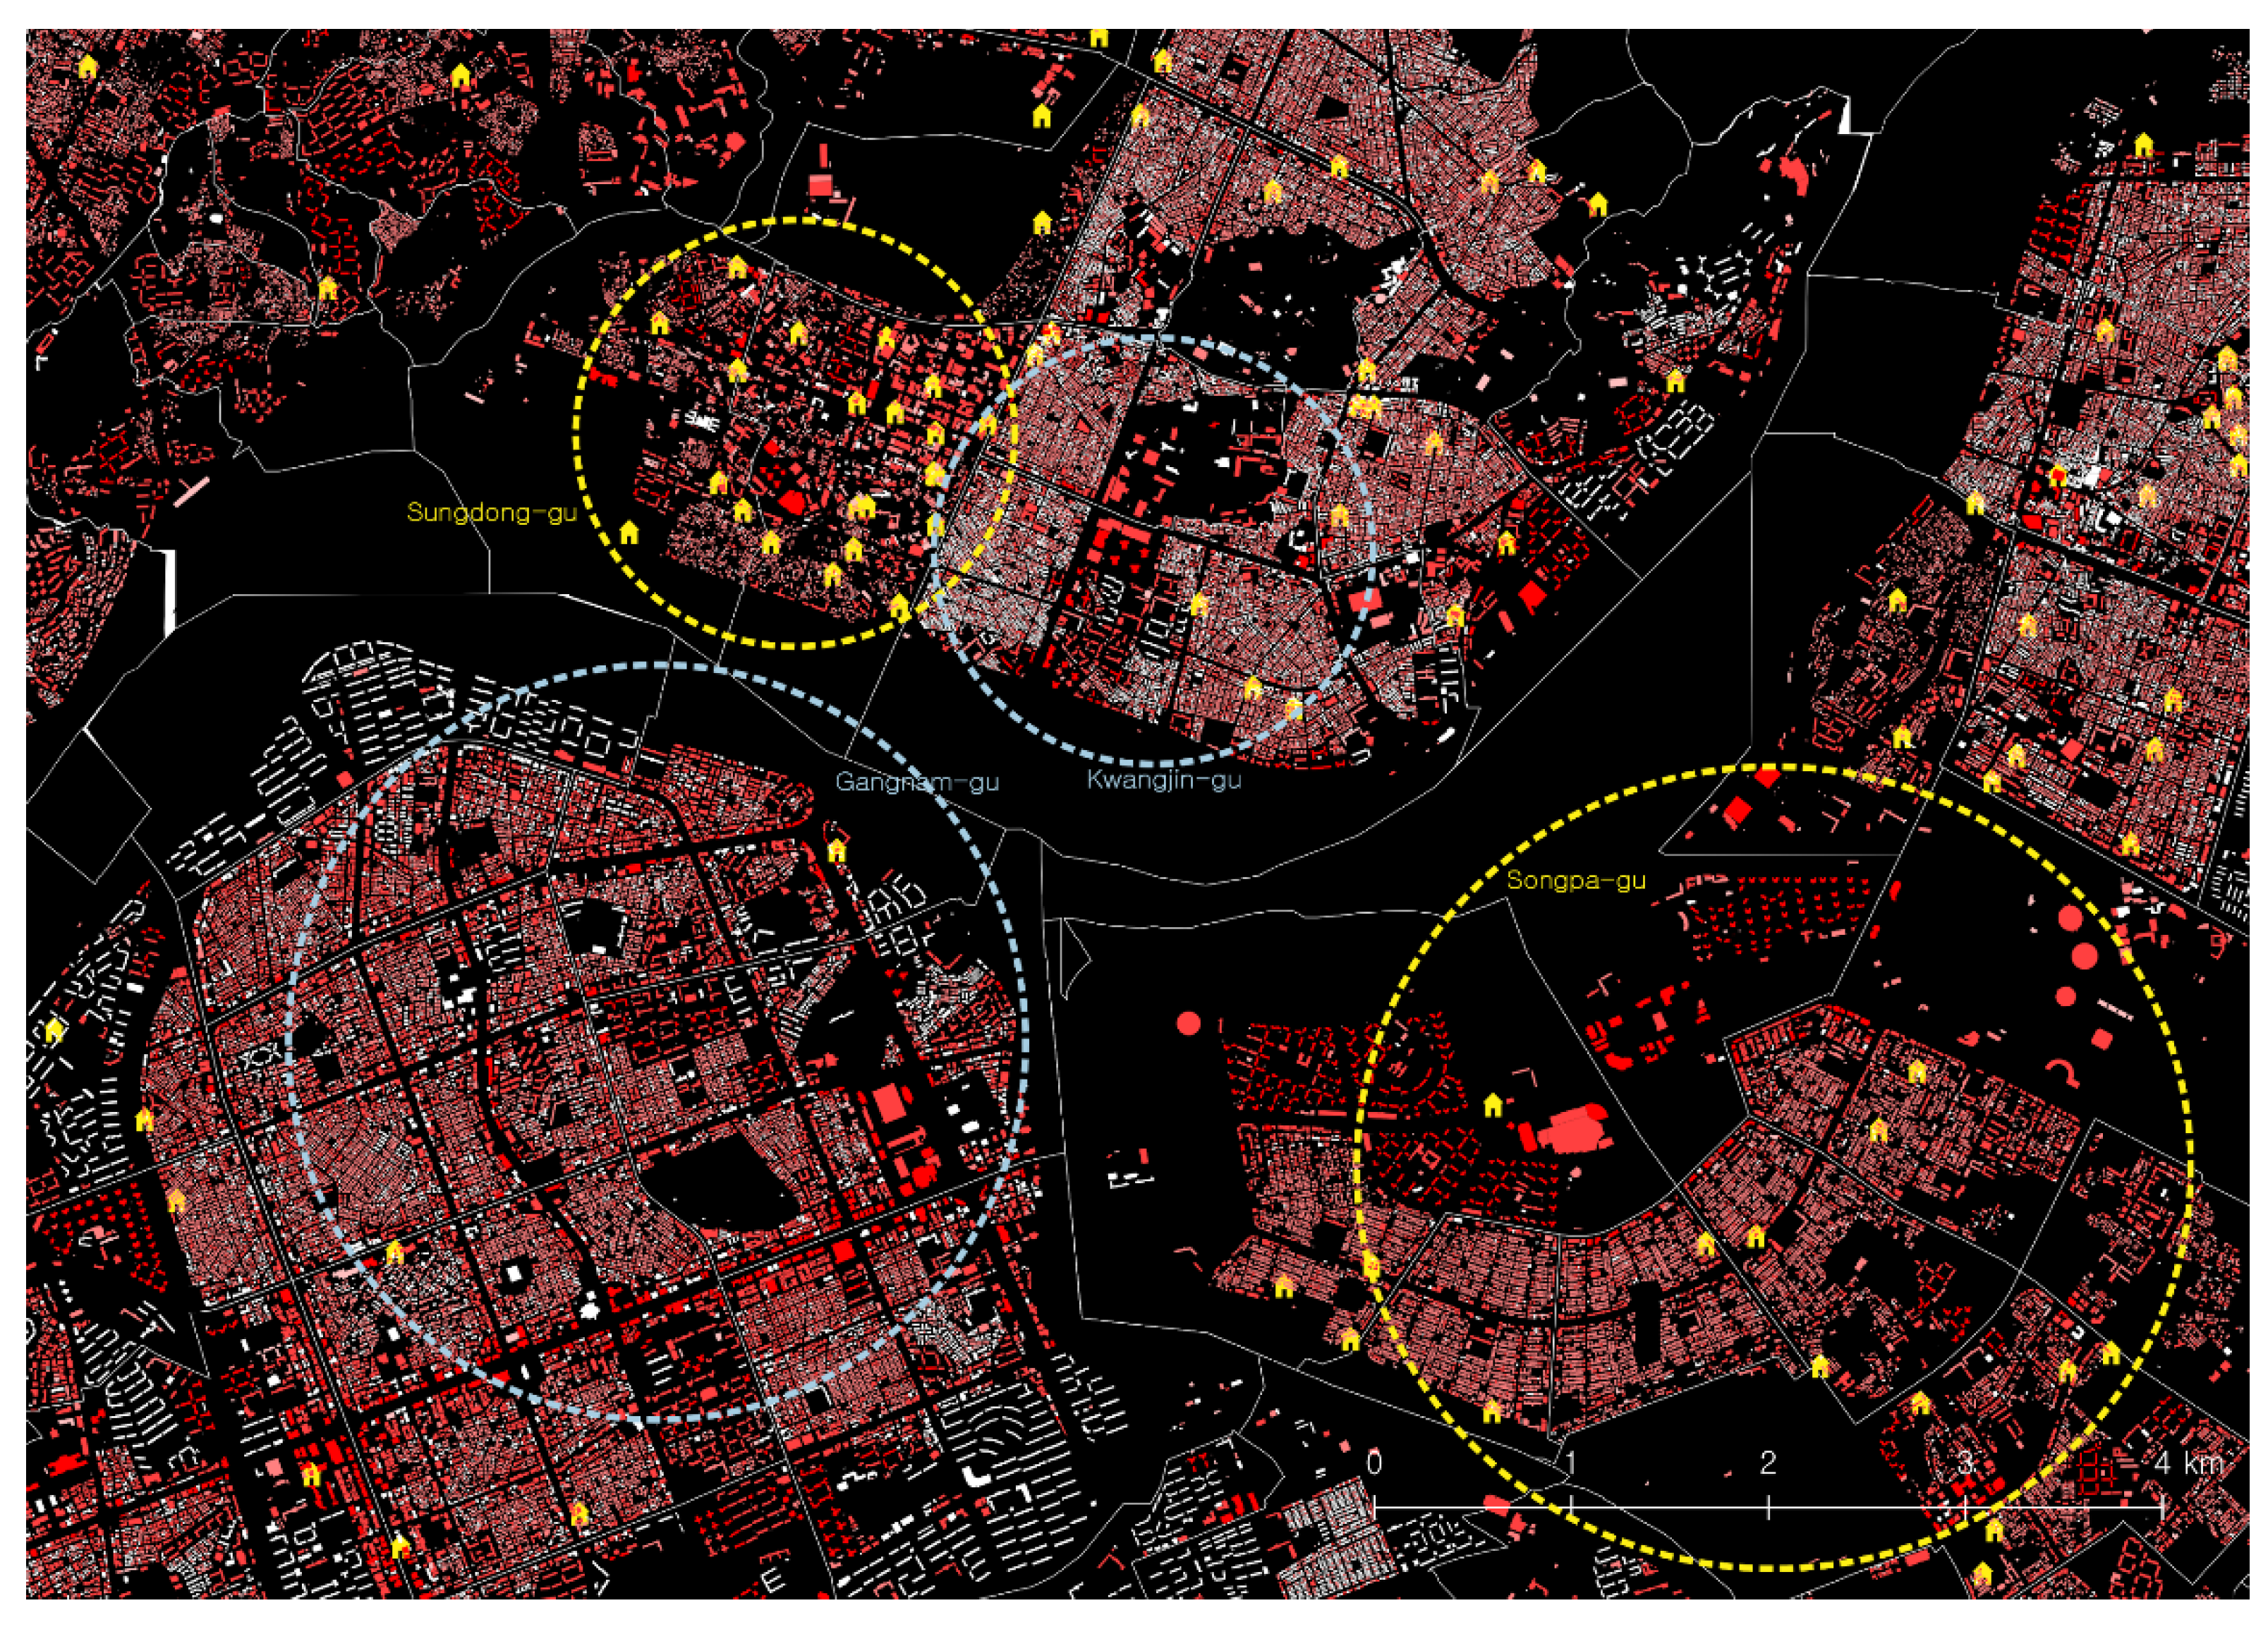
As seen through the map layer, there was significant heterogeneity in the density of junk shops across neighborhoods, and in
Figure 10, the four circles highlight the areas of four different, adjacent districts holding significantly different numbers of junk shops. The areas bounded by yellow circles held relatively higher numbers of junk shops compared to those bounded by grey circles, despite sharing similar urban fabric characteristics.
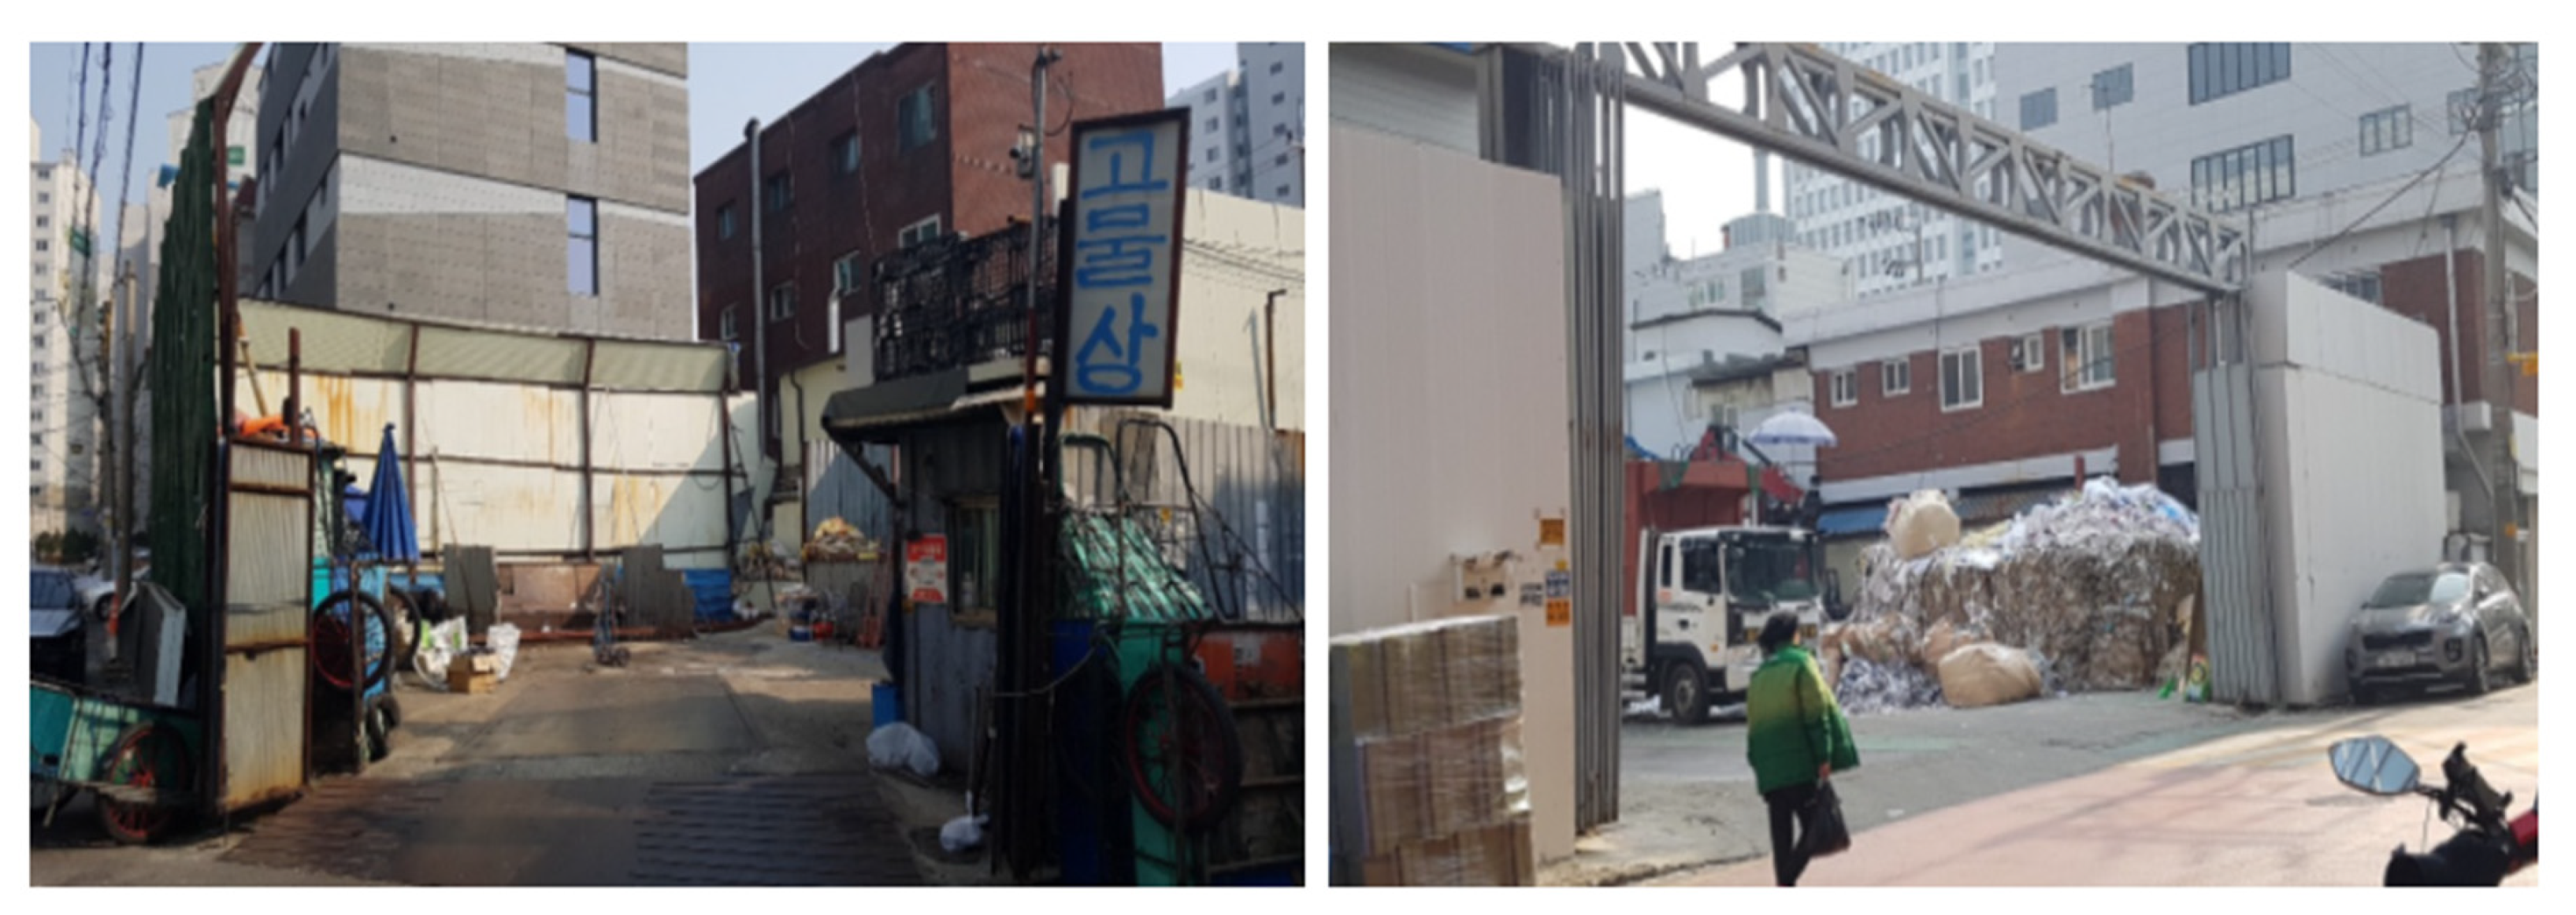
Within the two smaller, northern circles (Sungdong-gu on the left and Kwangjin-gu on the right), Sungdong-gu holds a significantly higher number of junk shops in comparison to Kwangjin-gu, though both of these areas are similarly comprised of dense networks of older residential buildings. The two southern circles (Gangnam-gu on the left and Songpa-gu on the right) also hold different densities of junk shops, though both areas consist of relatively new, master-planned districts with dense concentrations of mid- to high-rise residential buildings. In order to examine these large differences in junk shops presence between districts that have similar urban layouts, population levels, land use characteristics, building densities, and resident age groups, we conducted field interviews in a sample group of junk shops from these four districts, such as those shown in
Figure 11.
During the field interviews, junk shop owners stated that the unusually high concentration of junk shops located in Sungdong-gu is often attributed to the presence of the many small workshops also residing in the area, with these workshops specializing in industries such as printing and metal and leather fabrication. Many junk shops within this area receive a large portion of their recyclable waste from these manufacturing workshops, with long-time personal networks connecting the workshop owners to the junk shops owners. However, not all junk shops are reliant on these smaller industry workshops for business, as a portion of the junk shops in Sungdong-gu focus more on the task of collecting and sorting out household waste, which is generated in nearby local residential areas.
Over the course of the interviews, junk shop owners also discussed recent changes in the junk shop industry, as a large number of junk shops in the city are currently in the process of migrating out of neighborhoods that are undergoing redevelopment. Sungdong-gu, once a small industrial complex that was characterized by its printing and fabrication industries, is now in the process of being redeveloped into commercial and residential high-rise building complexes. As a result, many smaller businesses, including junk shops and the various industrial businesses they rely on, face increasing land prices and are being pressured to leave their locations. When accounting for the difference in junk shop concentration between Gangnam-gu and Songpa-gu, junk shop owners pointed toward the two districts’ different land prices, as well as the differing levels of opposition from residential communities. Specifically, Songpa-gu has yet to undergo Gangnam-gu’s rapid transformation into commercial and high-rise residential clusters, which had led to many of Gangnam-gu’s junk shops leaving the now highly commercialized district.
In summary, the field interviews with the owners of junk shops in these four neighboring districts of Sungdong-gu, Kwangjun-gu, Gangnam-gu, and Songpa-gu, provide support for the idea that junk shops are more likely to survive in small-scale industrial areas and low-rise residential areas. However, as many parts of the city are currently undergoing redevelopment, many junk shops are continuing to be pushed to the urban outskirts due to increasing land prices and large-scale commercial development.
3.4. Classification of Junk Shops
Based on field interviews in twenty junk shops in a variety of regions in Seoul and Daejeon, there are some notable distinctions between different junk shops, and junk shops can be classified according to their main activities and differing customer bases. Junk shops can be roughly classified into two groups, mainly by the scale and sophistication of their recycling process, as well as the types of materials they collect [
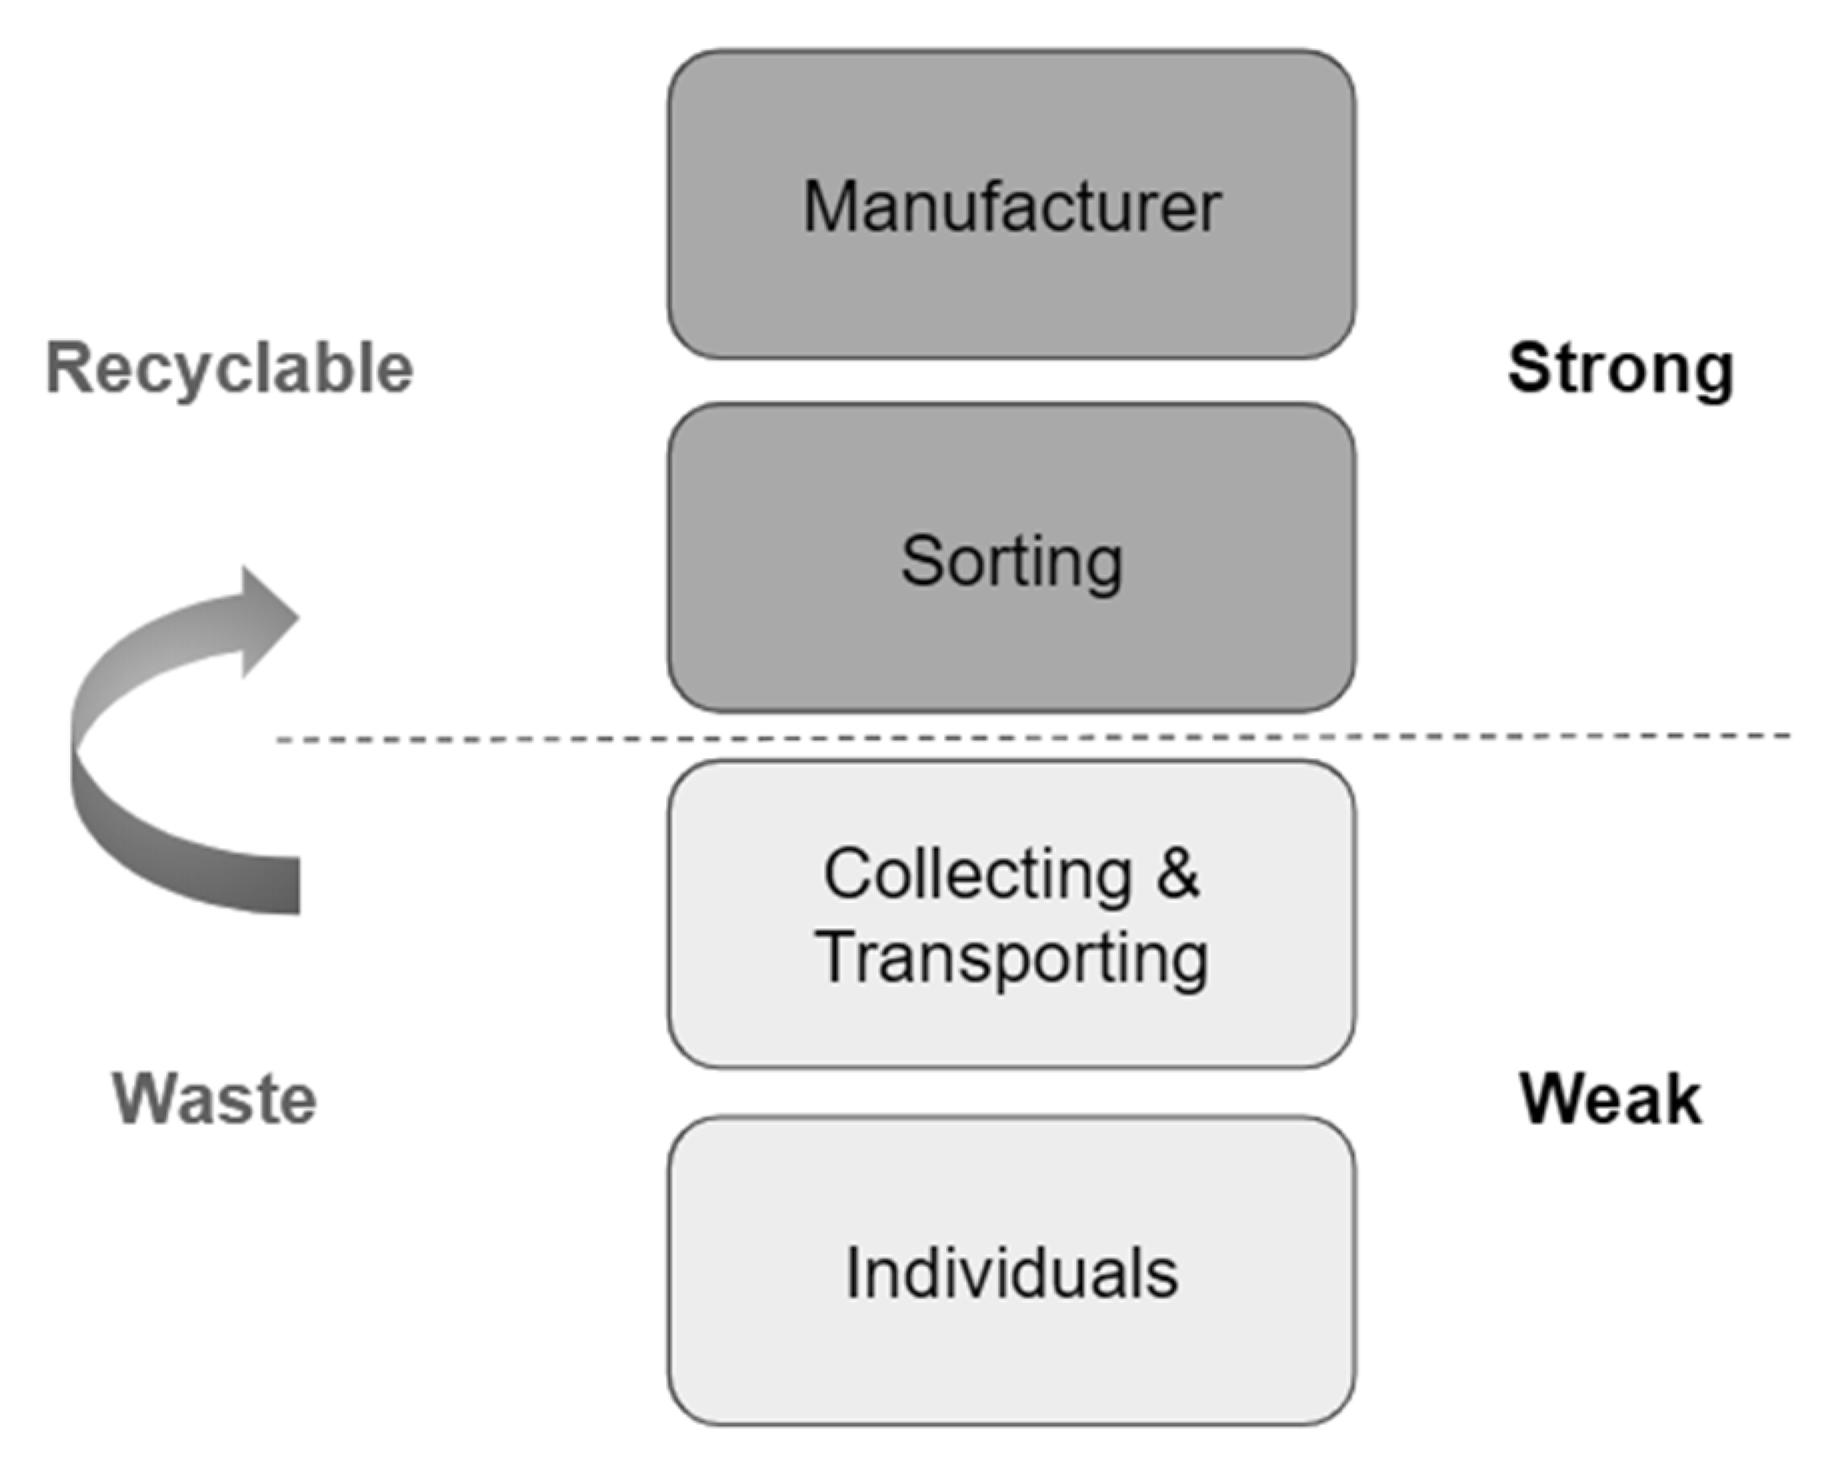
20]. All junk shops sit between two ends of the recycling chain, with individual waste pickers located at the bottom and manufacturers who purchase processed recyclable wastes located at the top. In
Figure 12, the two types of recycling activities performed by nearly all junk shops are shown, with the processes of “sorting” and “collecting/transporting” differentiated in the middle of the waste management process. Due to a lack of equipment and manpower, the majority of junk shops focus of collecting and transporting recyclable material at a small scale, buying waste from individual pickers, collecting waste at sites of waste generation, and then transporting this waste to sell to larger junk shops. Other junk shops, equipped with specialized on-site equipment, are capable of more advanced sorting and processing. Examples of more sophisticated processing methods include the separation of metal from non-metal counterparts and the crushing and grinding of fiber, synthetic resin, and rubber [
21]. The processing and separations of plastics has become a particularly large operation over the years, as Korea’s plastic waste production rose from 6 to 8 million tons from 2009 to 2017 [
20]. The majority of sorting equipment set-ups consist of a conveyor belt that sorts materials by mass, followed by a series of machines that pulverize and compress the raw materials into compact cubes of material. These additional processing activities help to increase the market value of the recyclable waste, giving these junk shops additional bargaining power in the recycling market [
22].
Junk shops can additionally be classified by the sources from which they receive their materials, ranging from individual pickers to businesses and large residential building complexes. Junk shops that receive a higher proportion of their waste from individual pickers often end up processing cardboard, as pickers choose to focus on collecting cardboard due to its light weight and high accessibility. There is some evidence that these junk shops, which act as markets for paper waste, tended to operate for a longer period of time within the same location; the survey’s 6 junk shops that relied mainly on individual waste pickers had all been operating in their locations for more than 10 years, as opposed to the other junk shops that had been in operation for only 5 to 7 years.
The junk shops that worked primarily with small businesses and factories tended to rely on individual waste pickers to a lower degree. Their activities concentrated on materials such as heavy construction waste or metals, depending on the owners’ personal networks and past industry experience. These junk shops were equipped with more sophisticated sorting and compressing machines, and did not collect waste from individual pickers for the most part, choosing to handle waste from larger entities. Due to the fact that these larger junk shops dealt directly with clients, and operated more like formalized businesses, they challenged the classification that labels all junk shops as actors within the informal recycling infrastructure. However, our dataset (based on the web search term “junk shop” or “gomulsang”) included both types of businesses, making it difficult to isolate the spatial patterns of either type, despite the different role they play in affecting different market conditions.
4. Discussion
4.1. Challenges of Data Accuracy
Despite the abundance of “big data” within cities, a great deal of a city’s information still resides within tacit knowledge networks that are only shared between certain actors or groups of individuals. As a result, understanding an urban system or network composed of diverse participants becomes a challenge and limits the level of any robust analysis that can be done on its processes [
13,
14,
23,
24]. Within the specific context of our study, the spatial dataset of junk shop locations taken from Naver’s API differed partially from the junk shop location addresses that were gathered during the course of field interviews. From our interviews, we found that junk shops may adjust their listed addresses to attract more clients. This kind of strategic behavior is not explained in the available “big data” and must be revealed through direct contact with stakeholders in the system.
The sources of this data discrepancy were revealed during the course of interviews with the junk shop owners. Firstly, some junk shop owners revealed that they choose to upload false addresses that are located within more populated areas in order to increase their likelihood of receiving calls, as sellers will typically contact the nearest junk shop. Additionally, several junk shop owners choose to locate their offices within central urban areas next to local district offices, using these physical outposts to handle incoming calls but placing the actual recycling site on the outskirts of the city. Lastly, as seen in the case of Sungdong-gu, many junk shops have been pushed out of commercially redeveloping regions due to recent increases in land price as well as pressure from larger businesses. As noted in the field interviews, junk shops that rely more on individual pickers tend to have better longevity than junk shops relying on small businesses and factories, perhaps implying that junk shops working within local networks of individual pickers experience more stability than those relying on waste from larger clients due to low possibility of large shocks in the supply chain.
4.2. Unregulated Recycling Market and Mistrust of Government
Based on interviews with policy experts from the Seoul Institute, one of the main challenges facing the informal recycling market is that the junk shops’ trades and transactions are not regulated in a systemic manner. Similar to the informal recycling markets in many countries, the Korean recycling market is characterized by hierarchy, with manufacturers and larger junk shops holding the strongest bargaining power, as represented in
Figure 4. Conversely, small junk shops and individual pickers have weak bargaining power at the bottom of the market, despite the fact that a large part of the industry depends critically on their collecting and transporting of smaller materials.
The imbalance between the highest and lowest level of the recycling market hierarchy results in economic vulnerability for small junk shops and individual waste pickers, who are subject to price-setting by actors at the top. Additionally, the system creates outside middlemen who benefit from commission negotiation but do not add any additional value to the recyclables in the process. The inherently informal nature of the recycling sector thereby prevents the government from adequately regulating these activities and makes it difficult to pass regulations that would improve either waste-processing efficiency or the workers’ welfare.
The low availability and overall inaccuracy of data, along with a lack of standardized government monitoring, continues to exacerbate the tension existing between the government and the informal sector. In addition, the fluctuation of government policy toward junk shops in urban areas has also increased the mistrust between the government and junk shop owners. In 1993, the abolishment of legal permission for junk shop operation allowed the informal recycling industry to thrive, but when the National Land Use Act in 2003 prohibited the operation of junk shops in many residential and commercial areas, the industry’s operation suffered. In 2011, the country’s waste management laws were revised once more and allowed junk shops occupying under 1000 m3 to operate with only a business license. As a result, this change in law created an incentive system where junk shops formally registered as waste-collecting businesses were given tax deductions, giving the government a method by which to track the size and scope of the informal recycling market.
These fluctuations in policy stance have made it difficult for junk shops to predict the government’s future policies for the informal recycling sector. The government in turn continues to fail to gather sufficient information about the informal recycling industry though these junk shops, and their waste pickers provide essential waste-gathering services to the city. The lack of information exchanged between the two sides has led to additional vulnerability for these junk shops’ existence, as the government is unable to assess the impact of its policies or to provide a safety net during market shocks, such as when China initiated a ban on imported waste in 2018, which led to Korea’s waste market losing a major buyer and the overall collapsing of material prices around the world [
15,
25].


