Article

A Framework to Evaluate Project Complexity Using the Fuzzy TOPSIS Method

1
College of Engineering and Technology, American University of the Middle East, Egaila, Kuwait
2
Laboratoire Genie Industriel, CentraleSupélec, Université Paris-Saclay, 3 Rue Joliot-Curie, 91190 Gif-sur-Yvette, France
3
Groupe Renault S.A., Strategy of Quality Management Department, 1 Avenue du Golf, 78280 Guyancourt, France
*
Author to whom correspondence should be addressed.
Sustainability 2021, 13(6), 3020; https://doi.org/10.3390/su13063020
Submission received: 12 February 2021 / Revised: 5 March 2021 / Accepted: 8 March 2021 / Published: 10 March 2021
(This article belongs to the Special Issue Applications of Complex System Approach in Project Management)

Abstract

:
This work aims to help managers anticipate, detect, and keep under control complex situations before facing negative consequences. This article explores complexity modeling theory and develops a framework and associated score sheet to measure project complexity. A framework comprising ninety factors is presented and divided into seven categories: stakeholders, project team, project governance, product, project characteristics, resources, and environment. For the project complexity assessment grid, the project manager prioritizes and weighs its factors using linguistic variables. The score sheet is customizable in its handling of the factors and their weights. A critical state of the art on multi-criteria methodologies is presented, as well as reasons for using the fuzzy technique for order preference by similarity to ideal solution (TOPSIS) method. This method provides early-warning signs with the possibility of comparing multiple projects. It also enables one to measure and prioritize areas and domains where complexity may have the highest impact. Practical applications on three projects within an automotive manufacturer highlight the benefits of such an approach for managers. Project managers could use both a project complexity rating system and a measure of risk criticality to decide on the level of proactive actions needed. This research work differs from traditional approaches that have linked proactive actions to risk criticality but not project complexity.

1. Introduction

Managing project complexity is known to be a success factor in modern project management [1]. Complex projects require unique project governance and management to adapt to interconnectedness and communication with, and control over, the different stakeholders [2]. Today, the problem with the failure of business projects and entities is a very current topic in the economy [3,4]. Applying proper risk management actions based on complexity level helps in achieving better project success rates.
Project practitioners noticed a significant correspondence between the project complexity level and successful management of project cost, duration, workload, and quality outcomes. Indeed, development effort increases with project complexity [5], and there is notably a strong relationship between complexity level and overall production cost [6].
Project complexity is recognized as a potent characteristic that influences, usually in a negative way, the outcome of many projects [7]. As a result of expanding complexity, today’s projects often fail and project managers are faced with more complex tasks, requiring skills from across many disciplines [8]. Describing and evaluating project complexity more properly could allow anticipating some complexity-related phenomena such as ambiguity and propagation of problems [9]. The overall ambition of this article is to define a framework and measure of project complexity. This research work is extended, updated, and rationalized from Jaber’s Ph.D. work within an international automotive manufacturer [9]. It suggests a generic framework to evaluate project complexity that could be applied in different industrial sectors. Furthermore, it resolves the vagueness, ambiguity, uncertainty, and imprecision related to crisp numbers in multi-criteria assessments of project complexity, by using a fuzzy multi-criteria decision-making method, which effectively processes the spoken language of decision-makers in daily life.
Project complexity measurement is applied within an automotive manufacturer’s organization to assist decision-making, notably when analyzing and comparing several projects. This approach can be used in different manners.
First, a retrospective analysis of previous projects can be done. It can help in understanding former difficulties, failures, or opportunities and learn lessons for future projects. It can also directly assess the historical impact of complexity sources on achieving project goals and their influence on cost, duration, value creation, and other project parameters such as the staffing level. Second, a prospective analysis can be performed. Using such a framework and measure in the upstream stage permits highlighting areas with a high complexity level. This framework allows anticipating the impact of complexity on projects’ outcomes and plans mitigation actions to reduce complexity-induced risks.
The remainder of this paper is as follows. Section 2 introduces the research question associated with complexity in project management. Section 3 presents the research methodology and notably the selection of the multicriteria assessment method that will be used. Section 4 introduces the project complexity framework, upon which the assessment is made in Section 5.

2. Complexity in Project Management

Complexity is among the real challenges of project management [10]. It has changed our view of the world of science in all fields, including social sciences. Projects have always been complex [11], and their complexity increases [12]. Project complexity is an essential criterion in selecting an appropriate project organizational form; it influences the selection of project inputs, e.g., the expertise and experience requirements of management staff; and it affects the project objectives of time, cost, and quality. Generally, it influences project outcomes; the higher the project’s complexity, the greater the time and cost [13,14].

2.1. Description of Complexity and Complex Systems

A complex system is composed of many parts and elements that have many interactions [15]. Complex systems are constituted by the sum of their components and the relationships between these components [16,17]. Thompson [18] also viewed a complex organization as a set of interdependent parts, which make up a whole together, this whole being interdependent with some larger environment. For years, “organization theory has treated complexity as a structural variable that characterizes both organizations and their environments” [19]. When dealing with organizations, complexity is indeed often “viewed as an objective characteristic of the organization structure, defined and measured in terms of the number of its constituent parts, their diversity, and relationships” [20]. More particularly, “economic and social systems, from single firms to the global economy, all involve a multitude of actors interacting in complex ways” [21]. As a whole, a complex system or organization is composed of a large number of elements; these elements are of several types and have an internal structure that cannot be overlooked, and are connected by non-linear interactions, often of distinct types. The system is subject to external influences at different scales. Le Moigne and Morin helped to develop a theory or a “systems science,” which first wants to be interdisciplinary and second aims to cope with complex phenomena [22,23]. Morin also presents the concepts of uncertainty and un-decidability as concepts closely linked to complex thought. Thus, complexity revolves around the relationship between the four principles that characterize this thought: order, disorder, organization, and interaction. The increasing complexity of systems raises the question of their control and, more generally, the competitiveness of enterprises in terms of capacity to analyze the architecture with the means of “systems engineering.” Complexity in “systems science” is divided into three types: first, the complexity of the systems themselves; second, the complexity of contractual frameworks in which the systems are finally realized; and third, the complexity of organizations involved in the definition phase, construction, and operation. Such complexity requires developing the engineering and information systems processes to manage, share, and leverage engineering data during all project phases.
Since complexity results from the (non-trivial) interactions between the interrelated components of a system, complexity is manifested at the level of the system itself [24,25]. Therefore, a theory or a “systems science” was developed to be interdisciplinary and cope with complex phenomena [22]. Historically, many definitions of systems appeared in the literature. A system is defined as something that pursues objectives in a dynamic and evolving environment, exerting activity, organizing, and evolving without losing its identity [23]. A system is an arrangement of interacting elements organized to achieve one or more defined objectives [26]. In this article, a complex system is defined as the following aggregated definition: a system is an object, which, in a given environment, aims at reaching some objectives (teleological aspect) by doing an activity (functional aspect) while its internal structure (ontological aspect) evolves through time (genetic aspect) without losing its own identity [15,23,27].
With complex systems, the use of traditional analytical tools shows its limitations [28]. The increasing complexity of systems raises the question of their control and, more generally, the competitiveness of enterprises in terms of capacity to analyze the architecture with the means of “systems engineering” and the definition of innovative methods and frameworks which can permit to understand and better manage the complexity of organizational systems. These innovative approaches’ objective is not to try to describe and understand the system entirely (since it is impossible with complex systems as has long been stated [29]) but to provide managers with additional frameworks and vision that can reduce unclarity, ambiguity, and uncertainty regarding the complex system’s knowledge [30].

2.2. Projects as Complex Systems

“Nowadays, projects are dealing with growing complexity in both their structure and context. Project managers have to take into consideration a wide variety of parameters such as environmental, social, safety, security, and a growing number of stakeholders, both inside and outside the project, as well as the organizational and technical complexities, to evaluate project complexity” [31]. The increasing size, the more demanding scope, and the more challenging technical aspects of projects led to a radical increase in complex projects [32].
In this overall global context, projects can be more than ever considered as complex systems [33], given the definition used in this article. Indeed, a project exists within a specific environment and aims at reaching objectives given this context (teleological aspect). It has goals in a dynamic environment and evolutionary context. These goals are engaged and organized around actors that change and evolve without losing the project identity. A project has to accomplish a network of activities using some methods and methodologies (functional aspect). A project has an internal structure composed of resources, deliverables, tools, workers, etc. (ontological aspect). Finally, a project evolves through time, via resource consumption, product delivery, members’ changes, and gain of experience, without losing its own identity (genetic aspect). A project indeed uses resources, means, and skills that are usually placed under different authorities (organizational units). These resources, methods, and skills must be coordinated to achieve project objectives. Project complexity is not just related to technical complications. It is also a matter of organizing and motivating actors to make diverse resources that sometimes have highly divergent interests work together [34]. Significantly, complexity has recently increased in projects, often due to coordination issues among stakeholders, often having different (or even conflicting) interests or changes in laws and regulations [35].
All things considered, and remembering the words of Simon, who mentioned that “complex systems will evolve from simple systems much more rapidly if there are stable intermediate forms” [15], the behavior of a project is difficult to predict, control, and understand at every moment. The reality of perception is, in essence, uncertain, unfinished, and incomplete. Consequently, “complexity is often quoted as an independent variable that challenges the utility of traditional project management tools and techniques” [36]. Complexity indeed limits the applicability of best practice tools and methods, which decreases the performance of the project and its outcomes [37]. Therefore, innovative systems thinking-oriented approaches should be used for complex project management.

2.3. Research Questions

Project complexity is thus an essential criterion in selecting an appropriate project organizational form; it influences the selection of project inputs, e.g., the expertise and experience requirements of management personnel, and it affects the project objectives of time, cost, and quality. Generally, the higher the project’s complexity, the greater the time and cost [13]. This paper aims at answering the following research questions to develop the framework and the score sheet to evaluate project complexity: Which factors make a project more complex? Which classification of these factors is more valuable for industry applications? What could be the benefits of an evaluation of project complexity? Which method can be used to perform this evaluation efficiently in industrial project environments?

3. Research Methodology

This section introduces first the process followed to answer our research questions; thus, details step 1.
The process consists of three main steps, related to preparation, construction, and test/validation, as in [38,39].
  • Step 1: Selection of an appropriate multi-criteria evaluation method to assess project complexity based on a framework for multi-criteria method selection.
  • Step 2: Construction of a project complexity framework using an extensive academic state of the art (Section 4.1) and industrial practitioners’ interviews (Section 4.2).
  • Step 3: Development of a structured framework (Section 5), tested on real industrial projects (Section 6).
Describing and evaluating project complexity more properly could permit some non-exhaustive direct benefits, as shown in Figure 1.

3.1. Selection of a Framework-Based Evaluation Principle for Project Complexity

In addition to a new project complexity framework, this work’s final deliverable is a proposal for a project complexity measure.
According to Wood and Ashton [40], “being able to measure the complexity at an early stage in a project will lead to a better understanding of the project and, therefore, could be of great benefit in successfully managing projects and reducing the risks associated with complexity.”
Several authors in the literature tried to define complexity measures to explain project failures, identify intricate situations, understand better project complex phenomena, and help decision-making. These measures can be classified into four categories: information-based approaches, parametric approaches, project network-based approaches, and project complexity framework-based approaches.
First, information-based approaches mostly use Shannon’s theory of information as a way to evaluate project complexity, using the concepts of entropy and loss of information [41]. On their side, parametric methods use a mathematical formulation to assess project complexity using different project parameters (such as the number of tasks, the number of interrelations, etc.), like [42] or [43]. These methods are relatively simple and easy to use for industrial practitioners, but they reduce project complexity to a very limited number of parameters [44].
The third category is one of the project network-based approaches. These approaches model a complex project into networks of interconnected elements, most often oriented graphs (of activities, resources, etc.). Once the project model is chosen and built, a complexity measure is built to assess the model’s complexity. These approaches hypothesize that the model’s complexity gives a good idea about the project’s complexity. Some of these measures are notably based on early works by Kaimann [45] and Davis [46]. Vidal gives several examples of such project network-based approaches in his Ph.D. thesis [47], like [48,49] or [50]. A more recent work tried to measure complexity through task and organization models and the measure of hidden work to reflect project complexity [51]. Even more recent work proposed a distance measure based on models of a project, such as the works of Ellinas et al. [36]. They use the project activities adjacency matrix and a distance measure to evaluate project complexity. Suppose all these works deserve attention from the view of this article. In that case, these measures fail to encompass the real complexity of a project by focusing on a model of some elements of the project and neglecting essential factors to project complexity (interdependencies with the project environment, etc.). They also need a reasonable amount of information to be known about the project and a certain level of expertise from the project team; otherwise, the models will not be done appropriately and thus, the evaluation will not make sense. That means they are not adapted to non-mature organizations or the early stages of a complex project’s life.
Finally, the last category is one of the project complexity framework-based approaches. These methods use a framework of project complexity factors or sources combined with a multi-criteria evaluation methodology to obtain an absolute or relative project complexity measure. Such models include the ones of Owens et al. [52,53] or [54], which use different numerical and graphical representations to highlight complexity sources and give project complexity scores. They also sometimes include a sensitivity analysis to study the robustness of their evaluations. Generally, these sensitivity analyses are only gradient sensitivity analyses that are known to be unsatisfying in complex contexts. However, these works provide excellent visions for project complexity evaluation from the point of view of this article, since they try to encompass many aspects (structural and contextual) since they refer to project complexity frameworks which are built using a systems approach.

3.2. Selection of a Multi-Criteria Evaluation Method

Based on project complexity measurement, we aim to provide a complete ranking of projects with quantitative measures, which could be used for project selection or for applying specific risk management actions. To perform the project complexity measurement, we need to consider different quantitative weights of several complexity categories and numerous complexity factors (90 factors). Furthermore, project managers know their industrial context and know to differentiate if a factor contributes to complexity or not (there are no uncertainty concerns in the decision-maker’s preferences). Still, there is an uncertainty in the differentiation between multiple levels of contribution to complexity (uncertainty on both weights of criteria and the criterial performance of alternatives).
Multi-criteria decision analysis (MCDA) methods involve finding the best opinion from all feasible alternatives in the presence of multiple, usually conflicting, decision criteria. Priority-based, outranking, distance-based, and mixed methods are the primary approaches [55].
Roy specified that selecting the appropriate MCDA method has a vital impact on the solution of a decision problem [56]. The improper application of a MCDA method diminishes the quality of recommendations since different MCDA methods provide inconsistent outcomes [57].
To determine an appropriate MCDA method, Wątróbski and his co-authors developed a methodological framework [57]. They provided nine descriptors to evaluate the problem and select the most suitable method from a set of 56 available MCDA methods. The nine descriptors are (1) has weights? (2) weight types, (3) scale, (4) has uncertainty?, (5) uncertainty type, (6) data uncertainty type, (7) preference uncertainty type, (8) topic, and (9) ranking type.
In this study, we applied the methodology developed by Wątróbski et al. (2019) with the following answers for the nine descriptors: (1) yes has weights, (2) quantitative weights, (3) quantitative scale, (4) yes, has uncertainty, (5) uncertainty in the input, (6) data uncertainty in criteria and variants, (7) no preference uncertainty, (8) ranking and choice, and (9) complete ranking. The Wątróbski framework shows that the fuzzy technique for order preference by similarity to ideal solution (fuzzy TOPSIS) method is a suitable and appropriate method for our study.
TOPSIS, which aims to rank several alternatives, is based on choosing the alternative with the shortest distance from the positive ideal alternative and the longest distance from the negative-ideal alternative [58,59]. It was developed by [59]. Its principle consists in determining for each alternative a coefficient between 0 and 1 based on the Euclidean distances between each alternative, on the one hand, and the favorable and unfavorable ideal solutions on the other hand. An alternative is a so-called ideal favorable if it is farther from the worst alternative and closest to the best alternative. An alternative is the so-called ideal unfavorable if it is closer to the worst alternative and further away from the best alternative [60].
TOPSIS is a simple algorithm that can be run for a vast amount of data. Therefore, it is useful when numerous alternatives and criteria are involved, which is also due to its directness and lack of calculation complication, even when faced with a large amount of data. Moreover, TOPSIS will yield a final result in a net ordering format, which is extremely close to the ideal solution. In terms of the final ranking, a comparison between the final scores of each alternative calculated in TOPSIS is performed so that decision-making can be more flexible. In addition, TOPSIS can simultaneously consider various criteria of the alternatives with different units [61].
In traditional TOPSIS, the importance of criteria and the performance of each alternative are determined. However, getting exact data and measuring criteria might be difficult because of the subjectivity, uncertainty, and ambiguity during the decision-making process. According to [62], traditional TOPSIS cannot handle the inherent uncertainty and imprecision in the decision process. It is often difficult to assign a precise performance rating to an alternative for a decision-maker.
The fuzzy set theory can effectively overcome ambiguity, uncertainty, and imprecision related to crisp numbers. The merit of using the fuzzy approach is to assign the importance of criteria and the performance of alternatives by using fuzzy numbers instead of crisp numbers [63,64].
The fuzzy TOPSIS method was applied in many practical use cases, starting from selecting a proper supplier for manufacturing, assessing services quality, and ending at selecting and ranking renewable energy sources, proving that it is extensively implemented in a wide range of real-world problems. Using fuzzy triangular numbers to evaluate the projects’ total complexities and compare them allows resolving the vagueness, ambiguity, uncertainty, and imprecision related to crisp numbers in multi-criteria assessments of project complexity.

4. Building the Project Complexity Framework

4.1. Literature Review: Understanding the Determinants of Project Complexity

Understanding project complexity is of interest to both practitioners and academics [65]. Explaining a complex system’s behavior requires understanding the variables determining system behavior more than trying to have a complete model of the complex system [66]. That is why several project complexity frameworks have been developed before. Still, they either do not encompass all (or most of) the significant aspects and factors of project complexity or fail to make practical sense for industrial practitioners. Nevertheless, all these works allow pointing out some of the project complexity factors and possible ways to organize them. Consequently, the objective here is to identify significant contributions to the literature about project complexity determinants and synthesize the existing theoretical and empirical work in a new detailed framework. This new classification will be refined to consider denominations widely shared between project practitioners, thanks to Section 4.2.
Baccarini defines project complexity as several interrelated diverse parts that can be operationalized in terms of differentiation and interdependence. “It is proposed that project complexity be defined as consisting of many varied interrelated parts and can be operationalized in terms of differentiation and interdependency” [13]. Differentiation is the number of different items such as tasks, resources, components, interdependence, connectivity, and degree of interrelationships between these elements. However, if the diversity of parties and their interrelationships are inherent characteristics of project complexity, other components must be considered [67]. For instance, Williams added notions of volatility related to the notion of uncertainty [68], suggesting two types of project uncertainties, the uncertainty of targets and the uncertainty of methods. The concept of uncertainty was also raised by Baccarini but dismissed as a separate concept of complexity.
In this article, project complexity is defined as “the property of a project which makes it difficult to understand, foresee and keep under control its overall behavior, even when given complete information about the project system,” as in [53]. This aforementioned work proposed to classify project complexity factors into four main categories: size, variety, interdependency, and context-dependence. This classification is then broken down into eight categories, thanks to Baccarini’s traditional dichotomy [13]. The final structure is ORG-size/ORG-var/ORG-int/ORG-cont/TECH-size/TECH-var/TECH-int, and TECH-cont. This framework can highlight project complexity sources, is reliable, and is independent of the project models. However, this classification of project complexity factors is non-intuitive for the final users and thus its benefits are difficult to communicate in an industrial context.
Another project complexity framework is the technical, organizational, and environmental framework [40], which categorizes the complexity of large engineering projects. In total, 50 elements contributing to project complexity were identified, but only a few elements about product complexity; therefore, it is still adapting to the new product development projects. Another one proposed a classification of project complexity factors, separating them into technical and institutional complexity factors [69]. Another model [67] proposed a classification into five categories: mission, organization, delivery, stakeholders, and team. However, these two last models did not permit to encompass all project complexity factors identified in other works, such as [53] or [70], notably contextual or environmental factors.
More recent works include [71], which identified six aspects for project complexity (socio-political, environmental, organizational, infrastructural, technological, and scope), or [72], which categorized complexity into technological, organizational, goal, environmental, and cultural factors. Even more recent work proposed to “arrange the complexity drivers depending on their sphere of influence in a shell model” composed of four categories: organization, production, resources, and technologies [73].
These models, which are based on extensive reviews of the project management and project complexity literature, are used as inputs to construct the framework proposed in this article. Several database (Web of Science, Project Management Institute, ScienceDirect, etc.) searches were conducted iteratively to retrieve articles related to project complexity describing and assessment. Search terms included “project complexity,” “complexity measure,” “complexity management,” “complexity assessment,” “complexity evaluation,” etc. Eighty journal articles were retrieved and the reference lists of each article were reviewed in detail to find additional articles. Project complexity factors were retrieved from these articles and recorded in a table with the associated reference and assessment method. Then, duplicated items were merged and a question to evaluate each factor was formulated. Every factor which is present in these pre-existing frameworks is gathered in this new one. When a factor is present in several of these frameworks but not with the same denomination, it is regrouped under one reformulation. As a result, a very first list of project complexity factors is obtained and used as a basis to build a new project complexity framework.

4.2. Industrial Interviews and Proposals

Large-scale interviews were conducted with forty project engineers in the early stages of the research to identify the needs and the expectations for the project complexity description and assessment. The years of experience within new-product development projects of the interviewed experts vary from 7 to 25 years. These experts were from various departments, such as design, mechanical engineering, vehicle engineering, systems engineering, purchases, logistics, manufacturing, strategy of quality management, and project management office. The conducted interviews were semi-structured. They consist of several key questions that help to define the areas of project complexity to be explored. The interviewer or interviewee was allowed to diverge from pursuing an idea or response in more detail. This approach’s flexibility allowed the experts to list project complexity factors and categories based on their own experience. It also allowed the discovery of the perception of project complexity by project team members from different departments within the matrix organization.
Moreover, several brainstorming sessions with a constant group of 15 project practitioners were organized. The brainstorming sessions’ contributors’ profile covers large sides of managerial and technical aspects of the projects. Their profiles include roles such as program manager, project manager, the responsibility for the development logic of new vehicles, quality assurance engineer, project planning engineer, project quality engineer, product/process contract manager, systems engineer, integration responsible, purchasing manager, logistics manager, risk manager, and leader of product industrialization. All the project practitioners who have been actively involved throughout the framework development have more than ten years of experience. They have been involved in many local and international projects. The average of their years of experience was 18 years.
The first brainstorming session was performed to increase the quantity of identified project complexity factors. All the denominations of factors were also challenged with that group to ensure they would make sense in industrial environments. As a result, an updated list of project complexity factors was obtained.
All the identified factors were then merged into one large idea map, and the second brainstorming session was performed to categorize and classify the identified factors. The same group of project practitioners proposed a framework to evaluate overall project complexity factors regrouped into seven different categories: stakeholders, project team, project governance, product complexity, project characteristics, resources, and environment. This framework shows (even if it was not needed) that project complexity is, in essence, a multi-criteria characteristic and that its evaluation thus requires an appropriate multi-criteria evaluation method.

4.3. A Seven-Category Framework Structure

After identifying the industrial needs and expectations for project complexity assessment, many categories of complexity factors have been identified during the interviews and the brainstorming sessions. Project practitioners preferred to classify the project complexity factors using familiar terms to their daily work within the company. For instance, they did not like the classical classification of project complexity factors into categories related to size, variety, and dependencies. Still, they prefer a classification that makes sense when they communicate the complexity regulation actions. A brainstorming session was organized to classify project complexity factors. The 15 project practitioners have divided the project complexity factors into the following seven categories:
  • Stakeholders: The multi-type and networked relationships between project stakeholders are critical elements of the project’s challenges and opportunities. Project stakeholders are considered the most crucial factor in communication complexity [74]. This complexity is due to the increasing number of potential communication channels that equal to N * (N − 1)/2, where “N” represents the number of project’s stakeholders [75].
  • Project team: Project actors must develop products by applying processes, allocating resources, choosing suppliers, and cooperating with subcontractors. Moreover, their organizational configurations directly impact the time it takes to develop a product. More cooperation and communication are necessary among the project team, between projects, and across stakeholders to better manage complexity-induced risks.
  • Project governance: This is seen as a set of managerial and process complexities. The increasing complexity of products requires implementing a complex process organization to their developments. Project governance is a critical step within any project, especially when dealing with complex and risky ones. The project schedule is included in this category.
  • Project characteristics: Project characteristics refer to uniqueness, temporary and short life of projects teams that set up to achieve specific objectives in a unique scope.
  • Product: The variety of functions within the new product increases the design, evaluation, and validation efforts and may assist in changing a product architecture and the development process. Moreover, requirement changes and a necessary degree of innovation do not only impact the product and its parts. Still, they may also lead to overhead costs and affect the coordination between project actors and suppliers [76]. Product complexity is considered the first significant source of complexity in the design and manufacturing or design and construction projects [77]. It has three main elements: size (number of product components to specify), interactions (parts integration), and novelty. Product (structural) complexity is the number of sub-systems in a product and their inter-relationships, where an inter-relationship can mean, for example, that changes in the design of one sub-system make cross-impacts and affect the design of other systems [78]. Project quality is included in this category.
  • Resources: The analysis of the project resources must be done in the upstream phase. Furthermore, resource adjustments are used to address emerging and unexpected issues and reduce allocated resources to areas that no longer need attention. These resources contribute efficiently to successful project management. Projects having a greater degree of resource flexibility have higher levels of project execution success [14]. Project cost is included in this category.
  • Environment: The concept of complexity has recently gained prominence in environmental sustainability research [79]. Projects delivered in complex environments are often late, over-budget, and provide fewer benefits than expected. Furthermore, increasing environment complexity (competitiveness, regulations, requirements, and customers’ satisfaction) requires an attractive level of project delivery, e.g., a necessary level of customization and complexity. These elements evolve during the project and trigger changes in requirements.
This specific collection of identified project complexity factors allows for an in-depth understanding of the complexity propagation since project practitioners have widely used these denominations. Implementing complexity regulations’ strategy to these categories allows the management of complexity-induced risks.

4.4. Illustration of Project Complexity Framework Factors for Two Categories

This section presents the framework which regroups the project complexity factors into seven categories: stakeholders in Table 1, project team/actors in Table 2. The remaining framework categories are presented in Appendix A: project governance in Table A1, project characteristics in Table A2, product in Table A3, resources in Table A4, and environment in Table A5.
Table 1. Complexity factors related to the stakeholders.
StakeholdersEvaluate the Contribution of Each Factor from 1 (Very Weak) to 5 (Very Strong).Assistance in Assessing: You Can Think of:Sources
  • Number of stakeholders
To what extent does the number of stakeholders contribute to project complexity?How many stakeholders are there?[53,67,71,75]
2.
Number of investors
To what extent does the number of investors contribute to project complexity?How many investors are there?[80,81]
3.
Variety of the stakeholders’ status
To what extent does the variety of the stakeholders’ status contribute to project complexity?Suppliers’ status variety[53,81]
4.
Variety of the interests of the stakeholders
To what extent does the variety of the interests of the stakeholders contribute to project complexity?Are there competing priorities of stakeholders?[53,81]
5.
The geographic location of stakeholders (and their mutual disaffection)
To what extent does the geographic location of stakeholders contribute to project complexity? [53,81,82]
6.
Interdependence between sites, departments, and companies
To what extent does the interdependence between sites, departments, and companies contribute to project complexity? [53,81]
7.
Stakeholders interrelations
To what extent do the stakeholders’ interrelations contribute to project complexity?What is the number and nature of dependencies on other stakeholders?[53,81,82]
8.
Political influence
To what extent does the political influence contribute to project complexity? [70,71]
9.
Trust level between stakeholders
To what extent does the trust level between stakeholders contribute to project complexity? [70,83,84]
10.
Subcontractors involvement in the project
To what extent does the subcontractors’ involvement in the project contribute to project complexity?What is the percentage of the project’s work done by the subcontractors?[85]
11.
Manufacturer–supplier relationship
To what extent does the manufacturer–supplier relationship contribute to project complexity? Brainstorming
Table 2. Complexity factors related to the project team.
Project Team/ActorsEvaluate the Contribution of Each Factor from 1 (Very Weak) to 5 (Very Strong).Assistance in Assessing: You Can Think of:Sources
  • Staff quantity
To what extent does the staff quantity contribute to project complexity?Number of actors involved in the project[53,82]
2.
Number of interfaces in the project organization
To what extent does the number of interfaces in the project organization contribute to project complexity? [53,86]
3.
Number of hierarchical levels
To what extent does the number of hierarchical levels contribute to project complexity? [53,81]
4.
Number of departments involved
To what extent does the number of departments involved contribute to project complexity? [53,81]
5.
Number of structures/groups/teams to be coordinated
To what extent does the number of structures/groups/teams to be coordinated contribute to project complexity? [53,81,86]
6.
Team cooperation and communication
To what extent do the cooperation and communication inside the team contribute to project complexity?Does a communication plan exist in the project? Is the project manager an effective communicator?[53,81,82]
7.
Variety of organizational interdependencies
To what extent does the variety of organizational interdependencies contribute to project complexity? [53,86]
8.
Variety of hierarchical levels within the organization
To what extent does the variety of hierarchical levels within the organization contribute to project complexity?How does the variety of hierarchical levels influence the project?[53,86]
9.
Diversity of staff (experience, social background, etc.)
To what extent does the diversity of staff contribute to project complexity?What differences are there between the people involved in the project, which may lead to conflicts and misunderstandings?[53,86]
10.
Variety of skills needed
To what extent does the variety of skills needed contribute to project complexity?Does the project involve multiple technical disciplines?[53,67]
11.
Interdependencies between actors
To what extent do the interdependencies between actors contribute to project complexity?Number and nature of interdependencies between actors[53,81]
12.
Dynamic and evolving team structure
To what extent does the dynamic and evolving team structure contribute to project complexity?Is the team structure changing during the project?[53]
13.
Relations with permanent organizations
To what extent do the relations with permanent organizations contribute to project complexity? [53,86]
14.
Level of trust between actors of the project team
To what extent does the level of trust between actors of the project team contribute to project complexity?Do you trust the project team members?[70]
15.
Experience and skills of team members
To what extent do the experience and skills of team members contribute to project complexity? [67,87]
16.
Leadership, authority, technical/managerial expertise of the project manager
To what extent do the project manager’s leadership, authority, and technical/managerial expertise contribute to project complexity?Does the project manager have leadership, technical, and managerial expertise?[67,87]
17.
Overlapping office hours
To what extent do the overlapping office hours contribute to project complexity?How many overlapping office hours does the project have because of the different time zones involved?[70]
Please refer to the appendix for Table A1 (Project Governance), Table A2 (Project Characteristics), Table A3 (Product), Table A4 (Resources), and Table A5 (Environment). After proposing the framework of project complexity factors, it is tested on real industrial projects in the following section.
Every project is unique. Therefore, it is recognized that there may be exceptional situations in some projects, which are not covered by the factors identified in this framework. Based on the literature review, expert interviews, and brainstorming sessions, it was accepted that all of the identified project complexity factors had some effect on project complexity. However, some were identified as having a more significant impact than others, such as variety of the interests of the stakeholders, team cooperation and communication, organizational degree of innovation, alignment of objectives, number of subsystems and their integration complexity, change of specifications, flexibility of project budgets, and partnership and multi-firm alliances.

5. Evaluation of Project Complexity Using the Framework and the Fuzzy TOPSIS Method

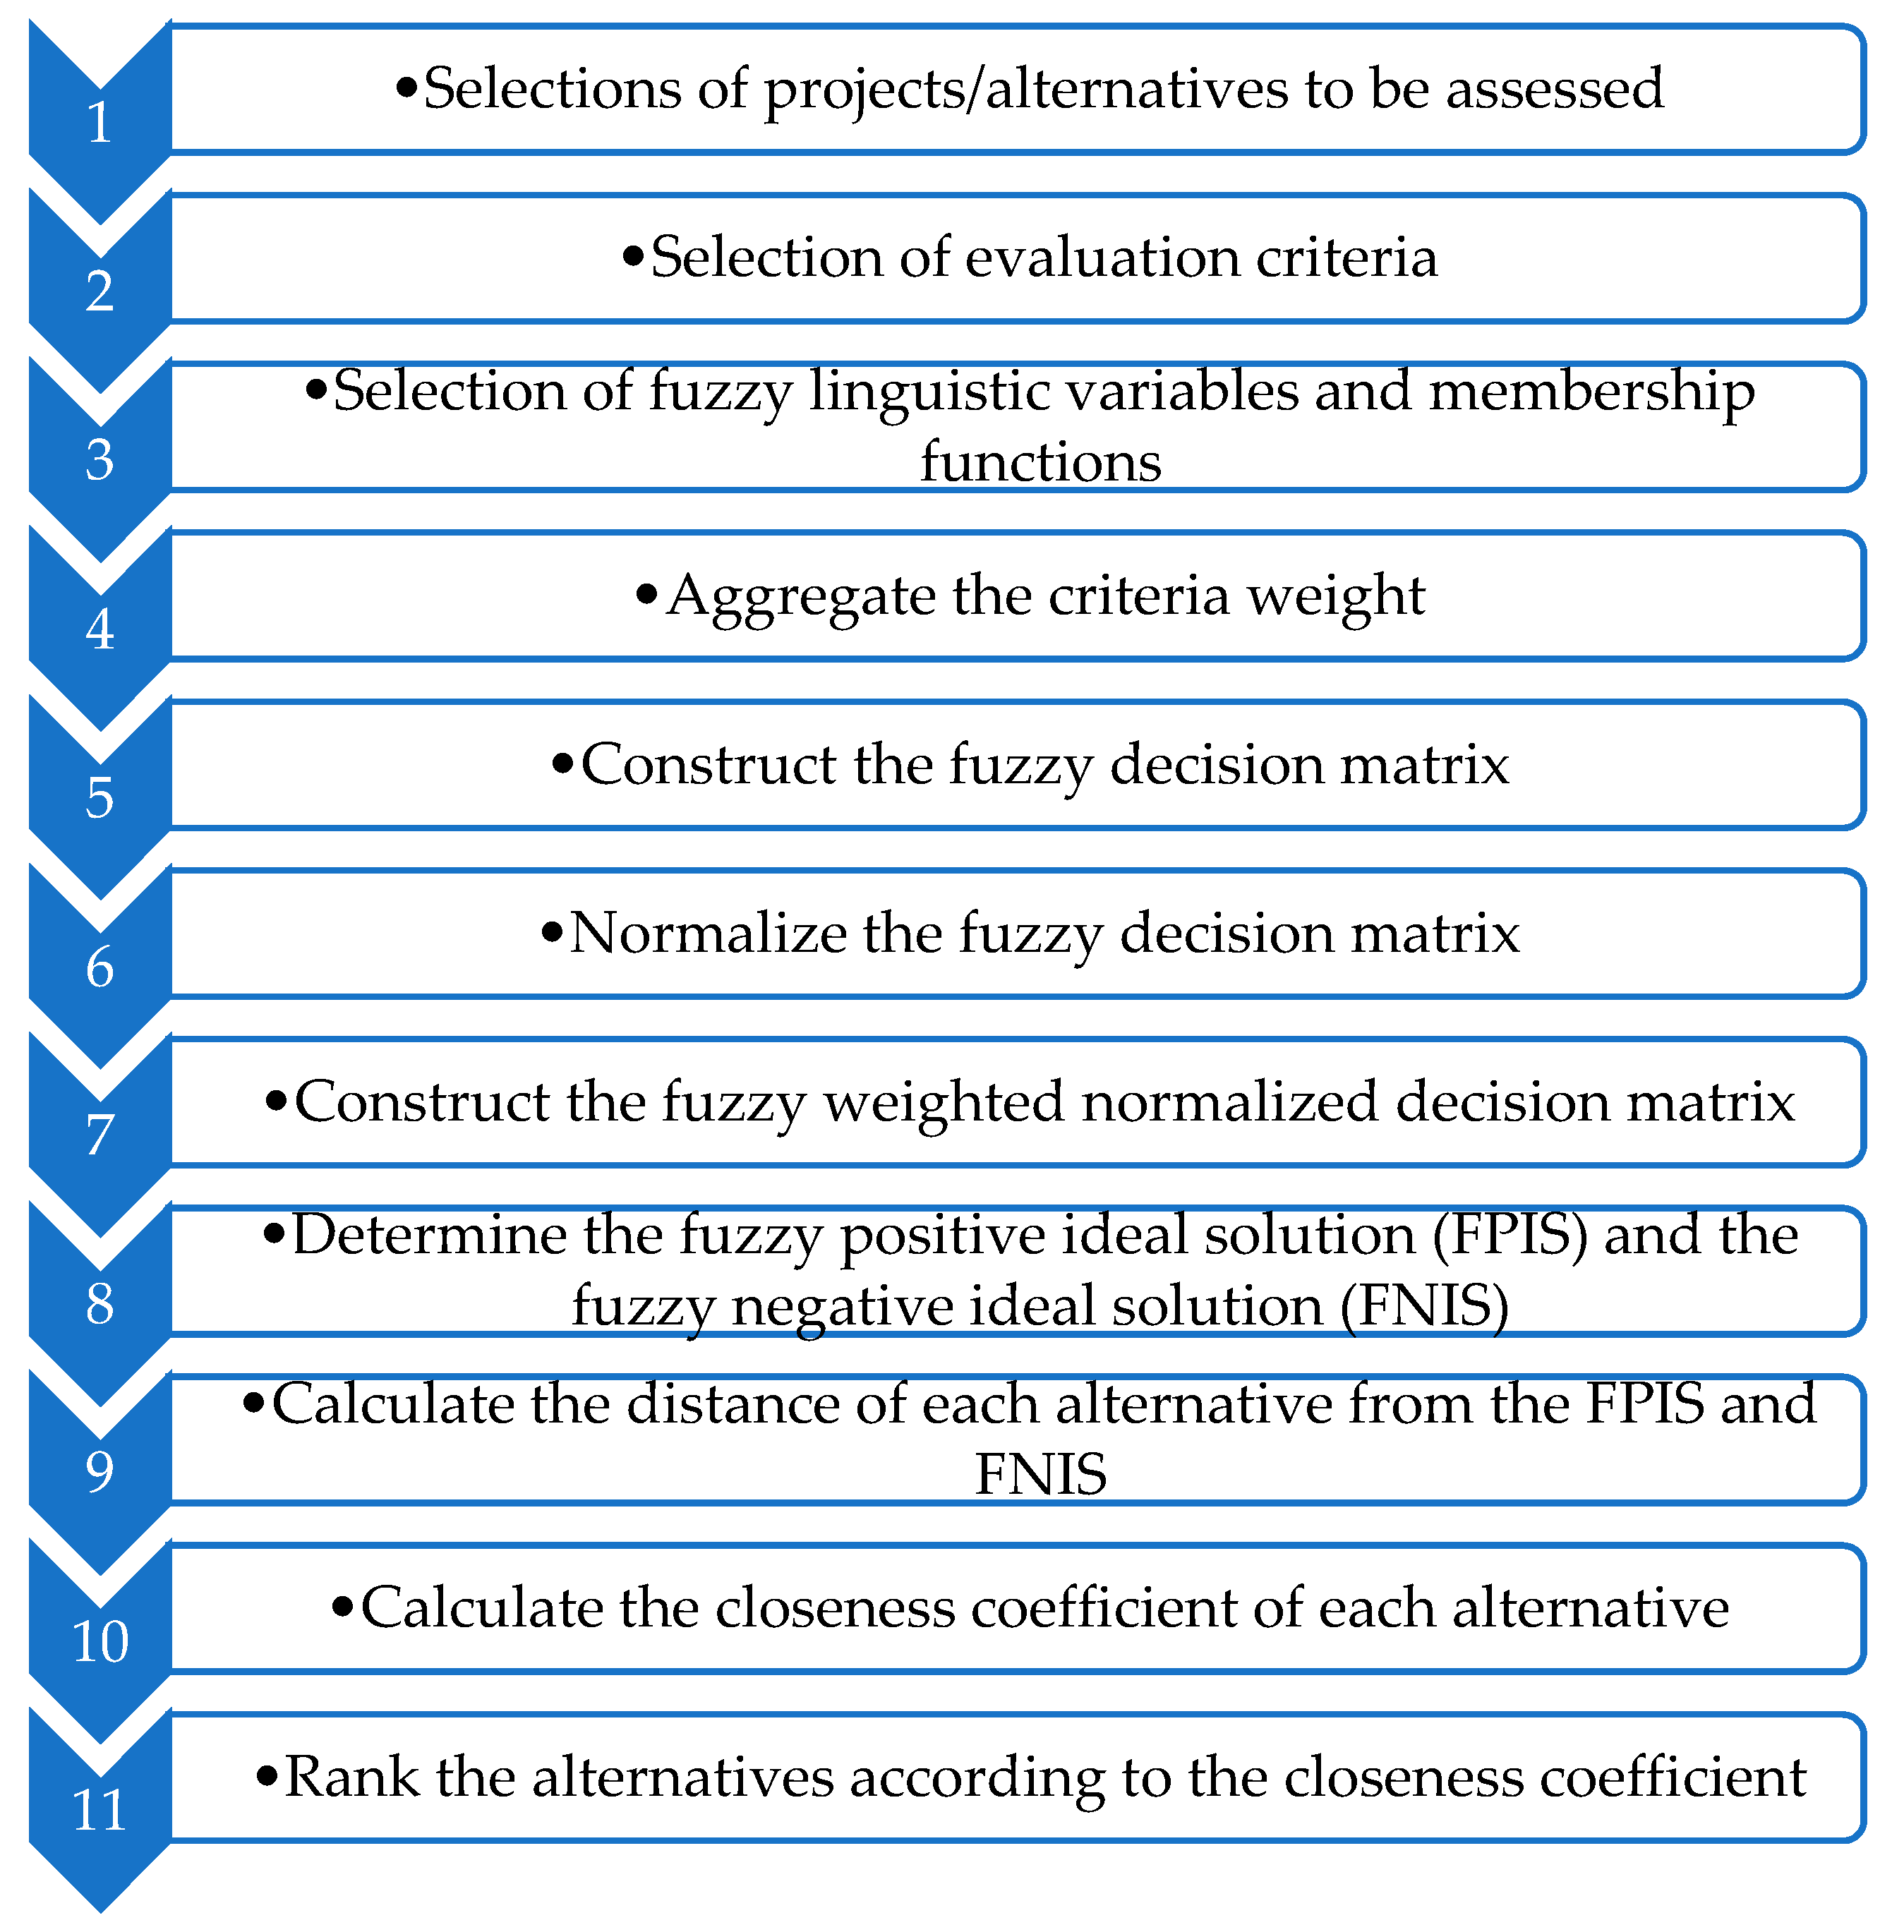
5.1. Short Description of Fuzzy TOPSIS (Fuzzy Technique for Order Preference by Similarity to Ideal Solution) to Assess Project Complexity

Ref. [88] first introduced the fuzzy sets theory to resolve the vagueness, ambiguity, and subjectivity of human judgment. Fuzzy approaches have been successfully applied within various scientific domains to assess risks and vulnerabilities [89]. The steps of fuzzy TOPSIS to assess several projects’ project complexity are listed in the following Figure 2.
In Appendix B, we present some basic definitions related to the fuzzy sets theory, and the mathematics concepts of fuzzy TOPSIS according to [90,91,92].
Figure 3 represents a series of triangular membership functions for the Likert scale from 1–5. The X-axis displays the input variable, Likert scale value, and the Y-axis denotes the membership degree.
By using triangular fuzzy functions, we consider the vagueness and ambiguity of verbal interactions in Likert evaluations. In project complexity evaluation surveys, respondents provide ambiguous and vague answers. While vagueness is associated with the difficulty of making sharp or precise distinctions in the world, ambiguity is related to situations having two or more unspecified alternatives.
A systematic approach for evaluating the project’s complexity by using fuzzy TOPSIS is proposed in Appendix B. Seven categories are used to determine the complexity of projects: (C1) project governance, (C2) project characteristic, (C3) product, (C4) project team/actors, (C5) stakeholders, (C6) resources, and (C7) environment. These categories include several factors changing from 8 to 17.
The linguistic variable might be adopted to provide approximate characterization when conventional quantitative terms are complex or ill-defined [93]. Decision-makers (DM) can evaluate both the importance weights of criteria and the preference of each alternative by using linguistic variables. Table 3 and Table 4 show linguistic variables that are defined by positive triangular fuzzy numbers.

5.2. Application to Vehicle Development Projects

Automotive development is both challenging and fascinating, technically and organizationally as well. This development is achieved by integrating separate components into a complete vehicle, as well as orchestrating the cooperation of thousands of individuals from various companies, professions, and cultural and social backgrounds, to optimize and achieve economic and technical objectives. This section presents key features in the vehicle development projects, current applications of the project complexity framework, and its benefits in the industrial context.
A new vehicle development project is a complex system composed of hundreds of interrelated activities, deliverables, actors, and risks (years of development, budgets of tens to hundreds of millions of euros) [94]. Moreover, the complexity of the final deliverable, the vehicle, makes the project far more complex since each decision, whether on the product or project parameters, may influence other dimensions (respectively, project or product). This kind of heterogeneous interrelation is increasingly difficult to anticipate and to manage [95].
Figure 4 shows the key features of vehicle development projects divided into four classes that drive forward the required effort and the development time: design level, design content, innovation level, and number of options and versions.
The typical car contains about 2000 functional components, 30,000 parts, and 10 million software code lines [96]. Thus, to achieve the development of a new vehicle, designers and engineers must choose between a variety of product components, interior, and exterior trim levels, engine-body combinations, innovation degrees of parts, and in the process of manufacturing of each piece, the role of suppliers (make–buy decisions), and carryover parts from predecessor models. These decisions must be made quickly while still adhering to certain factors, such as keeping milestones, maintaining profitability, and respecting the customer’s quality expectations. As a consequence, they have a significant impact on project performance and product complexity. Furthermore, the level of suppliers’ involvement and the use of carryover parts influence the volume of engineering work to be done internally, then the project complexity [76]. As a result, this impacts profitability, lead time, and total product quality [85].
Several authors in the literature tried to define complexity measures to explain project failures, identify intricate situations, better understand project complex phenomena, and help decision-making. Indeed, such a measure is notably meant to assist decision-makers before engaging their projects/portfolios into too difficult situations since too early decisions when facing complex and uncertain situations often fail to deliver the targeted performance. There exist six essential criteria to determine the complexity measure quality, according to [49]. These criteria are validity, reliability, computability, ease of implementation, independence, and intuitiveness. Generally, the survey research scales may vary from two to ten points or more. Two- or three-point scales are infrequently utilized because they offer insufficient choice. Furthermore, seven- to ten-point scales, while they provide a finer degree of discrimination, are rarely used because it is questionable as to whether respondents can differentiate enough to make them valuable. Therefore, researchers have generally settled using four- or five-point scales for satisfaction research. Using a four-point scale can be effectively discriminate between satisfied and unsatisfied respondents because there is no neutral or middle option. However, some researchers [97] argue that such a clear division may cause hesitation for respondents who are neither satisfied nor dissatisfied regarding survey items. Moreover, the respondents often choose a positive response without a midpoint option, which affects the accuracy and creates positively skewed data. For these reasons, the five-point scale is utilized in this article. The score sheet is designed to be a practical way of customizing the factors and their weights. It also has a visual reporting mechanism using a spider diagram. Spider diagramming is widely used within the project management domain, especially in the work of [98] with project maturity, where similar profile models were developed using different categories. This score sheet is designed to provide early warning signs of factors with a high contribution to the project’s complexity, along with the possibility of comparing and contrasting other projects. A customized version with criteria related to the specificities of a vehicle development project of an auto manufacturer was used; a brainstorming procedure was applied in order to weigh each framework and factor inside each category as explained in Table 4. In the evaluation process, experts could evaluate the contribution of each factor on project complexity from “very weak” (1) to “very strong” (5), as mentioned in Table 3.
The increase of complexity in vehicle development projects has changed the project structure from hierarchical to network structured. This framework was tested on several vehicle development projects within the auto manufacturer. A complexity comparison between several vehicle development projects was conducted. For instance, Project X developed an electric vehicle, and Project Y developed a newly designed thermal car. An example of a product complexity factor is technological innovation with cost constraints, requiring a greater level of engineering skills. In the electric vehicle project, more than sixty innovation patents were deposited. The interdependence of components made implementing the electrical technology more challenging because the parts handling, joining, and fastening were very exigent on a sub-system or vehicle level. The new design features and increased degree of customization have increased the demand for creativity during the thermal car project.
An example of environmental complexity factor is offering more environmentally friendly vehicles like the zero-emission electric cars and reduced emission thermal cars with the constraints imposed by the recharging infrastructure of electric vehicles that trigger rigorous technical requirements on the developed vehicles. An example of stakeholders’ factors is the challenges and opportunities for vehicle development projects associated with multi-type and networked relationships between these projects and their various stakeholders. Moreover, the international dimension of the projects (developed and industrialized in different countries) increases project coordination complexity. The manufacturer–supplier relation and suppliers’ geographical localization must be anticipated because they directly impact the project delay [99].

5.3. Applying Fuzzy TOPSIS Method to Measure Complexity of Vehicle Development Projects

In this section, the fuzzy TOPSIS method is used to sort some vehicle projects based on their complexity. In this case, the criteria are the categories of the project complexity framework (C1: project governance, C2: project characteristics, C3: product, C4: project team/actors, C5: stakeholders, C6: resources, C7: environment). The alternatives, in this case, are project P1, project P2, and project P3. In this case, the number of alternatives is three, and the number of criteria is seven.
The criteria (complexity categories) have different weights, as described in Table A6 in Appendix A. These weights are highly dependent on the type of project. These weights show the importance of each criterion in the decision-making procedure. In real applications, these weights should be determined by the project manager, who evaluates how much each criterion affects the complexity of the project in a linguistic description (from very low to very high, as described in Table 4). Inside each category, the project manager assesses how much each factor affects its category’s complexity in a linguistic description (from very low to very high, as described in Table 4). After collecting the data concerning the criteria weights and factors weights, the project manager gives the rating of all factors in a linguistic description (from very weak to very strong), as illustrated in Table 3.
This empirical study followed the below seven steps to compare project complexity using the fuzzy TOPSIS method.
Step 1. Determining the appropriate linguistic variables for the rating and the importance weight of category and factor, as shown in Table 3 and Table 4.
Step 2. Evaluating W F ˜ , w c ˜ i , and D ˜ k matrices by using Equations (A6)–(A8) in Appendix B. Table A7 in Appendix A shows the weighting of the complexity factors ( W F ˜ ) depending on linguistic variables and weights. Table A8 in Appendix A shows the rating of all complexity factors for three projects ( D ˜ k ), depending on linguistic variables and weights.
Step 3. Calculating the fuzzy weighted average matrix ( V k ˜ ) for each project k by applying Equations (A9) and (A10) in Appendix B. Table 5 shows the weighted average of fuzzy ratings and fuzzy factor weights.
Step 4. Calculating the normalized weighted matrix ( R ˜ ) by applying Equations (A11)–(A13) in Appendix B. Table 6 shows the normalized fuzzy matrix.
Step 5. Constructing the weighted normalized fuzzy matrix ( Y ˜ ) by multiplying category weights with normalized matrix by using Equations (A14) and (A15) in Appendix B. Table 7 shows the weighted normalized matrix.
Step 6. Determining the fuzzy positive ideal solution (FPIS) and the fuzzy negative ideal solution (FNIS) by using Equations (A16) and (A17) in Appendix B. Later, calculate each alternative’s distances to positive and negative ideal solution by Equations (A18) and (A19) in Appendix B. Table 8 shows the distance of each project category to FPIS and FNIS.
Step 7. Computing the closeness coefficient index (CCI) of each project by using Equation (A20) in Appendix B.
The result shows that P2 has the highest CCI value. The complexity of project 2 is the highest compared to alternative projects. Table 9 shows the ordering results.
Instead of crisps numbers, linguistic variables are adopted to determine the weights and the rankings. The relative closeness coefficient is calculated, and ranking is determined.
Table 10 shows the weighted ranking values for each project, and highlight the comparison between categories.
Since project P2 is more complex than the other projects, the effect of categories is also investigated in Figure 5.
The probabilistic (probability degree-based) approach is applied in the paper to order fuzzy numbers. It is based on the α–cuts representation of fuzzy numbers since it can be used regardless of the membership function type. As [100] suggested, the order of triangular fuzzy number is calculated with the below formula:
Let M ˜ = (a1, b1, c1) and N ˜ = (a2, b2, c2) be two triangular fuzzy numbers,
P ( N ˜ > M ˜ ) = 1 ( c 1 a 2 ) 2 2 * ( c 1 a 1 ) ( c 2 a 2 )
The effect of the complexity of category 3 has a higher probability than other categories. With a probability of 0.56, category 3 has more effect on project complexity than category 1. Table 11 shows the result of the category comparison.
Finally, the conclusion of this problem is that project P2 is the most complex project of the three projects, and project P1 is the project with the smallest global complexity. Project P1 is the development of a new version of a small family car produced by the automotive manufacturer since 2000. Project P2 is the development of a new electric vehicle, whose technical content and architecture include many innovations. Project P3 is the development of a new vehicle based on a new master schedule-timeline that has not been proven on a previous project. The obtained results are close to the project stakeholders’ perceived complexity because the electric vehicle has more technical and architectural innovations than the other projects.
Moreover, project P3 is perceived as more complex than project P1 because P3 is based on a novel process and schedule while P1 is a classical project without many innovations. Measuring project complexity permits us to understand what the principal areas of complexity are. This measurement helps project managers to link the complexity rating system to decide on the level of proactive actions needed. For instance, we can highlight projects in a portfolio that need particular attention and monitoring or highlight areas and zones inside the project that require a specific analysis and monitoring. These final results permit the realization of a ranking of projects according to a complexity scale/index (from 0 to 1), as shown in Table 10.

5.4. Interpretation of Results

The existence of a relative numerical evaluation of project complexity within a project portfolio appears to be promising since it permits to know which projects are to be the most complex ones, but also how complex projects are. The definition of project complexity scores within a portfolio is now considered as a way to generate discussions within teams with an array of future possibilities, for instance, defining a threshold value (or three threshold values since dealing with fuzzy numbers) over/below which projects could be rejected/accepted (notably given the experience and project maturity of the firm). As a whole, such an approach promotes greater collaboration and experience sharing as the differences between a priori complexity rankings and the ones obtained after complexity evaluation appeared to be mostly the consequence of some communication problems and psychological barriers. The case study indeed pointed out a tendency to a priori over-assessment of some projects’ complexity level due to miscommunication and fear/risk aversion. The use of an unbiased method to calculate a complexity score within a project portfolio or areas of a same project such as the fuzzy TOPSIS one presented here permits to facilitate discussions and reach greater consensus when dealing with project complexity-driven issues.
As project complexity increases, higher communication frequencies will be needed to achieve optimal performance, such as email occurring at the lowest communication frequency, phone communication next, and face-to-face (personally) communication at the highest [101]. This method requires a very accurate design of the various candidates’ score matrix concerning the multiple criteria. Furthermore, accurate information about the weights assigned to each criterion plays a crucial role.

6. Conclusions

This research’s proposed complexity model is validated by project practitioners and the literature review, reliable, computable, independent, intuitive, and user friendly. Therefore, according to [49], this model fits a project complexity measurement tool.
The framework presented in this article shows how the theory of project complexity assessment can be applied to vehicle development projects. The testing was done retrospectively on completed projects, and testing on a significant number of ongoing projects is essential to ensure that the framework functions appropriately. Using this framework during the project’s upstream phase reports interesting indicators to project practitioners. Consequently, some complexity-related issues can be anticipated. Due to the dynamic aspects of each project, real-time testing and analysis between milestones would be required. The limitation of this study is not testing the measurement model within several industrial sectors.
The performance of a project is related to its complexity. More complex projects may require an additional level of control. This paper’s primary goal has been to give the project complexity a framework to better describe and measure it. In terms of practicality, the findings provide a framework that offers relevant indicators for key actors to anticipate and make better decisions to control the project’s progress. This paper proposed a framework of identified and classified project complexity factors that might be integrated into the exploratory phase of a complexity impact analysis. It may also be used to capture and structure its possible consequences and ensure that these are managed appropriately. Due to the project’s dynamic aspect, repeated use during the different phases of a project is expected. Establishing an objective and standardized measure permits retrospective analysis of previous projects. That is needed to assess the impact of complexity sources on achieving project goals and their influence on the cost and the staffing level.
Applying the proposed framework in the project’s upstream stage permits to highlight areas with high complexity. Consequently, it allows anticipating their impact by comparing to other projects and planning mitigation actions to reduce complexity-induced risks. Some examples of risk mitigation actions are adopting a simpler process, choosing a more stable supplier, or increasing communication frequencies between actors. A vital improvement of the proposed framework would be introducing more precise evaluation aids by enumerating more objective questions for each factor and developing a shared database of results that improve and grow with every use.
To conclude, a high-level factor-based descriptive modeling was proposed in this paper. It permits to measure and prioritize areas and domains where complexity may have the highest impact. In the industrial application of this work, complexity ratings were linked directly to levels of action. Project managers could use the project complexity rating system to decide on the level of proactive actions needed. In this approach, the level of necessary proactive action results from a combination of both project complexity and risk criticality. This differs from traditional risk management approaches, which classically link actions to risk criticality but not to project complexity.
Finally, project complexity will remain a critical challenge for many industrial companies, especially in the fourth industrial revolution (Industry 4.0) era [102]. Future work might investigate the optimal complexity regulation strategies for projects in Industry 4.0 context.

Author Contributions

This article is a joint work of the five authors. H.J., F.M., L.-A.V. and I.S. prepared the conceptualization and methodology; H.J. and L.D. collected the data; I.S. made the software development for fuzzy analysis; H.J. wrote the original draft; all authors reviewed and edited the paper; F.M. and L.D. supervised the work and managed this research project. All authors have read and agreed to the published version of the manuscript.

Funding

This research received no external funding.

Institutional Review Board Statement

Not applicable.

Informed Consent Statement

Not applicable.

Data Availability Statement

Data which are not included in the paper are not available, due to confidentiality reasons.

Acknowledgments

The authors would like to thank all participants from the auto manufacturer involved for their excellent cooperation.

Conflicts of Interest

The authors declare that there are no conflicts of interest regarding the publication of this paper.

Appendix A

Table A1. Complexity factors related to the project governance.
Project GovernanceEvaluate the Contribution of Each Factor from 1 (Very Weak) to 5 (Very Strong).Assistance in Assessing: You Can Think of:Sources
1.
Processes interdependence
To what extent does the processes’ interdependence contribute to project complexity?Number and nature of dependencies between processes?[53]
2.
Organizational degree of innovation
To what extent does the organizational degree of innovation contribute to project complexity?Are there organizational innovations?[53]
3.
Number of deliverables
To what extent does the number of deliverables contribute to project complexity? [53]
4.
Number of activities
To what extent does the number of activities contribute to project complexity? [53]
5.
Variety of project management methods and tools applied
To what extent does the variety of applied project management methods and tools contribute to project complexity? [53,103]
6.
Number of decisions to be made
To what extent does the number of decisions to be made contribute to project complexity? [53,81]
7.
Level of interrelations between phases
To what extent does the level of interrelations between phases contribute to project complexity? [53,81]
8.
Dependencies with the environment
To what extent do the dependencies with the environment contribute to project complexity?Is the project dependent and highly influenced by environmental factors?[53,81]
9.
Interconnectivity and feedback loops in the task and project networks
To what extent do the interconnectivity and feedback loops in the task and project networks contribute to project complexity? [53,81]
Table A2. Complexity factors related to the project characteristics.
Project CharacteristicsEvaluate the Contribution of Each Factor from 1 (Very Weak) to 5 (Very Strong).Assistance in Assessing: You Can Think of:Sources
  • Number of objectives
To what extent does the number of objectives contribute to project complexity? [53,81]
2.
Alignment of objectives
To what extent does the alignment of objectives contribute to project complexity?Are the project objectives aligned?[53]
3.
Interdependence of objectives
To what extent does the interdependence of objectives contribute to project complexity?How many dependencies between projects are there?[80]
4.
Scope largeness
To what extent does the scope largeness contribute to project complexity?What is the largeness of the scope?[53,77]
5.
Duration of the project
To what extent does the project duration contribute to project complexity?What is the expected duration of the project?[53,82]
6.
Dependencies between schedules
To what extent do the dependencies between schedules contribute to project complexity?How many interdependencies between the schedules are there?[1]
7.
The largeness of capital investment
To what extent does the largeness of capital investment contribute to project complexity?What is the total capital investment?[1]
8.
Support and priority level of the project in the company
To what extent does the project’s priority level within the company contributes to project complexity?Is the project of high priority and elevated support level within the organization?[103]
Table A3. Complexity factors related to the product.
ProductEvaluate the Contribution of Each Factor from 1 (Very Weak) to 5 (Very Strong).Assistance in Assessing: You Can Think of:Sources
1.
Number of functions to be designed
To what extent does the number of functions to be designed contributes to project complexity? [5]
2.
Number of components and number of new components
To what extent do the number of components and the number of new components contribute to project complexity?The number of new components = Expected number of parts − the number of carry-over parts.[53]
3.
Number of subsystems/integration complexity
To what extent does the number of subsystems contribute to project complexity?Number of technical systems requiring integration and the nature of the interfaces[87,104]
4.
Variety of the product components
To what extent does the variety of product components contribute to project complexity? [23,53]
5.
Interdependence between the components of the product
To what extent does the interdependence between the product components contribute to project complexity? [53,105]
6.
Technology maturity
To what extent does the technology maturity contribute to project complexity?Are new technologies such as unproven technologies used in the project?[53,86]
7.
Variety of the technologies used during the project
To what extent does the variety of the technologies used during the project contribute to project complexity? [53,71,86]
8.
Technological degree of innovation
To what extent does the technological degree of innovation contribute to project complexity?Number of innovations applicable to the product’ parts[53,71,106]
9.
Technological process dependencies
To what extent do the technological process dependencies contribute to project complexity? [53]
10.
Variety of technological dependencies
To what extent does the variety of technological dependencies contribute to project complexity?Number of heterogeneity dependencies[53]
11.
Change of specifications
To what extent does the change of specifications contribute to project complexity?Do you expect a change in specifications during the project?[87]
12.
Specifications interdependence
To what extent does the specifications’ interdependence contribute to project complexity? Brainstorming
13.
Feasibility and technical difficulty of the design
To what extent do the feasibility and technical difficulty of the design contribute to project complexity? Brainstorming
14.
Time to market
To what extent does the time to market contributes to project complexity? [87]
15.
Variety of manufacturing processes between factories
To what extent does the variety of manufacturing processes between factories contribute to project complexity? Brainstorming
16.
Customization degree, option variability
To what extent does the customization degree of the product contribute to project complexity? Brainstorming
17.
Number of iterations to refine the product
To what extent does the number of iterations to refine the product contribute to project complexity? [87]
Table A4. Complexity factors related to the project resources.
ResourcesEvaluate the Contribution of Each Factor from 1 (Very Weak) to 5 (Very Strong).Assistance in Assessing: You Can Think of:Sources
  • Number and quantity of resources
To what extent do the number and quantity of resources contribute to project complexity? [53,81]
2.
Number of companies/projects sharing their resources
To what extent does the number of companies/projects sharing their resources contribute to project complexity? [53,81]
3.
Number of information systems
To what extent does the number of information systems contribute to project complexity? [53,81]
4.
Variety of information systems to be combined
To what extent does the variety of information systems to be combined contribute to project complexity? [53,81]
5.
The interdependence of information systems
To what extent does the interdependence of information systems contribute to project complexity? [53,81]
6.
Variety of financial resources
To what extent does the variety of financial resources contribute to project complexity? [53,81]
7.
Computational capacity
To what extent does the computational capacity contribute to project complexity?Does the project have a suitable computational capacity?Brainstorming
8.
Availability of people, material, and any resources due to sharing
To what extent does the availability of people, material, and any resources due to sharing contribute to project complexity?Are human resources and materials shared across projects? What is the availability of key experts?[53]
9.
Variety of technical resources to be manipulated
To what extent does the variety of technical resources to be manipulated contribute to project complexity? [53]
10.
Resource and raw material interdependencies
To what extent do the resource and raw material interdependencies contribute to project complexity? [53]
11.
The flexibility of project budgets/financial resources
To what extent does the flexibility of project budgets/financial resources contribute to project complexity?How flexible are project budgets/financial resources?[67,82,107]
12.
Project manager control over resource selection
To what extent does the project manager’s control over resource selection contribute to project complexity?Does the project manager have control over resource selection?[67]
13.
Combined transportation (supply/shipping)
To what extent does the combined transportation contribute to project complexity? [53]
Table A5. Complexity factors related to the environment.
Environment(Factor Number. Description)Evaluate the Contribution of Each Factor from 1 (Very Weak) to 5 (Very Strong).Assistance in Assessing: You Can Think of:Sources
  • Level of competition
To what extent does the level of competition contribute to project complexity?What is the level of competition (e.g., related to market conditions)?[53,71]
2.
Partnership and multi-firm alliances
To what extent do the partnership and multi-firm alliances contribute to project complexity?Do you cooperate with other partners in the project?Brainstorming
3.
Technological/organizational complexity of the environment
To what extent does the technological/organizational complexity of the environment contribute to project complexity? [53]
4.
Contract types
To what extent do the contract types contribute to project complexity?Are there different main contract types involved?[53,71]
5.
Local standards, laws, and regulations
To what extent do the local standards, laws, and regulations contribute to project complexity? [53,71]
6.
New standards, laws, and regulations
To what extent do the new standards, laws, and regulations contribute to project complexity? [53]
7.
Demand for creativity
To what extent does the demand for creativity contribute to project complexity? [53]
8.
Institutional configuration
To what extent does the institutional configuration contribute to project complexity?How well and how clearly does the project align with the institutional configuration?[53]
9.
Culture configuration and variety
To what extent do the culture configuration and variety contribute to project complexity?Number of different languages, number of different nationalities[51,53,70,71]
10.
Significance on public agenda
To what extent does the significance on a public agenda contribute to project complexity?Is the project related to a public agenda?[53]
11.
Variety of standards between development and industrialization, and between sites
To what extent does the variety of standards between development and industrialization and between sites contribute to project complexity? Brainstorming
12.
HSSE awareness
To what extent does the HSSE awareness contribute to project complexity?Are involved parties aware of health, safety, security, and environmental (HSSE) importance?[70]
13.
Weather conditions
To what extent do the weather conditions contribute to project complexity?Do you expect unstable or extreme weather conditions; could they potentially influence the project progress?[70,71]
14.
Influence of the public perception on the project
To what extent does the influence of the public perception on the project contribute to project complexity? [103]
Table A6. Category weights.
CategoriesWeightsFuzzy
C1: Project governance5(0.8;1;1)
C2: Project characteristics5(0.8;1;1)
C3: Product5(0.8;1;1)
C4: Project team/actors5(0.8;1;1)
C5: Stakeholders5(0.8;1;1)
C6: Resources5(0.8;1;1)
C7: Environment4(0.6;0.8;1)
Table A7. Factors weights.
Factors
CategoriesFactor1FuzzyFactor2FuzzyFactor3FuzzyFactor4FuzzyFactor5FuzzyFactor6Fuzzy
C15(0.8;1;1)5(0.8;1;1)5(0.8;1;1)5(0.8;1;1)5(0.8;1;1)4(0.6;0.8;1)
C25(0.8;1;1)5(0.8;1;1)5(0.8;1;1)5(0.8;1;1)5(0.8;1;1)5(0.8;1;1)
C34(0.6;0.8;1)4(0.6;0.8;1)5(0.8;1;1)5(0.8;1;1)5(0.8;1;1)5(0.8;1;1)
C43(0.4;0.6;0.8)4(0.6;0.8;1)5(0.8;1;1)4(0.6;0.8;1)5(0.8;1;1)4(0.6;0.8;1)
C54(0.6;0.8;1)4(0.6;0.8;1)4(0.6;0.8;1)5(0.8;1;1)4(0.6;0.8;1)4(0.6;0.8;1)
C64(0.6;0.8;1)4(0.6;0.8;1)3(0.4;0.6;0.8)3(0.4;0.6;0.8)3(0.4;0.6;0.8)4(0.6;0.8;1)
C74(0.6;0.8;1)4(0.6;0.8;1)4(0.6;0.8;1)4(0.6;0.8;1)4(0.6;0.8;1)4(0.6;0.8;1)
CategoriesFactor7FuzzyFactor8FuzzyFactor9FuzzyFactor10FuzzyFactor11FuzzyFactor12Fuzzy
C14(0.6;0.8;1)4(0.6;0.8;1)5(0.8;1;1)
C25(0.8;1;1)5(0.8;1;1)
C35(0.8;1;1)5(0.8;1;1)5(0.8;1;1)5(0.8;1;1)5(0.8;1;1)5(0.8;1;1)
C44(0.6;0.8;1)4(0.6;0.8;1)5(0.8;1;1)5(0.8;1;1)5(0.8;1;1)5(0.8;1;1)
C54(0.6;0.8;1)5(0.8;1;1)5(0.8;1;1)5(0.8;1;1)5(0.8;1;1)
C63(0.4;0.6;0.8)4(0.6;0.8;1)4(0.6;0.8;1)4(0.6;0.8;1)5(0.8;1;1)5(0.8;1;1)
C75(0.8;1;1)3(0.4;0.6;0.8)4(0.6;0.8;1)4(0.6;0.8;1)4(0.6;0.8;1)4(0.6;0.8;1)
CategoriesFactor13FuzzyFactor14FuzzyFactor15FuzzyFactor16FuzzyFactor17Fuzzy
C1
C2
C35(0.8;1;1)5(0.8;1;1)5(0.8;1;1)5(0.8;1;1)5(0.8;1;1)
C45(0.8;1;1)5(0.8;1;1)4(0.6;0.8;1)5(0.8;1;1)4(0.6;0.8;1)
C5
C65(0.8;1;1)
C73(0.4;0.6;0.8)4(0.6;0.8;1)
Table A8. Factors rates.
Factors
CategoriesProjectsFactor1FuzzyFactor2FuzzyFactor3FuzzyFactor4FuzzyFactor5FuzzyFactor6Fuzzy
C1P14(3;4;5)3(2;3;4)4(3;4;5)5(4;5;5)1(1;1;2)4(3;4;5)
P24(3;4;5)4(3;4;5)5(4;5;5)5(4;5;5)2(1;2;3)4(3;4;5)
P34(3;4;5)5(4;5;5)3(2;3;4)5(4;5;5)2(1;2;3)4(3;4;5)
C2P12(1;2;3)4(3;4;5)1(1;1;2)3(2;3;4)2(1;2;3)4(3;4;5)
P23(2;3;4)4(3;4;5)1(1;1;2)3(2;3;4)2(1;2;3)4(3;4;5)
P32(1;2;3)4(3;4;5)1(1;1;2)3(2;3;4)2(1;2;3)5(4;5;5)
C3P12(1;2;3)4(3;4;5)2(1;2;3)5(4;5;5)4(3;4;5)4(3;4;5)
P24(3;4;5)4(3;4;5)2(1;2;3)5(4;5;5)4(3;4;5)5(4;5;5)
P33(2;3;4)4(3;4;5)2(1;2;3)5(4;5;5)4(3;4;5)3(2;3;4)
C4P12(1;2;3)2(1;2;3)4(3;4;5)2(1;2;3)3(2;3;4)4(3;4;5)
P22(1;2;3)2(1;2;3)4(3;4;5)3(2;3;4)3(2;3;4)4(3;4;5)
P32(1;2;3)2(1;2;3)4(3;4;5)3(2;3;4)3(2;3;4)4(3;4;5)
C5P12(1;2;3)3(2;3;4)3(2;3;4)2(1;2;3)2(1;2;3)3(2;3;4)
P24(3;4;5)3(2;3;4)3(2;3;4)2(1;2;3)3(2;3;4)3(2;3;4)
P33(2;3;4)3(2;3;4)3(2;3;4)2(1;2;3)2(1;2;3)3(2;3;4)
C6P12(1;2;3)2(1;2;3)3(2;3;4)3(2;3;4)2(1;2;3)3(2;3;4)
P22(1;2;3)2(1;2;3)3(2;3;4)3(2;3;4)2(1;2;3)3(2;3;4)
P32(1;2;3)2(1;2;3)3(2;3;4)3(2;3;4)2(1;2;3)3(2;3;4)
C7P13(2;3;4)5(4;5;5)4(3;4;5)2(1;2;3)2(1;2;3)3(2;3;4)
P25(4;5;5)5(4;5;5)5(4;5;5)4(3;4;5)4(3;4;5)3(2;3;4)
P34(3;4;5)5(4;5;5)4(3;4;5)3(2;3;4)3(2;3;4)3(2;3;4)
CategoriesProjectsFactor7FuzzyFactor8FuzzyFactor9FuzzyFactor10FuzzyFactor11FuzzyFactor12Fuzzy
C1P12(1;2;3)3(2;3;4)4(3;4;5)
P22(1;2;3)5(4;5;5)5(4;5;5)
P33(2;3;4)4(3;4;5)4(3;4;5)
C2P15(4;5;5)3(2;3;4)
P25(4;5;5)3(2;3;4)
P34(3;4;5)3(2;3;4)
C3P12(1;2;3)3(2;3;4)5(4;5;5)3(2;3;4)4(3;4;5)2(1;2;3)
P24(3;4;5)5(4;5;5)5(4;5;5)3(2;3;4)5(4;5;5)3(2;3;4)
P33(2;3;4)3(2;3;4)5(4;5;5)3(2;3;4)4(3;4;5)2(1;2;3)
C4P12(1;2;3)3(2;3;4)3(2;3;4)2(1;2;3)2(1;2;3)4(3;4;5)
P22(1;2;3)3(2;3;4)5(4;5;5)5(4;5;5)3(2;3;4)5(4;5;5)
P32(1;2;3)3(2;3;4)3(2;3;4)2(1;2;3)2(1;2;3)4(3;4;5)
C5P12(1;2;3)2(1;2;3)1(1;1;2)4(3;4;5)3(2;3;4)
P22(1;2;3)4(3;4;5)1(1;1;2)5(4;5;5)4(3;4;5)
P32(1;2;3)2(1;2;3)1(1;1;2)4(3;4;5)3(2;3;4)
C6P13(2;3;4)5(4;5;5)3(2;3;4)3(2;3;4)4(3;4;5)4(3;4;5)
P23(2;3;4)5(4;5;5)5(4;5;5)4(3;4;5)4(3;4;5)4(3;4;5)
P33(2;3;4)5(4;5;5)4(3;4;5)3(2;3;4)4(3;4;5)4(3;4;5)
C7P13(2;3;4)2(1;2;3)3(2;3;4)1(1;1;2)4(3;4;5)4(3;4;5)
P25(4;5;5)2(1;2;3)3(2;3;4)3(2;3;4)4(3;4;5)5(4;5;5)
P34(3;4;5)2(1;2;3)3(2;3;4)1(1;1;2)4(3;4;5)4(3;4;5)
CategoriesProjectsFactor13FuzzyFactor14FuzzyFactor15FuzzyFactor16FuzzyFactor17Fuzzy
C1P1
P2
P3
C2P1
P2
P3
C3P13(2;3;4)3(2;3;4)5(4;5;5)3(2;3;4)3(2;3;4)
P24(3;4;5)4(3;4;5)3(2;3;4)3(2;3;4)4(3;4;5)
P33(2;3;4)4(3;4;5)3(2;3;4)3(2;3;4)3(2;3;4)
C4P11(1;1;2)1(1;1;2)3(2;3;4)5(4;5;5)1(1;1;2)
P22(1;2;3)1(1;1;2)5(4;5;5)4(3;4;5)1(1;1;2)
P32(1;2;3)1(1;1;2)4(3;4;5)3(2;3;4)1(1;1;2)
C5P1
P2
P3
C6P12(1;2;3)
P24(3;4;5)
P33(2;3;4)
C7P12(1;2;3)2(1;2;3)
P22(1;2;3)4(3;4;5)
P32(1;2;3)2(1;2;3)

Appendix B

Definition 1.
Let X be the universe of discourse. A fuzzy set à of X is characterized by a membership function μÃ(x), where μà (x): X → [0, 1] indicates the degree of x ∈ X in A.
One of the most frequently applied membership functions is the triangular function, which transforms input variables into fuzzy variables with simple calculations.
Definition 2.
A triangular fuzzy number can be defined as a triplet (a, b, c); the membership function of the fuzzy number à is defined as:
μ Ã ( x ) = { x a b a ,   a x b , c x c b ,   b < x c , 0 ,   o t h e r s .
Definition 3.
Let M ˜ = (a1, b1, c1) and N ˜ = (a2, b2, c2) be two triangular fuzzy numbers, then the distance between them using vertex method [108] is defined as;
d ( M ˜ , N ˜ ) = 1 / 3 [ ( a 1 a 2 ) 2 + ( b 1 b 2 ) 2 + ( c 1 c 2 ) 2 ]
Arithmetic operations with fuzzy numbers:
Let M ˜ = (a1, b1, c1) and N ˜ = (a2, b2, c2) be two triangular fuzzy numbers, then arithmetic operations are defined as follows:
M ˜ N ˜ = ( a 1 , b 1 , c 1 ) ( a 2 , b 2 , c 2 ) = ( a 1 + a 2 , b 1 + b 2 , c 1 + c 2 )
M ˜ N ˜ = ( a 1 , b 1 , c 1 ) ( a 2 , b 2 , c 2 ) = ( a 1 × a 2 , b 1 × b 2 , c 1 × c 2 )
k M ˜ =   ( ka 1 , kb 1 , kc 1 )
Assume that DMs evaluate the complexity of k projects. Let w f ˜ i j present the fuzzy importance weight of category i M and factor j N , w c ˜ i presents the weight of the ith category, x ˜ i j k presents the rating of project k ∈ P for category i and factor j. The matrix format of the problem is expressed as follows:
W F ˜ = [ w f ˜ 11 w f ˜ 1 n w f ˜ m 1 w f ˜ m n ] ,
w c ˜ i = [ w c ˜ 1 ,   w c ˜ 2 , ,   w c ˜ m ] ,  
D ˜ k = [ x ˜ 11 k x ˜ 1 n k x ˜ m 1 k x ˜ m n k ]
x ˜ i j = (aij, bij, cij), w f ˜ i j = (eij, fij, gij) and w c ˜ i (ui, vi, zi). i I ,   and   j   J , where I and J is the set of category and factors respectively.
The weighted average fuzzy matrix can be calculated considering each factor’s different weights by multiplying the factors’ importance weights and the rates in a fuzzy matrix and taking the average.
Let V k ˜ denote the weighted average matrix for each project k,
V k ˜ = [ v ˜ i k ] m x 1
v i k ˜ = 1 N [ ( w f ˜ i 1 x ˜ i 1 k ) ( w f ˜ i 2 x ˜ i 2 k ) ( w f ˜ i n x ˜ i n k ) ]
By normalizing the values, anomalies with different measurement units and scales will be eliminated, and it will make the criteria comparable. Triangular fuzzy numbers will be normalized with the below linear scale transform normalization function:
Let R ˜ denote the normalized fuzzy matrix,
R ˜ = [ r ˜ i ] m x 1
r ˜ i = ( a i c * ,   b i c * ,   c i c * )
c * = max i c i ,   i M
The weighted normalized fuzzy matrix is calculated considering each category’s different weights by multiplying the category’s importance weights and the normalized weighted average rates fuzzy matrix.
Let Y ˜ denote the weighted normalized fuzzy matrix,
Y ˜ = [ y ˜ i ] m x 1 ,
y ˜ i = w c ˜ i r ˜ i
Now, y ˜ i [ 0 , 1 ] ,   for   i   M .
The fuzzy positive ideal solution (FPIS, S+) and the fuzzy negative ideal solution (FNIS, S-) define as follows respectively;
S + = ( s 1 ˜ + ,   s 2 ˜ + , , s m ˜ + )
S = ( s 1 ˜ , s 2 ˜ , , s m ˜ )
where s i ˜ + = ( 1 ,   1 ,   1 ) and s i ˜ = ( 0 ,   0 ,   0 ) , for   i   M .
The distance from the fuzzy positive ideal solution (FPIS) and fuzzy negative ideal solution (FNIS) for each project, using the distance measurement between two fuzzy numbers (given in Definition 3), is derived respectively as:
d k + = i = 1 N d ( y i ˜ , s i ˜ + ) ,   k P
d k = i = 1 N d ( y i ˜ , s i ˜ ) ,   k P
The closeness coefficient index (CCI) of each alternative project is calculated as follows:
C C I k = d k d k + d k + ,   k P
The higher closeness coefficient index value shows that the alternative is far from the fuzzy negative ideal solution and close to the fuzzy positive ideal solution. As a result, the project has a higher CC will get a high-ranking order.

References

  1. Cicmil, S.; Cooke-Davies, T.; Crawford, L.; Richardson, K. Exploring the Complexity of Projects: Implications of Complexity Theory for Project Management Practice; Project Management Institute: Pennsylvania, PA, USA, 2009. [Google Scholar]
  2. Warren, A.M. Increasing the Value of Research: A Comparison of the Literature on Critical Success Factors for Projects, IT Projects and Enterprise Resource Planning Projects. Systems 2016, 4, 33. [Google Scholar] [CrossRef] [Green Version]
  3. Kliestik, T.; Misankova, M.; Valaskova, K.; Svabova, L. Bankruptcy Prevention: New Effort to Reflect on Legal and Social Changes. Sci. Eng. Ethics 2018, 24, 791–803. [Google Scholar] [CrossRef]
  4. Podhorska, I.; Vrbka, J.; Lazaroiu, G.; Kovacova, M. Innovations in Financial Management: Recursive Prediction Model Based on Decision Trees. Mark. Manag. Innov. 2020, 276–292. [Google Scholar] [CrossRef]
  5. Griffin, A. The Effect of Project and Process Characteristics on Product Development Cycle Time. J. Mark. Res. 1997, XXXIV, 24–35. [Google Scholar] [CrossRef]
  6. Schleich, H.; Schaffer, J.; Scavarda, L.F. Managing Complexity in Automotive Production. In Proceedings of the 19th International Conference on Production Research, Valparaiso, Chile, 29 August–2 September 2007; p. 6. [Google Scholar]
  7. Butler, C.W.; Vijayasarathy, L.R.; Roberts, N. Managing Software Development Projects for Success: Aligning Plan- and Agility-Based Approaches to Project Complexity and Project Dynamism. Proj. Manag. J. 2020, 51, 262–277. [Google Scholar] [CrossRef]
  8. Gorod, A.; Hallo, L.; Ireland, V.; Gunawan, I. Evolving Toolbox for Complex Project Management; Taylor & Francis Group: Oxfordshire, UK, 2020. [Google Scholar]
  9. Jaber, H. Modeling and Analysis of Propagation Risks in Complex Projects: Application to the Development of New Vehicles; Université Paris Saclay, CentraleSupelec: Paris, France, 2016. [Google Scholar]
  10. Crawford, L. Developing Organizational Project Management Capability: Theory and Practice. Proj. Manag. J. 2006, 37, 74–97. [Google Scholar] [CrossRef]
  11. Frame, J.D. The New Project Management: Tools for an Age of Rapid Change, Complexity, and Other Business Realities, 2nd ed.; The Jossey-Bass Business & Management Series; Jossey-Bass: San Francisco, CA, USA, 2002; ISBN 978-0-7879-5892-3. [Google Scholar]
  12. Williams, T. Modelling Complex Projects; Wiley: New York, NY, USA, 2002; ISBN 0-471-89945-3. [Google Scholar]
  13. Baccarini, D. The Concept of Project Complexity a Review. Int. J. Proj. Manag. 1996, 14, 201–204. [Google Scholar] [CrossRef] [Green Version]
  14. Tatikonda, M.V.; Rosenthal, S.R. Technology Novelty, Project Complexity, and Product Development Project Execution Success: A Deeper Look at Task Uncertainty in Product Innovation. IEEE Trans. Eng. Manag. 2000, 47, 74–87. [Google Scholar] [CrossRef] [Green Version]
  15. Simon, H.A. The Sciences of the Artificial; MIT Press: Cambridge, MA, USA, 1996; ISBN 0-262-69191-4. [Google Scholar]
  16. Byrne, D. Complexity Theory and the Social Sciences: An Introduction; Routledge: Oxfordshire, UK, 1998. [Google Scholar]
  17. Waldrop, M.M. Complexity: The Emerging Science at the Edge of Order and Chaos; Touch-stone: New York, NY, USA, 1992. [Google Scholar]
  18. Thompson, J.D. Organizations in Action: Social Science Bases of Administrative Theory; Classics in organization and management; Mc Graw-Hill: New York, NY, USA, 1967. [Google Scholar]
  19. Anderson, P. Complexity Theory and Organization Science. Organ. Sci. 1999, 10, 216–232. [Google Scholar] [CrossRef] [Green Version]
  20. Fioretti, G.; Visser, B. A Cognitive Approach to Organizational Complexity. SSRN Electron. J. 2004. [Google Scholar] [CrossRef] [Green Version]
  21. Levy, D. Applications and Limitations of Complexity Theory in Organization Theory and Strat-Egy. In Handbook of Strategic Management, 2nd ed.; Rabin, J., Miller, G.J., Bartley Hildreth, W., Eds.; Marcel Dekker: New York, NY, USA, 2000. [Google Scholar]
  22. Morin, E. Introduction à La Pensée Complexe; Esf.: Paris, France, 1990; Volume 96. [Google Scholar]
  23. Le Moigne, J.L. La Théorie Du Système Général: Théorie de La Modélisation; Presses Universitaires de France: Paris, France, 1994. [Google Scholar]
  24. Putnam, H. Representation and Reality; MIT Press: Cambridge, MA, USA, 1988. [Google Scholar]
  25. Nicolis, G.; Prigogine, I. Exploring Complexity; Freeman and, Co.: New York, NY, USA, 1989. [Google Scholar]
  26. ISO/IEC 15288. Systems Engineering–System Lifecycle Processes; International Standardization Organization/International Electrotechnical Commission: Geneva, Switzerland, 2002. [Google Scholar]
  27. Vidal, L.; Marle, F. Understanding Project Complexity: Implications on Project Management. Kybernetes 2008, 37, 1094–1110. [Google Scholar] [CrossRef]
  28. Cilliers, P. Complexity and Postmodernism: Understanding Complex Systems; Rutledge: London, UK, 1998. [Google Scholar]
  29. Weaver Science and Complexity. Am. Sci. 1948, 36, 536–544.
  30. Stacey, R. Emerging Strategies for a Chaotic Environment. Long Range Plann. 1996, 29, 182–189. [Google Scholar] [CrossRef]
  31. Pourjavad, E.; Mayorga, R. Using a Fuzzy MCDM Approach to Measure Project Complexity: A Case Study. Int. J. Ind. Syst. Eng. 2018, 30, 103–124. [Google Scholar]
  32. Remington, K.; Zolin, R.; Turner, R. A Model of Project Complexity: Distinguishing Dimensions of Complexity from Severity. In Proceedings of the 9th International Research Network of Project Management Conference, Berlin, Geramny, 11–13 October 2009. [Google Scholar]
  33. Bredillet, C. Blowing Hot and Cold on Project Management. Proj. Manag. J. 2010, 44, 4–20. [Google Scholar] [CrossRef] [Green Version]
  34. Pointurier, C.; Marle, F.; Jaber, H. Managing a Complex Project Using a Risk-Risk Multiple Domain Matrix. In Proceedings of the 16th International DSM Conference: Risk and Change Management in Complex Systems, Paris, France, 2–4 July 2014. [Google Scholar]
  35. Capka, R. Megaprojects–They Are a Different Breed. Public Roads US Dep. Transp. 2004, 68, 1. [Google Scholar]
  36. Ellinas, C.; Allan, N.; Johansson, A. Towards Project Complexity Evaluation: A Structural Perspective. IEEE Syst. J. 2016, 1–12. [Google Scholar] [CrossRef] [Green Version]
  37. Remington, K.; Pollack, J. Tools for Complex Projects; Gower: Aldershot, UK; Burlington, VT, USA, 2007; ISBN 978-1-4094-0892-5. [Google Scholar]
  38. Gastel, B.; Day, R.A. How to Write and Publish a Scientific Paper, 8th ed.; Greenwood, an imprint of ABC-CLIO, LLC: Santa Barbara, CA, USA, 2016; ISBN 978-1-4408-4262-7. [Google Scholar]
  39. Patriotta, G. Crafting Papers for Publication: Novelty and Convention in Academic Writing: Crafting Papers for Publication. J. Manag. Stud. 2017, 54, 747–759. [Google Scholar] [CrossRef] [Green Version]
  40. Wood, H.L.; Ashton, P. Modelling Project Complexity. In Proceedings of the Euromed Conference 26th Annual ARCOM Conference. Association of Researchers in Construction Management, Leeds, UK, 6–8 September 2010; Volume 1111, p. 1120. [Google Scholar]
  41. Shannon, C.E. The Mathematical Theory of Communication. Bell Syst. Technol. J. 1948, 27, 379–423. [Google Scholar] [CrossRef] [Green Version]
  42. Gidado, K.I. Project Complexity: The Focal Point of Construction Production Planning. Constr. Manag. Econ. 1996, 14, 213–225. [Google Scholar] [CrossRef]
  43. Sinha, S.; Thomson, A.I.; Kumar, B. A Complexity Index for the Design Process. In Proceedings of the International Conference on Engineering Design, Glasgow, UK, 21 August 2001. [Google Scholar]
  44. Rad, E.K.M. Development of a Project Complexity Assessment Method for Energy Megaprojects. Ph.D. Thesis, Thesis for the degree of Doctor of Philosophy. Heriot-Watt University School of Energy, Geoscience, Infrastructures and Society, Edinburgh, UK, 2016. [Google Scholar]
  45. Kaimann, R.A. Coefficient of Network Complexity. Manag. Sci. 1974, 21, 119–239. [Google Scholar] [CrossRef]
  46. Davis, E.W. Project Network Summary Measures Constrained-Resource Scheduling. AIIE Trans 1975, 7, 132–142. [Google Scholar] [CrossRef]
  47. Vidal, L.-A. Thinking Project Management in The Age Of Complexity. Particular Implications on Project Risk Management; École Centrale Paris: Paris, France, 2009. [Google Scholar]
  48. Temperley, H.N.V. Graph Theory and Applications; John Wiley & Sons: Somerset, NJ, USA, 1982. [Google Scholar]
  49. Latva-Koivisto, A.M. Finding a Complexity Measure for Business Process Models. Hels. Univ. Technol. Syst. Anal. Lab. 2001. Available online: http://citeseerx.ist.psu.edu/viewdoc/summary?doi=10.1.1.25.2991 (accessed on 1 August 2020).
  50. Nassar, K.M.; Hegab, M.Y. Developing a Complexity Measure for Project Schedules. J. Constr. Eng. Manag. 2006, 132, 554–561. [Google Scholar] [CrossRef]
  51. Lu, Y.; Luo, L.; Wang, H.; Le, Y.; Shi, Q. Measurement Model of Project Complexity for Large-Scale Projects from Task and Organization Perspective. Int. J. Proj. Manag. 2015, 33, 610–622. [Google Scholar] [CrossRef]
  52. Owens, J.; Ahn, J.; Shane, J.; Strong, K.; Gransberg, D. Defining Complex Project Management of Large U.S. Transportation Projects: A Comparative Case Study Analysis. Public Works Manag. Policy 2011, 17, 170–188. [Google Scholar] [CrossRef] [Green Version]
  53. Vidal, L.-A.; Marle, F.; Bocquet, J.-C. Measuring Project Complexity Using the Analytic Hierarchy Process. Int. J. Proj. Manag. 2011, 29, 718–727. [Google Scholar] [CrossRef]
  54. Xia, B.; Chan, A.P.C. Measuring Complexity for Building Projects: A Delphi Study. Eng. Constr. Archit. Manag. 2012, 19, 7–24. [Google Scholar] [CrossRef] [Green Version]
  55. Pomerol, J.-C.; Barba-Romero, S. Multicriterion Decision in Management; International Series in Operations Research & Management Science; Springer US: Boston, MA, USA, 2000; Volume 25, ISBN 978-1-4613-7008-6. [Google Scholar]
  56. Roy, B. Paradigms and Challenges. In Multiple Criteria Decision Analysis: State of the Art Surveys; International Series in Operations Research & Management Science; Springer: New York, NY, USA, 2005; Volume 78, pp. 3–24. ISBN 978-0-387-23067-2. [Google Scholar]
  57. Wątróbski, J.; Jankowski, J.; Ziemba, P.; Karczmarczyk, A.; Zioło, M. Generalised Framework for Multi-Criteria Method Selection. Omega 2019, 86, 107–124. [Google Scholar] [CrossRef]
  58. Boran, F.E.; Genç, S.; Kurt, M.; Akay, D. A Multi-Criteria Intuitionistic Fuzzy Group Decision Making for Supplier Selection with TOPSIS Method. Expert Syst. Appl. 2009, 36, 11363–11368. [Google Scholar] [CrossRef]
  59. Hwang, C.-L.; Yoon, K. Multiple Attribute Decision Making: Methods and Applications; A State-of-the-Art-Survey; Lecture Notes in Economics and Mathematical Systems; Springer: Berlin, Germany, 1981; ISBN 978-3-540-10558-9. [Google Scholar]
  60. Dymova, L.; Sevastjanov, P.; Tikhonenko, A. A Direct Interval Extension of TOPSIS Method. Expert Syst. Appl. 2013, 40, 4841–4847. [Google Scholar] [CrossRef]
  61. Ekmekçioğlu, M.; Kaya, T.; Kahraman, C. Fuzzy Multicriteria Disposal Method and Site Selection for Municipal Solid Waste. Waste Manag. 2010, 30, 1729–1736. [Google Scholar] [CrossRef]
  62. Kaya, İ.; Kahraman, C. A Comparison of Fuzzy Multicriteria Decision Making Methods for Intelligent Building Assessment. J. Civ. Eng. Manag. 2014, 20, 59–69. [Google Scholar] [CrossRef] [Green Version]
  63. Kumar, R.; Khan, A.I.; Abushark, Y.B.; Alam, M.M.; Agrawal, A.; Khan, R.A. An Integrated Approach of Fuzzy Logic, AHP and TOPSIS for Estimating Usable-Security of Web Applications. IEEE Access 2020, 8, 50944–50957. [Google Scholar] [CrossRef]
  64. Guo, X.; Zeng, T.; Wang, Y.; Zhang, J. Fuzzy TOPSIS Approaches for Assessing the Intelligence Level of IoT-Based Tourist Attractions. IEEE Access 2019, 7, 1195–1207. [Google Scholar] [CrossRef]
  65. Geraldi, J.; Maylor, H.; Williams, T. Now, Let’s Make It Really Complex (Complicated): A Systematic Review of the Complexities of Projects. Int. J. Oper. Prod. Manag. 2011, 31, 966–990. [Google Scholar] [CrossRef]
  66. Brown, L.L.; Svyantek, D.J. Complex Systems, Time and Graphical Analysis of Organizational Behavior. Int. J. Organ. Anal. 2001, 9, 354–368. [Google Scholar] [CrossRef]
  67. Maylor, H.; Vidgen, R.; Carver, S. Managerial Complexity in Project-Based Operations: A Grounded Model and Its Implications for Practice. Proj. Manag. J. 2008, 39, S15–S26. [Google Scholar] [CrossRef]
  68. Williams, T. The Need for New Paradigms for Complex Projects. Int. J. Proj. Manag. 1999, 17, 269–273. [Google Scholar] [CrossRef] [Green Version]
  69. Lessard, D.; Sakhrani, V.; Miller, R. House of Project Complexity—Understanding Complexity in Large Infrastructure Projects. Eng. Proj. Organ. J. 2014, 4, 170–192. [Google Scholar] [CrossRef] [Green Version]
  70. Bosch-Rekveldt, M.; Jongkind, Y.; Mooi, H.; Bakker, H.; Verbraeck, A. Grasping Project Complexity in Large Engineering Projects: The TOE (Technical, Organizational and Environmental) Framework. Int. J. Proj. Manag. 2011, 29, 728–739. [Google Scholar] [CrossRef]
  71. Nguyen, A.T.; Nguyen, L.D.; Le-Hoai, L.; Dang, C.N. Quantifying the Complexity of Transportation Projects Using the Fuzzy Analytic Hierarchy Process. Int. J. Proj. Manag. 2015, 33, 1364–1376. [Google Scholar] [CrossRef]
  72. He, Q.; Luo, L.; Hu, Y.; Chan, A.P.C. Measuring the Complexity of Mega Construction Projects in China—A Fuzzy Analytic Network Process Analysis. Int. J. Proj. Manag. 2015, 33, 549–563. [Google Scholar] [CrossRef]
  73. Schuh, G.; Riesener, M.; Mattern, C. Approach to Evaluate Complexity in New Product Development Projects. Int. J. Des. Nat. Ecodynamics 2016, 11, 573–583. [Google Scholar] [CrossRef]
  74. Damasiotis, V.; Fitsilis, P.; O’Kane, J.F. Measuring Communication Complexity in Projects. In Proceedings of the 8th Annual MIBES International Conference, Larissa, Greece, 25–27 May 2012. [Google Scholar]
  75. PMI. A Guide to the Project Management Body of Knowledge: PMBOK Guide; Project Management Institute: Pennsylvania, PA, USA, 2013. [Google Scholar]
  76. Jaber, H.; Marle, F.; Jankovic, M. Improving Collaborative Decision Making in New Product Development Projects Using Clustering Algorithms. IEEE Trans. Eng. Manag. 2015, 62, 475–483. [Google Scholar] [CrossRef]
  77. Geraldi, J.G.; Adlbrecht, G. On Faith, Fact, and Interaction in Projects. Proj. Manag. J. 2007, 38, 32–43. [Google Scholar] [CrossRef]
  78. Vidal, L.-A.; Marle, F.; Bocquet, J.-C. Using a Delphi Process and the Analytic Hierarchy Process (AHP) to Evaluate the Complexity of Projects. Expert Syst. Appl. 2011, 38, 5388–5405. [Google Scholar] [CrossRef]
  79. Kirschke, S.; Newig, J. Addressing Complexity in Environmental Management and Governance. Sustainability 2017, 9, 983. [Google Scholar] [CrossRef] [Green Version]
  80. Vidal, L.-A.; Marle, F.; Bocquet, J.-C. Building up a Project Complexity Framework Using an International Delphi Study. Int. J. Technol. Manag. 2013, 62, 251–283. [Google Scholar] [CrossRef]
  81. Qureshi, S.M.; Kang, C. Analysing the Organizational Factors of Project Complexity Using Structural Equation Modelling. Int. J. Proj. Manag. 2015, 33, 165–176. [Google Scholar] [CrossRef]
  82. Hass, K.B.; Rothman, J. Introducing the New Project Complexity Model. Proj. Profits Case Stud. Manag. 2008. Available online: https://www.projecttimes.com/articles/introducing-the-new-project-complexity-model-part-i.html (accessed on 1 August 2020).
  83. Luo, L.; Zhang, L.; He, Q. Linking Project Complexity to Project Success: A Hybrid SEM–FCM Method. Eng. Constr. Archit. Manag. 2020, 27, 2591–2614. [Google Scholar] [CrossRef]
  84. Mikkelsen, M.F. Perceived Project Complexity: A Survey among Practitioners of Project Management. Int. J. Manag. Proj. Bus. 2020. [Google Scholar] [CrossRef]
  85. Clark, K.B.; Fujimoto, T. Product Development Performance: Strategy, Organization, and Management in the World Auto Industry; Harvard Business School Press: Cambridge, MA, USA, 1991. [Google Scholar]
  86. Ireland, L. Project Complexity: A Brief Exposure To Difficult Situations; IPMA-USA: Atlanta, GA, USA, 2007. [Google Scholar]
  87. Azim, S.W. Understanding and Managing Project Complexity; University of Manchester: Manchester, UK, 2010. [Google Scholar]
  88. Zadeh, L.A. Fuzzy Sets. Inf. Control 1965, 8, 338–353. [Google Scholar] [CrossRef] [Green Version]
  89. Zarghami, S.A.; Gunawan, I. A Fuzzy-Based Vulnerability Assessment Model for Infrastructure Networks Incorporating Reliability and Centrality. Eng. Constr. Archit. Manag. 2019, 27, 725–744. [Google Scholar] [CrossRef]
  90. Ashtiani, B.; Haghighirad, F.; Makui, A.; Montazer, G. Ali Extension of Fuzzy TOPSIS Method Based on Interval-Valued Fuzzy Sets. Appl. Soft Comput. 2009, 9, 457–461. [Google Scholar] [CrossRef]
  91. Büyüközkan, G.; Feyzioğlu, O.; Nebol, E. Selection of the Strategic Alliance Partner in Logistics Value Chain. Int. J. Prod. Econ. 2008, 113, 148–158. [Google Scholar] [CrossRef]
  92. Gao, P.; Feng, J.; Yang, L. Fuzzy TOPSIS Algorithm for Multiple Criteria Decision Making with an Application in Information Systems Project Selection. In Proceedings of the 2008 4th International Conference on Wireless Communications, Networking and Mobile Computing, Dalian, China, 12–17 October 2008; pp. 1–4. [Google Scholar]
  93. Zadeh, L.A. The Concept of a Linguistic Variable and Its Application to Approximate Reasoning—II. Inf. Sci. 1975, 8, 301–357. [Google Scholar] [CrossRef]
  94. Jaber, H.; Marle, F.; Vidal, L.-A.; Didiez, L. Criticality and Propagation Analysis of Impacts between Project Deliverables. Res. Eng. Des. 2018, 29, 87–106. [Google Scholar] [CrossRef]
  95. Marle, F. Modèles d’information et Méthodes Pour Aider à La Prise de Décision En Management de Projets; Ecole Centrale Paris: Paris, France, 2002. [Google Scholar]
  96. MacDuffie, J.P.; Fujimoto, T. Why Dinosaurs Will Keep Ruling the Auto Industry. Harv. Bus. Rev. 2010, 88, 23–25. [Google Scholar]
  97. Monrad, M. On a Scale of One to Five, Who Are You? Mixed Methods in Identity Research. Acta Sociol. 2013, 56, 347–360. [Google Scholar] [CrossRef]
  98. Gareis, R.; Huemann, M. Maturity Models for the Project-Oriented Company. In The Gower Handbook of Project Management; Turner, J.R., Ed.; Gower: Aldershot/Hampshir, UK, 2007; pp. 187–213. [Google Scholar]
  99. Jaber, H.; Marle, F.; Vidal, L.-A.; Didiez, L. Reciprocal Enrichment of Two Multi-Domain Matrices to Improve Accuracy of Vehicle Development Project Interdependencies Modeling and Analysis. In Proceedings of the 16th International DSM Conference: Risk and Change Management in Complex Systems, Paris, France, 2–4 July 2014. [Google Scholar]
  100. Sevastjanov, P.V.; Róg, P. Fuzzy Optimization Using Direct Crisp and Fuzzy Interval Comparison. In Advances in Soft Computing: Neural Networks and Soft Computing; Physica: Heidelberg, Germany, 2003. [Google Scholar]
  101. Kennedy, D.M.; McComb, S.A.; Vozdolska, R.R. An Investigation of Project Complexity’s Influence on Team Communication Using Monte Carlo Simulation. J. Eng. Technol. Manag. 2011, 28, 109–127. [Google Scholar] [CrossRef]
  102. Peters, E.; Kliestik, T.; Musa, H.; Durana, P. Product Decision-Making Information Systems, Real-Time Big Data Analytics, and Deep Learning-Enabled Smart Process Planning in Sustainable Industry 4.0. J. Self-Gov. Manag. Econ. 2020, 8, 16–22. [Google Scholar]
  103. Treasury Board of Canada Secretariat Project Complexity and Risk Assessment Tool. Available online: http://www.tbs-sct.gc.ca/pm-gp/doc/pcra-ecrp/pcra-ecrp-eng.asp (accessed on 1 August 2020).
  104. Hel msman Institute Pty Ltd. Why Project Complexity Matters; Helmsman Institute Pty Ltd.: North Sydney, Australia, 2012. [Google Scholar]
  105. Novak, S.; Eppinger, S.D. Sourcing by Design: Product Complexity and the Supply Chain. Manag. Sci. 2001, 47, 189–204. [Google Scholar] [CrossRef] [Green Version]
  106. Poveda-Bautista, R.; Diego-Mas, J.-A.; Leon-Medina, D. Measuring the Project Management Complexity: The Case of Information Technology Projects. Complexity 2018, 2018, 1–19. [Google Scholar] [CrossRef] [Green Version]
  107. Elia, G.; Margherita, A.; Secundo, G. Project Management Canvas: A Systems Thinking Framework to Address Project Complexity. Int. J. Manag. Proj. Bus. 2020. [Google Scholar] [CrossRef]
  108. Li, D.-F.; Yang, J.-B. Fuzzy Linear Programming Technique for Multiattribute Group Decision Making in Fuzzy Environments. Inf. Sci. 2004, 158, 263–275. [Google Scholar] [CrossRef]
Figure 1. Benefits of measuring project complexity.
Sustainability 13 03020 g001
Figure 2. Fuzzy technique for order preference by similarity to ideal solution (TOPSIS) steps to assess project complexity of several projects.
Sustainability 13 03020 g002
Figure 3. Series of triangular membership functions for the Likert scale from 1–5.
Sustainability 13 03020 g003
Figure 4. The key features of vehicle development projects.
Sustainability 13 03020 g004
Figure 5. Fuzzy numbers of Project 2 categories.
Sustainability 13 03020 g005
Table 3. Linguistic variables for the rating.
Linguistic VariableLikert ScaleTriangular Number
Very weak1(1;1;2)
Weak2(1;2;3)
Medium3(2;3;4)
Strong4(3;4;5)
Very strong5(4;5;5)
Table 4. Linguistic variables for the importance weight of category and factor.
Linguistic VariableLikert ScaleTriangular Number
Very low1(0;0.2;0.4)
Low2(0.2;0.4;0.6)
Medium 3(0.4;0.6;0.8)
High4(0.6;0.8;1)
Very high5(0.8;1;1)
Table 5. Weighted average of ratings and factor weights.
CategoriesProjectsFuzzy Number
C1: Project governanceP1(0.96;1.66;2.23)
P2(1.18;1.99;2.41)
P3(1.08;1.87;2.41)
C2: Project characteristicsP1(0.69;1.27;1.82)
P2(0.74;1.33;1.88)
P3(0.69;1.27;1.82)
C3: ProductP1(0.96;1.72;2.24)
P2(1.24;2.07;2.53)
P3(1.01;1.78;2.29)
C4: Project team/actorsP1(0.68;1.36;2)
P2(0.82;1.54;2.12)
P3(0.73;1.42;2.06)
C5: StakeholdersP1(0.52;1.09;1.71)
P2(0.73;1.36;2)
P3(0.56;1.15;1.76)
C6: ResourcesP1(0.71;1.4;2)
P2(0.8;1.52;2.06)
P3(0.75;1.46;2.06)
C7: EnvironmentP1(0.79;1.49;2.06)
P2(1.19;2;2.41)
P3(0.96;1.72;2.29)
Table 6. Normalized weighted average f ratings and factor weights.
CategoriesProjectsFuzzy Number
C1: Project governanceP1(0.38;0.66;0.88)
P2(0.47;0.79;0.95)
P3(0.43;0.74;0.95)
C2: Project characteristicsP1(0.27;0.5;0.72)
P2(0.29;0.53;0.74)
P3(0.27;0.5;0.72)
C3: ProductP1(0.38;0.68;0.88)
P2(0.49;0.82;1)
P3(0.4;0.7;0.91)
C4: Project team/actorsP1(0.27;0.54;0.79)
P2(0.33;0.61;0.84)
P3(0.29;0.56;0.81)
C5: StakeholdersP1(0.2;0.43;0.67)
P2(0.29;0.54;0.79)
P3(0.22;0.46;0.7)
C6: ResourcesP1(0.28;0.55;0.79)
P2(0.32;0.6;0.81)
P3(0.3;0.58;0.81)
C7: EnvironmentP1(0.31;0.59;0.81)
P2(0.47;0.79;0.95)
P3(0.38;0.68;0.91)
Table 7. Weighted with fuzzy category weights.
CategoriesProjectsFuzzy Number
C1: Project governanceP1(0.31;0.66;0.88)
P2(0.37;0.79;0.95)
P3(0.34;0.74;0.95)
C2: Project characterıstıcsP1(0.22;0.5;0.72)
P2(0.23;0.53;0.74)
P3(0.22;0.5;0.72)
C3: ProductP1(0.31;0.68;0.88)
P2(0.39;0.82;1)
P3(0.32;0.7;0.91)
C4: Project team/actorsP1(0.22;0.54;0.79)
P2(0.26;0.61;0.84)
P3(0.23;0.56;0.81)
C5: StakeholdersP1(0.16;0.43;0.67)
P2(0.23;0.54;0.79)
P3(0.18;0.46;0.7)
C6: ResourcesP1(0.22;0.55;0.79)
P2(0.25;0.6;0.81)
P3(0.24;0.58;0.81)
C7: EnvironmentP1(0.19;0.47;0.81)
P2(0.28;0.63;0.95)
P3(0.23;0.54;0.91)
Table 8. Distances of each project categories to fuzzy positive ideal solution (FPIS) and the fuzzy negative ideal solution (FNIS).
CategoriesProjectsd+d−
C1: Project governanceP10.450.66
P20.380.75
P30.410.72
C2: Project characteristicsP10.560.52
P20.540.54
P30.560.52
C3: ProductP10.450.67
P20.370.78
P30.430.69
C4: Project team/actorsP10.540.57
P20.490.62
P30.520.59
C5: StakeholdersP10.610.47
P20.530.57
P30.600.49
C6: ResourcesP10.530.57
P20.500.60
P30.510.59
C7: EnvironmentP10.570.55
P20.470.68
P30.520.62
Table 9. Ordering Results.
Projectsd+d−CCIRanking
P13.714.010.523
P23.284.530.581
P33.554.230.542
Table 10. Project category weighted rankings.
CategoriesabcFuzzy Number
Project 1
C10.310.660.88(0.31;0.66;0.88)
C20.220.500.72(0.22;0.5;0.72)
C30.310.680.88(0.31;0.68;0.88)
C40.220.540.79(0.22;0.54;0.79)
C50.160.430.67(0.16;0.43;0.67)
C60.220.550.79(0.22;0.55;0.79)
C70.190.470.81(0.19;0.47;0.81)
Project 2
C10.370.790.95(0.37;0.79;0.95)
C20.230.530.74(0.23;0.53;0.74)
C30.390.821.00(0.39;0.82;1)
C40.260.610.84(0.26;0.61;0.84)
C50.230.540.79(0.23;0.54;0.79)
C60.220.550.79(0.22;0.55;0.79)
C70.280.630.95(0.28;0.63;0.95)
Project 3
C10.340.740.95(0.34;0.74;0.95)
C20.220.500.72(0.22;0.5;0.72)
C30.320.700.91(0.32;0.7;0.91)
C40.230.560.81(0.23;0.56;0.81)
C50.180.460.70(0.18;0.46;0.7)
C60.240.580.81(0.24;0.58;0.81)
C70.230.540.91(0.23;0.54;0.91)
Table 11. Category comparison of triangular fuzzy numbers.
PairProbabilityComparision
C ˜ 3, C ˜ 10.56 C ˜ 3 > C ˜ 1
C ˜ 3, C ˜ 20.80 C ˜ 3 > C ˜ 2
C ˜ 3, C ˜ 40.71 C ˜ 3 > C ˜ 4
C ˜ 3, C ˜ 50.77 C ˜ 3 > C ˜ 5
C ˜ 3, C ˜ 60.77 C ˜ 3 > C ˜ 6
C ˜ 3, C ˜ 70.62 C ˜ 3 > C ˜ 7
Publisher’s Note: MDPI stays neutral with regard to jurisdictional claims in published maps and institutional affiliations.

