Abstract
The contradiction between human and land has always been a problem in the process of development and utilization of land resources. Under such circumstances, relevant government agencies put forward the management concept of land resource capitalization. As an effective policy to implement the conception of land resource capitalization, land transfer is of great significance to reforming rural land systems and liberating productivity in poor areas of Tai-hang Mountain in Hebei. However, how to integrate environmental impact and value evaluation of ecosystem services of land transfer in the process of resource capitalization deserves our attention. This paper takes the land transfer of Fuping, Hebei in Tai-hang Mountain as an example, combined with life cycle assessment (LCA), life cycle cost assessment (LCC), and the methods of value evaluation of ecosystem services to quantify the changes of environmental loads, economic costs, and ecosystem services in the whole process and different stages of land resource capitalization. Moreover, through the sensitivity analysis of key environmental indicators, the possibility of restricting environmental costs is explored. This paper studies land transfer from the direction of the cross-discipline and provides a new idea for land resource management.
1. Introduction
At present, problems such as extensive investment, serious environmental emissions, and low social benefits exist in the development of natural resources in China [1,2]. Therefore, it is urgent to develop natural resources in a reasonable and orderly manner and utilize the economic, social, and ecological benefits of natural resources. The Chinese government attaches great importance to the transformation of the development and utilization of natural resources, and has made a series of explorations in such aspects as the transformation of utilization types and the improvement of the management mechanism of natural resources. In particular, the “resource–asset–capital” trinity thought of resource management proposed by the Ministry of Natural Resources in 2010 is the most prominent. Accelerating the study of the natural resource capitalization process is conducive to the realization of the purpose of “protecting resources, manifesting assets, and activating capital” on the premise of sustainable development of society, economy, and environment.
Land resources are important natural resources and the core of human production, life, and ecological activities. In 2015, the Future Earth Plan integrated the global land plan, ecosystem services, and other research projects, which made the topic of changes in ecosystem services under land use change become an important topic under the Future Earth Plan [3]. The focus of research on the process of land resource capitalization is the transformation process. This process particularly involves changes in environmental impact loads and ecosystem services. Carrying out research on this theme helps to reveal the relationship between economic development and ecological protection. It is difficult to alleviate the contradiction between the coordinated development of land and humans in China, and population growth has led to land use tension that seriously restricts the sustainable development of Chinese society [4,5]. By studying the process of land resource–asset–capitalization, we hope to revitalize the land stock of land resources and solve the imbalance between the supply and demand of urban and rural land resources. It has an important reference role in promoting the reform of the land resource property rights system, market construction, and government management.
Hebei Province is an important strategic area for the coordinated development of Beijing–Tianjin–Hebei. However, Hebei is relatively backward in the Beijing–Tianjin–Hebei region, with obvious differences in social development, public service levels, and quality levels. Fuping County in Hebei is one of the main battle areas for poverty alleviation. Research on land transfer in this area—a realized form of land resource capitalization, as an example—will provide a good case and reference for rural land system reform in poor areas, especially the capitalization reform of land resources.
At present, the research on land resource capitalization by relevant scholars mainly focuses on the theoretical exploration and the stages of land resource capitalization. In terms of theoretical exploration, relevant scholars have discussed the status of five major elements, namely, social subject, ecological object, market platform, technological power, and institutional guarantee in the capitalization operation system [6] and the significance of maintaining and increasing the value of state-owned land assets in the initial capitalization stage [7]. At the same time, some scholars elaborated on the significance of constructing a benign ecological value mechanism for land capitalization theoretically, and emphasized the positive role of public participation, an innovative capitalization model, and guiding the capitalization of the investment market [8,9]. The research on different stages of land resource capitalization can be roughly divided into three stages: converting into resource, resource–asset, and asset–capitalization. The stage of converting into resource mainly involves land restoration and land reuse. At present, the main measures for land restoration and reuse are land reclamation, ecological restoration, ecological reconstruction, and land expansion. For land reclamation, the literature mainly focuses on the theoretical review of land reclamation [10], adaptability evaluation [11], land reclamation, and ecological protection [12]. Ecological restoration and reconstruction mainly emphasize the reconstruction of abandoned land from the functional level of an ecosystem [13], the causes [14], goals [15], methods [16,17], effects of ecological restoration [18,19] and the public’s willingness to support [20,21]. Land expansion mainly involves the development stage, influencing factors, and the formation mechanism of land expansion covering economic, social, ecological, and other aspects [22,23,24]. In the stage of resource–asset, scholars mainly focused on the composition of land asset property rights, operation forms, property rights definition, and value accounting [25,26,27]. In the stage of asset–capitalization, current research mainly focuses on land capitalization countermeasures, institutional guarantees, and market prices. For example, some scholars believed that the capitalization of land needs to start with stabilizing the ownership of rural land contract rights, strengthening the nature of land properties, and establishing capitalization market [28]. Some scholars have conducted research mainly on legal protection [29] and market transactions [30]. For research on land transfer, scholars mainly focused on the factors affecting land transfer [31,32,33] and the benefits and modes of land transfer [34,35].
Through a literature review, it can be found that current research on land resource capitalization and land transfer mainly focuses on theoretical combing and actual operation. The research lacks a systemic focus and little applied the land capitalization theory to solve practical problems. Moreover, few scholars paid attention to the economic and environmental impact on the process of land resource capitalization. Based on this consideration, this paper takes the land transfer mode, a typical mode of land resource capitalization, as an example, and relying on Chenjiagou Village in Fuping County, Hebei Province, organically integrates life cycle assessment and value evaluation of ecosystem services, and explores the environmental–economic costs, the changes to ecosystem services, and the key indicators restricting the process of resource capitalization. Through the analysis, the aim is to evaluate the sustainability process of land resource capitalization from an environmental–economic perspective.
2. Land Transfer and Overview of the Study Area
2.1. Land Transfer
In September 2015, the General Office of the Hebei Provincial Committee of the Communist Party of China and the General Office of the Hebei Provincial People’s Government formulated the “Implementation Opinions on Guiding the Orderly Transfer of Rural Land Management Rights to Develop Agricultural Appropriate Scale Operation,” which stipulated land transfer in Tai-hang Mountain in Hebei in terms of policies [36]. At present, Tai-hang Mountain in Hebei mainly carries out land transfer through land exchange, land lease, and land subcontracting [36]. The specific operation mode of land transfer is shown in Figure 1. Combined with current local conditions, the diversity of land transfer modes is conducive to the optimal use of local land resources and maximizes the current benefits of the land [37]. In summary, the effectiveness of land transfer in Tai-hang Mountain is mainly reflected in the following aspects: Firstly, land transfer enables optimal allocation of rural resources to the greatest extent. Secondly, land transfer has changed the traditional agricultural organization and production and management modes. Through land transfer, land-use rights are transferred from self-employed persons to large households, cooperatives, and local characteristic agricultural enterprises. In this process, the transfer of land-use rights is accompanied by advanced management concepts, production technology, and capital injection, which gradually changes the traditional and backward land production mode of self-employed persons, and is replaced by a modern, large-scale, and benefit-oriented production and operation mode. Thirdly, land transfer has liberated rural productivity, enabled farmers to master key technologies, and ultimately increased their income.
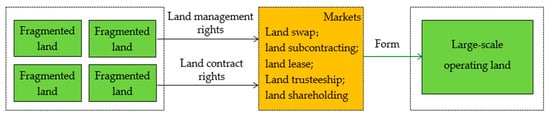
Figure 1.
The mode diagram of land transfer.
2.2. General Situation of the Study Area
The study area is located in the northern part of Fuping County, at 38°53′60″ N, 114°19′14″ E. It belongs to the landform of the middle and low mountain landform and the altitude of land transfer blocks is between 295 m and 325 m. The soil in the study area is mainly brown soil with a thickness of about 30–60 cm; the average total nitrogen content is 0.030%, the average total phosphorus content is 0.045%, and the average total potassium content is 0.703%. The study area is located in a semi-humid temperate zone with a continental monsoon climate. The average annual temperature is 12.6 °C, the highest temperature is 39.3 °C, and the lowest temperature is −18.2 °C. The average annual rainfall is 670 mm, the annual accumulated temperature is 801.9 °C, and the frost-free period is 140–190 days. Before land transfer, the land-use type was hillside wasteland without crops, and the area of barren land below 25° was 670 hectares. After comprehensive land development and improvement, a total of 21.53 hectares of land was transferred. After the transfer, the land has mainly been used for planting apples and cherries.
3. Research Method
3.1. Life Cycle Assessment
As an effective method to evaluate the potential environmental impact of the entire life cycle of the product from the acquisition of raw materials, to intermediate use, to the final recycling of waste, life cycle assessment (LCA) has been widely used to quantify the environmental load caused by products and production processes since it was put forward. At present, LCA presents a systematic and refined development trend, and is widely used in farming, the food industry, waste processing, and other industries [38,39,40]. Generally speaking, LCA evaluation mainly includes the following four steps: goal and scope definition, life cycle inventory (LCI) analysis, impact assessment, and results interpretation [41,42]. Goal and scope definition is the premise and foundation of LCA evaluation, which mainly includes defining the system evaluation objective, determining the functional unit, and defining the system boundary [43].
3.1.1. Evaluation Objective
The main objective is to quantify the environmental–economic costs, changes in ecosystem services, and the environmental–economic benefits in the land resource capitalization process under the land transfer mode.
3.1.2. Functional Unit
According to the situation of the study area in this paper, the transfer of 1 hectare of land was selected as the functional unit for this research.
3.1.3. System Boundary
Since the land-use type before the land transfer is wasteland, according to the implementation status of land transfer, the stage of converting it into resource mainly includes the construction status of the project before the second use of the land after land transfer, which mainly includes 4 parts: a land leveling project, an irrigation and drainage project, a field road project, and a farmland protection and ecological conservation project. Through these projects, the land is renovated so that the land can fulfill the purpose of crop planting. The stage of resource–asset is reflected by planting crops on cultivated land under the premise of detailed property rights, and at the same time, reveals the value changes of ecosystem services. The stage of asset–capitalization is the result that causes value appreciation, mainly including value composition and accounting. Figure 2 shows the system boundary of the resource capitalization process under land transfer.
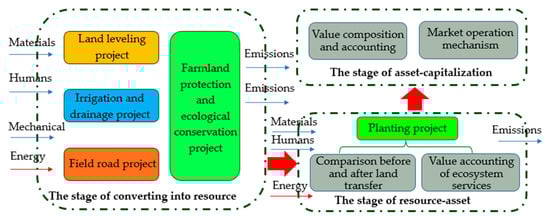
Figure 2.
The system boundary of the land resource capitalization process under land transfer.
3.1.4. Data Lists and Sources
All the original data of this part in the process of land transfer were obtained through field investigation in Chenjiagou Village, Fuping County, Tai-hang Mountain, Hebei Province in August 2016 and December 2018. The land-use type of the study area before the land transfer was unused hillside wasteland. After the land transfer, the land was rationally used to plant fruits (apples and cherries) through a land leveling project, an irrigation and drainage project, a field road project, and a farmland protection and ecological conservation project. As the large-scale machinery in those projects involved the determination of the transportation mode and transportation distance, by communicating with relevant technical personnel of the land remediation, the research group determined that the transportation mode of different large-scale equipment is large truck transportation, and the transportation distance from Fuping County to the land transfer study area is 21.5 km on average. In the specific land transfer case, the data list of different production projects of transfer 1 hm2 land in the whole process of land resource capitalization is shown in Table 1, Table 2 and Table 3.

Table 1.
Input data on the land leveling and irrigation and drainage projects of Chenjiagou Village (the values are presented in each functional unit).
Table 2.
Input data on field road, farmland protection, and ecological environment maintenance projects in Chenjiagou Village (the values are presented in each functional unit).
Table 3.
Input and output data of apple and cherry planting in Chenjiagou Village.
3.1.5. Impact Categories and Impact Assessment Methodology
At present, a variety of LCA evaluation methods such as ReCiPe [44], the environmental design of industrial products (EDIP) [45], the tool for the reduction and assessment of chemical and other environmental impacts (TRACI) [46], and other assessment systems are widely used to evaluate the environmental impacts caused by different production processes. ReCiPe can comprehensively and objectively evaluate the environmental burden caused by production processes [47]; therefore, this paper uses the ReCiPe evaluation system to analyze the process of resource capitalization under land transfer. In the selection of indicators, considering the international general standards, 14 indicators were selected for analysis, which consist of Climate change, Fossil depletion, Freshwater ecotoxicity, Freshwater eutrophication, Human toxicity, Ionizing radiation, Marine ecotoxicity, Marine eutrophication, Metal depletion, Ozone depletion, Particulate matter formation, Photochemical oxidant formation, Terrestrial acidification, and Terrestrial ecotoxicity.
3.2. Life Cycle Cost
This paper considers the economic input of energy, labors, materials, and mechanical in the whole life cycle in the process of resource capitalization under land transfer so that the LCA based on environmental evaluation and the life cycle cost (LCC) based on economic evaluation can be organically combined. Table 1, Table 2 and Table 3 shows the cost of each part of the life cycle in the process corresponding to the functional unit.
3.3. Assessment of Ecosystem Services
Agriculture not only has the most basic function of providing food and fiber, but its contribution to shaping the natural landscape and providing good environmental benefits has also been paid more and more attention [48]. In this regard, it is of great significance to evaluate the value changes in farmland ecosystem services caused by the process of resource capitalization. The United Nations Millennium Ecosystem Assessment divides ecosystem services into four categories: provisioning services, regulating services, supporting services, and cultural services, which have been widely recognized and supported [49]. Based on the research and referring to the research status of farmland ecosystem services and pollution status, this paper divides farmland ecosystem services into five categories: provisioning services, regulating services, supporting services, cultural services, and negative services, with nine kinds of services in total. The description and calculation methods of specific services are shown in Table 4.
Table 4.
Types and calculation methods of ecosystem service value assessment in farmland.
4. Results
4.1. Analysis of Land Resource Capitalization Process
4.1.1. Overall Environmental Impact Analysis of Land Resource Capitalization Process
Relying on GaBi9.5, this paper calculated the overall environmental cost of the resource capitalization process and showed it with a transfer of 1 hm2 land as the functional unit. The specific results are shown in Table 5.
Table 5.
LCA midpoint results of the process of land resource capitalization.
It can be seen from Table 5 that the comparative analysis before and after land transfer shows although there would be some economic benefits to crop planting after the land transfer, this process would also cause a certain degree of damage to the environment. By numerically analyzing the impact of land transfer on the environment in the process for different environmental protection purposes, the changes in environmental indicators were also seen to be different. For example, when considering the indicator of Climate change, the environmental effect of 1.82 × 10⁴ kg CO2 Equation was produced; in the indicator of Human toxicity, the environmental effect of 1.37 × 10³ kg 1,4-DB Equation was produced. Due to the inconsistency of measurement units among different indicators, if the overall impact of land transfer on the environment is considered as a whole, further processing is needed. In this regard, we chose to consider the LCIA survey 2012, global, ReCiPe 1.08 (E), and excl biogenic carbon as the weight, and ReCiPe 1.08 (E), mid-point normalization, world, and excl biogenic carbon as the standardization basis. The results in Table 5 were standardized and weighted to obtain the overall impact of land transfer on the environment. The specific results are shown in Figure 3.
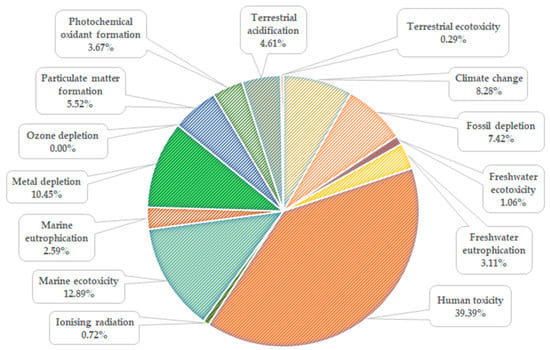
Figure 3.
Contribution degree of different environmental indicators on land transfer in the process of resource capitalization after standardization and weighting.
Figure 3 shows the contributions of the 14 environmental indicators on land transfer in the process of resource capitalization after standardization and weighting. After standardization and weighting, we compared the environmental impacts of different indicators on the whole process of resource capitalization. It can be seen that the six indicators that had the most significant impact on the whole process were Human toxicity, Marine ecotoxicity, Metal depletion, Climate change, Fossil depletion, and Particulate matter formation. The six indicators with the least significant impact were Ozone depletion, Terrestrial ecotoxicity, Ionizing radiation, Freshwater ecotoxicity, Marine eutrophication, and Freshwater eutrophication. Due to a variety of inputs causing different contributions of indicators to the overall environmental cost, we focused on the indicators that had the most significant impact on the environment to make it possible to explore corresponding measures to reduce the environmental impact.
4.1.2. Analysis of Specific Links in the Process of Land Resource Capitalization
Compared with before the land transfer, during the whole life cycle the process of land transfer caused a certain load on the environment. As described above, the resource capitalization process of land transfer includes five links: a land leveling project (LLP), an irrigation and drainage project (IDP), a field road project (FRP), a farmland protection and ecological conservation project (FPECP), and a planting project (PP). What were the contributions of different links to various environmental indicators? How did different links contribute to the overall environmental load under land transfer? Relying on the calculation results, we further analyzed the environmental impact of the five different links of land transfer on the whole process and the contribution of different links to various environmental indicators. The specific results are shown in Figure 4 and Figure 5 Shown.
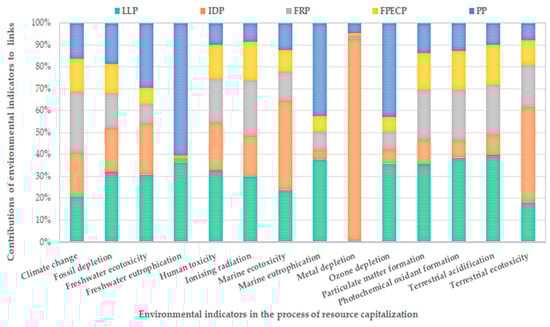
Figure 4.
The contributions of different links of land transfer in the process of resource capitalization to environmental indicators.
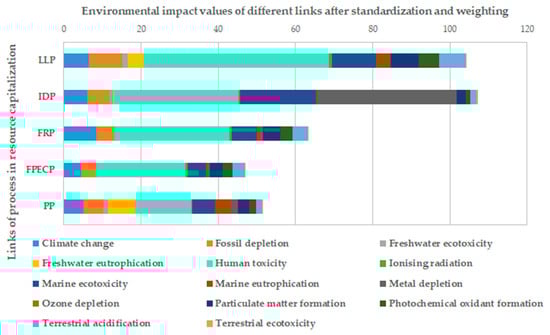
Figure 5.
The composition of environmental indicators in different links in the process of resource capitalization.
It can be seen from Figure 4 that in the land transfer mode, the contributions of different links to environmental indicators varied significantly. For example, for the Climate change indicator, the field road project had the most significant impact on Climate change, followed by the land leveling project. The farmland protection and ecological conservation project had the least impact on the Climate change indicator. For the Human toxicity indicator, the land leveling project had the most significant impact on this indicator, followed by the irrigation and drainage project, and the planting project had the least impact on this indicator. Therefore, in the land transfer mode, specific and targeted measures should be taken for different environmental protection purposes to reduce the environmental cost in the process of land resource capitalization.
It can be seen from Figure 5 that under the land transfer mode, the irrigation and drainage project had the most significant effect on the overall environment, followed by the land leveling project, the field road project, and the planting project. The farmland protection and ecological conservation project had the least environmental impact on the whole process. In addition, different environmental indicators had different effects on different links. As a whole, Ozone depletion had the least influence on different links, whereas the environmental indicators that had the most significant influence on each link had some differences. For example, Metal depletion had the most significant impact on the irrigation and drainage project, and Human toxicity had the most significant impact on the other four links.
On the basis of the above analysis, relying on the economic data in Table 1, Table 2 and Table 3 and combining the environmental impact after standardization and weighing, we integrated the evaluation methods of LCC and LCA, and comprehensively weigh the environmental–economic benefits of the resource capitalization process. The specific results are shown in Table 6.
Table 6.
Life cycle cost versus environmental impact in the process of resource capitalization.
As a whole, there was not necessarily a positive correlation between environmental load and economic cost. The link with the most significant environmental impact was the irrigation and drainage project; however, the link with the greatest economic cost was the planting project. There were significant differences between environmental load and economic cost in different links. Therefore, it was necessary to further interpret the stages of converting into resource, resource–asset, and asset–capitalization of land transfer.
4.2. Analysis of the Conversion into Resource Stage
The stage of converting into resource mainly included four links: the land leveling project, the irrigation and drainage project, the field road project, and the farmland protection and ecological conservation project. In this stage, it mainly involved the environmental impact and economic costs resulting from before and after the land transfer. Therefore, on the basis of the above calculation, this paper integrated the analysis methods of LCA and LCC, and further analyzed the relationship between the economic and environmental cost of inputs in different links in the conversion into the resource stage. The specific results are shown in Table 7.
Table 7.
The relationship between the environmental and economic cost of inputs in different links at the conversion into resource stage.
It can be seen from Table 7 that due to the influence of factors such as the input quantity of raw materials and the complexity of the process, the environmental load and economic cost of different raw materials were different in the stage of converting into resource. In addition, in each link, the maximum economic cost of different raw materials was not necessarily at the cost of the maximum environmental load. For example, in the three links of the land leveling project, field road project, and farmland protection and ecological conservation project, the economic cost of stone was not the highest, but it caused the greatest environmental cost; in the irrigation and drainage project, the steel tube caused the environmental cost to be the most significant. In terms of economic cost, equipment and transportation was relatively high, but the environmental cost was very weak. This was mainly related to the too-close transportation distance and the allocation to each functional unit. In this regard, we should focus on the input amount of stone and steel tube, and even consider using other substitutes to replace the production function of stone and steel tube without affecting the quality of the project so as to reduce the environmental impact on the stage of conversion into resource.
4.3. Analysis of Resource–Asset Stage
The resource–asset stage mainly included the link of the planting project before and after land transfer. As mentioned above, the environmental impact changed before and after the land transfer was involved. Therefore, we needed to know which changes took place in various environmental indicators after land transfer. In this case, the land use type before the land transfer was hillside wasteland without crops, so here we only analyzed the impact of crop planting on the environment after the land transfer. Based on this consideration, and in order to facilitate the analysis and comparison among various indicators, all indicators were standardized and converted to the same planting unit based on the abovementioned standardization and weighing methods so as to compare the environmental impacts and differences of crop planting before and after land transfer. The specific results are shown in Figure 6.
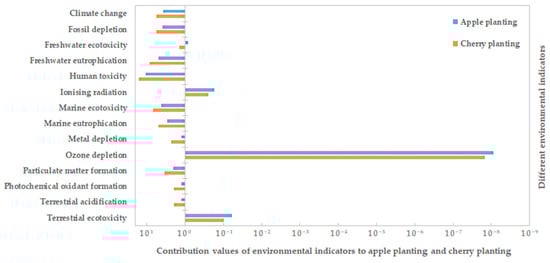
Figure 6.
Comparison of environmental impact of crop planting before and after land transfer.
It can be seen from Figure 6 that after land transfer, different crops had different impacts on environmental indicators. After land transfer, apple planting had the most significant impact on Human toxicity, followed by Freshwater eutrophication and Marine ecotoxicity. The contribution of cherry planting to environmental indicators also showed a similar trend. By converting the apple planting area and cherry planting area to the same unit and comparing the environmental impact between them, it could be seen that, as a whole, the impact of cherry planting on the environment was higher than that of apple planting, and all environmental indicators showed this trend.
While evaluating the environmental impact, it was necessary to consider the economic benefits realized in the process of land resource–asset. In this regard, on the basis of the above analysis, this section incorporates the life cycle cost into the analysis framework and divides net income by environmental load to indicate the economic benefits of environmental impact, and comprehensively weighs the environmental–economic benefits in the resource–asset stage. The transfer of 1 hm2 land is used as a functional unit for display. The specific results are shown in Table 8.
Table 8.
The environmental–economic benefits of the resource–asset stage in land transfer.
Due to differences in planting structures, as well as the impact of input raw materials, crop yields, and prices, the net income per unit of environmental load between the two different crops at the resource-asset stage had a large deviation. It can be seen from the above analysis that although the environmental cost of cherry planting in a unified unit was more prominent, considering the environmental–economic benefits, the net income per unit environmental load of cherry planting was also higher than the corresponding index of apple planting. Therefore, in order to achieve the best overall environmental and economic benefits in the study area, cherry planting should be promoted after land transfer in Chenjiagou, Fuping.
As mentioned above, at the resource–asset stage, the planting of crops led to changes in ecosystem services. Based on this consideration, this paper calculated the changes in ecosystem services before and after land transfer. In the land transfer mode of Chenjiagou, Fuping, the value of ecosystem services was very small before land transfer, which can almost be ignored because the land was a hillside wasteland. In addition, most accounting methods of the values in ecosystem services in this paper were based on crop yields, so the values in ecosystem services of hillside wasteland was defined as zero here [57]. At the same time, because the crops planted after land transfer are limited to sales and do not involve tourism income, the value of cultural services was ignored here. In this regard, a total of eight types of services, including provisioning services, regulating services, support services, and negative services, were calculated here. The specific changes in the value of 1 hm2 ecosystem services are shown in Table 9.
Table 9.
Changes in ecosystem services during the resource–asset stage of land transfer in Chenjiagou, Fuping.
In the resource–asset stage, the use of chemical fertilizers caused an accumulation of heavy metals in the crops, and the use of pesticides affected the quality of crops and biodiversity. Therefore, the two services of fertilizer pollution and pesticide pollution were negative. As a whole, the positive benefits of the changes in the values of ecosystem services in Chenjiagou in Fuping was about CNY 336,859.78, and the negative benefit was CNY 61,604.40. The positive-to-negative ratio was more than five times, which indicates that the positive functions of the changes in ecosystem services in the resource–asset stage in the case study occupied a dominant position, far exceeding the negative impact. According to the changes of ecosystem services, crop production had the most obvious change in the case, followed by climate regulation, soil conservation, waste treatment, biodiversity, and water conservation.
4.4. Analysis of Asset–Capitalization Stage
The land asset–capitalization stage mainly involved value increment, which was embodied in the values of additional materials, humans, financial investments, and value-added ecosystem services during the process of land-use changes. The investment value of materials, humans, and financial investments mainly included engineering costs and compensation costs. In the engineering cost, it was mainly reflected in the form of necessary land remediation funds, that is, it was composed of the fees of land leveling projects, irrigation and drainage projects, field road projects, and farmland protection and ecological conservation projects. This part of the costs is shown in Table 1 and Table 2. In terms of compensation costs for land transfer, the specific compensation standards are not uniform in various places in the Tai-hang Mountain in Hebei, which are specifically related to the annual output of local crops, usually between 800–1200/mu. Through investigation, we learned that the compensation standard for farmers who transferred 1 hm2 of land in Chenjiagou, Fuping is 13,500. In terms of the value-added of ecosystem services, the content was accounted for in the land resource–asset stage section. Table 10 shows the value-added composition of the land capitalization in land transfer mode.
Table 10.
Value-added composition of capitalization in land transfer mode.
It can be seen from Table 10 that in terms of the capitalized value added of the land transfer mode, the values of ecosystem services accounted for 64.65% of the capitalized value added. Among them, provisioning services accounted for a particularly prominent proportion. This also reflects the particularity and importance of comprehensive consideration of the economic and environmental benefits of land transfer in the process of land resource capitalization.
5. Discussion
5.1. Sensitivity Analysis of Key Environmental Indicators in the Resource Capitalization Process
As mentioned above, the process of resource capitalization under the land transfer mode can cause a certain degree of damage to the environment. Therefore, on the basis of the above analysis, from the perspective of materials and energy inputs, and by conducting a sensitivity analysis [58] of key environmental indicators that have a significant impact on the resource capitalization process, this section tries to find alternative materials with relatively low potential environmental impact to reduce the environmental cost. From the above analysis, we saw that the six indicators that had the most significant impact on the environment were Human toxicity (Ht), Marine ecotoxicity (Me), Metal depletion (Md), Climate change (Cc), Fossil depletion (Fd), and Particulate matter formation (Pmf). The sensitivity analysis scenario was set to increase the basic input by 10% compared to the baseline scenario, whereas the amount of other inputs remained unchanged to explore the impact of the input on the environmental indicators of the whole process. The final results are shown in Table 11, Table 12 and Table 13.
Table 11.
Sensitivity analysis of the main inputs of the land leveling project and field road project.
Table 12.
Sensitivity analysis of the main inputs of the irrigation and drainage project.
Table 13.
Sensitivity analysis of the main inputs of the farmland protection and ecological conservation project and planting project.
In the process of resource capitalization, some inputs were less sensitive to major environmental indicators, such as mechanical and tap water, so only inputs sensitive to major environmental indicators are displayed here. It can be seen from Table 11, Table 12 and Table 13 that from the perspective of input utilization, different inputs had different sensitivity to the main environmental indicators in the process of resource capitalization. On the whole, stone in the land leveling project and farmland protection and ecological conservation project, steel tube in the irrigation and drainage project, and organic fertilizer in the planting project were all sensitive to the above six types of environmental indicators. At the same time, there were some inputs with high sensitivity to some environmental indicators and weak sensitivity to other environmental indicators, such as pesticide in the planting project, which had relatively strong sensitivity to Md. Therefore, aiming at different environmental protection purposes and according to the difference of sensitivity of different inputs to various environmental indicators, it is possible to reduce the potential impact of the whole process of resource capitalization on the environment. It is necessary to pay more attention to the inputs that are sensitive to environmental indicators, and to find inputs with relatively low environmental costs to replace them on the basis of improving the utilization efficiency of inputs and allowing technology without affecting the final benefits.
5.2. Advantages and Disadvantages of Integrating Life Cycle Assessment and Ecosystem Services to Evaluate the Resource Capitalization Process
The process of land resource capitalization needs to be studied in a multidisciplinary and cross-disciplinary system with different professional directions. This paper takes land transfer, a typical way to realize the capitalization of land resource, as an example, and studies its process by combining the research methods of life cycle assessment and ecosystem services, which provides a new way of rethinking and expands the scope of land resources management research. However, due to the limitation of data and research cases, the results can only explain the current situation of part of land transfer, and the methods and results of this paper can only serve as reference for other ways to realize the capitalization of land resources. In addition, the three stages of conversion into resource, resource–asset, and asset–capitalization are closely related and inseparable. How to evaluate the values of the land resource capitalization process from multiple angles, how to realize the values of ecosystem services in the process of property rights transformation, and who will pay for the ecological values of land need to be studied in depth. Due to the limitation of methods, time, and energy, it was impossible to collect all input data when evaluating the process of land resource capitalization, which may underestimate the environmental cost. In addition, some inputs, such as water hydrant and sand, did not have corresponding indexes in the database of the Gabi software (Sphera Solutions GmbH, Leinfelden–Echterdingen, Germany), so similar indexes were used for estimation, which may have affected the final evaluation results. Finally, when evaluating the values of ecosystem services, the relevant indicators refer to the previous research contents, which may have affected the accuracy of the value evaluation. In the future, it is necessary to further improve the theoretical and practical research on the land resource capitalization process, especially the value evaluation and ecological value realization in the capitalization process under different resource capitalization implementations.
6. Conclusions
As an effective policy to revitalize rural land assets and liberate rural labor force, land transfer has attracted much attention. Taking the land transfer in Chenjiagou, Fuping, Hebei Province as an example, this paper evaluates the environmental load, economic cost, and value changes of ecosystem services in the whole process of land resource capitalization by using LCA, LCC, and value evaluation of ecosystem services. The conclusions are as follows:
- (1)
- The process of resource capitalization under the land transfer mode will have a certain impact on the environment. The most significant indicators for the whole process on environment are Human toxicity, Marine ecotoxicity, Metal depletion, Climate change, Fossil depletion and Particulate matter formation.
- (2)
- The contribution degree of different links to environmental indicators is obviously different. The irrigation and drainage project has the most significant impact on the overall environment of resource capitalization, whereas the farmland protection and ecological conservation project has the least impact. On the whole, there is not necessarily a positive correlation between environmental load and economic cost.
- (3)
- In the conversion into resource stage, the maximum economic cost of different raw materials is not necessarily at the expense of the maximum environmental load. In the stage of resource–asset, different crops have different impacts on environmental indicators. From the value changes of ecosystem services, the positive function of the changes in ecosystem services occupies a dominant position, far exceeding its negative impact. In the stage of asset–capitalization, the proportion of the value in ecosystem services to the value added of capitalization is particularly prominent.
- (4)
- From the perspective of material and energy input, through sensitivity analysis of key environmental indicators, there is a possibility of reducing the potential environmental impact of inputs in the whole resource capitalization process.
Author Contributions
Conceptualization, W.F.; data curation, W.F. and W.Y.; formal analysis, W.Y., M.M., and X.W.; funding acquisition, W.F.; methodology, W.F. and X.W.; supervision, W.F., and N.C.; visualization, W.F. and N.C.; writing—original draft, W.F., N.C., and M.M.; writing—review and editing, W.F. and W.Y. All authors have read and agreed to the published version of the manuscript.
Funding
This research was funded by the Hebei Social Science Fund Project (HB20GL031).
Institutional Review Board Statement
Not applicable.
Informed Consent Statement
Not applicable.
Data Availability Statement
The data presented in this study are available on request from the corresponding author.
Conflicts of Interest
The authors declare no conflict of interest.
References
- Chen, W.; Shen, Y.; Wang, Y.A.; Wu, Q. The effect of industrial relocation on industrial land use efficiency in China: A spatial econometrics approach. J. Clean. Prod. 2018, 205, 525–535. [Google Scholar] [CrossRef]
- Zhang, Y.W.; Shao, L.; Sun, X.D.; Han, M.Y.; Zhao, X.L.; Meng, J.; Zhang, B.; Qiao, H. Outsourcing natural resource requirements within China. J. Environ. Manag. 2018, 228, 292–302. [Google Scholar] [CrossRef] [PubMed]
- Wang, X.C.; Dong, X.B.; Liu, H.M.; Wei, H.J.; Fan, W.G.; Lu, N.C.; Xu, Z.H.; Ren, J.H.; Xing, K.X. Linking land use change, ecosystem services and human well-being: A case study of the Manas river basin of Xinjiang, China. Ecosyst. Serv. 2017, 27, 113–123. [Google Scholar] [CrossRef]
- Zhou, Y.; Guo, L.Y.; Liu, Y.S. Land consolidation boosting poverty alleviation in China: Theory and practice. Land Use Pol. 2019, 82, 339–348. [Google Scholar] [CrossRef]
- Li, Y.J.; Kong, X.S.; Zhu, Z.Q. Multiscale analysis of the correlation patterns between the urban population and construction land in China. Sustain. Cities Soc. 2020, 61, 102326. [Google Scholar] [CrossRef]
- Gao, J.X.; Fan, X.S.; Li, H.M.; Tian, M.R. Research on constituent elements, operation modes and political demands for capitalizing ecological assets. Res. Environ. Sci. 2016, 29, 315–322. [Google Scholar]
- Yan, L.D.; Li, P.H.; Deng, Y.J.; Qu, Z.G. Research on capitalization value of natural resources-based on natural resources economics thinking. J. Arid Land Resour. Environ. 2018, 32, 1–9. [Google Scholar]
- Chen, W.J. A Study on Development of Land Capitalizationin Guangzhou City; South China University of Technology: Guangzhou, China, 2015. [Google Scholar]
- Duan, J.P.; Xu, D.R. Analysis of resources property right during the resources capitalization process in China. J. Zhengzhou Univ. Aeronaut. 2007, 6, 9–12. [Google Scholar]
- Zhang, X.Q.; Liu, S.M. Research on the basic theory of land consolidation and reclamation. Shanxi Agric. Econ. 2018, 21, 27–29. [Google Scholar]
- Zhang, J.H.; Zhao, X.J.; Wang, Y. Quantitative evaluation and application of economic benefits of land reclamation based on AHP theory. Resour. Econ. Environ. Prot. 2017, 9, 55–56. [Google Scholar]
- Xu, F.; Wang, Z.Q.; Zhang, H.W. Rural residential land recycling under the ecological concept. Resour. Sci. 2017, 39, 1238–1247. [Google Scholar]
- Hong, S.; Zhao, H.X.; Yuan, K.N. Guanting reservoir wetland park water quality project. Wetl. Sci. Manag. 2017, 13, 4–7. [Google Scholar]
- Shan, J.Z.; Li, J.M.; Xu, Z.H. Estimating ecological damage caused by green tides in the Yellow Sea: A choice experiment approach incorporating extended theory of planned behavior. Ocean Coast. Manag. 2019, 181, 104901. [Google Scholar] [CrossRef]
- Mostert, E.; Gaertner, M.; Holmes, P.M.; O’Farrell, P.J.; Richardson, D.M. A multi-criterion approach for prioritizing areas in urban ecosystems for active restoration following invasive plant control. Environ. Manag. 2019, 62, 1150–1167. [Google Scholar] [CrossRef] [PubMed]
- Gao, Y.; Han, Z.Y.; Cui, Y.Z.; Zhang, H.B.; Liu, L.L. Determination of the agricultural eco-compensation standards in ecological fragile poverty areas based on emergy synthesis. Sustainability 2019, 11, 2548. [Google Scholar] [CrossRef]
- Zhao, X.Q.; Li, S.N.; Pu, J.W.; Miao, P.P.; Wang, Q.; Tan, K. Optimization of the national land space based on the coordination of urban-agricultural-ecological functions in the karst areas of southwest China. Sustainability 2019, 11, 6752. [Google Scholar] [CrossRef]
- Li, T.; Lu, Y.H.; Fu, B.J.; Comber, A.J.; Harris, P.; Wu, L.H. Gauging policy-driven large-scale vegetation restoration programmes under a changing environment: Their effectiveness and socio-economic relationships. Sci. Total Environ. 2017, 607, 911–919. [Google Scholar] [CrossRef]
- Yang, W.; Jin, Y.W.; Sun, T.; Yang, Z.F.; Cai, Y.P.; Yi, Y.J. Trade-offs among ecosystem services in coastal wetlands under the effects of reclamation activities. Ecol. Indic. 2018, 92, 354–366. [Google Scholar] [CrossRef]
- Khan, I.; Zhao, M.J.; Khan, S.U. Ecological degradation of an inland river basin and an evaluation of the spatial and distance effect on willingness to pay for its improvement. Environ. Sci. Pollut. Res. 2018, 25, 31474–31485. [Google Scholar] [CrossRef] [PubMed]
- Khan, I.; Lei, H.D.; Ali, G.; Ali, S.; Zhao, M.J. Public attitudes, preferences and willingness to pay for river ecosystem services. Int. J. Environ. Res. Public Health 2019, 16, 3707. [Google Scholar] [CrossRef]
- Qu, Y.; Long, H.L. The economic and environmental effects of land use transitions under rapid urbanization and the implications for land use management. Habitat Int. 2018, 82, 113–121. [Google Scholar] [CrossRef]
- Ustaoglu, E.; Williams, B. Determinants of urban expansion and agricultural land conversion in 25 EU countries. Environ. Manag. 2017, 60, 717–746. [Google Scholar] [CrossRef] [PubMed]
- Shen, X.Q.; Wang, L.P.; Wang, X.D.; Zhang, Z.; Lu, Z.W. Interpreting non-conforming urban expansion from the perspective of stakeholders’ decision-making behavior. Habitat Int. 2019, 89, 102007. [Google Scholar] [CrossRef]
- Zhou, C. On the constitution of land property rights in my country. China Land Sci. 1997, 3, 1–6. [Google Scholar]
- Fu, G.; Chen, W.K.; Li, S.Y.; Tang, H. The dilemma and path choice of promoting property right marketization of rural resources in China. Issues Agric. Econ. 2016, 37, 14–23. [Google Scholar]
- Chen, H. Research on the value composition of allocated land and its evaluation method. Times Financ. 2015, 33, 369–373. [Google Scholar]
- Zhu, Y.L.; Li, J.; He, B.N. Research on the economic feasibility of rural land securitization. Product. Res. 2008, 9, 37–38. [Google Scholar]
- Zhang, X.G. Legal attribute and regulation of land ticket tradeoff. J. Nanjing Agric. Univ. Soc. Sci. Ed. 2015, 4, 106–113. [Google Scholar]
- Luo, S.W. The capitalization trend of rural land and the key points of management. China Land 2011, 6, 55–56. [Google Scholar]
- Tang, P.C.; Yang, S.W.; Fu, S.K. Do political incentive affects China’s land transfer in energy-intensive industries? Energy 2018, 164, 550–559. [Google Scholar] [CrossRef]
- Xu, D.D.; Cao, S.; Wang, X.X.; Liu, S.Q. Influences of labor migration on rural household land transfer: A case study of Sichuan Province, China. J. Mt. Sci. 2018, 15, 2055–2067. [Google Scholar] [CrossRef]
- Peng, K.L.; Yang, C.; Chen, Y. Land transfer in rural China: Incentives, influencing factors and income effects. Appl. Econ. 2020, 52, 5477–5490. [Google Scholar] [CrossRef]
- Lu, N.C.; Wei, H.J.; Fan, W.G.; Xu, Z.H.; Wang, X.C.; Xing, K.X.; Dong, X.B.; Viglia, S.; Ulgiati, S. Multiple influences of land transfer in the integration of Beijing-Tianjin-Hebei region in China. Ecol. Indic. 2018, 90, 101–111. [Google Scholar] [CrossRef]
- Li, B.W.; Shen, Y.Q. Effects of land transfer quality on the application of organic fertilizer by large-scale farmers in China. Land Use Pol. 2021, 100, 105124. [Google Scholar] [CrossRef]
- General Office of Hebei Provincial Committee of the Communist Party of China. Implementation opinions on guiding the orderly transfer of rural land management rights to develop agricultural appropriate scale operation. Hebei Agric. 2015, 9, 4–8. [Google Scholar]
- Li, J.T.; Sun, Z.F. Does the transfer of state-owned land-use rights promote or restrict urban development? Land Use Pol. 2021, 100, 104945. [Google Scholar] [CrossRef]
- Chandra, V.V.; Hemstock, S.L.; Mwabonje, O.N.; N’Yeurt, A.D.; Woods, J. Life cycle assessment of sugarcane growing process in Fiji. Sugar Tech 2018, 20, 692–699. [Google Scholar] [CrossRef]
- Woldegebriel, D.; Udo, H.; Viets, T.; van der Harst, E.; Potting, J. Environmental impact of milk production across an intensification gradient in Ethiopia. Livest. Sci. 2017, 206, 28–36. [Google Scholar] [CrossRef]
- Behrooznia, L.; Sharifi, M.; Alimardani, R.; Mousavi-Avval, S.H. Sustainability analysis of landfilling and composting-landfilling for municipal solid waste management in the north of Iran. J. Clean. Prod. 2018, 203, 1028–1038. [Google Scholar] [CrossRef]
- Kim, K.J.; Yun, W.G.; Cho, N.; Ha, J. Life cycle assessment based environmental impact estimation model for pre-stressed concrete beam bridge in the early design phase. Environ. Impact Assess. Rev. 2017, 64, 47–56. [Google Scholar] [CrossRef]
- Anwani, S.; Methekar, R.; Ramadesigan, V. Life cycle assessment and economic analysis of acidic leaching and baking routes for the production of cobalt oxalate from spent lithium-ion batteries. J. Mater. Cycles Waste Manag. 2020, 22, 2092–2106. [Google Scholar] [CrossRef]
- Fan, W.G.; Dong, X.B.; Wei, H.J.; Weng, B.Q.; Liang, L.; Xu, Z.H.; Wang, X.C.; Wu, F.L.; Chen, Z.D.; Jin, Y.; et al. Is it true that the longer the extended industrial chain, the better the circular agriculture? A case study of circular agriculture industry company in Fuqing, Fujian. J. Clean. Prod. 2018, 189, 718–728. [Google Scholar] [CrossRef]
- Zhu, X.Z.; Ho, C.H.; Wang, X.N. Application of Life cycle assessment and machine learning for high-throughput screening of green chemical substitutes. ACS Sustain. Chem. Eng. 2020, 8, 11141–11151. [Google Scholar] [CrossRef]
- de Bortoli, A.; Bouhaya, L.; Feraille, A. A life cycle model for high-speed rail infrastructure: Environmental inventories and assessment of the Tours-Bordeaux railway in France. Int. J. Life Cycle Assess. 2020, 25, 814–830. [Google Scholar] [CrossRef]
- Bhatt, A.; Bradford, A.; Abbassi, B.E. Cradle-to-grave life cycle assessment (LCA) of low-impact-development (LID) technologies in southern Ontario. J. Environ. Manag. 2019, 231, 98–109. [Google Scholar] [CrossRef]
- Fan, W.G.; Chen, N.; Li, X.M.; Wei, H.J.; Wang, X.C. Empirical research on the process of land resource-asset-capitalization—A case study of Yanba, Jiangjin district, Chongqing. Sustainability 2020, 12, 1236. [Google Scholar] [CrossRef]
- Xu, Z.H.; Fan, W.G.; Wei, H.J.; Zhang, P.; Ren, J.H.; Gao, Z.C.; Sergio, U.; Kong, W.D.; Dong, X.B. Evaluation and simulation of the impact of land use change on ecosystem services based on a carbon flow model: A case study of the Manas River Basin of Xinjiang, China. Sci. Total Environ. 2019, 652, 117–133. [Google Scholar] [CrossRef]
- Millennium Ecosystem Assessment. Ecosystems and Human Well-Being Synthesis; Island Press: Washington, DC, USA, 2014. [Google Scholar]
- Chen, H.; Nie, J.Y.; Xiang, P.A. Multifunctional value evaluation of rice production in Hunan Province. Ecol. Econ. 2013, 2, 21–27. [Google Scholar]
- Liu, L.H.; Yin, C.B.; Qian, X.P. Construction of value system of paddy resources and its value evaluation—Taking Nanjing as an example. Chin. J. Agric. Resour. Reg. Plan. 2015, 36, 29–37. [Google Scholar]
- Liu, M.C.; Li, D.Q.; Wen, Y.M.; Luan, X.F. The spatial analysis of soil retention function in Sanjiangyuan region and its value evaluation. China Environ. Sci. 2005, 5, 627–631. [Google Scholar]
- Xie, G.D.; Xiao, Y.; Zhen, L.; Lu, C.X. Study on ecosystem services value of food production in China. Chin. J. Eco-Agric. 2005, 3, 10–13. [Google Scholar]
- You, S.C.; Li, W.Q. Estimation of soil erosion supported by Gis—A case study in Guanji township, Taihe, Jiangxi. J. Nat. Resour. 1999, 14, 63–69. [Google Scholar]
- Min, Q.W.; He, L.; Sun, Y.H.; Zhang, D.; Yuan, Z.; Xu, Y.T.; Bai, Y.Y. On the value, conservation and sustainable development of GIAHS pilot sites in China. Chin. J. Eco-Agric. 2012, 20, 668–673. [Google Scholar] [CrossRef]
- Xiang, P.A.; Huang, H.; Yan, H.M. Environmental cost of rice production in Dongting Lake area of Hunan Province. Chin. J. Appl. Ecol. 2005, 16, 183–189. [Google Scholar]
- Yuan, X.Z.; Xiao, H.Y.; Yan, W.T.; Li, B. Dynamic analysis of land use and ecosystem services value in Cheng-Yu Economic Zone, Southwest China. Chin. J. Ecol. 2012, 31, 180–186. [Google Scholar]
- Mallapragada, D.S.; Reyes-Bastida, E.; Roberto, F.; McElroy, E.M.; Veskovic, D.; Laurenzi, I.J. Life cycle greenhouse gas emissions and freshwater consumption of liquefied Marcellus shale gas used for international power generation. J. Clean. Prod. 2018, 205, 672–680. [Google Scholar] [CrossRef]


Publisher’s Note: MDPI stays neutral with regard to jurisdictional claims in published maps and institutional affiliations. |
© 2021 by the authors. Licensee MDPI, Basel, Switzerland. This article is an open access article distributed under the terms and conditions of the Creative Commons Attribution (CC BY) license (http://creativecommons.org/licenses/by/4.0/).