
A Hybrid MCDM Approach towards Resilient Sourcing


Abstract
1. Introduction
2. Literature Review
2.1. Supply Chain Resilience
2.2. Resilient Supplier Selection
2.3. MCDM Methods in Supplier Selection
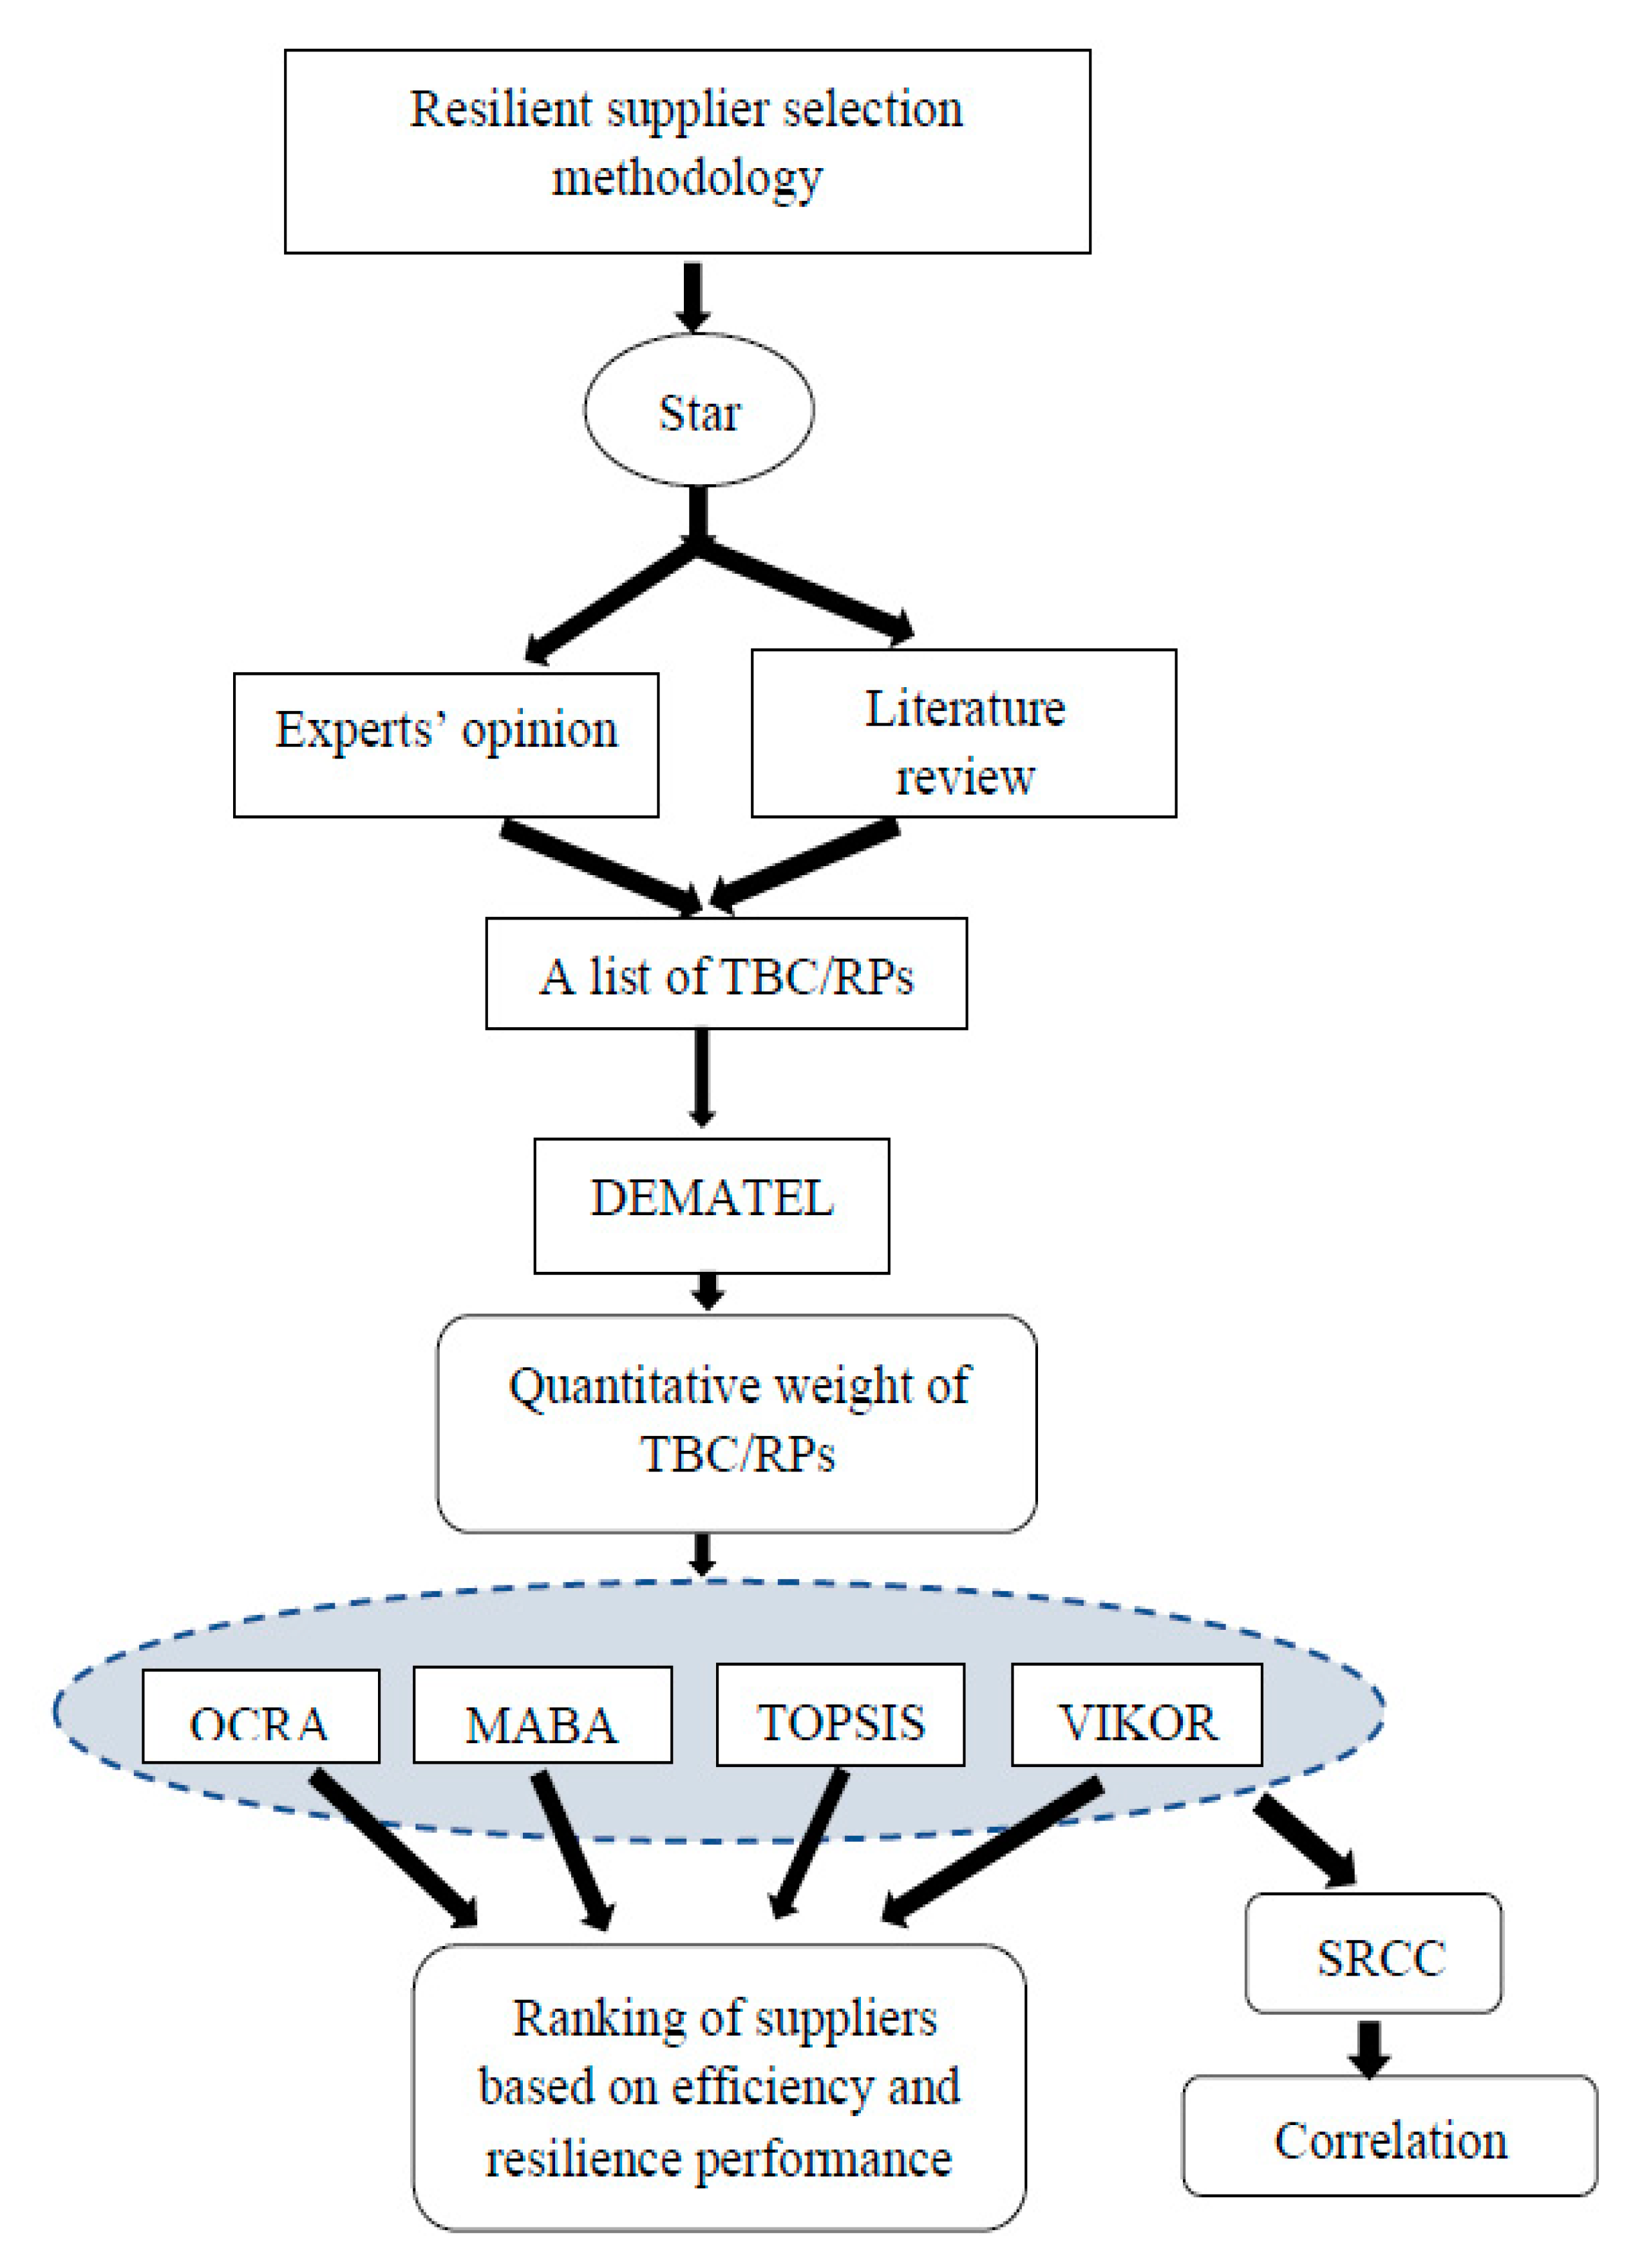
3. Resilient Purchasing: D-MOTV Approach
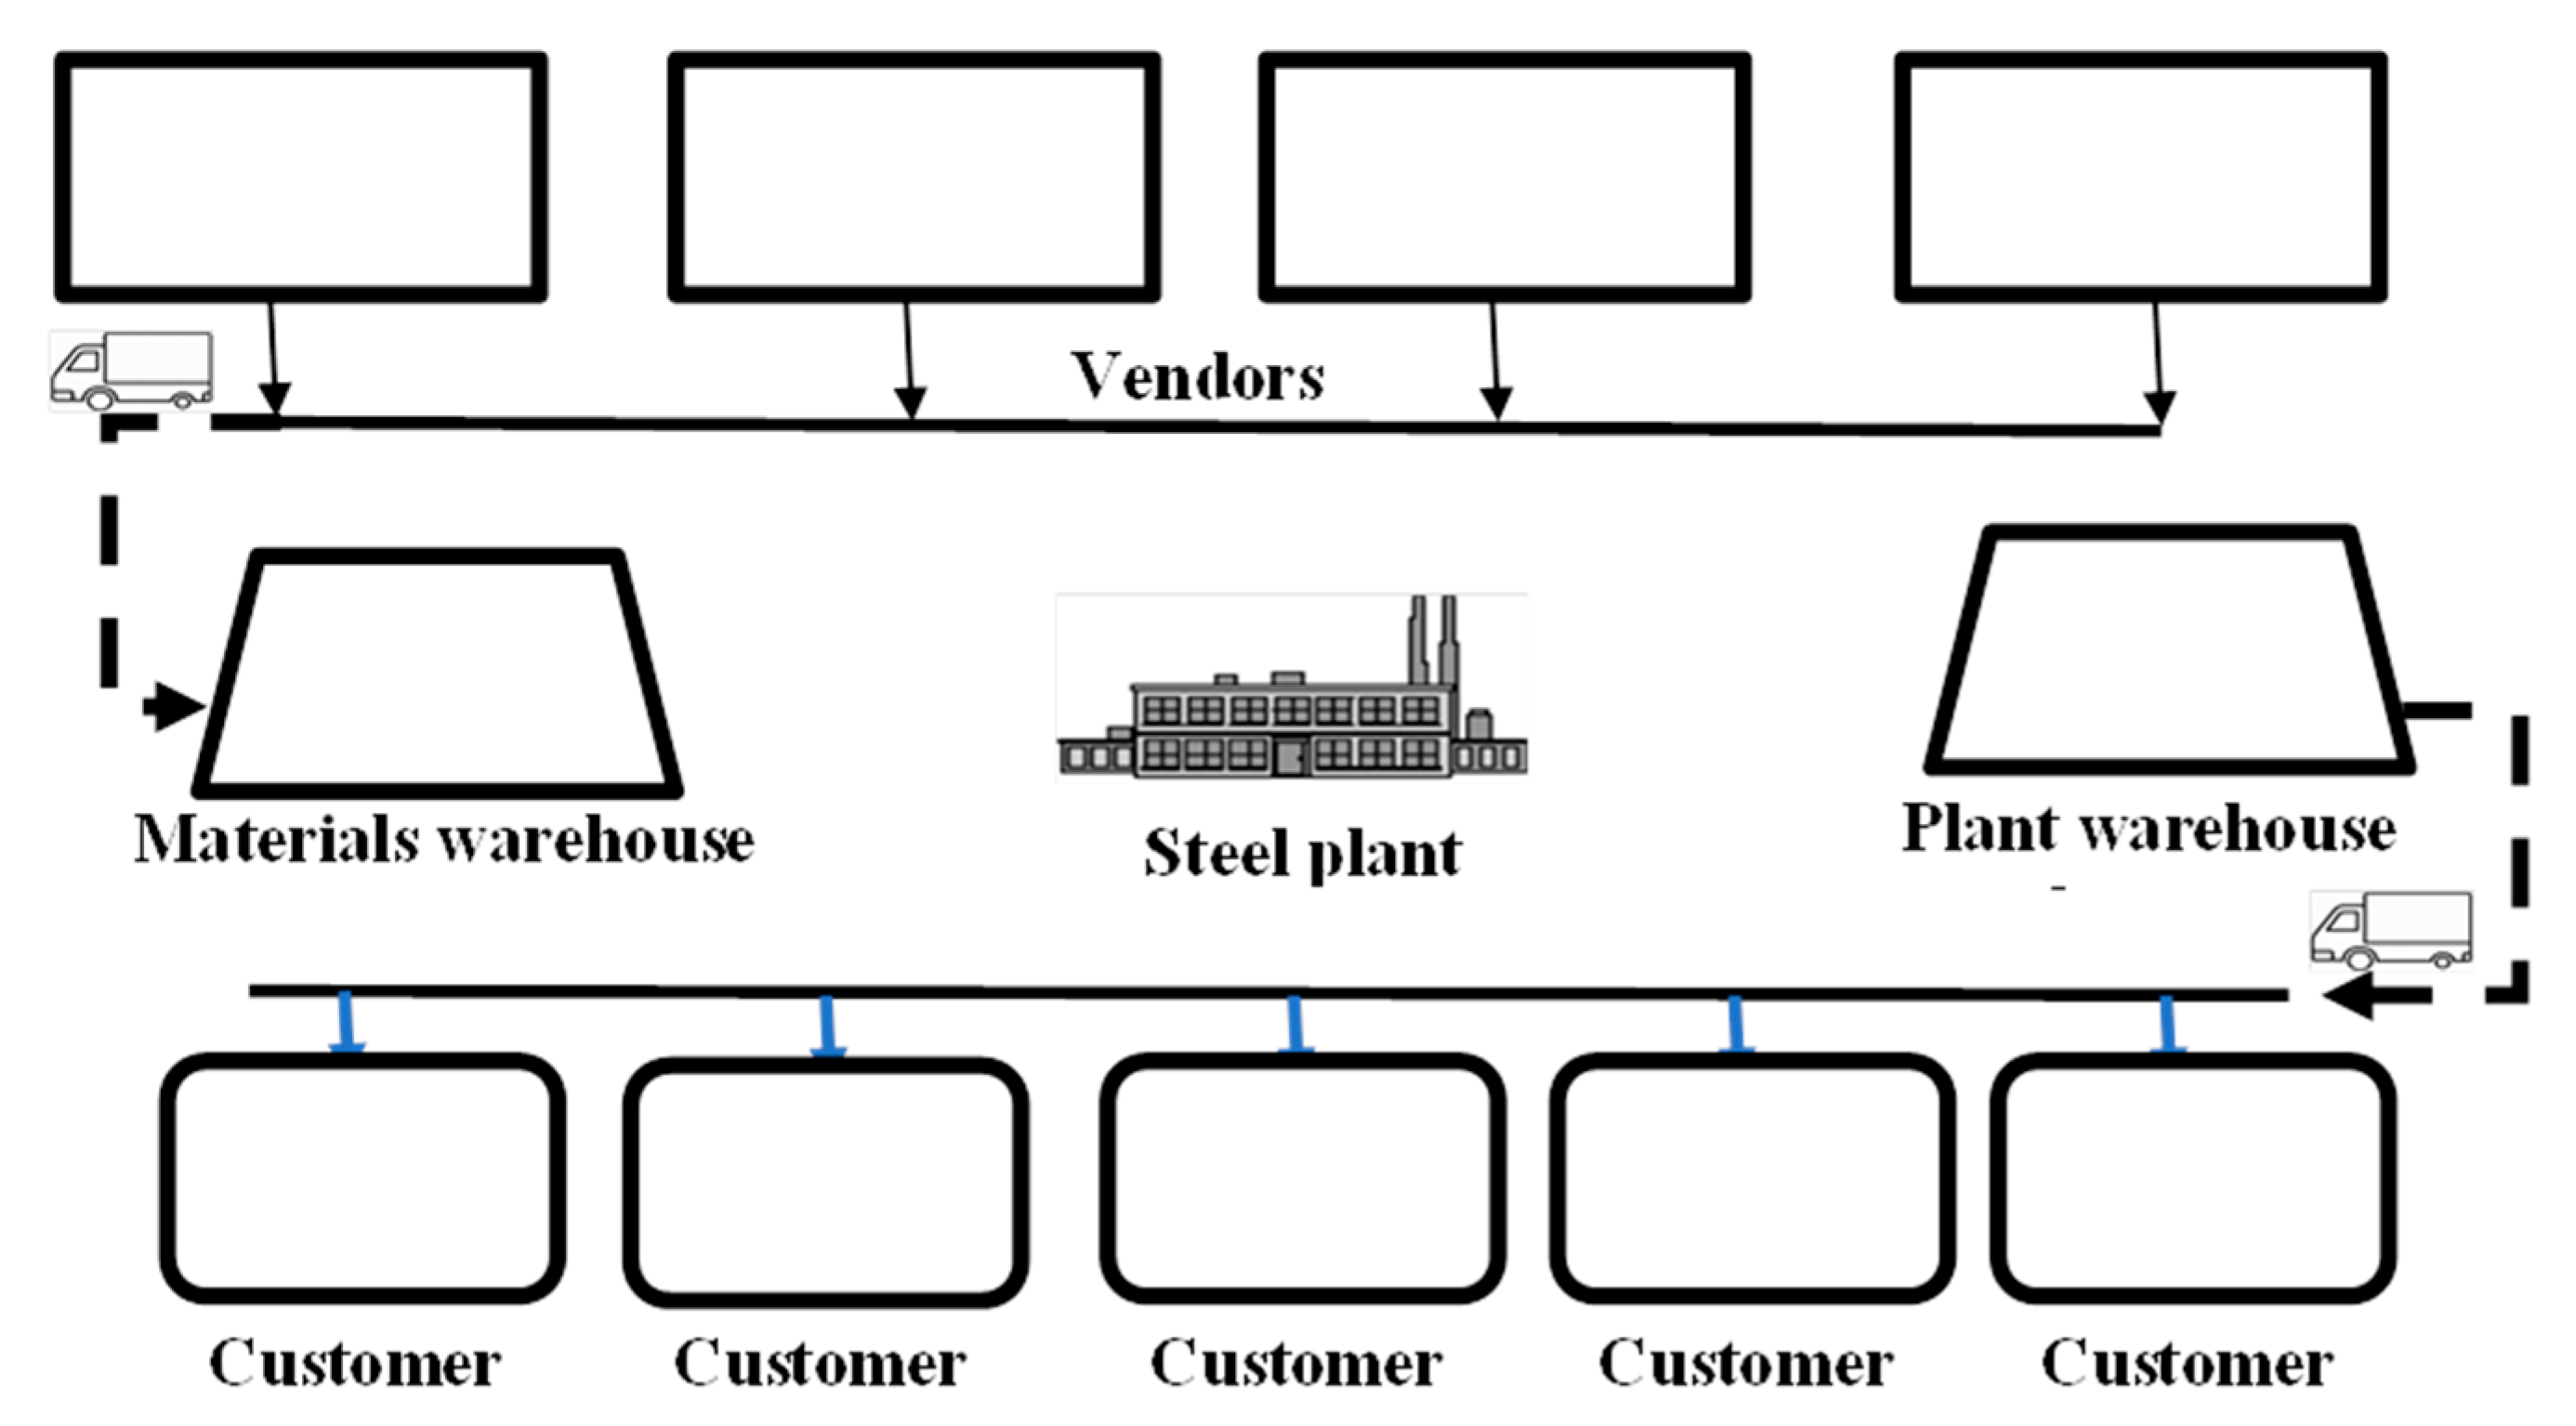
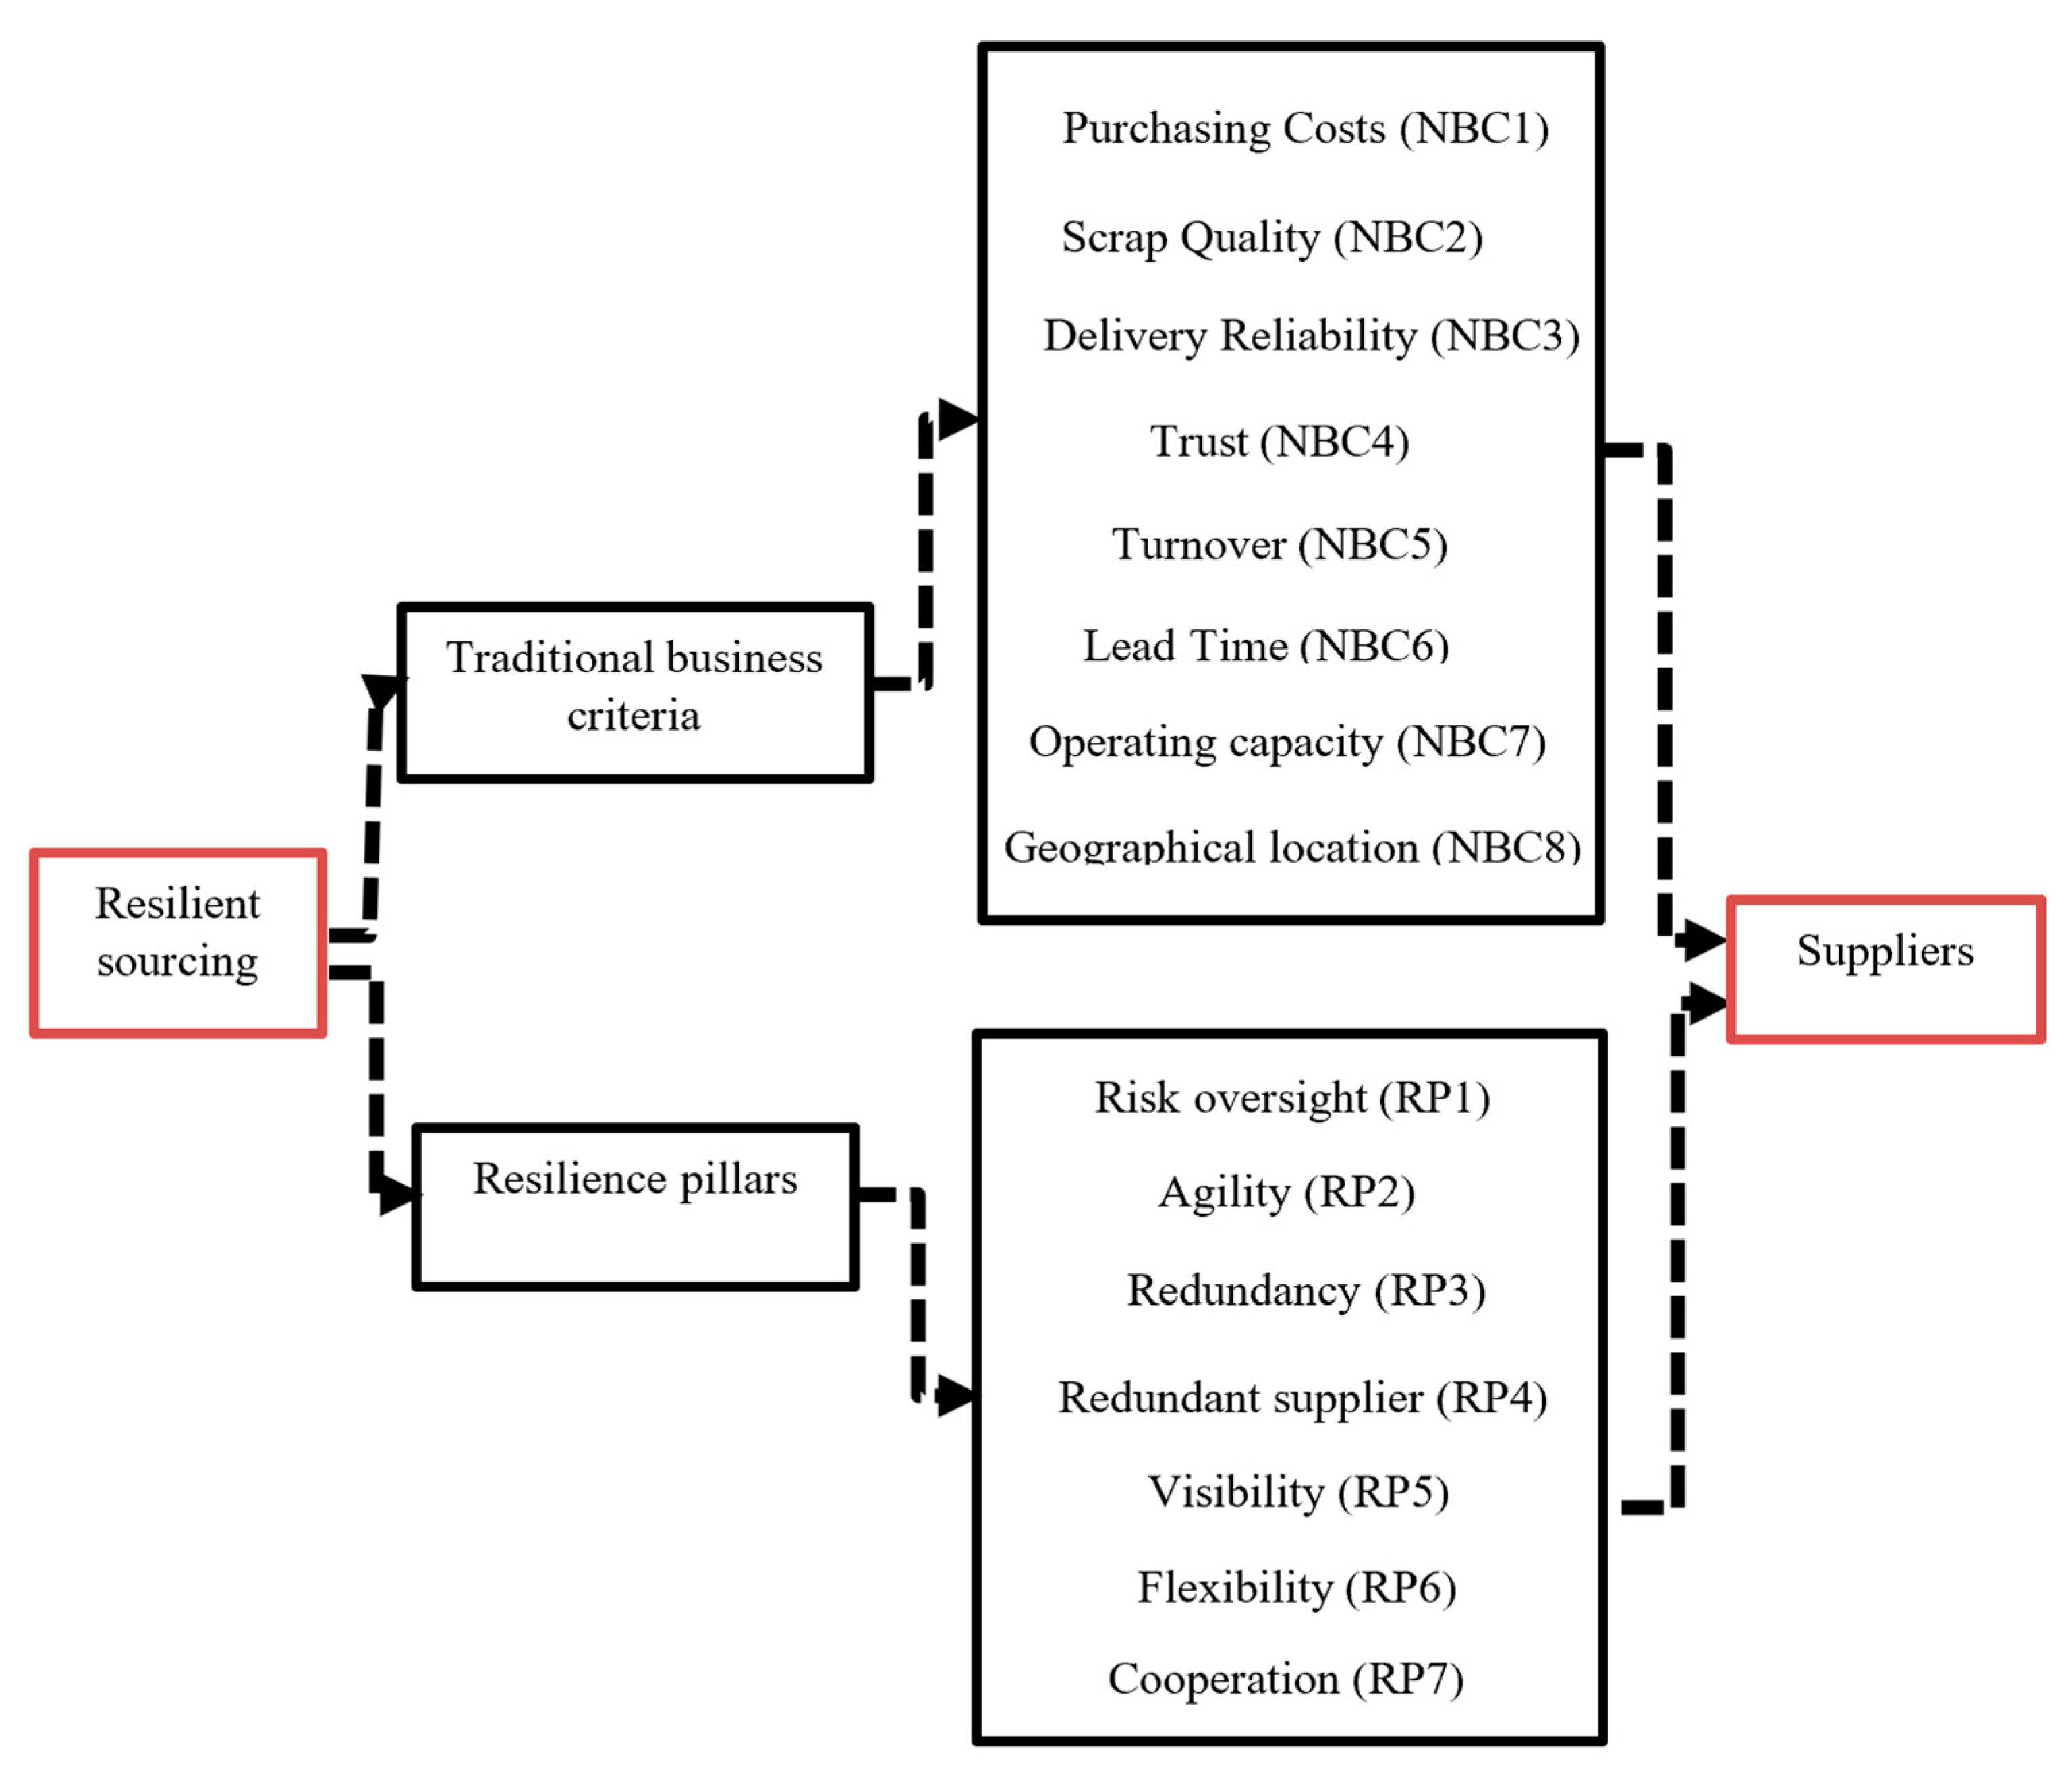
3.1. Problem Statement
3.2. DEMATEL: Quantifying the Importance of TBC/RP
3.3. MOTV: Evaluation of Supplier Performance
3.3.1. MABAC
3.3.2. OCRA
3.3.3. TOPSIS
3.3.4. VIKOR
3.4. SRCC: Exploring Correlation among MOTV
- 1 🡲 “absolute”;
- 0.8–0.999 🡲 “very strong”;
- 0.6–0.79 🡲 “strong”;
- 0.4–0.59 🡲 “moderate”;
- 0.2–0.39 🡲 “weak”;
- SRCC < 0.19 🡲 “very weak”.
4. The D-MOTV Approach: Results and Discussion
- The purchasing manager who has been working in the procurement field for 20 years;
- Two senior buyers with an average of 8 years’ experience in the purchasing department;
- A buyer with 3 years’ experience in production and purchasing;
- 1A junior buyer who joined the company 8 months ago (from the date of data collection).
4.1. Quantifying Criteria: DEMATEL
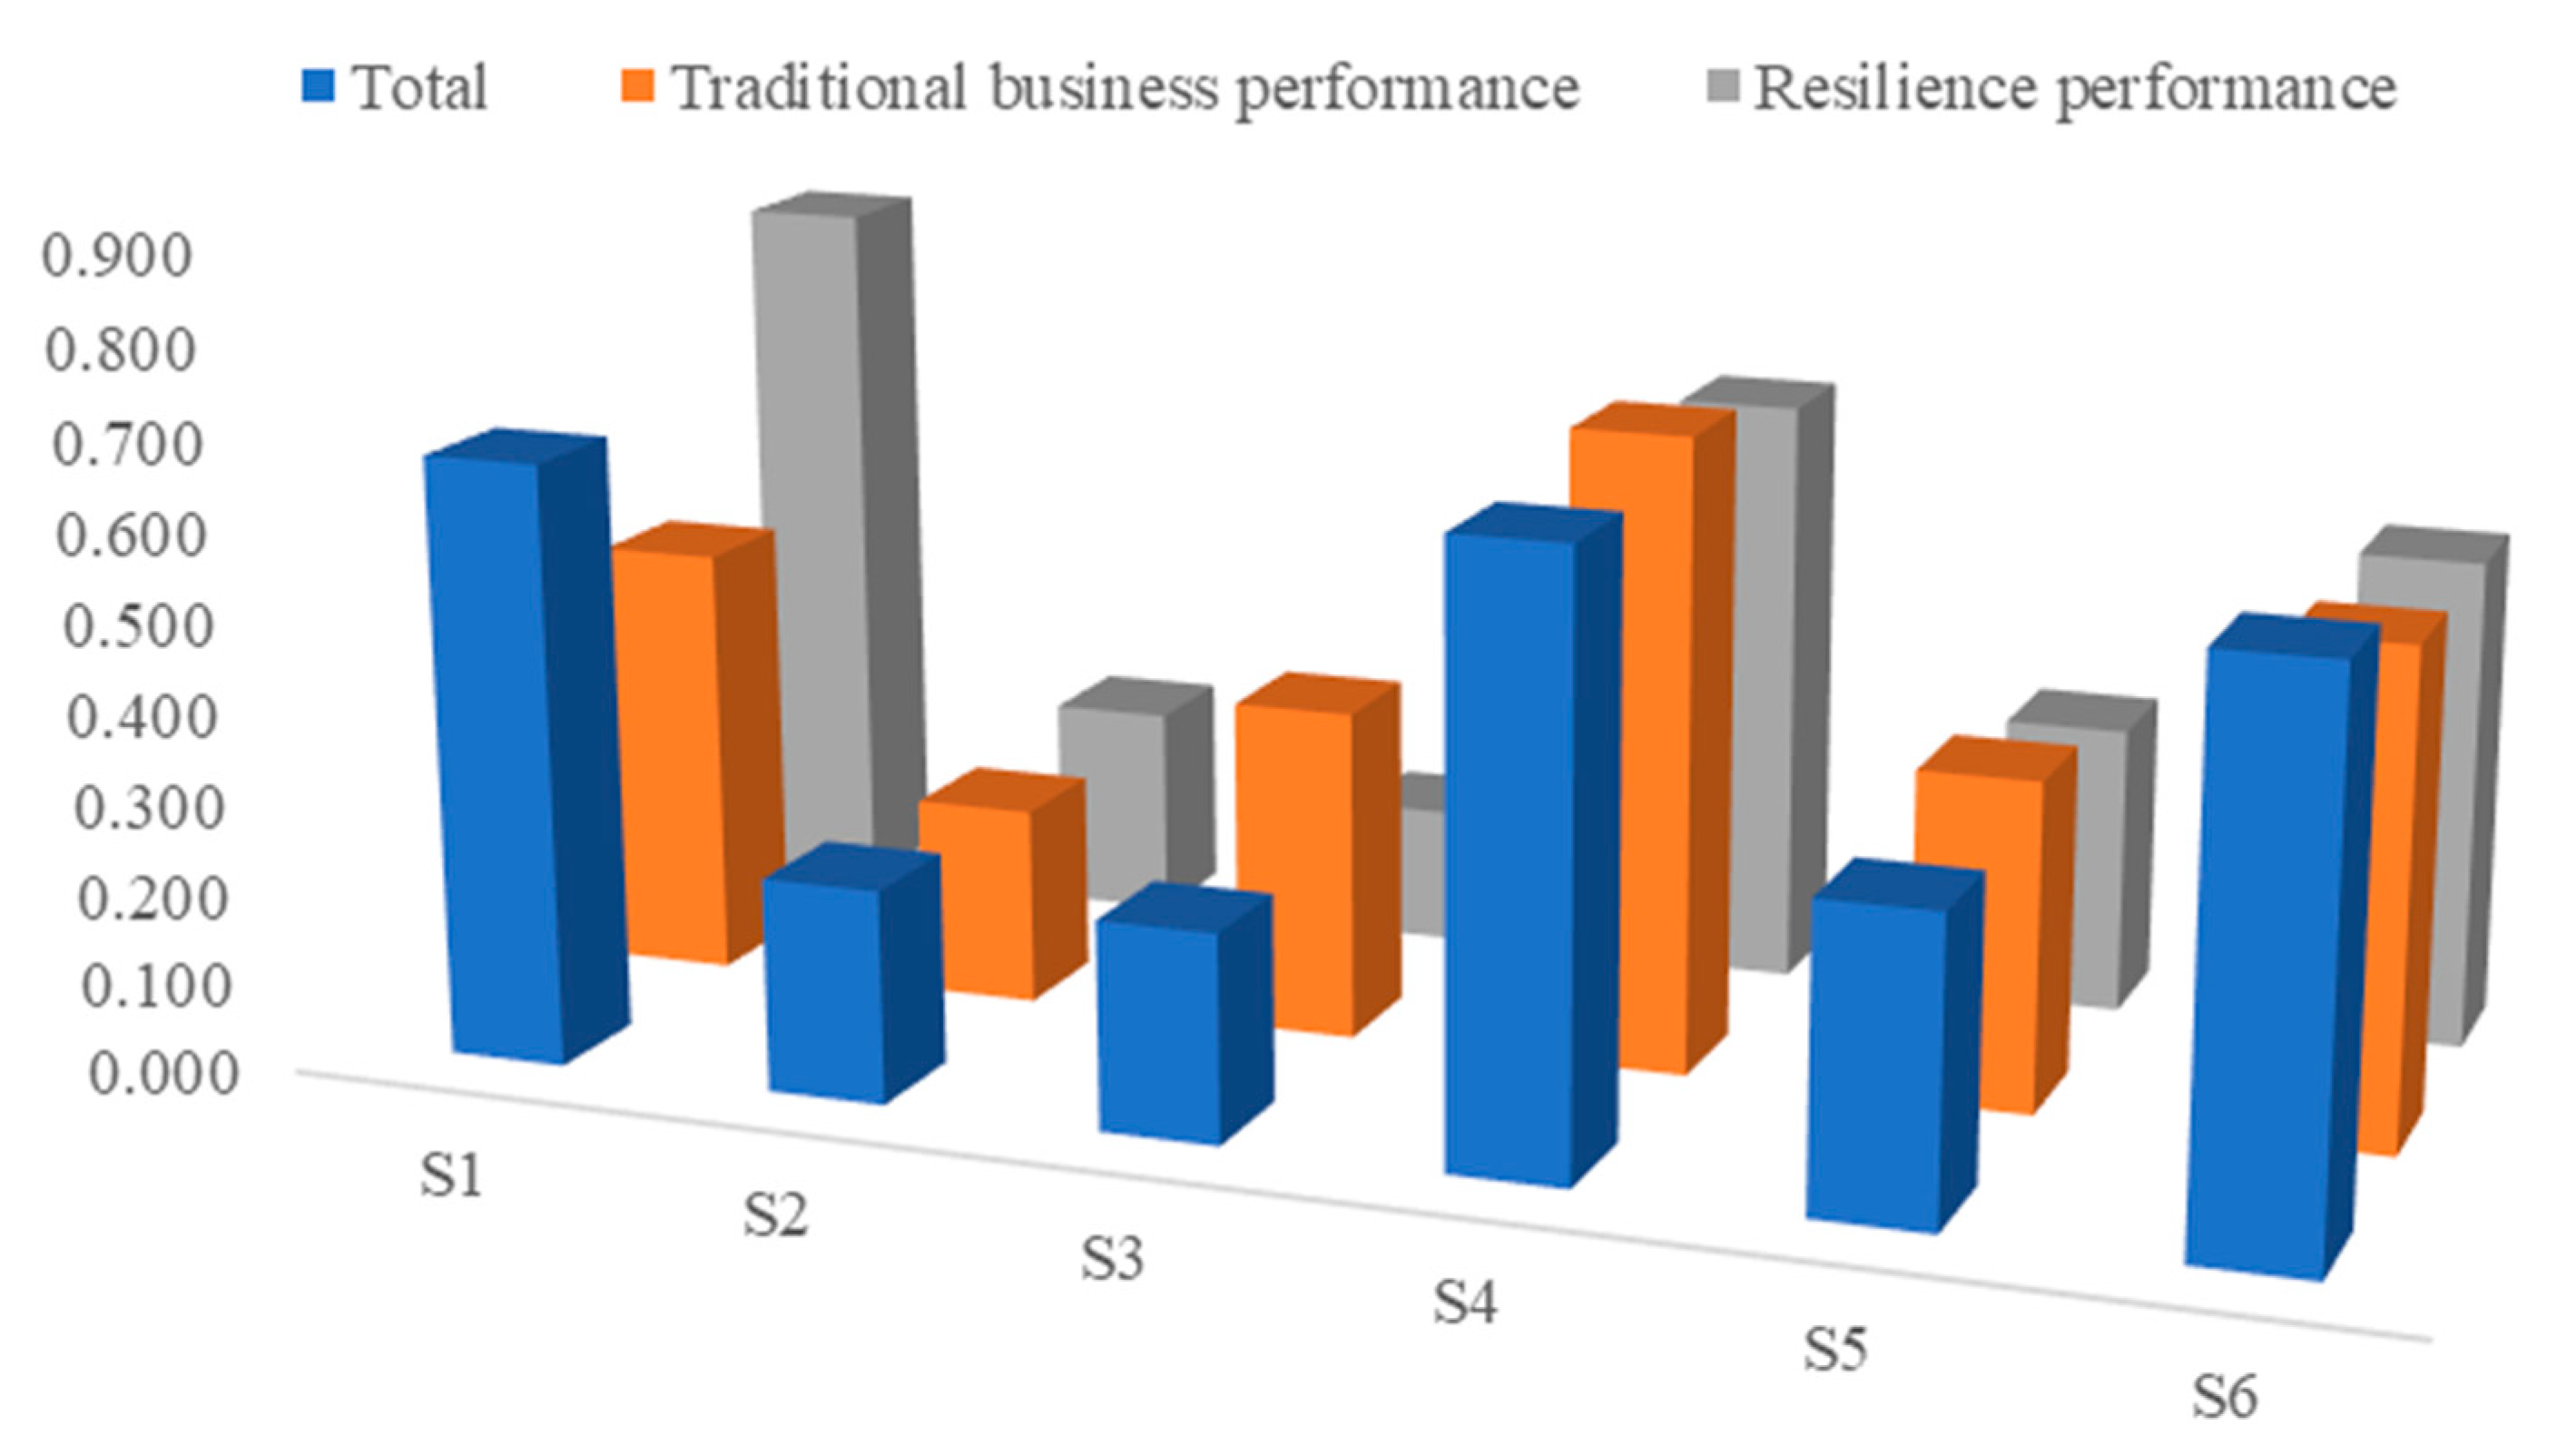
4.2. Comparing the Performance of Suppliers (MOTV)
4.2.1. MABAC
4.2.2. OCRA
4.2.3. TOPSIS
4.2.4. VIKOR
4.3. Managerial Implications
5. Conclusions
Author Contributions
Funding
Data Availability Statement
Conflicts of Interest
Abbreviation
| AHP | Analytic Hierarchy Process |
| ANP | Analytic Network Process |
| CC | Closeness Coefficient |
| COPRAS | COmplex PRoportional ASsessment |
| DEA | Data Envelopment Analysis |
| DEMATEL | Decision Making Trial and Evaluation Laboratory |
| D-MOTV | DEMATEL-MABAC-OCRA-TOPSIS-VIKOR |
| ELECTRE | ELimination Et Choix Traduisant la REalité. |
| GRA | Grey Relational Analysis |
| G-SAW | Grey Simple Additive Weighting |
| IT2FS | Interval Type-2 Fuzzy Set |
| LP | Linear Programming |
| MABAC | Multi-Attributive Border Approximation area Comparison |
| MCDM | Multi-Criteria Decision Making |
| MOOM | Multi-Objective Optimization Model |
| MOORA | Multi-Objective Optimization by Ratio Analysis |
| MOTV | MABAC- OCRA- TOPSIS- VIKOR |
| OCRA | Operational Competitiveness RAting |
| PROMETHEE | Preference Ranking Organization METHod for Enrichment Evaluation |
| QFD | Quality function deployment |
| RP | Resilience Pillar |
| SAW | Simple Additive Weighting |
| SC | Supply Chain |
| SCRM | Supply Chain Risk Management |
| SME | Small and Medium sized Enterprise |
| SRCC | Spearman Rank Correlation Coefficient |
| SSP | Supplier Selection Process |
| SWARA | Stepwise Weight Assessment Ratio Analysis |
| TBC | Traditional Business Criteria |
| TODIM | Interactive and Multi-Criteria Decision-Making |
| TOPSIS | Technique for Order of Preference by Similarity to Ideal Solution |
| VIKOR | VIseKriterijumska Optimizacija I Kompromisno Resenje |
| WASPAS | Weighted Aggregates Sum Product Assessment |
References
- Svensson, G. Perceived trust towards suppliers and customers in supply chains of the Swedish automotive industry. Int. J. Phys. Distrib. Logist. Manag. 2001, 31, 647–662. [Google Scholar] [CrossRef]
- BBC News. Japan Disaster: Supply Shortages in Three Months. BBC News. 18 March 2011. Available online: https://www.bbc.co.uk/news/business-12782566 (accessed on 11 February 2020).
- Hall, J. Volcanic Ash Cloud Leaves Shops Facing Shortages of Fruit, Vegetables and Medicine. The Daily Telegraph. 16 April 2011. Available online: https://www.telegraph.co.uk/finance/newsbysector/retailandconsumer/7599042/Volcanic-ash-cloud-leaves-shops-facing-shortages-of-fruit-vegetables-and-medicine.html (accessed on 1 January 2020).
- Burnson, P. Nation’s Supply Chains Disrupted by Hurricane Sandy. Logistics Management. 30 October 2012. Available online: https://www.logisticsmgmt.com/article/nations_supply_chains_disrupted_by_hurricane_sandy (accessed on 12 February 2020).
- Ribeiro, J.P.; Barbosa-Povoa, A. Supply Chain Resilience: Definitions and quantitative modelling approaches—A literature review. Comput. Ind. Eng. 2018, 115, 109–122. [Google Scholar] [CrossRef]
- Christopher, M.; Peck, H. Building the Resilient Supply Chain. Int. J. Logist. Manag. 2004, 15, 1–14. [Google Scholar] [CrossRef]
- Ponomarov, S.Y.; Holcomb, M.C. Understanding the concept of supply chain resilience. Int. J. Logist. Manag. 2009, 20, 124–143. [Google Scholar] [CrossRef]
- Holling, C.S. Resilience and Stability of Ecological Systems. Annu. Rev. Ecol. Syst. 1973, 4, 1–23. [Google Scholar] [CrossRef]
- Gunderson, L.H. Resilience in theory and practice. Annu. Rev. Ecol. Syst. 2000, 31, 425–439. [Google Scholar] [CrossRef]
- Carpenter, S.R.; Walker, B.L.E.; Anderies, J.M.; Abel, N. From Metaphor to Measurement: Resilience of What to What? Ecosystems 2001, 4, 765–781. [Google Scholar] [CrossRef]
- Hamel, G.; Valikangas, L. The quest for resilience. Harv. Bus. Rev. 2003, 81, 52–63. [Google Scholar]
- Kendra, J.M.; Wachtendorf, T. Elements of Resilience after the World Trade Center Disaster: Reconstituting New York City’s Emergency Operations Centre. Disasters 2003, 27, 36–53. [Google Scholar] [CrossRef] [PubMed]
- Boss, P. Resilience and health. Grief Matters Aust. J. Grief Bereave. 2006, 9, 52. [Google Scholar]
- Aburn, G.; Gott, M.; Hoare, K.J. What is resilience? An Integrative Review of the empirical literature. J. Adv. Nurs. 2016, 72, 980–1000. [Google Scholar] [CrossRef]
- Sheffi, Y. Resilience reduces risk. Logist. Q. 2006, 12, 12–14. [Google Scholar]
- Jackson, D.; Firtko, A.; Edenborough, M. Personal resilience as a strategy for surviving and thriving in the face of workplace adversity: A literature review. J. Adv. Nurs. 2007, 60, 1–9. [Google Scholar] [CrossRef]
- Pettit, T.J.; Fiksel, J.; Croxton, K.L. Ensuring supply chain resilience: Development of a conceptual framework. J. Bus. Logist. 2010. [Google Scholar] [CrossRef]
- Zhang, D.; Jiang, Q.; Ma, X.; Li, B. Drivers for food risk management and corporate social responsibility; a case of Chinese food companies. J. Clean. Prod. 2014, 66, 520–527. [Google Scholar] [CrossRef]
- Jüttner, U.; Maklan, S. Supply chain resilience in the global financial crisis: An empirical study. Supply Chain Manag. Int. J. 2011, 16, 246–259. [Google Scholar] [CrossRef]
- Yao, Y.; Meurier, B. Understanding the supply chain resilience: A Dynamic Capabilities approach. In Proceedings of the 9th International Meetings of Research in Logistics, Paris, France, 16 August 2012; pp. 1–17. [Google Scholar]
- Southwick, S.M.; Bonanno, G.A.; Masten, A.S.; Panter-Brick, C.; Yehuda, R. Resilience definitions, theory, and challenges: Interdisciplinary perspectives. Eur. J. Psychotraumatology 2014, 5, 25338. [Google Scholar] [CrossRef] [PubMed]
- Wang, J.; Muddada, R.R.; Wang, H.; Ding, J.; Lin, Y.; Liu, C.; Zhang, W. Toward a Resilient Holistic Supply Chain Network System: Concept, Review and Future Direction. IEEE Syst. J. 2014, 10, 410–421. [Google Scholar] [CrossRef]
- Fiksel, J. Sustainability and resilience: Toward a systems approach. Sustain. Sci. Pr. Policy 2006, 2, 14–21. [Google Scholar] [CrossRef]
- Fiksel, J.; Polyviou, M.; Croxton, K.L.; Pettit, T.J. From risk to resilience: Learning to deal with disruption. MIT Sloan Manag. Rev. 2015, 56, 79–86. [Google Scholar]
- Elleuch, H.; Dafaoui, E.; Elmhamedi, A.; Chabchoub, H. Resilience and Vulnerability in Supply Chain: Literature review. IFAC-PapersOnLine 2016, 49, 1448–1453. [Google Scholar] [CrossRef]
- Um, J.; Han, N. Understanding the relationships between global supply chain risk and supply chain resilience: The role of mitigating strategies. Supply Chain Manag. Int. J. 2020, in press. [Google Scholar] [CrossRef]
- Li, G.; Kou, G.; Peng, Y. Fuzzy information fusion approach for supplier selection. In International Conference on Oriental Thinking and Fuzzy Logic; Springer: Cham, Switzerland, 2016; pp. 51–63. [Google Scholar]
- Ergu, D.; Kou, G.; Shang, J. A Modular-Based Supplier Evaluation Framework: A Comprehensive Data Analysis of ANP Structure. Int. J. Inf. Technol. Decis. Mak. 2014, 13, 883–916. [Google Scholar] [CrossRef]
- Mohammed, A.; Setchi, R.; Filip, M.; Harris, I.; Li, X. An integrated methodology for a sustainable two-stage supplier selection and order allocation problem. J. Clean. Prod. 2018, in press. [Google Scholar] [CrossRef]
- Mohammed, A. Towards a sustainable assessment of suppliers: An integrated fuzzy TOPSIS-possibilistic multi-objective approach. Ann. Oper. Res. 2019, 293, 639–668. [Google Scholar] [CrossRef]
- De Boer, L.; Labro, E.; Morlacchi, P. A review of methods supporting supplier selection. Eur. J. Purch. Supply Manag. 2001, 7, 75–89. [Google Scholar] [CrossRef]
- Chen, J.; Kou, G.; Peng, Y. The dynamic effects of online product reviews on purchase decisions. Technol. Econ. Dev. Econ. 2018, 24, 2045–2064. [Google Scholar] [CrossRef]
- Mensah, P.; Merkuryev, Y. Developing a Resilient Supply Chain. Procedia Soc. Behav. Sci. 2014, 110, 309–319. [Google Scholar] [CrossRef]
- Ruiz-Benitez, R.; López, C.; Real, J.C. Environmental benefits of lean, green and resilient supply chain management: The case of the aerospace sector. J. Clean. Prod. 2017, 167, 850–862. [Google Scholar] [CrossRef]
- Pettit, T.J.; Croxton, K.L.; Fiksel, J. The Evolution of Resilience in Supply Chain Management: A Retrospective on Ensuring Supply Chain Resilience. J. Bus. Logist. 2019, 40, 56–65. [Google Scholar] [CrossRef]
- Stone, J.; Rahimifard, S. Resilience in agri-food supply chains: A critical analysis of the literature and synthesis of a novel framework. Supply Chain Manag. Int. J. 2018, 23, 207–238. [Google Scholar] [CrossRef]
- Kamalahmadi, M.; Parast, M.M. A review of the literature on the principles of enterprise and supply chain resilience: Major findings and directions for future research. Int. J. Prod. Econ. 2016, 171, 116–133. [Google Scholar] [CrossRef]
- Hohenstein, N.-O.; Feisel, E.; Hartmann, E.; Giunipero, L. Research on the phenomenon of supply chain resilience: A systematic review and paths for further investigation. Int. J. Phys. Distrib. Logist. Manag. 2015, 45, 90–117. [Google Scholar] [CrossRef]
- Hosseini, S.; Morshedlou, N.; Ivanov, D.; Sarder, M.; Barker, K.; Al Khaled, A. Resilient supplier selection and optimal order allocation under disruption risks. Int. J. Prod. Econ. 2019, 213, 124–137. [Google Scholar] [CrossRef]
- Parkouhi, S.V.; Ghadikolaei, A.S. A resilience approach for supplier selection: Using Fuzzy Analytic Network Process and grey VIKOR techniques. J. Clean. Prod. 2017, 161, 431–451. [Google Scholar] [CrossRef]
- Christopher, M.; Lee, H. Mitigating supply chain risk through improved confidence. Int. J. Phys. Distrib. Logist. Manag. 2004, 34, 388–396. [Google Scholar] [CrossRef]
- Davoudabadi, R.; Mousavi, S.M.; Sharifi, E. An integrated weighting and ranking model based on entropy, DEA and PCA considering two aggregation approaches for resilient supplier selection problem. J. Comput. Sci. 2020, 40, 101074. [Google Scholar] [CrossRef]
- Mohammed, A. Towards ‘gresilient’ supply chain management: A quantitative study. Resour. Conserv. Recycl. 2020, 155, 104641. [Google Scholar] [CrossRef]
- Rajesh, R.; Ravi, V. Supplier selection in resilient supply chains: A grey relational analysis approach. J. Clean. Prod. 2015, 86, 343–359. [Google Scholar] [CrossRef]
- Kaur, H.; Singh, S.P.; Garza-Reyes, J.A.; Mishra, N. Sustainable stochastic production and procurement problem for resilient supply chain. Comput. Ind. Eng. 2020, 139, 105560. [Google Scholar] [CrossRef]
- Mohammed, A.; Wang, Q. The fuzzy multi-objective distribution planner for a green meat supply chain. Int. J. Prod. Econ. 2017, 184, 47–58. [Google Scholar] [CrossRef]
- Parkouhi, S.V.; Ghadikolaei, A.S.; Lajimi, H.F. Resilient supplier selection and segmentation in grey environment. J. Clean. Prod. 2019, 207, 1123–1137. [Google Scholar] [CrossRef]
- Kavilal, E.G.; Venkatesan, S.P.; Kumar, K.H. An integrated fuzzy approach for prioritizing supply chain complexity drivers of an Indian mining equipment manufacturer. Resour. Policy 2017, 51, 204–218. [Google Scholar] [CrossRef]
- Cavalcante, I.M.; Frazzon, E.M.; Forcellini, F.A.; Ivanov, D. A supervised machine learning approach to data-driven simulation of resilient supplier selection in digital manufacturing. Int. J. Inf. Manag. 2019, 49, 86–97. [Google Scholar] [CrossRef]
- Hosseini, S.; Al Khaled, A. A hybrid ensemble and AHP approach for resilient supplier selection. J. Intell. Manuf. 2019, 30, 207–228. [Google Scholar] [CrossRef]
- Hasan, M.; Jiang, D.; Ullah, A.S.; Noor-E-Alam, M. Resilient supplier selection in logistics 4.0 with heterogeneous information. Expert Syst. Appl. 2020, 139, 112799. [Google Scholar] [CrossRef]
- Haldar, A.; Ray, A.; Banerjee, D.; Ghosh, S. A hybrid MCDM model for resilient supplier selection. Int. J. Manag. Sci. Eng. Manag. 2012, 7, 284–292. [Google Scholar] [CrossRef]
- Berle, Ø.; Norstad, I.; Asbjørnslett, B.E. Optimization, risk assessment and resilience in LNG transportation systems. Supply Chain Manag. Int. J. 2013, 18, 253–264. [Google Scholar] [CrossRef]
- Mohammed, A.; Harris, I.; Soroka, A.; Naim, M.M.; Ramjaun, T. Evaluating Green and Resilient Supplier Performance: AHP-Fuzzy Topsis Decision-Making Approach. In Proceedings of the ICORES, Funchal, Portugal, 24–26 January 2018; pp. 209–216. [Google Scholar]
- Rajesh, R.; Ravi, V. Modeling enablers of supply chain risk mitigation in electronic supply chains: A Grey–DEMATEL approach. Comput. Ind. Eng. 2015, 87, 126–139. [Google Scholar] [CrossRef]
- Thekdi, S.A.; Santos, J.R. Supply Chain Vulnerability Analysis Using Scenario-Based Input-Output Modeling: Application to Port Operations. Risk Anal. 2015, 36, 1025–1039. [Google Scholar] [CrossRef] [PubMed]
- Pramanik, D.; Haldar, A.; Mondal, S.C.; Naskar, S.K.; Ray, A. Resilient supplier selection using AHP-TOPSIS-QFD under a fuzzy environment. Int. J. Manag. Sci. Eng. Manag. 2017, 12, 45–54. [Google Scholar] [CrossRef]
- Pramanik, D.; Mondal, S.C.; Haldar, A. Resilient supplier selection to mitigate uncertainty: Soft-computing approach. J. Model. Manag. 2020, 15, 1339–1361. [Google Scholar] [CrossRef]
- Zimmer, K.; Fröhling, M.; Schultmann, F. Sustainable supplier management–a review of models supporting sustainable supplier selection, monitoring and development. Int. J. Prod. Res. 2016, 54, 1412–1442. [Google Scholar] [CrossRef]
- Carvalho, H.; Azevedo, S.G.; Cruz-Machado, V. Agile and resilient approaches to supply chain management: Influence on performance and competitiveness. Logist. Res. 2012, 4, 49–62. [Google Scholar] [CrossRef]
- Purvis, L.; Spall, S.; Naim, M.; Spiegler, V. Developing a resilient supply chain strategy during ‘boom’ and ‘bust’. Prod. Plan. Control 2016, 27, 579–590. [Google Scholar] [CrossRef]
- Yazdani, M.; Wen, Z.; Liao, H.; Banaitis, A.; Turskis, Z. A grey combined compromise solution (COCOSO-G) method for supplier selection in construction management. J. Civ. Eng. Manag. 2019, 25, 858–874. [Google Scholar] [CrossRef]
- Saffarzadeh, S.; Hadi-Vencheh, A.; Jamshidi, A. An Interval Based Score Method for Multiple Criteria Decision Making Problems. Int. J. Inf. Technol. Decis. Mak. 2019, 18, 1667–1687. [Google Scholar] [CrossRef]
- Vavrek, R. Evaluation of the Impact of Selected Weighting Methods on the Results of the TOPSIS Technique. Int. J. Inf. Technol. Decis. Mak. 2019, 18, 1821–1843. [Google Scholar] [CrossRef]
- Dweiri, F.; Kumar, S.; Khan, S.A.; Jain, V. Designing an integrated AHP based decision support system for supplier selection in automotive industry. Expert Syst. Appl. 2016, 62, 273–283. [Google Scholar] [CrossRef]
- López, C.; Ishizaka, A. A hybrid FCM-AHP approach to predict impacts of offshore outsourcing location decisions on supply chain resilience. J. Bus. Res. 2019, 103, 495–507. [Google Scholar] [CrossRef]
- Rajesh, R. A grey-layered ANP based decision support model for analysing strategies of resilience in electronic supply chains. Eng. Appl. Artif. Intell. 2020, 87, 103338. [Google Scholar] [CrossRef]
- Wang, T.-K.; Zhang, Q.; Chong, H.-Y.; Wang, X. Integrated Supplier Selection Framework in a Resilient Construction Supply Chain: An Approach via Analytic Hierarchy Process (AHP) and Grey Relational Analysis (GRA). Sustainability 2017, 9, 289. [Google Scholar] [CrossRef]
- Foroozesh, N.; Tavakkoli-Moghaddam, R.; Mousavi, S.M.; Vahdani, B. A new comprehensive possibilistic group decision approach for resilient supplier selection with mean–variance–skewness–kurtosis and asymmetric information under interval-valued fuzzy uncertainty. Neural Comput. Appl. 2019, 31, 6959–6979. [Google Scholar] [CrossRef]
- Mari, S.I.; Memon, M.S.; Ramzan, M.B.; Qureshi, S.M.; Iqbal, M.W. Interactive Fuzzy Multi Criteria Decision Making Approach for Supplier Selection and Order Allocation in a Resilient Supply Chain. Mathematics 2019, 7, 137. [Google Scholar] [CrossRef]
- Chen, K.-S.; Wang, C.-H.; Tan, K.-H. Developing a fuzzy green supplier selection model using six sigma quality indices. Int. J. Prod. Econ. 2019, 212, 1–7. [Google Scholar] [CrossRef]
- Gao, H.; Ju, Y.; Gonzalez, E.D.S.; Zhang, W. Green supplier selection in electronics manufacturing: An approach based on consensus decision making. J. Clean. Prod. 2020. [Google Scholar] [CrossRef]
- Mohammed, A.; Harris, I.; Govindan, K. A hybrid MCDM-FMOO approach for sustainable supplier selection and order allocation. Int. J. Prod. Econ. 2019. [Google Scholar] [CrossRef]
- Mavi, R.K.; Goh, M.; Zarbakhshnia, N. Sustainable third-party reverse logistic provider selection with fuzzy SWARA and fuzzy MOORA in plastic industry. Int. J. Adv. Manuf. Technol. 2017, 91, 2401–2418. [Google Scholar] [CrossRef]
- Junior, F.R.L.; Osiro, L.; Carpinetti, L.C.R. A comparison between Fuzzy AHP and Fuzzy TOPSIS methods to supplier selection. Appl. Soft Comput. 2014, 21, 194–209. [Google Scholar] [CrossRef]
- Luthra, S.; Govindan, K.; Kannan, D.; Mangla, S.K.; Garg, C.P. An integrated framework for sustainable supplier selection and evaluation in supply chains. J. Clean. Prod. 2017, 140, 1686–1698. [Google Scholar] [CrossRef]
- Yazdani, M.; Chatterjee, P.; Zavadskas, E.K.; Zolfani, S.H. Integrated QFD-MCDM framework for green supplier selection. J. Clean. Prod. 2017, 142, 3728–3740. [Google Scholar] [CrossRef]
- Qin, J.; Liu, X.; Pedrycz, W. An extended TODIM multi-criteria group decision making method for green supplier selection in interval type-2 fuzzy environment. Eur. J. Oper. Res. 2017, 258, 626–638. [Google Scholar] [CrossRef]
- Behzadian, M.; Otaghsara, S.K.; Yazdani, M.; Ignatius, J. A state-of the-art survey of TOPSIS applications. Expert Syst. Appl. 2012, 39, 13051–13069. [Google Scholar] [CrossRef]
- Wei, G.; Wei, C.; Wu, J.; Wang, H. Supplier Selection of Medical Consumption Products with a Probabilistic Linguistic MABAC Method. Int. J. Environ. Res. Public Health 2019, 16, 5082. [Google Scholar] [CrossRef]
- Pamučar, D.; Ćirović, G. The selection of transport and handling resources in logistics centers using Multi-Attributive Border Approximation area Comparison (MABAC). Expert Syst. Appl. 2015, 42, 3016–3028. [Google Scholar] [CrossRef]
- Ulutaş, A. Supplier Selection by Using a Fuzzy Integrated Model for a Textile Company. Eng. Econ. 2019, 30, 579–590. [Google Scholar] [CrossRef]
- Keçeci, B.; Iç, Y.T.; Eraslan, E. Development of a Spreadsheet DSS for Multi-Response Taguchi Parameter Optimization Problems Using the TOPSIS, VIKOR, and GRA Methods. Int. J. Inf. Technol. Decis. Mak. 2019, 18, 1501–1531. [Google Scholar] [CrossRef]
- Mardani, A.; Zavadskas, E.K.; Govindan, K.; Senin, A.A.; Jusoh, A. VIKOR Technique: A Systematic Review of the State of the Art Literature on Methodologies and Applications. Sustainability 2016, 8, 37. [Google Scholar] [CrossRef]
- Parkan, C.; Wu, M.-L. Measurement of the performance of an investment bank using the operational competitiveness rating procedure. Omega 1999, 27, 201–217. [Google Scholar] [CrossRef]
- Tzeng, G.; Chiang, C.; Li, C. Evaluating intertwined effects in e-learning programs: A novel hybrid MCDM model based on factor analysis and DEMATEL. Expert Syst. Appl. 2007, 32, 1028–1044. [Google Scholar] [CrossRef]
- Mohammed, A.; Harris, I.; Dukyil, A. A trasilient decision making tool for vendor selection: A hybrid-MCDM algorithm. Manag. Decis. 2019, 57, 372–395. [Google Scholar] [CrossRef]
- Parkan, C. Operational competitiveness ratings of production units. Manag. Decis. Econ. 1994, 15, 201–221. [Google Scholar] [CrossRef]
- Kundakcı, N. An Integrated Multi-Criteria Decision Making Approach for Tablet Computer Selection. Eur. J. Multidiscip. Stud. 2017, 2, 36–48. [Google Scholar] [CrossRef][Green Version]
- Hwang, C.L.; Yoon, K. Multiple Attribute Decision Making. In Lecture Notes in Economics and Mathematical Systems 186; Springer: Berlin, Germany, 1981. [Google Scholar]
- Zavadskas, E.K.; Kaklauskas, A.; Kalibatas, D.; Turskis, Z.; Krutinis, M.; Bartkienė, L. Applying the TOPSIS-F method to assess air pollution in vilnius. Environ. Eng. Manag. J. 2018, 17. [Google Scholar] [CrossRef]
- Zavadskas, E.K.; Mardani, A.; Turskis, Z.; Jusoh, A.; Nor, K.M. Development of TOPSIS method to solve complicated decision-making problems—An overview on developments from 2000 to 2015. Int. J. Inf. Technol. Decis. Mak. 2016, 15, 645–682. [Google Scholar] [CrossRef]
- Opricovic, S. Multicriteria Optimization of Civil Engineering Systems; Faculty of Civil Engineering: Belgrade, Serbia, 1998. [Google Scholar]
- Opricovic, S.; Tzeng, G.-H. Compromise solution by MCDM methods: A comparative analysis of VIKOR and TOPSIS. Eur. J. Oper. Res. 2004, 156, 445–455. [Google Scholar] [CrossRef]
- Gibbons, J.D. Nonparametric Statistical Inference; McGraw-Hill: New York, NY, USA, 1971. [Google Scholar]
- Spearman, C. The proof and measurement of association between two things. Am. J. Psychol. 1904, 15, 72–101. [Google Scholar] [CrossRef]
- Chamodrakas, I.; Leftheriotis, I.; Martakos, D. In-depth analysis and simulation. Appl. Soft Comput. 2011, 11, 900–907. [Google Scholar] [CrossRef]
- Kannan, D.; Khodaverdi, R.; Olfat, L.; Jafarian, A.; Diabat, A. Integrated fuzzy multi criteria decision making method and multi-objective programming approach for supplier selection and order allocation in a green supply chain. J. Clean. Prod. 2013, 47, 355–367. [Google Scholar] [CrossRef]
- Raju, K.S.; Kumar, D.N. Multicriteria decision making in irrigation planning. Agric. Syst. 1999, 62, 117–129. [Google Scholar] [CrossRef]
- Mohammed, A.; Harris, I.; Soroka, A.; Naim, M.; Ramjaun, T.; Yazdani, M. Gresilient supplier assessment and order allocation planning. Ann. Oper. Res. 2021, 296, 335–362. [Google Scholar] [CrossRef]
- Pamucar, D.; Yazdani, M.; Montero-Simo, M.J.; Araque-Padilla, R.A.; Mohammed, A. Multi-criteria decision analysis towards robust service quality measurement. Expert Syst. Appl. 2021, 170, 114–508. [Google Scholar] [CrossRef]
- Wu, Z.; Mohammed, A.; Irina, H. Food waste management in the catering industry: Enablers and interrelationship. Ind. Mark. Manag. 2021, 94, 1–18. [Google Scholar] [CrossRef]


| Author(s) | Definition |
|---|---|
| Holling [8] | “The measure of the persistence of systems and of the ability to absorb change and disturbance and still maintain the same relationships between state variables” |
| Gunderson [9] | “The magnitude of disturbance that a system can absorb before its structure is redefined by changing the variables and processes that control behavior” |
| Carpenter et al. [10] | “Resilience is the ability of an organization to return to “normal” operations” |
| Hamel and Valikangas [11] | “Organizational Resilience refers to the capacity for continuous reconstruction Physical systems” |
| Kendra and Wachtendorf [12] | “A fundamental quality of individuals, groups, organizations, and systems as a whole to respond productively to significant change that disrupts the expected pattern of events without engaging in an extended period of regressive behaviour” |
| Boss [13] and Aburn et al. [14] | “Resilience is a term that is increasingly being used to describe and explain the complexities of individual and group responses to traumatic and challenging situations” |
| Sheffi [15] | “Resilience is the company’s ability to, and speed at which they can, return to their normal performance level (e.g., inventory, capacity, service rate) following a disruptive event” |
| Jackson et al. [16] | “Resilience is the ability to positively adjust to adversity” |
| Pettit et al. [17] and Zhang et al. [18] | Supply chain resiliency is the capability to absorb instabilities and protect basic functionality against disruptions |
| Jüttner and Maklan [19] | “The apparent ability of some supply chain to recover from inevitable risk events more effectively than others, based on the underlying assumption that not all risk events can be prevented” |
| Yao and Meurier [20] | “The ability of an individual or organisation to expeditiously design and implement positive adaptive behaviours matched to the immediate situation, while enduring minimal stress” |
| Southwick et al. [21] | “Resilience is the ability to bend but not break, bounce back, and perhaps even grow in the face of adverse experiences” |
| Wang et al. [22] | “A resilient system is a system with an objective to survive and maintain function even during the course of disruptions, provided with a capability to predict and assess the damage of possible disruptions, and enhanced by the strong awareness of its ever-changing environment and knowledge of the past events, thereby utilizing resilient strategies for defence against the disruptions” |
| Fiksel [23], Fiksel et al. [24] | “Resilience is the capacity for an enterprise or set of business entities to survive, adapt and grow in the face of turbulent change” |
| Elleuch et al. [25] | “Resilience is the ability of a system to return to its original state or a more favourable condition, after being disturbed” |
| Um and Han [26] | “Resilience is the ability to survive, adapt and grow in the face of turbulent change in sourcing, manufacturing and delivery of product and service” |
| Reference | The Method(s) | Example/Application |
|---|---|---|
| Haldar et al. [52] | AHP-QFD, TOPSIS | Empirical example |
| Berle et al. [53] | Monte Carlo simulation | LNG transportation systems |
| Mohammed et al. [54] | Fuzzy AHP, Fuzzy TOPSIS | Numerical example |
| Rajesh and Ravi [44] | Grey relational analysis | Electronic supply chain |
| Rajesh and Ravi [55] | Grey–DEMATEL | Electronic supply chain |
| Thekdi and Santos [56] | Input-Output modelling | Port operations |
| Pramanik et al. [57] | AHP-QFD-TOPSIS with fuzzy | A computer manufacturing company |
| Mohammed et al. [46] | AHP and Fuzzy TOPSIS | A company in the UK producing thermal desorption |
| Kavilal et al. [48] | Fuzzy AHP, PROMETHEE | A mining equipment manufacturer in India |
| Parkouhi et al. [47] | Grey DEMATEL, G-SAW | Wood and paper industry |
| Cavalcante et al. [49] | Big data, simulation, machine learning | Numerical example |
| Hoseini et al. [39] | AHP | plastic raw material suppliers for a U.S. based manufacturer |
| Hosseini and Al Khaled [50] | Predictive analytics, binomial logistics regression, classification and regression trees, and neural network | Numerical example |
| Hasan et al. [51] | Multi-Choice Goal Programming and TOPSIS | An illustration case |
| Pramanik et al. [58] | Fuzzy analytic hierarchy process and fuzzy additive ratio assessment | Automotive manufacturing organization |
| Davoudabadi et al. [42] | DEA and PCA | A practical case study |
| Linguistic Variable | Scale |
|---|---|
| No influence (NI) | 0 |
| Low influence (LI) | 1 |
| Medium influence (MI) | 2 |
| High influence (HI) | 3 |
| Very high influence (VHI) | 4 |
| Linguistic Variable | Scale |
|---|---|
| Very low (VL) | 1 |
| Low (L) | 3 |
| Medium (M) | 5 |
| High (H) | 7 |
| Very high (VH) | 9 |
| TBC/RP | Definition | |
|---|---|---|
| TBC | Purchasing cost (TBC1) | Compare purchase cost per unit among alternatives |
| Scrap quality (TBC2) | Contents of iron (as the main component) and non-ferrous admixtures | |
| Delivery Reliability (TBC3) | The ability to conform with a promised scheduled delivery plan consistently | |
| Trust (TBC4) | The gauge of positive historical collaborations | |
| Turnover (TBC5) | Vendors’ capability to satisfy company’s needs | |
| Lead Time (TBC6) | The duration of time from putting an order in to the receipt of the order | |
| Operating capacity (TBC7) | The asset within which a company hopes to operate—commonly during a short-term period | |
| Geographical location (TBC8) | The distance from a vendor’s location to Company S’ location | |
| RP | Flexibility (RP1) | Vendors’ ability to react smoothly to turbulences in the supply chain with respect to similar costs and lead times. |
| Redundancy (RP2) | Vendors’ ability to absorb disruptions to materials within the supply chain via redundant suppliers | |
| Agility (RP3) | Vendors’ ability to respond quickly and efficiently to reasonably small business opportunities in collaboration with a collaborator able to cope with unanticipated/unpredictable demand | |
| Redundant supplier (RP4) | Vendors’ ability and willingness to collaborate with a new supplier to absorbs disruptions to materials within the supply chain | |
| Risk oversight (RP5) | Vendors’ ability to stay tuned to potential disruptions outside its company | |
| Cooperation (RP6) | Vendors’ willingness to keep cooperation with their clients to develop proactive and reactive plans towards resilience business | |
| Visibility (RP7) | Vendors’ willingness to share relevant information with their clients; this helps both parties to see the light at the end of the resilience tunnel | |
| Pillars | RP1 | RP2 | RP3 | RP4 | RP5 | RP6 | RP7 |
|---|---|---|---|---|---|---|---|
| RP1 | 0 | 2 | 4 | 3 | 0 | 4 | 4 |
| RP2 | 4 | 0 | 1 | 0 | 0 | 0 | 0 |
| RP3 | 4 | 4 | 0 | 0 | 0 | 0 | 0 |
| RP4 | 4 | 3 | 3 | 0 | 3 | 4 | 1 |
| RP5 | 4 | 4 | 2 | 4 | 0 | 0 | 4 |
| RP6 | 2 | 0 | 0 | 0 | 4 | 0 | 4 |
| RP7 | 2 | 4 | 3 | 0 | 1 | 4 | 0 |
| Pillars | RP1 | RP2 | RP3 | RP4 | RP5 | RP6 | RP7 | |
|---|---|---|---|---|---|---|---|---|
| RP1 | 0 | 0.1 | 0.2 | 0.15 | 0 | 0.2 | 0.2 | |
| RP2 | 0.2 | 0 | 0.05 | 0 | 0 | 0 | 0 | |
| RP3 | 0.2 | 0.2 | 0 | 0 | 0 | 0 | 0 | |
| RP4 | 0.2 | 0.15 | 0.15 | 0 | 0.15 | 0.2 | 0.05 | |
| RP5 | 0.2 | 0.2 | 0.1 | 0.2 | 0 | 0 | 0.2 | |
| RP6 | 0.1 | 0 | 0 | 0 | 0.2 | 0 | 0.2 | |
| RP7 | 0.1 | 0.2 | 0.15 | 0 | 0.05 | 0.2 | 0 |
| Pillars | RP1 | RP2 | RP3 | RP4 | RP5 | RP6 | RP7 |
|---|---|---|---|---|---|---|---|
| RP1 | 0285* | 0.335* | 0.374* | 0.218 | 0.126 | 0.374* | 0.368* |
| RP2 | 0.273* | 0.081 | 0.130 | 0.046 | 0.027 | 0.079 | 0.078 |
| RP3 | 0.311* | 0.283* | 0.101 | 0.053 | 0.031 | 0.091 | 0.089 |
| RP4 | 0.494* | 0.398* | 0.356* | 0.126 | 0.259* | 0.381* | 0.283* |
| RP5 | 0.504* | 0.462* | 0.338* | 0.298* | 0.111 | 0.238 | 0.386* |
| RP6 | 0.292* | 0.197 | 0.160 | 0.096 | 0.261* | 0.147 | 0.345* |
| RP7 | 0.313* | 0.355* | 0.277* | 0.073 | 0.130 | 0.308* | 0.154 |
| Pillars | D | R | D+R | D-R | Weights | Group |
|---|---|---|---|---|---|---|
| RP1 | 2.079 | 2.472 | 4.551 | −0.393 | 0.197999 | effect |
| RP2 | 0.714 | 2.110 | 2.824 | −1.397 | 0.122863 | effect |
| RP3 | 0.959 | 1.736 | 2.695 | −0.778 | 0.11725 | effect |
| RP4 | 2.297 | 0.910 | 3.207 | 1.387 | 0.139526 | cause |
| RP5 | 2.336 | 0.945 | 3.281 | 1.391 | 0.142745 | cause |
| RP6 | 1.497 | 1.617 | 3.114 | −0.120 | 0.13548 | effect |
| RP7 | 1.611 | 1.702 | 3.313 | −0.092 | 0.144137 | effect |
| Criteria | TBC1 | TBC2 | TBC3 | TBC4 | TBC5 | TBC6 | TBC7 | TBC8 |
|---|---|---|---|---|---|---|---|---|
| TBC1 | 0 | 4 | 2 | 1 | 1 | 2 | 0 | 0 |
| TBC2 | 4 | 0 | 3 | 4 | 2 | 2 | 0 | 0 |
| TBC3 | 0 | 1 | 0 | 4 | 0 | 4 | 0 | 1 |
| TBC4 | 4 | 1 | 1 | 0 | 0 | 4 | 0 | 0 |
| TBC5 | 2 | 2 | 0 | 2 | 0 | 0 | 4 | 0 |
| TBC6 | 0 | 0 | 1 | 4 | 0 | 0 | 1 | 0 |
| TBC7 | 4 | 0 | 0 | 4 | 2 | 0 | 0 | 0 |
| TBC8 | 3 | 0 | 3 | 0 | 0 | 3 | 0 | 0 |
| Criteria | TBC1 | TBC2 | TBC3 | TBC4 | TBC5 | TBC6 | TBC7 | TBC8 |
|---|---|---|---|---|---|---|---|---|
| TBC1 | 0 | 0.211 | 0.105 | 0.053 | 0.053 | 0.105 | 0 | 0 |
| TBC2 | 0.211 | 0 | 0.158 | 0.211 | 0.105 | 0.105 | 0 | 0 |
| TBC3 | 0 | 0.053 | 0 | 0.211 | 0 | 0.211 | 0 | 0.053 |
| TBC4 | 0.211 | 0.053 | 0.053 | 0 | 0 | 0.211 | 0 | 0 |
| TBC5 | 0.105 | 0.105 | 0 | 0.105 | 0 | 0 | 0.211 | 0 |
| TBC6 | 0 | 0 | 0.053 | 0.211 | 0 | 0 | 0.053 | 0 |
| TBC7 | 0.211 | 0 | 0 | 0.211 | 0.105 | 0 | 0 | 10 |
| TBC8 | 0.158 | 0 | 0.158 | 0 | 0 | 0.158 | 0 | 0 |
| Criteria | TBC1 | TBC2 | TBC3 | TBC4 | TBC5 | TBC6 | TBC7 | TBC8 |
|---|---|---|---|---|---|---|---|---|
| TBC1 | 0.120 | 0.267 | 0.185 | 0.219 | 0.090 | 0.233 | 0.031 | 0.010 |
| TBC2 | 0.345 | 0.121 | 0.252 | 0.393 | 0.141 | 0.292 | 0.045 | 0.013 |
| TBC3 | 0.104 | 0.097 | 0.069 | 0.326 | 0.018 | 0.324 | 0.021 | 0.056 |
| TBC4 | 0.276 | 0.128 | 0.127 | 0.142 | 0.030 | 0.311 | 0.023 | 0.007 |
| TBC5 | 0.251 | 0.181 | 0.075 | 0.250 | 0.056 | 0.115 | 0.228 | 0.004 |
| TBC6 | 0.081 | 0.037 | 0.087 | 0.274 | 0.015 | 0.089 | 0.060 | 0.005 |
| TBC7 | 0.320 | 0.102 | 0.074 | 0.313 | 0.137 | 0.126 | 0.035 | 0.004 |
| TBC8 | 0.206 | 0.063 | 0.212 | 0.129 | 0.019 | 0.260 | 0.018 | 0.011 |
| Criteria | Di | Ri | Di+Ri | Di-Ri | Group | Weights |
|---|---|---|---|---|---|---|
| TBC1 | 1.1547 | 1.7032 | 2.8580 | −0.5485 | effect | 0.165 |
| TBC2 | 1.6028 | 0.9975 | 2.6003 | 0.6053 | cause | 0.150 |
| TBC3 | 1.0150 | 1.0801 | 2.0951 | −0.0651 | effect | 0.121 |
| TBC4 | 1.0435 | 2.0458 | 3.0893 | −1.0023 | cause | 0.178 |
| TBC5 | 1.1604 | 0.5064 | 1.6668 | 0.6540 | effect | 0.096 |
| TBC6 | 0.6474 | 1.7491 | 2.3965 | −1.1018 | cause | 0.138 |
| TBC7 | 1.1112 | 0.4618 | 1.5731 | 0.6494 | effect | 0.091 |
| TBC8 | 0.9185 | 0.1095 | 1.0280 | 0.8090 | effect | 0.059 |
| Aspect | Criteria/Pillars | Weight | Ranking |
|---|---|---|---|
| TBC | TBC1 | 0.1651 | 2 |
| TBC2 | 0.1502 | 3 | |
| TBC3 | 0.1211 | 5 | |
| TBC4 | 0.1785 | 1 | |
| TBC5 | 0.0963 | 6 | |
| TBC6 | 0.1385 | 4 | |
| TBC7 | 0.0909 | 7 | |
| TBC8 | 0.0594 | 8 | |
| RP | RP1 | 0.1980 | 1 |
| RP2 | 0.1230 | 6 | |
| RP3 | 0.1170 | 7 | |
| RP4 | 0.1400 | 4 | |
| RP5 | 0.1430 | 3 | |
| RP6 | 0.1350 | 5 | |
| RP7 | 0.1440 | 2 |
| Normalized DM | |||||||||||||||
|---|---|---|---|---|---|---|---|---|---|---|---|---|---|---|---|
| TBC1 | TBC2 | TBC3 | TBC4 | TBC5 | TBC6 | TBC7 | TBC8 | RP1 | RP2 | RP3 | RP4 | RP5 | RP6 | RP7 | |
| S1 | 1 | 1 | 0.50 | 0.83 | 0 | 0.25 | 0.50 | 0.50 | 1 | 0.33 | 1 | 1 | 1 | 0.83 | 1 |
| S2 | 0.73 | 1 | 0 | 0 | 0 | 0 | 0 | 1 | 0.50 | 0 | 0 | 0 | 0.50 | 0.33 | 0 |
| S3 | 0.73 | 0 | 0 | 0.50 | 1 | 0.50 | 0 | 0 | 0 | 0.33 | 0.33 | 0 | 0 | 0 | 0.33 |
| S4 | 0.36 | 1 | 0.50 | 1 | 0 | 1 | 0 | 0.50 | 1 | 1 | 1 | 0.50 | 0.50 | 1 | 0.67 |
| S5 | 0.73 | 0 | 0 | 0.33 | 0 | 0.50 | 1 | 1 | 0 | 0.33 | 0.33 | 0 | 0.50 | 0.67 | 0.67 |
| S6 | 0 | 1 | 1 | 1 | 0 | 0.50 | 0.50 | 0.75 | 1 | 0.67 | 0.67 | 0.25 | 0.50 | 0.83 | 0.83 |
| Weight normalized DM | |||||||||||||||
| TBC1 | TBC2 | TBC3 | TBC4 | TBC5 | TBC6 | TBC7 | TBC8 | RP1 | RP2 | RP3 | RP4 | RP5 | RP6 | RP7 | |
| S1 | 0.33 | 0.30 | 0.18 | 0.33 | 0.10 | 0.17 | 0.14 | 0.09 | 0.40 | 0.16 | 0.23 | 0.28 | 0.29 | 0.25 | 0.29 |
| S2 | 0.29 | 0.30 | 0.12 | 0.18 | 0.10 | 0.14 | 0.09 | 0.12 | 0.30 | 0.12 | 0.12 | 0.14 | 0.21 | 0.18 | 0.14 |
| S3 | 0.29 | 0.15 | 0.12 | 0.27 | 0.19 | 0.21 | 0.09 | 0.06 | 0.20 | 0.16 | 0.16 | 0.14 | 0.14 | 0.14 | 0.19 |
| S4 | 0.23 | 0.30 | 0.18 | 0.36 | 0.10 | 0.28 | 0.09 | 0.09 | 0.40 | 0.25 | 0.23 | 0.21 | 0.21 | 0.27 | 0.24 |
| S5 | 0.29 | 0.15 | 0.12 | 0.24 | 0.10 | 0.21 | 0.18 | 0.12 | 0.20 | 0.16 | 0.16 | 0.14 | 0.21 | 0.23 | 0.24 |
| S6 | 0.17 | 0.30 | 0.24 | 0.36 | 0.10 | 0.21 | 0.14 | 0.10 | 0.40 | 0.20 | 0.20 | 0.17 | 0.21 | 0.25 | 0.26 |
| G | 0.26 | 0.24 | 0.16 | 0.28 | 0.11 | 0.20 | 0.12 | 0.09 | 0.30 | 0.17 | 0.18 | 0.17 | 0.21 | 0.21 | 0.22 |
| Distance from Q | |||||||||||||||
| TBC1 | TBC2 | TBC3 | TBC4 | TBC5 | TBC6 | TBC7 | TBC8 | RP1 | RP2 | RP3 | RP4 | RP5 | RP6 | RP7 | |
| S1 | 0.07 | 0.06 | 0.03 | 0.05 | −0.01 | −0.02 | 0.02 | 0 | 0.10 | −0.01 | 0.06 | 0.11 | 0.08 | 0.04 | 0.07 |
| S2 | 0.03 | 0.06 | −0.03 | −0.10 | −0.01 | −0.06 | −0.03 | 0.02 | 0 | −0.05 | −0.06 | −0.03 | 0 | −0.03 | −0.08 |
| S3 | 0.03 | −0.09 | −0.03 | −0.01 | 0.08 | 0.01 | −0.03 | −0.03 | −0.10 | −0.01 | −0.02 | −0.03 | −0.07 | −0.08 | −0.03 |
| S4 | −0.03 | 0.06 | 0.03 | 0.08 | −0.01 | 0.08 | −0.03 | 0 | 0.10 | 0.07 | 0.06 | 0.04 | 0 | 0.06 | 0.02 |
| S5 | 0.03 | −0.09 | −0.03 | −0.04 | −0.01 | 0.01 | 0.06 | 0.02 | −0.10 | −0.01 | −0.02 | −0.03 | 0 | 0.01 | 0.02 |
| S6 | −0.09 | 0.06 | 0.09 | 0.08 | −0.01 | 0.01 | 0.02 | 0.01 | 0.10 | 0.03 | 0.02 | 0 | 0 | 0.04 | 0.04 |
| G | 0.07 | 0.06 | 0.03 | 0.05 | −0.01 | −0.02 | 0.02 | 0 | 0.10 | −0.01 | 0.06 | 0.11 | 0.08 | 0.04 | 0.07 |
| Supplier | Q |
|---|---|
| S1 | 0.6144 |
| S2 | −0.3702 |
| S3 | −0.4125 |
| S4 | 0.5128 |
| S5 | −0.1785 |
| S6 | 0.3909 |
| Preference Ratings with respect to non-Beneficial Criteria | |||||||||||||||
|---|---|---|---|---|---|---|---|---|---|---|---|---|---|---|---|
| TBC1 | TBC2 | TBC3 | TBC4 | TBC5 | TBC6 | TBC7 | TBC8 | RP1 | RP2 | RP3 | RP4 | RP5 | RP6 | RP7 | |
| S1 | 0.26 | 0 | 0 | 0 | 0 | 0 | 0 | 0 | 0 | 0 | 0 | 0 | 0 | 0 | 0 |
| S2 | 0.19 | 0 | 0 | 0 | 0 | 0 | 0 | 0 | 0 | 0 | 0 | 0 | 0 | 0 | 0 |
| S3 | 0.19 | 0 | 0 | 0 | 0 | 0 | 0 | 0 | 0 | 0 | 0 | 0 | 0 | 0 | 0 |
| S4 | 0.09 | 0 | 0 | 0 | 0 | 0 | 0 | 0 | 0 | 0 | 0 | 0 | 0 | 0 | 0 |
| S5 | 0.19 | 0 | 0 | 0 | 0 | 0 | 0 | 0 | 0 | 0 | 0 | 0 | 0 | 0 | 0 |
| S6 | 0 | 0 | 0 | 0 | 0 | 0 | 0 | 0 | 0 | 0 | 0 | 0 | 0 | 0 | 0 |
| Preference Ratings with respect to Beneficial Criteria | |||||||||||||||
| TBC1 | TBC2 | TBC3 | TBC4 | TBC5 | TBC6 | TBC7 | TBC8 | RP1 | RP2 | RP3 | RP4 | RP5 | RP6 | RP7 | |
| S1 | 0 | 0.06 | 0.05 | 0.30 | 0 | 0.03 | 0.04 | 0.04 | 0.26 | 0.08 | 0.09 | 1.12 | 0.57 | 0.23 | 0.29 |
| S2 | 0 | 0.06 | 0 | 0 | 0 | 0 | 0 | 0.08 | 0.13 | 0 | 0 | 0 | 0.29 | 0.09 | 0 |
| S3 | 0 | 0 | 0 | 0.18 | 0.02 | 0.06 | 0 | 0 | 0 | 0.08 | 0.03 | 0 | 0 | 0 | 0.10 |
| S4 | 0 | 0.06 | 0.05 | 0.36 | 0 | 0.11 | 0 | 0.04 | 0.26 | 0.25 | 0.09 | 0.56 | 0.29 | 0.27 | 0.19 |
| S5 | 0 | 0 | 0 | 0.12 | 0 | 0.06 | 0.07 | 0.08 | 0 | 0.08 | 0.03 | 0 | 0.29 | 0.18 | 0.19 |
| S6 | 0 | 0.06 | 0.10 | 0.36 | 0 | 0.06 | 0.04 | 0.06 | 0.26 | 0.16 | 0.06 | 0.28 | 0.29 | 0.23 | 0.24 |
| Supplier | Overall Preference (P) | |||||
|---|---|---|---|---|---|---|
| S1 | 0.259 | 0.259 | 3.145 | 2.684 | 2.944 | 2.755 |
| S2 | 0.189 | 0.189 | 0.647 | 0.187 | 0.375 | 0.187 |
| S3 | 0.189 | 0.189 | 0.46 | 0 | 0.189 | 0 |
| S4 | 0.094 | 0.094 | 2.52 | 2.06 | 2.154 | 1.965 |
| S5 | 0.189 | 0.189 | 1.096 | 0.635 | 0.824 | 0.635 |
| S6 | 0 | 0 | 2.182 | 1.722 | 1.722 | 1.533 |
| TOPSIS Performance Rating | |||||||||||||||
|---|---|---|---|---|---|---|---|---|---|---|---|---|---|---|---|
| TBC1 | TBC2 | TBC3 | TBC4 | TBC5 | TBC6 | TBC7 | TBC8 | RP1 | RP2 | RP3 | RP4 | RP5 | RP6 | RP7 | |
| S1 | 3.5 | 7 | 7 | 8 | 5 | 6 | 7 | 5 | 7 | 5 | 7 | 9 | 5 | 8 | 9 |
| S2 | 5 | 7 | 5 | 3 | 5 | 5 | 5 | 7 | 5 | 3 | 4 | 1 | 3 | 5 | 3 |
| S3 | 5 | 5 | 5 | 6 | 6 | 7 | 5 | 3 | 3 | 5 | 5 | 1 | 1 | 3 | 5 |
| S4 | 7 | 7 | 7 | 9 | 5 | 9 | 5 | 5 | 7 | 9 | 7 | 5 | 3 | 9 | 7 |
| S5 | 5 | 5 | 5 | 5 | 5 | 7 | 9 | 7 | 3 | 5 | 5 | 1 | 3 | 7 | 7 |
| S6 | 9 | 7 | 9 | 9 | 5 | 7 | 7 | 6 | 7 | 7 | 6 | 3 | 3 | 8 | 8 |
| Normalized DM | |||||||||||||||
| TBC1 | TBC2 | TBC3 | TBC4 | TBC5 | TBC6 | TBC7 | TBC8 | RP1 | RP2 | RP3 | RP4 | RP5 | RP6 | RP7 | |
| S1 | 0.60 | 1.14 | 1.14 | 1.26 | 0.90 | 0.94 | 1.14 | 0.87 | 1.24 | 0.86 | 1.2 | 2.01 | 1.18 | 1.26 | 1.44 |
| S2 | 0.85 | 1.14 | 0.81 | 0.47 | 0.9 | 0.78 | 0.81 | 1.22 | 0.88 | 0.51 | 0.69 | 0.22 | 0.71 | 0.79 | 0.48 |
| S3 | 0.85 | 0.81 | 0.81 | 0.95 | 1.08 | 1.09 | 0.81 | 0.52 | 0.53 | 0.86 | 0.86 | 0.22 | 0.24 | 0.47 | 0.8 |
| S4 | 1.19 | 1.14 | 1.14 | 1.42 | 0.9 | 1.41 | 0.81 | 0.87 | 1.24 | 1.54 | 1.2 | 1.12 | 0.71 | 1.42 | 1.12 |
| S5 | 0.85 | 0.81 | 0.81 | 0.79 | 0.9 | 1.09 | 1.46 | 1.22 | 0.53 | 0.86 | 0.86 | 0.22 | 0.71 | 1.11 | 1.12 |
| S6 | 1.53 | 1.14 | 1.46 | 1.42 | 0.9 | 1.09 | 1.14 | 1.04 | 1.24 | 1.20 | 1.03 | 0.67 | 0.71 | 1.26 | 1.28 |
| Weight normalized DM | |||||||||||||||
| TBC1 | TBC2 | TBC3 | TBC4 | TBC5 | TBC6 | TBC7 | TBC8 | RP1 | RP2 | RP3 | RP4 | RP5 | RP6 | RP7 | |
| S1 | 0.1 | 0.17 | 0.14 | 0.23 | 0.09 | 0.13 | 0.1 | 0.05 | 0.25 | 0.11 | 0.14 | 0.28 | 0.17 | 0.17 | 0.21 |
| S2 | 0.14 | 0.17 | 0.1 | 0.08 | 0.09 | 0.11 | 0.07 | 0.07 | 0.18 | 0.06 | 0.08 | 0.03 | 0.10 | 0.11 | 0.07 |
| S3 | 0.14 | 0.12 | 0.1 | 0.17 | 0.1 | 0.15 | 0.07 | 0.03 | 0.11 | 0.11 | 0.10 | 0.03 | 0.03 | 0.06 | 0.12 |
| S4 | 0.20 | 0.17 | 0.14 | 0.25 | 0.09 | 0.19 | 0.07 | 0.05 | 0.25 | 0.19 | 0.14 | 0.16 | 0.10 | 0.19 | 0.16 |
| S5 | 0.14 | 0.12 | 0.1 | 0.14 | 0.09 | 0.15 | 0.13 | 0.07 | 0.11 | 0.11 | 0.10 | 0.03 | 0.10 | 0.15 | 0.16 |
| S6 | 0.25 | 0.17 | 0.18 | 0.25 | 0.09 | 0.15 | 0.1 | 0.06 | 0.25 | 0.15 | 0.12 | 0.09 | 0.10 | 0.17 | 0.18 |
| Distance to ideal | |||||||||||||||
| TBC1 | TBC2 | TBC3 | TBC4 | TBC5 | TBC6 | TBC7 | TBC8 | RP1 | RP2 | RP3 | RP4 | RP5 | RP6 | RP7 | |
| S1 | 0.15 | 0 | 0.04 | 0.03 | 0.02 | 0.06 | 0.03 | 0.02 | 0 | 0.08 | 0 | 0 | 0 | 0.02 | 0 |
| S2 | 0.11 | 0 | 0.08 | 0.17 | 0.02 | 0.09 | 0.06 | 0 | 0.07 | 0.13 | 0.06 | 0.25 | 0.07 | 0.09 | 0.14 |
| S3 | 0.11 | 0.05 | 0.08 | 0.08 | 0 | 0.04 | 0.06 | 0.04 | 0.14 | 0.08 | 0.04 | 0.25 | 0.13 | 0.13 | 0.09 |
| S4 | 0.06 | 0 | 0.04 | 0 | 0.02 | 0 | 0.06 | 0.02 | 0 | 0 | 0 | 0.12 | 0.07 | 0 | 0.05 |
| S5 | 0.11 | 0.05 | 0.08 | 0.11 | 0.02 | 0.04 | 0 | 0 | 0.14 | 0.08 | 0.04 | 0.25 | 0.07 | 0.04 | 0.05 |
| S6 | 0 | 0 | 0 | 0 | 0.02 | 0.04 | 0.03 | 0.01 | 0 | 0.04 | 0.02 | 0.19 | 0.07 | 0.02 | 0.02 |
| Distance to worst | |||||||||||||||
| TBC1 | TBC2 | TBC3 | TBC4 | TBC5 | TBC6 | TBC7 | TBC8 | RP1 | RP2 | RP3 | RP4 | RP5 | RP6 | RP7 | |
| S1 | 0 | 0.05 | 0.04 | 0.14 | 0 | 0.02 | 0.03 | 0.02 | 0.14 | 0.04 | 0.06 | 0.25 | 0.13 | 0.11 | 0.14 |
| S2 | 0.04 | 0.05 | 0 | 0 | 0 | 0 | 0 | 0.04 | 0.07 | 0 | 0 | 0 | 0.07 | 0.04 | 0 |
| S3 | 0.04 | 0 | 0 | 0.08 | 0.02 | 0.04 | 0 | 0 | 0 | 0.04 | 0.02 | 0 | 0 | 0 | 0.05 |
| S4 | 0.10 | 0.05 | 0.04 | 0.17 | 0 | 0.09 | 0 | 0.02 | 0.14 | 0.13 | 0.06 | 0.12 | 0.07 | 0.13 | 0.09 |
| S5 | 0.04 | 0 | 0 | 0.06 | 0 | 0.04 | 0.06 | 0.04 | 0 | 0.04 | 0.02 | 0 | 0.07 | 0.09 | 0.09 |
| S6 | 0.15 | 0.05 | 0.08 | 0.17 | 0 | 0.04 | 0.03 | 0.03 | 0.14 | 0.08 | 0.04 | 0.06 | 0.07 | 0.11 | 0.12 |
| Supplier | Di+ | Di- | CC |
|---|---|---|---|
| S1 | 0.199 | 0.402 | 0.669 |
| S2 | 0.420 | 0.131 | 0.237 |
| S3 | 0.411 | 0.124 | 0.232 |
| S4 | 0.176 | 0.367 | 0.675 |
| S5 | 0.368 | 0.186 | 0.336 |
| S6 | 0.214 | 0.355 | 0.624 |
| Normalized DM | |||||||||||||||
|---|---|---|---|---|---|---|---|---|---|---|---|---|---|---|---|
| TBC1 | TBC2 | TBC3 | TBC4 | TBC5 | TBC6 | TBC7 | TBC8 | RP1 | RP2 | RP3 | RP4 | RP5 | RP6 | RP7 | |
| S1 | 0.24 | 0.45 | 0.44 | 0.46 | 0.39 | 0.35 | 0.44 | 0.36 | 0.51 | 0.34 | 0.49 | 0.83 | 0.64 | 0.47 | 0.54 |
| S2 | 0.34 | 0.45 | 0.31 | 0.17 | 0.39 | 0.29 | 0.31 | 0.50 | 0.36 | 0.21 | 0.28 | 0.09 | 0.38 | 0.29 | 0.18 |
| S3 | 0.34 | 0.32 | 0.31 | 0.35 | 0.47 | 0.41 | 0.31 | 0.22 | 0.22 | 0.34 | 0.35 | 0.09 | 0.13 | 0.18 | 0.30 |
| S4 | 0.47 | 0.45 | 0.44 | 0.52 | 0.39 | 0.53 | 0.31 | 0.36 | 0.51 | 0.62 | 0.49 | 0.46 | 0.38 | 0.53 | 0.42 |
| S5 | 0.34 | 0.32 | 0.31 | 0.29 | 0.39 | 0.41 | 0.56 | 0.50 | 0.22 | 0.34 | 0.35 | 0.09 | 0.38 | 0.41 | 0.42 |
| S6 | 0.61 | 0.45 | 0.56 | 0.52 | 0.39 | 0.41 | 0.44 | 0.43 | 0.51 | 0.48 | 0.42 | 0.28 | 0.38 | 0.47 | 0.48 |
| Weighted normalized DM | |||||||||||||||
| TBC1 | TBC2 | TBC3 | TBC4 | TBC5 | TBC6 | TBC7 | TBC8 | RP1 | RP2 | RP3 | RP4 | RP5 | RP6 | RP7 | |
| S1 | 0.04 | 0.07 | 0.05 | 0.08 | 0.04 | 0.05 | 0.04 | 0.02 | 0.10 | 0.04 | 0.06 | 0.12 | 0.09 | 0.06 | 0.08 |
| S2 | 0.06 | 0.07 | 0.04 | 0.03 | 0.04 | 0.04 | 0.03 | 0.03 | 0.07 | 0.03 | 0.03 | 0.01 | 0.05 | 0.04 | 0.03 |
| S3 | 0.06 | 0.05 | 0.04 | 0.06 | 0.05 | 0.06 | 0.03 | 0.01 | 0.04 | 0.04 | 0.04 | 0.01 | 0.02 | 0.02 | 0.04 |
| S4 | 0.08 | 0.07 | 0.05 | 0.09 | 0.04 | 0.07 | 0.03 | 0.02 | 0.10 | 0.08 | 0.06 | 0.06 | 0.05 | 0.07 | 0.06 |
| S5 | 0.06 | 0.05 | 0.04 | 0.05 | 0.04 | 0.06 | 0.05 | 0.03 | 0.04 | 0.04 | 0.04 | 0.01 | 0.05 | 0.06 | 0.06 |
| S6 | 0.10 | 0.07 | 0.07 | 0.09 | 0.04 | 0.06 | 0.04 | 0.03 | 0.10 | 0.06 | 0.05 | 0.04 | 0.05 | 0.06 | 0.07 |
| Values of w*(((f+)-fij)/(f+)-(f-)) | |||||||||||||||
| TBC1 | TBC2 | TBC3 | TBC4 | TBC5 | TBC6 | TBC7 | TBC8 | RP1 | RP2 | RP3 | RP4 | RP5 | RP6 | RP7 | |
| S1 | 0 | 0 | 0.06 | 0.03 | 0.10 | 0.10 | 0.05 | 0.03 | 0 | 0.08 | 0 | 0 | 0 | 0.02 | 0 |
| S2 | 0.05 | 0 | 0.12 | 0.18 | 0.10 | 0.14 | 0.09 | 0 | 0.10 | 0.12 | 0.12 | 0.14 | 0.07 | 0.09 | 0.14 |
| S3 | 0.05 | 0.15 | 0.12 | 0.09 | 0 | 0.07 | 0.09 | 0.06 | 0.20 | 0.08 | 0.08 | 0.14 | 0.14 | 0.14 | 0.10 |
| S4 | 0.11 | 0 | 0.06 | 0 | 0.10 | 0 | 0.09 | 0.03 | 0 | 0 | 0 | 0.07 | 0.07 | 0 | 0.05 |
| S5 | 0.05 | 0.15 | 0.12 | 0.12 | 0.10 | 0.07 | 0 | 0 | 0.20 | 0.08 | 0.08 | 0.14 | 0.07 | 0.05 | 0.05 |
| S6 | 0.17 | 0 | 0 | 0 | 0.10 | 0.07 | 0.05 | 0.01 | 0 | 0.04 | 0.04 | 0.10 | 0.07 | 0.02 | 0.02 |
| Supplier | Si | Ri | Qi | Weight (Si+Ri+Qi) (between 0 and 3) |
|---|---|---|---|---|
| S1 | 0.4701 | 0.1039 | 0 | 0.5739 |
| S2 | 1.4547 | 0.1785 | 0.8758 | 2.5090 |
| S3 | 1.4970 | 0.1980 | 1 | 2.6950 |
| S4 | 0.5717 | 0.1051 | 0.0560 | 0.7328 |
| S5 | 1.2631 | 0.1980 | 0.8861 | 2.3472 |
| S6 | 0.6936 | 0.1651 | 0.4342 | 1.2930 |
| Supplier | MABAC | OCRA | TOPSIS | VIKOR |
|---|---|---|---|---|
| S1 | 1 | 1 | 2 | 1 |
| S2 | 5 | 5 | 5 | 5 |
| S3 | 6 | 6 | 6 | 6 |
| S4 | 2 | 2 | 1 | 2 |
| S5 | 4 | 4 | 4 | 4 |
| S6 | 3 | 3 | 3 | 3 |
| MCDM Method | SRCC Equation | SRCC Value | Correlation Type |
|---|---|---|---|
| TOPSIS and OCRA, VIKOR or MABAC | Very strong | ||
| Among OCRA, VIKOR and MABAC | 1 | Absolute |
Publisher’s Note: MDPI stays neutral with regard to jurisdictional claims in published maps and institutional affiliations. |
© 2021 by the authors. Licensee MDPI, Basel, Switzerland. This article is an open access article distributed under the terms and conditions of the Creative Commons Attribution (CC BY) license (http://creativecommons.org/licenses/by/4.0/).
Share and Cite
Mohammed, A.; Yazdani, M.; Oukil, A.; Santibanez Gonzalez, E.D.R. A Hybrid MCDM Approach towards Resilient Sourcing. Sustainability 2021, 13, 2695. https://doi.org/10.3390/su13052695
Mohammed A, Yazdani M, Oukil A, Santibanez Gonzalez EDR. A Hybrid MCDM Approach towards Resilient Sourcing. Sustainability. 2021; 13(5):2695. https://doi.org/10.3390/su13052695
Chicago/Turabian StyleMohammed, Ahmed, Morteza Yazdani, Amar Oukil, and Ernesto D. R. Santibanez Gonzalez. 2021. "A Hybrid MCDM Approach towards Resilient Sourcing" Sustainability 13, no. 5: 2695. https://doi.org/10.3390/su13052695
APA StyleMohammed, A., Yazdani, M., Oukil, A., & Santibanez Gonzalez, E. D. R. (2021). A Hybrid MCDM Approach towards Resilient Sourcing. Sustainability, 13(5), 2695. https://doi.org/10.3390/su13052695