Article

Public Sentiment toward Solar Energy—Opinion Mining of Twitter Using a Transformer-Based Language Model

1
School of Public Affairs, University of Colorado Denver, 1380 Lawrence St., Denver, CO 80204, USA
2
Department of Computer Science, University of Colorado Boulder, 1111 Engineering Dr, Boulder, CO 80309, USA
3
Department of Physics, University of Colorado Boulder, 2000 Colorado Ave, Boulder, CO 80309, USA
4
Department of Linguistics, University of Colorado Boulder, Hellems 290, Boulder, CO 80309, USA
5
Department of Business Analytics, University of Colorado Boulder, 995 Regent Dr, Boulder, CO 80309, USA
*
Author to whom correspondence should be addressed.
The second and third authors (Ganesan, K. and Dickens, P.) contributed equally to this study.
Sustainability 2021, 13(5), 2673; https://doi.org/10.3390/su13052673
Submission received: 14 January 2021 / Revised: 9 February 2021 / Accepted: 20 February 2021 / Published: 2 March 2021

Abstract

:
Public acceptance and support for renewable energy are important determinants of the low-carbon energy transition. This paper examines public sentiment toward solar energy in the United States using data from Twitter, a micro-blogging platform on which people post messages, known as tweets. We filtered tweets specific to solar energy and performed a classification task using Robustly optimized Bidirectional Encoder Representations from Transformers (RoBERTa). Our RoBERTa-based sentiment classification model, fine-tuned with 6300 manually annotated tweets specific to solar energy, attains 80.2% accuracy for ternary (positive, neutral, or negative) classification. Analyzing 266,686 tweets during the period of January to December 2020, we find public sentiment varies widely across states (Coefficient of Variation = 164.66 % ). Within the study period, the Northeast U.S. region shows more positive sentiment toward solar energy than did the South U.S. region. Public opinion on solar energy is more positive in states with a larger share of Democratic voters in the 2020 presidential election. Public sentiment toward solar energy is more positive in states with consumer-friendly net metering policies and a more mature solar market. States that wish to gain public support for solar energy might want to consider implementing consumer-friendly net metering policies and support the growth of solar businesses.

1. Introduction

In 2020, solar power became the world’s cheapest source of electricity in history [1]. Solar energy contributes to greenhouse gas (GHG) emission reduction, offers new business opportunities to landowners and energy providers, and allows utility customers to lower their utility bills. Despite these advantages, less than 3% of U.S. electricity generation currently emanates from solar [2]. Support for renewable energy has expanded in the United States for the last several years [3], yet renewable energy development often experiences significant opposition due to skepticism surrounding financial benefits, system reliability, and conflicts of interest with respect to utility revenue preservation [4].
Public acceptance and awareness of renewable energy are critical to renewable energy development. Although public sentiment and opinion on renewable energy have been studied in the last decade [5,6,7], few studies have documented public perception of solar energy specifically. Public opinion on solar energy is worth investigating separately because different renewable sources such as geothermal, hydroelectricity, wind, and bioenergy have unique advantages and requirements depending on the existing climate conditions and state-specific energy policies. Furthermore, little is known about spatial variations in public opinion on solar energy across the United States.
Many existing studies rely on surveys and interviews to understand public perception of renewable energy. Although surveys and interviews can provide targeted individual-level data, they can be susceptible to selection and response biases [8]. For example, people who are more supportive of renewable energy may be more likely to respond to surveys and interviews, which may yield bias. Thus, we take a different approach by using social media data to measure public sentiment toward solar energy. Social media is an increasingly popular means to express opinions and preferences and have been used as a source of information for sentiment analysis of various social issues, including vaccination [9], healthcare service [10], gun violence [11], marijuana legalization [12], climate change [13], and the COVID-19 pandemic [14,15].
This paper has two main objectives. First, this study aims to understand public opinion using data from Twitter, a micro-blogging platform in which people can post and interact with messages known as “tweets”. With over 50 million active users in the United States alone [16], Twitter provides an ideal platform for opinion mining as extensive amounts of data are collected across a wide range of demographics and geographical locations. For opinion mining, we utilized Robustly optimized Bidirectional Encoder Representations from Transformers (RoBERTa) [17] based on recent development in the fields of Natural Language Processing (NLP) and Machine Learning (ML). Opinion mining, also known as sentiment analysis, is a field of study that analyzes people’s opinions, sentiments, attitudes and emotions toward certain subjects or entities using computational linguistics and natural language processing [18,19]. RoBERTa possesses an extensive pre-training phase which can later be fine-tuned for a domain-specific task, which can yield highly accurate sentiment analysis results. The second aim of this paper is to examine the energy market and policy determinants of public sentiment toward solar energy. In particular, we focus on state-level characteristics, including solar energy generation capacity, renewable energy portfolio standards (RPS), net metering, renewable energy incentives, and solar market maturity.
The results suggest that public opinion on solar energy varies widely across states and is more likely to be positive in states with aggressive RPS targets, consumer-friendly net metering rules, and a more mature solar market. This study has policy implications in addressing spatial disparities in public support for solar energy and future opportunities for solar energy deployment. In particular, states which implemented consumer-friendly net-metering policies are more supportive of solar energy, which may have implications for solar deployment. We also discuss the benefits of using social media as a source of data on public opinion and applying RoBERTa for sentiment classification in gauging public sentiment toward solar energy.

2. Background

Public acceptance and awareness of renewable energy are critical to the development of renewable energy industries and technology [20]. On one hand, lack of institutional, political and community support is often identified as a key barrier to renewable energy development [4]. Landscape modification and visual intrusion of facilities are highlighted as main reasons for residents’ opposition to renewable energy [21,22]. On the other hand, the contribution of renewable energy to the local and regional economy positively influences public support for renewable energy [23,24]. Not surprisingly, individuals’ opinions and preferences regarding renewable energy are highly associated with their belief and perception of global warming, climate change, and environmental risk [5,25]. Views on renewable energy are also determined by personal characteristics such as education, party identification, and age [7,26].
Government policies and public opinion on renewable energy may relate to each other in a bidirectional sense. Public acceptance and support for renewable energy may affect renewable energy policy adoption, which in turn encourages renewable energy deployment. Renewable energy programs and financial incentives can also mitigate uncertainties in the energy transition, garnering public support and acceptance for renewable energy. For example, RPS policy design and framing influence broad public support for renewable energy technologies [6]. Additionally, net metering, or an electricity billing policy allowing renewable energy system owners (e.g., residential, commercial, and industrial buildings) to use the renewable energy generated, has been shown to facilitate solar energy deployment [27,28]. A well-designed, transparent net metering policy can mitigate market and revenue uncertainties and help gain support from key stakeholders, including utilities, solar businesses, and customers [29], despite compensation rate limitations negatively impacting solar energy preferences after reaching a certain tipping point [27].
Public beliefs about the effectiveness of the policy-making and planning process are an important predictor of public sentiment toward renewable energy. Public perceptions of fairness in decision making about the siting of renewable energy facilities can mitigate public resistance to renewable energy deployments [22]. Having trust in the policymakers responsible for renewable energy development has a direct effect on public opinion [30]. Greater openness to information sharing about alternative energy options can enhance public support for renewable energy [31]. However, lack of a common understanding about the planning process contributes to the public reluctance of renewable energy adoption [32]. Public education and outreach around administrative and technological aspects of solar energy can help reverse negative perceptions of renewable energy development [30,33]. Leveraging social networks and facilitating participation in the planning and development process can also enhance public trust in solar energy development [34].
Electricity market characteristics and conditions also likely influence public opinion on renewable energy. Public preferences depend on the price of conventional electricity because renewable energy is considered an alternative to conventional electricity generation. While the availability of low-cost fossil fuel-generated electricity can make it difficult to justify renewable energy development [35], increased energy prices can enhance public acceptance of renewable energy [36]. In addition, high upfront costs and lack of adequate financing options are major barriers to public support for renewable energy [30,34]. Solar businesses contribute to local economic development, by lowering solar installation costs and creating new jobs, which in turn leads to public support for renewable energy development.
The existing literature also documents temporal and spatial variations in preferences and opinions regarding renewable energy. Public opinion about renewable energy changes over time [37,38]. For example, Hamilton et al. [7] finds that public acceptance of renewable energy shows clear upward trends from 2011 to 2018. Historical events (e.g., energy shortages and electricity price increases) can affect public awareness about renewable energy technology [38]. Public acceptance of renewable energy also varies geographically, by communities [39], states [7,40], and countries [41]. Spatial and geographical characteristics, such as region-specific culture [42], solar radiation [43], and energy autonomy of the region [41], influence spatial variations in public opinion.
Most empirical studies have used surveys and interviews to measure public opinion, sentiment, awareness and perceptions of renewable energy. The literature finds broad public support for renewable energy across the United States [6], Finland [44], Mexico [45], Spain [46], South Korea [47], Portugal [48], Greece [49] and worldwide [20,50]. Surveys and interviews have advantages in gauging individual-level demographic information, such as gender, education, income [51], distance to renewable energy facilities, and previous experience with renewable energy technologies [41], which is one of the key determinants of individuals’ preferences regarding renewable energy.
However, surveys and interviews are limited in gauging temporal dynamics and geographical variations in public opinions. Researchers are beginning to use social media, especially Twitter, to examine public sentiment toward renewable energy [38,40,52,53]. Jain and Jain [52] compare five different machine learning techniques for sentiment analysis and find that the Support Vector Machine (SVM) achieves higher accuracy than K-Nearest Neighbor, Naive Bayes, AdaBoost and Bagging algorithms for sentiment classification on renewable energy-related tweets. Using both traditional and social media for opinion mining, Nuortimo and Härkönen [53] find that public opinion on solar and wind has been the most positive compared to other energy sources, including coal, nuclear and biomass. Using Twitter data from 2014 to 2016, Abdar et al. [38] finds that Alaskans’ energy preferences have become more supportive of renewable energy over time.

3. Materials and Methods

Data are from two main sources: Twitter [54] and the U.S. federal and state government agencies. We use Twitter data for sentiment analysis, or opinion mining, of solar energy. Twitter has been a valuable source for opinion mining, but the manual classification of a large number of tweets is difficult and time-consuming. Thus, we use NLP and ML methods to detect public opinion on solar energy automatically. Section 3.1 describes Twitter data collection and pre-processing processes. Section 3.2 outlines recent developments and approaches in opinion mining. Section 3.3 explains our sentiment classification model built upon RoBERTa. Finally, Section 3.4 explains all predictors of public sentiment included in the regression analysis.

3.1. Twitter Data Collection and Pre-Processing

The Twitter Application Program Interface (API) was used to collect tweets, which are posts created by individuals on Twitter, specific to solar energy. Tweepy, a python library for accessing the Twitter API is used to stream live tweets in real-time [54]. We used ten keywords to stream live tweets, including ‘solar energy’, ‘solar panel’, ‘solar PV’, ‘solar photovoltaic’, ‘solar battery’, ‘solar thermal’, ‘solar power’, ‘solar-powered’, ‘solar generation’, and ‘solar subsidies.’ In total, 1,586,260 tweets specific to solar energy were collected between January and December of 2020.
We removed URLs, “RT (ReTweets)”, and images from original tweets using the library preprocessing [55], which aids processing text strings. We identified a list of words that make a tweet irrelevant to public sentiment toward solar energy. These words include ‘Pokemon’, ‘Superman’, ‘galaxy’, ‘eclipse’, ‘solar plexus’, ‘solar-powered human’, and ‘I will become your sun.’ We also excluded the tweets that included the 10 keywords (e.g., ‘solar energy’, ‘solar panel’, ‘solar PV’, ‘solar photovoltaic’) only in the user identification (i.e., screen name and description) but not in the text, quoted text, or extended text.
Not all tweets include geographic information that is essential to this study. Only about 50% of the tweets have geographic information either where they are based or where users tweeted. Of those, about half of the tweets are from countries other than the United States. For the purpose of this study, we only need the tweets posted by users with geolocations associated with the United States or the tweets by the users who identify themselves based in the U.S. Thus we extracted tweets with geographic information based on the self-reported locations in the user profiles as well as the latitude and longitude coordinates. The final dataset includes 266,686 unlabelled tweets as a result of this extraction process.
Of the 266,686 tweets, 9000 tweets without duplicates were randomly selected to be manually annotated. Authors classified them into one of the three classes: “positive toward solar”, “neutral toward solar”, “negative toward solar.” Retweets are included since retweeting is a way to express individuals’ support or opposition to solar energy. Table 1 illustrates examples of tweets belonging to the three classes, positive, neutral, and negative solar sentiment.

3.2. Related Opinion Mining Approaches

ML approaches have been widely applied to opinion mining. Opinion mining is the computational treatment of opinions, sentiments, attitudes, preferences, and subjectivity of text [56]. Sentiment classification is a sub-discipline of text classification, which is concerned with classifying a text into a class for analyzing opinion or sentiment in texts. Although human emotions and intents are highly complex in real life, the current state-of-the-art sentiment analysis has achieved higher performance with a simpler classification task, such as classifying texts into two (e.g., positive and negative) or three categories (e.g., positive, negative, and neutral). Existing studies have reached around 89%–92% accuracy for binary classification [17,57] and around 76%–81% accuracy for ternary classification [14,58].
Recent developments in NLP have produced effective ways for automatic sentiment analysis using ML algorithms [59]. Lexicon-based approaches using supervised and unsupervised ML algorithms, including Naïve Bayes and Support Vector Machines (SVM), have generated high accuracy in sentiment classification. They have gained wide popularity in opinion mining [60]. More recently, deep learning approaches including Gated Recurrent Units (GRUs), long short-term memory (LSTM) and Convolutional Neural Networks (CNN) have started using non-static word embedding and have shown even higher performance results than the previous ML approaches in multiple sentiment classification tasks [61,62].
Within neural network models, considerable progress has been achieved by the models using the Transformer architecture, which is based on a self-attention mechanism [63]. While such advantages have given rise to the development of new models, BERT (Bidirectional Encoder Representations from Transformers), which uses contextual sentences and word-embeddings to address the limitations of RNNs and LSTMs, has notably improved the performance of sentiment analysis [64]. BERT is also the first large-scale bidirectional unsupervised way of training the language model by using two main strategies, namely as “masked language model” (MLM) and “next sentence prediction”. A number of BERT-based models have been developed since 2018 including DistilBERT [65], AlBERT [57], XLNet [66], and RoBERTa [17]. One of the key advantages of the BERT-based models is that users do not need a large corpus of texts to train their models. Users only need to fine-tune a BERT-based model using area- and task-specific supervised training data (e.g., manually annotated tweets) because BERT is already pre-trained on the large corpus from Wikipedia and books, while utilizing more rich contextual information.

3.3. Our Approach: RoBERTa-Based Sentiment Classification

Our sentiment classification model is based on RoBERTa, a Robustly Optimized BERT [17]. Like any other BERT-based models, RoBERTa is powerful as it pre-trains the language model by a bidirectional representation of words, meaning that the model is not restricted to reading texts either right-to-left or left-to-right. This deep bidirectional pre-training structure provides the model with more information about the context. RoBERTa also achieves higher accuracy than all other previous BERT-based models including BERT, BERT-Large, and XLNet. This higher accuracy is achieved by four main modifications, including pre-training the language model with 8-times larger batches over 10-times more data; training on 5-times longer sequences; using Byte-Pair Encoding (BPE) vocabulary instead of the character-level vocabulary; removing the next sentence prediction (NSP); dynamically changing the masking pattern applied to the training data instead of static masking [17]. Thus, we chose RoBERTa as our base model, as it is considered the state-of-the-art sentiment classification approach as of 2021.
In total, we manually annotated 9000 tweets without duplicates, and the annotated tweets were used to construct the train (70%), development (15%), and test (15%) sets. As shown in Figure 1, we fine-tuned RoBERTa using 6300 annotated tweets. Of the 6300 tweets, 2498 are annotated as positive, 1736 are annotated as neutral, and 2066 are annotated as negative. During the annotation process, we detected sarcastic expressions (e.g., “Solar power? Yeah, right. That is a top concern for millions of Americans during COVID.”) and classified the tweets including such expressions into the negative class.
We used the HuggingFace transformer library [67], which includes the standard RoBERTa-based architecture with 12 hidden states and 12 attention heads, but with some modifications to the hyper-parameters, the parameters in which values are used to control the learning process in machine learning. We also used the AdamW optimizer [68] to minimize the cross-entropy loss. To optimize the parameters, we conducted a number of experiments testing multiple combinations of the hyper-parameters on the development set (15% of the annotated tweets). In the final model, we fine-tuned RoBERTa with a learning rate of 2 × 10 5 , an ϵ of 1 × 10 8 , and a dropout of 0.1. We set the maximum sequence length to 258 tokens, used a batch size of 16, and train for 5 epochs on a Tesla P100 GPU. Using this final set of hyper-parameters, our model with three categories (positive, negative, and neutral) achieves 80.2% accuracy with an F1 score of 80.1% on the test set (Our language model achieves 90.7% accuracy with binary classification (positive and negative). Notwithstanding the higher accuracy of binary classification, we choose to use ternary classification in this study because a significant portion of tweets does not have a positive or negative semantic orientation.).

3.4. Renewable Energy Policy and Market

The second aim of this study is to examine associations between public sentiment on solar energy and renewable energy policy and market characteristics. The characteristics examined in this study include solar energy generation, RPS, net metering, the number of existing renewable energy incentives and policies, electricity price, and solar energy market maturity.

3.4.1. Solar Energy Generation

A state’s existing solar energy generation capacity may be positively associated with public acceptance of solar energy. Solar generation is measured as the percentage of total electricity generated from solar photovoltaic or thermal in Megawatt-hours in 2019. Data are from the U.S. Energy Information Administration (EIA) [2].
S o l a r G e n e r a t i o n i = S o l a r T h e r m a l & P h o t o v o l t a i c G e n e r a t i o n i T o t a l E l e c t r i c i t y G e n e r a t i o n i .

3.4.2. RPS

RPS policy is a state-level mechanism that requires utilities to generate or purchase a certain percentage of energy from renewable sources. Although RPS policies share common characteristics, the design features vary widely across states. Existing studies have developed and used different RPS measures, including a binary measure of whether the state has RPS policies [69], an RPS percentage target [70], an interaction between the percentage target and the target year [71], marginal RPS targets [72], and an RPS target combined with “free trade” of Renewable Energy Certificates (RECs) [73]. In order to take into account such variations, we construct a measure for RPS as follows:
R P S i = T a r g e t P e r c e n t i 2019 G e n e r a t i o n i T a r g e t Y e a r i 2019 .
States that already achieved an RPS target or do not have RPS policies as of 2019 received a score of 0. RPS data of 2019’s Quarter 4 are from state government agencies. Iowa and Texas do not have a target year, but both states already achieved the RPS target and received a score of 0.

3.4.3. Net Metering

Net metering (NEM) data are from the North Carolina Clean Energy Technology Center [74]. Some states have enacted net metering policies and other distributed generation (DG) compensation rules to allow electricity customers generating electricity (e.g., rooftop solar) to use that generated energy at any time. Solar system owners send the excess energy back to the electricity grid and are compensated at a specific rate. DG compensation policies provide substantial incentives for solar energy generation as commercial and residential building owners can use solar energy at night, generated during sunny or cloudy days. Net metering policies can vary significantly in terms of design and features. Thus, we construct an additive measure capturing five key features of the net metering policies:
  • M e c h a n i s m i : The existence of statewide net metering mechanisms (4 = statewide net metering; 3 = statewide alternative compensation mechanism; 2 = some customers (e.g., residential buildings) receive net metering benefits; 1 = only selective utilities (e.g., Investor-owned utilities) provide net metering; 0 = no net metering or alternative DG compensation)
  • C a p i : Net metering capacity limitations, which regulate the size of systems which can receive net metering benefits in states (1 = unlimited system size; 0 = otherwise)
  • S u b s c r i b e r i : Net metering subscriber size limitation (1 = unlimited; 0 = otherwise)
  • C o m p e n s a t i o n i : Compensation rate for energy generation (1 = compensate for customer rates; 0 = otherwise)
  • R o l l o v e r i : Rollover of the remaining energy is allowed (2 = allowed without any limitations; 1 = partially allowed or allowed only until the end of billing year; 0 = not allowed)
    N E M i = M e c h a n i s m i + C a p i + S u b s c r i b e r i + C o m p e n s a t i o n i + R o l l o v e r i

3.4.4. Renewable Incentives

States which have enacted more renewable energy policies and incentives may have greater public support for renewable energy. Thus, we included the number of renewable energy policies and incentives by states in October 2019. The data were collected from the database of State Incentives for Renewable & Efficiency [75].

3.4.5. Solar Market Maturity

Public sentiment on solar energy may be more positive in states with a more mature solar market as this creates jobs and supports local economic development. Solar market maturity is measured by the number of solar industry jobs per 1 million people in the state population in 2019. The data were obtained from the National Solar Job Census [76].

3.4.6. Electricity Price

Higher electricity prices may be associated with higher public sentiment toward solar energy because distributed renewable energy generation helps reduce electricity bills in places with high electricity rates [35,36]. Thus, the average price of electricity to ultimate residential customers by the state in August 2019 is included in the regression model. The electricity data are from the U.S. Energy Information Administration (EIA) [2].

3.5. Other Predictors of Public Opinion on Solar Energy

To control for alternative explanations of public opinion on solar energy, the regression model includes solar radiation, median household income, and political leaning.

3.5.1. Solar Radiation

The level of solar radiation positively predicts solar photovoltaic system installations [43] and solar energy generation [70]. As the solar energy system achieves greater efficiency and performance in regions with high solar radiation, we expect that annual average solar radiation is positively associated with sentiment toward solar energy. Solar radiation is measured in KWh/m 2 /Day and is aggregated at the state level. Solar radiation data are from the National Renewable Energy Laboratory’s National Solar Radiation Database [77].

3.5.2. Median Household Income

As solar companies use credit scores to determine whom to approve for solar installation, income can be an important determinant of public sentiment on solar energy. Previous studies have consistently identified income as a predictor of public attitudes about renewable energy [21,51]. Thus, state median household income measured in 2019 is included in the model. Data are from the U.S. Census.

3.5.3. Political Leaning

Political ideology has been identified as one of the important predictors of American’s preferences for renewable energy [7,78]. Using survey data from 2011 to 2017, Pew Research Center reports that Democrats are more likely to prefer renewable energy development than Republican [3]. More recently, Gustafson et al. [79] find that both Republicans and Democrats support renewable energy development using survey data from 2018, but party identification relates to why they support renewable energy. To examine whether states’ political leanings explain public sentiment toward solar energy at the state level, the proportion of votes that the Democratic party received in the 2020 presidential election. Election data are from the MIT Election Lab [80].

4. Results

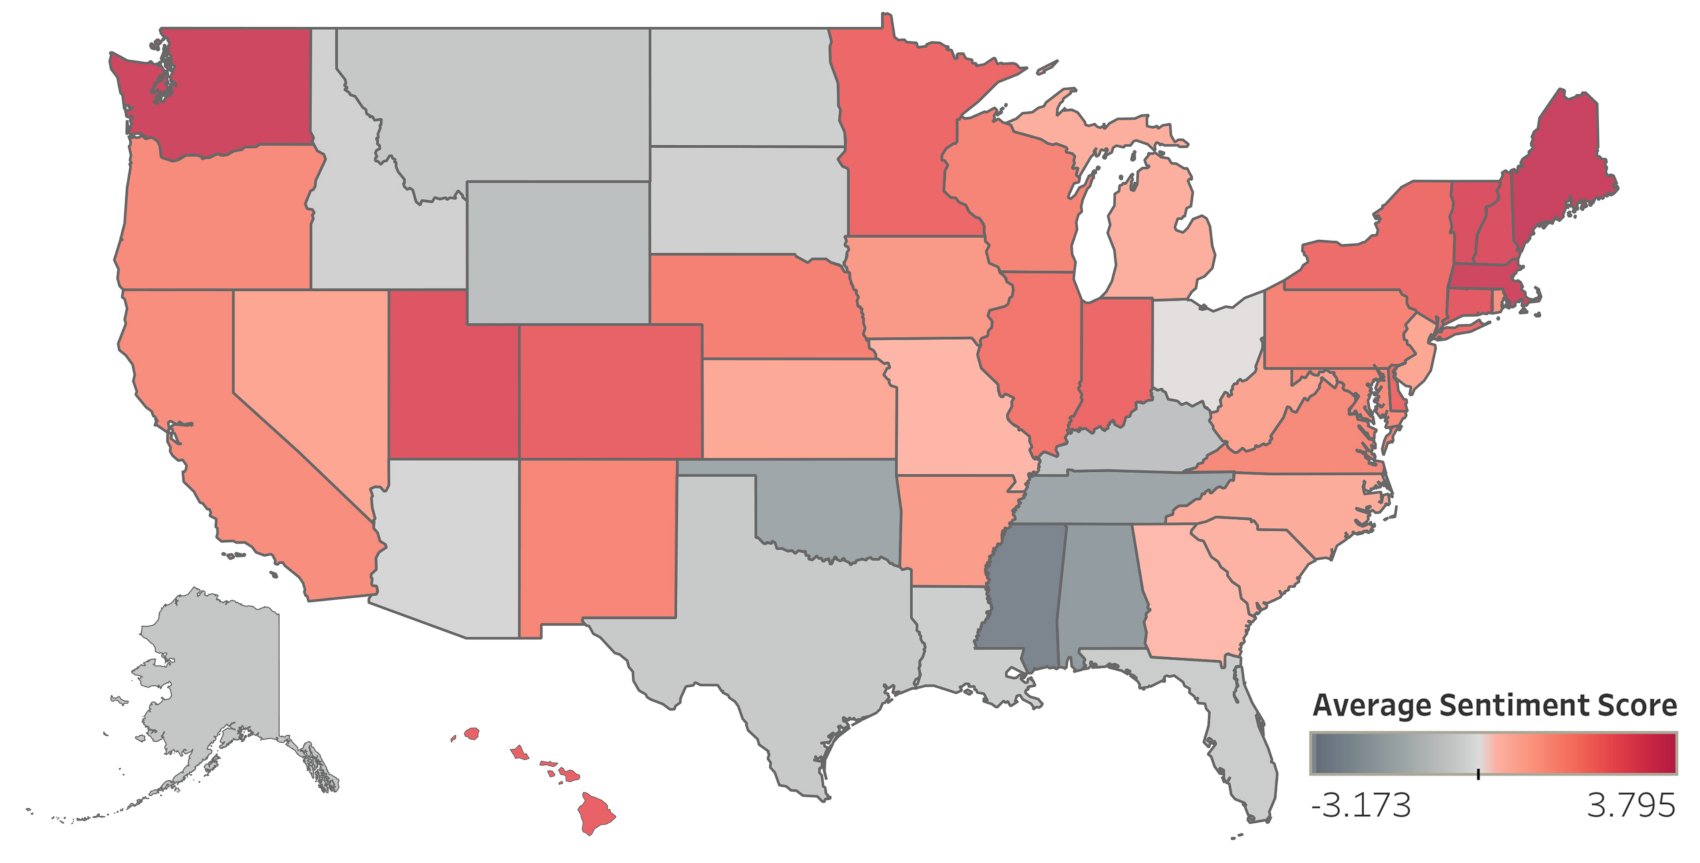
4.1. Public Opinion on Solar Energy by State

Figure 2 presents word cloud visualizations which present the most frequently appearing words in all 266,686 tweets. Of those, 119,172 tweets are classified as positive, 75,762 tweets are classified as neutral, and 71,752 tweets are classified as negative. The default stopwords (e.g., and, is, the) defined in the wordcloud library [81] are removed. The word “Solar” is also removed as every Tweet in the dataset includes “Solar.” A small number of curse and offensive words are also removed. The difference between positive, neutral, and negative classes is quite noticeable. The most common words in positive tweets include ’energy’, ’clean’, ’renewable’, ’new’, ’world’, ’battery’, ’great’, ’build’, ’house’, ’electric’, ’cost’, ’thank’, ’first’, ’job’, among others. The most frequently appearing words in neutral tweets include ’energy’, ’current’, ’weather’, ’data’, ’system’, ’battery’, ’day’, ’time’, ’check’, and ’light’. The most frequently appearing words in negative tweets include ’dem(ocrats)’, ’unrelated’, ’reproach’, ’green’, ’new’, ’deal’, ’people’, ’new’, ’telling’, ’prioritizing’, among others. These word clouds demonstrate the political nature of renewable energy development. Political events (e.g., election) and leaders (e.g., president, house representatives) appear to influence public sentiment on renewable energy significantly.
Figure 3 is a national map of the average public sentiment score in the United States in 2020. To provide numerical estimation and comparisons, numerical values are assigned to the three sentiment classes: Positive = 10; Neutral = 0; Negative = –10. Thus, every tweet takes one of the three values, −10, 0, and 10. State average sentiment scores are the mean values of all tweets from each state. Red-colored states, as opposed to gray-colored states, are more positive toward solar energy. The Northeast U.S. region shows more positive sentiment toward solar energy than did the South U.S. region. There is a statistically significant difference (one-way ANOVA, F ( 3 , 47 ) = 5.25 , p < 0.01 ) across four U.S. Census regions (Northeast, Midwest, South, and West), but the Bartlett’s test with Bonferroni adjustment indicates that only the difference between the Northeast and the South is statistically significant ( N o r t h e a s t ¯ S o u t h ¯ = 2.38 , p < 0.01 ).
Figure 4 displays the average sentiment scores of 50 states and the District of Columbia (n = 51) between 12 January and 31 December 2020. The average sentiment score can vary from −10 (all tweets from the state are classified as “negative”) to 10 (all tweets from the state are classified as “positive”). The state average sentiment score ranges from −3.173 (Mississippi) to 3.795 (District of Columbia). The number of tweets from each state varies from 201 (North Dakota) to 67,024 (California). The 95% confidence intervals depend on the number of tweets collected from each state, resulting in larger confidence intervals for North Dakota (n = 201), West Virginia (n = 262), and South Dakota (n = 274).

4.2. Sentiment toward Solar Energy and Renewable Energy Policy and Market Characteristics

Table 2 presents the descriptive statistics for all variables included in the statistical analysis. The average sentiment score of each state is calculated by averaging sentiment scores of all tweets from each state. Thus, the mean of the average sentiment scores (0.996) in Table 2 is lower than the national average (1.778) of all tweets, as the means for states are based on non-weighted state averages. The highest correlation among the predictors is 68%, between median household income and the proportion of Democratic voters in the 2020 presidential election.
Table 3 presents the results from the regression of sentiment score on the renewable energy policy and market variables as well as the control variables. The first nine models examine bivariate associations between sentiment and the predictors. The full model (model 10) includes all variables. Model 1 indicates the proportion of solar energy generation positively predicts public sentiment toward solar energy ( β = 0.131, p < 0.1). Model 2 suggests public sentiment on solar energy is more positive in states which enacted higher annual RPS targets ( β = 0.374, p < 0.01). Model 3 results indicate states with more consumer-friendly net metering policies (e.g., statewide net metering mechanisms, no capacity limitations, year-to-year rollover) have a more positive sentiment toward solar energy ( β = 0.367, p < 0.01). Net metering explains 21.8% of the variation in public sentiment on solar energy. The number of renewable energy incentives in states is positively correlated with public sentiment ( β = 0.01, p < 0.05) in model 4. The results from model 5 suggest that solar energy is perceived more positively in states with a more mature solar market ( β = 1.209, p < 0.01). Average sentiment score is higher in states with higher electricity price ( β = 0.141, p < 0.01) as shown in model 6.
Of the control variables, median household income ( β = 6.263, p < 0.01) and the proportion of votes for the democratic party candidates ( β = 9.158, p < 0.01) for the 2020 presidential election are statistically significant. The coefficients of determination ( R 2 ) are high in both models (37.9% and 44.8% respectively). States with higher median income and more Democratic voters are more likely to support solar energy. However, solar radiation does not predict public sentiment on solar energy at the state level.
The full model (model 10) explains 59.6% of the total variation in the public sentiment. No heteroskedasticity problem is detected (Breusch-Pagan Lagrange Multiplier test p = 0.668 ). There is no multicollinearity issue (mean Variance Inflation Factor = 1.59). In the full model, only net metering ( β = 0.221, p < 0.05) and solar market maturity ( β = 0.795, p < 0.1) are statistically significant. These results from model 10 indicate that state net metering policies and solar market maturity, among all other predictors, are the most important factors in explaining public opinion on solar energy.

5. Discussion

As of 2020, overall public sentiment toward solar energy is slightly more positive in the United States, but there is substantial variation across states (Coefficient of Variation = 164.66 % ). The results highlight the importance of renewable energy policies, as all three policy variables included in the regression model—RPS, net metering, renewable incentives—are statistically significant predictors of public sentiment toward solar energy.
Of the policies, net metering is the strongest predictor of public sentiment on solar energy. As net metering offers direct financial benefits to residential and commercial solar system owners, we suspect that state net-metering policies influence public support for solar energy. Considering the impact of net metering rules and retail rates on consumer-side solar system deployment [27], specific design elements (e.g., compensation rate, capacity limitations, subscriber size limitations), as opposed to simply having net metering rules, plays an important role in fostering positive public perceptions of solar energy. For example, indefinite rollover of excess renewable generation credits and compensation at retail electricity prices provides more explicit incentives, which in turn may promote a positive perception of solar energy.
Another important predictor of public sentiment is solar energy market maturity, measured by the number of solar jobs per 1 million residents in the state. This finding suggests public support for solar energy could positively influence solar energy market growth and vice versa. Public acceptance of solar energy may be one of the factors that attracts solar businesses. At the same time, economies of scale in the solar market could enable solar firms to lower system installation costs and grid fees, generating “trickle-down” effects that benefit solar energy customers and increasing public support for solar energy.
As noted above, public sentiment toward solar energy is more positive in states with higher annual RPS targets, more renewable energy incentives, and consumer-friendly net metering policies. This finding suggests state energy policy programs could be an effective way to build public support for solar energy. However, these results should be interpreted with caution as our model does not imply causation. On the one hand, renewable energy policies may help garner public support for solar energy development. On the other hand, positive attitudes toward solar energy may facilitate the adoption of such policies. Further research is needed to explore the sequential order of public sentiment and renewable energy policies to answer the question: Does public perception of solar energy precede renewable energy policies or vice versa?
Figure 5 illustrates the temporal variation in sentiment for the one-year period of Twitter data collection. This figure demonstrates that events can potentially shift public opinion on solar energy. The sharp decline in sentiment score on 23–25 March is motivated by congressional discussion on the inclusion of tax incentives for renewable energy in the Coronavirus Aid, Relief, and Economic Security (CARES) Act of 2020. As a robustness check, we tested an alternative model excluding the tweets from 23–25 March. The main findings from the alternative model were consistent with the original model, except for the estimated effect of RPS. In the alternative model, RPS is statistically significant in explaining solar sentiment in both the bivariate and full models.
The regression results suggest a strong positive correlation between the proportion of Democratic vote and the average sentiment score. However, this association might have been affected by the unusual political and social environment in 2020. The Republican and Democratic candidates in the 2020 presidential election had starkly contrasting views on energy industry, climate change, and renewable energy development. Many Twitter users express their opinions on solar energy alongside the views presented by the candidates, sometimes in support, other times in opposition. Thus, the regression results for political leaning at the state level may reflect individuals’ support for, or opposition to, presidential candidates, rather than their views on solar energy.
This study has a few limitations. First, the Twitter data we collected may not be fully representative of all U.S. residents due to demographic disparities between Twitter users and non-users [16]. Twitter users tend to be younger and more politically liberal than the general public [82], and at the same time, younger and more liberal populations tend to favor renewable energy development [7]. Therefore, the estimated average sentiment score (1.778) is likely to be inflated compared to the true sentiment score. Considering sentiment classification can be highly dependent on the platform from which the training data are extracted, future research could address this limitation by incorporating data from multiple social media platforms.
Second, this study does not make a distinction between alternative solar technologies, such as solar photovoltaic and thermal, in gauging public opinion on solar energy. Public opinion may differ across solar technologies as they have different advantages and disadvantages in usage, applicability, and capital costs. But the differences between technologies are not meaningfully detected in our dataset because only a small proportion of tweets mention specific solar technologies. Few tweets mention solar thermal. Further research can investigate the differences in public opinion across the technologies using other types of data, such as solar energy-user surveys.
Finally, although our language model achieves competitive accuracy (80.2%) with ternary classification (positive, neutral, and negative), it is not sufficient to capture fine-grained human emotions, such as happiness, joy, excitement, anger, sadness, frustration, fear, and sarcasm. As proposed by Abdar et al. [38], public preferences and attitudes on renewable energy can be measured along multiple dimensions, including valence (positive versus negative) and arousal (high versus low level of activation). Future research should aim to capture multidimensional emotions by, for example, modeling irony and sarcasm detection [83] and explicitly modeling the semantics of the emotion labels [84].

6. Conclusions

This study aims to understand public opinion on solar energy in the United States and provide an exploratory analysis on the determinants of public opinion on solar energy. Using 266,686 tweets collected in 2020, this study finds public sentiment on solar energy varies widely across states. The Northeast region is most supportive of solar energy, while the South region is the lowest. State-level renewable energy policies, such as RPS, net metering, and renewable energy incentives, are positively correlated with public sentiment. Net metering and solar market maturity are the most important predictors of public sentiment toward solar energy.
The main contributions of this study are as follows:
  • Leveraging recent developments in machine learning, computational linguistics, and natural language processing, this study proposes a way to measure public opinion on renewable energy while effectively utilizing a large corpus of social media data.
  • Applying RoBERTa, a state-of-the-art language model as of 2021, with three classes (positive, neutral, and negative) achieves 80.2% accuracy. Our solar-specific language model, fine-tuned with 6300 manually annotated tweets, generates highly competitive results compared with other BERT-based sentiment analyses with three classes [58,85].
  • This study provides a comprehensive picture of the geographical variation in public sentiment regarding solar energy across states. The variation is explained by state policy and market characteristics while refuting the theory that solar sentiment can be explained by solar radiation amounts.
  • This paper provides empirical evidence of the positive relationship between public sentiment toward solar energy and renewable energy policy and market characteristics. States that wish to gain public support for solar energy may need to consider implementing consumer-friendly net metering policies (e.g., statewide net metering mechanisms, no capacity limitations, rollover of the remaining energy) and support the growth of solar businesses.

Author Contributions

Conceptualization, S.Y.K.; methodology, S.Y.K., K.G., P.D.; investigation, S.Y.K., K.G., P.D.; software, S.Y.K., K.G., P.D. and S.P.; data curation, S.Y.K., K.G., P.D. and S.P.; writing—original draft preparation, S.Y.K.; writing—review and editing, K.G., P.D.; visualization, S.Y.K.; project administration, S.Y.K.; funding acquisition, S.Y.K. All authors have read and agreed to the published version of the manuscript.

Funding

This research was supported by the University of Colorado Denver Presidential Initiative on Urban and Place-Based Research.

Institutional Review Board Statement

Not applicable.

Informed Consent Statement

Not applicable.

Data Availability Statement

Data and Python code are available in open GitHub repository (https://github.com/SerenaYKim/Solar-Sentiment-BERT (accessed on 28 February 2021)).

Acknowledgments

The authors thank Heeyoung Kwon, William Swann, and Katharina Kann for helpful suggestions.

Conflicts of Interest

The authors declare no conflict of interest.

Abbreviations

The following abbreviations are used in this manuscript:
BERTBidirectional Encoder Representations from Transformers
CNNConvolutional Neural Networks
DGDistributed Generation
EIAEnergy Information Administration
GHGGreenhouse Gas
GPUGraphics Processing Unit
LSTMLong Short-Term Memory
MLMachine Learning
NEMNet Metering
NLPNatural Language Processing
RECsRenewable Energy Certificates
RoBERTaRobustly optimized Bidirectional Encoder Representations from Transformers
RPSRenewable Portfolio Standards
SVMSupport Vector Machines

References

  1. Agency, I.E. World Energy Outlook 2020. 2020. Available online: https://webstore.iea.org/world-energy-outlook-2020 (accessed on 1 December 2020).
  2. U.S. Energy Information Administration. Electricity Generation by Energy Source. 2019. Available online: https://www.eia.gov/electricity/monthly (accessed on 15 April 2020).
  3. Center, P.R. Two-Thirds of Americans Give Priority to Developing Alternative Energy over Fossil Fuels. 2017. Available online: https://www.pewresearch.org/fact-tank/2017/01/23/two-thirds-of-americans-give-priority-to-developing-alternative-energy-over-fossil-fuels (accessed on 15 August 2020).
  4. Wyllie, J.O.; Essah, E.A.; Ofetotse, E.L. Barriers of solar energy uptake and the potential for mitigation solutions in Barbados. Renew. Sustain. Energy Rev. 2018, 91, 935–949. [Google Scholar] [CrossRef]
  5. Noblet, C.L.; Teisl, M.F.; Evans, K.; Anderson, M.W.; McCoy, S.; Cervone, E. Public preferences for investments in renewable energy production and energy efficiency. Energy Policy 2015, 87, 177–186. [Google Scholar] [CrossRef] [Green Version]
  6. Stokes, L.C.; Warshaw, C. Renewable energy policy design and framing influence public support in the United States. Nat. Energy 2017, 2, 1–6. [Google Scholar] [CrossRef]
  7. Hamilton, L.C.; Hartter, J.; Bell, E. Generation gaps in US public opinion on renewable energy and climate change. PLoS ONE 2019, 14, e0217608. [Google Scholar]
  8. Buntain, C.; McGrath, E.; Golbeck, J.; LaFree, G. Comparing Social Media and Traditional Surveys around the Boston Marathon Bombing. In Proceedings of the Microposts2016 Workshop Proceedings, Montreal, QC, Canada, 11 April 2016; pp. 34–41. [Google Scholar]
  9. Salathé, M.; Khandelwal, S. Assessing vaccination sentiments with online social media: Implications for infectious disease dynamics and control. PLoS Comput Biol. 2011, 7, e1002199. [Google Scholar] [CrossRef] [Green Version]
  10. Wallace, B.C.; Paul, M.J.; Sarkar, U.; Trikalinos, T.A.; Dredze, M. A large-scale quantitative analysis of latent factors and sentiment in online doctor reviews. J. Am. Med. Inform. Assoc. 2014, 21, 1098–1103. [Google Scholar] [CrossRef] [PubMed]
  11. Wang, N.; Varghese, B.; Donnelly, P.D. A machine learning analysis of Twitter sentiment to the Sandy Hook shootings. In Proceedings of the 2016 IEEE 12th International Conference on e-Science (e-Science), San Diego, CA, USA, 23–27 October 2016; pp. 303–312. [Google Scholar]
  12. Cavazos-Rehg, P.A.; Krauss, M.; Fisher, S.L.; Salyer, P.; Grucza, R.A.; Bierut, L.J. Twitter chatter about marijuana. J. Adolesc. Health 2015, 56, 139–145. [Google Scholar] [CrossRef] [Green Version]
  13. Loureiro, M.L.; Alló, M. Sensing climate change and energy issues: Sentiment and emotion analysis with social media in the UK and Spain. Energy Policy 2020, 143, 111490. [Google Scholar] [CrossRef]
  14. Duong, V.; Pham, P.; Yang, T.; Wang, Y.; Luo, J. The ivory tower lost: How college students respond differently than the general public to the covid-19 pandemic. arXiv 2020, arXiv:2004.09968. [Google Scholar]
  15. Müller, M.; Salathé, M.; Kummervold, P.E. COVID-Twitter-BERT: A Natural Language Processing Model to Analyse COVID-19 Content on Twitter. arXiv 2020, arXiv:2005.07503. [Google Scholar]
  16. Aslam, S. Twitter by the Numbers: Stats, Demographics & Fun Facts. 2019. Available online: https://www.omnicoreagency.com/twitter-statistics (accessed on 22 September 2020).
  17. Liu, Y.; Ott, M.; Goyal, N.; Du, J.; Joshi, M.; Chen, D.; Levy, O.; Lewis, M.; Zettlemoyer, L.; Stoyanov, V. RoBERTa: A Robustly Optimized BERT Pretraining Approach. arXiv 2019, arXiv:1907.11692. [Google Scholar]
  18. Wikipedia. Sentiment Analysis. 2020. Available online: https://en.wikipedia.org/wiki/Sentiment_analysis (accessed on 12 August 2020).
  19. Liu, B. Sentiment Analysis and Subjectivity. Handb. Nat. Lang. Process. 2010, 2, 627–666. [Google Scholar]
  20. Qazi, A.; Hussain, F.; Rahim, N.A.; Hardaker, G.; Alghazzawi, D.; Shaban, K.; Haruna, K. Towards sustainable energy: A systematic review of renewable energy sources, technologies, and public opinions. IEEE Access 2019, 7, 63837–63851. [Google Scholar] [CrossRef]
  21. Bertsch, V.; Hall, M.; Weinhardt, C.; Fichtner, W. Public acceptance and preferences related to renewable energy and grid expansion policy: Empirical insights for Germany. Energy 2016, 114, 465–477. [Google Scholar] [CrossRef]
  22. Wolsink, M. Wind power implementation: The nature of public attitudes: Equity and fairness instead of ‘backyard motives’. Renew. Sustain. Energy Rev. 2007, 11, 1188–1207. [Google Scholar] [CrossRef]
  23. Olson-Hazboun, S.K.; Krannich, R.S.; Robertson, P.G. Public views on renewable energy in the Rocky Mountain region of the United States: Distinct attitudes, exposure, and other key predictors of wind energy. Energy Res. Soc. Sci. 2016, 21, 167–179. [Google Scholar] [CrossRef] [Green Version]
  24. Bidwell, D. The role of values in public beliefs and attitudes towards commercial wind energy. Energy Policy 2013, 58, 189–199. [Google Scholar] [CrossRef]
  25. Dreyer, S.J.; Polis, H.J.; Jenkins, L.D. Changing Tides: Acceptability, support, and perceptions of tidal energy in the United States. Energy Res. Soc. Sci. 2017, 29, 72–83. [Google Scholar] [CrossRef]
  26. Sardianou, E.; Genoudi, P. Which factors affect the willingness of consumers to adopt renewable energies? Renew. Energy 2013, 57, 1–4. [Google Scholar] [CrossRef]
  27. Comello, S.; Reichelstein, S. Cost competitiveness of residential solar PV: The impact of net metering restrictions. Renew. Sustain. Energy Rev. 2017, 75, 46–57. [Google Scholar] [CrossRef]
  28. Darghouth, N.R.; Wiser, R.H.; Barbose, G.; Mills, A.D. Net metering and market feedback loops: Exploring the impact of retail rate design on distributed PV deployment. Appl. Energy 2016, 162, 713–722. [Google Scholar] [CrossRef] [Green Version]
  29. Barnes, J.; Haynes, R. The Great Guessing Game: How Much Net Metering Capacity Is Left? 2015. Available online: www.eq-research.com (accessed on 21 August 2020).
  30. Kardooni, R.; Yusoff, S.B.; Kari, F.B.; Moeenizadeh, L. Public opinion on renewable energy technologies and climate change in Peninsular Malaysia. Renew. Energy 2018, 116, 659–668. [Google Scholar] [CrossRef]
  31. Zarnikau, J. Consumer demand for ‘green power’and energy efficiency. Energy Policy 2003, 31, 1661–1672. [Google Scholar] [CrossRef]
  32. Brummer, V. Community energy–benefits and barriers: A comparative literature review of Community Energy in the UK, Germany and the USA, the benefits it provides for society and the barriers it faces. Renew. Sustain. Energy Rev. 2018, 94, 187–196. [Google Scholar] [CrossRef]
  33. Ribeiro, F.; Ferreira, P.; Araújo, M.; Braga, A.C. Modelling perception and attitudes towards renewable energy technologies. Renew. Energy 2018, 122, 688–697. [Google Scholar] [CrossRef]
  34. Noll, D.; Dawes, C.; Rai, V. Solar community organizations and active peer effects in the adoption of residential PV. Energy Policy 2014, 67, 330–343. [Google Scholar] [CrossRef]
  35. Bunting, A. Opposition to wind power: Can it be a catalyst for improving public understanding of energy usage. In Proceedings of the Technologies, Publics and Power Conference, Freemantle, WA, USA, 4–7 February 2004; pp. 1–13. [Google Scholar]
  36. Teisl, M.F.; McCoy, S.; Marrinan, S.; Noblet, C.L.; Johnson, T.; Wibberly, M.; Roper, R.; Klein, S. Will offshore energy face “Fair winds and following seas”?: Understanding the factors influencing offshore wind acceptance. Estuaries Coasts 2015, 38, 279–286. [Google Scholar] [CrossRef] [Green Version]
  37. Von Borgstede, C.; Andersson, M.; Johnsson, F. Public attitudes to climate change and carbon mitigation—Implications for energy-associated behaviours. Energy Policy 2013, 57, 182–193. [Google Scholar] [CrossRef]
  38. Abdar, M.; Basiri, M.E.; Yin, J.; Habibnezhad, M.; Chi, G.; Nemati, S.; Asadi, S. Energy choices in Alaska: Mining people’s perception and attitudes from geotagged tweets. Renew. Sustain. Energy Rev. 2020, 124, 109781. [Google Scholar] [CrossRef]
  39. Bush, D.; Hoagland, P. Public opinion and the environmental, economic and aesthetic impacts of offshore wind. Ocean Coast. Manag. 2016, 120, 70–79. [Google Scholar] [CrossRef]
  40. Li, R.; Crowe, J.; Leifer, D.; Zou, L.; Schoof, J. Beyond big data: Social media challenges and opportunities for understanding social perception of energy. Energy Res. Soc. Sci. 2019, 56, 101217. [Google Scholar] [CrossRef]
  41. Schumacher, K.; Krones, F.; McKenna, R.; Schultmann, F. Public acceptance of renewable energies and energy autonomy: A comparative study in the French, German and Swiss Upper Rhine region. Energy Policy 2019, 126, 315–332. [Google Scholar] [CrossRef]
  42. Bach, L.; Hopkins, D.; Stephenson, J. Solar electricity cultures: Household adoption dynamics and energy policy in Switzerland. Energy Res. Soc. Sci. 2020, 63, 101395. [Google Scholar] [CrossRef]
  43. Schaffer, A.J.; Brun, S. Beyond the sun—Socioeconomic drivers of the adoption of small-scale photovoltaic installations in Germany. Energy Res. Soc. Sci. 2015, 10, 220–227. [Google Scholar] [CrossRef]
  44. Kosenius, A.K.; Ollikainen, M. Valuation of environmental and societal trade-offs of renewable energy sources. Energy Policy 2013, 62, 1148–1156. [Google Scholar] [CrossRef]
  45. Hagen, B.; Pijawka, D. Public perceptions and support of renewable energy in North America in the context of global climate change. Int. J. Disaster Risk Sci. 2015, 6, 385–398. [Google Scholar] [CrossRef] [Green Version]
  46. del Río, P.; Mir-Artigues, P. Support for solar PV deployment in Spain: Some policy lessons. Renew. Sustain. Energy Rev. 2012, 16, 5557–5566. [Google Scholar] [CrossRef]
  47. Kim, J.; Park, S.Y.; Lee, J. Do people really want renewable energy? Who wants renewable energy? Discrete choice model of reference-dependent preference in South Korea. Energy Policy 2018, 120, 761–770. [Google Scholar] [CrossRef]
  48. Sütterlin, B.; Siegrist, M. Public acceptance of renewable energy technologies from an abstract versus concrete perspective and the positive imagery of solar power. Energy Policy 2017, 106, 356–366. [Google Scholar] [CrossRef]
  49. Kaldellis, J.; Kapsali, M.; Kaldelli, E.; Katsanou, E. Comparing recent views of public attitude on wind energy, photovoltaic and small hydro applications. Renew. Energy 2013, 52, 197–208. [Google Scholar] [CrossRef]
  50. WorldPublicOpinion. World Publics Strongly Favor Requiring More Wind and Solar Energy, More Efficiency, Even If It Increases Costs. 2007. Available online: http://worldpublicopinion.net (accessed on 24 October 2020).
  51. Ladenburg, J. Attitudes towards offshore wind farms—The role of beach visits on attitude and demographic and attitude relations. Energy Policy 2010, 38, 1297–1304. [Google Scholar] [CrossRef]
  52. Jain, A.; Jain, V. Sentiment classification of twitter data belonging to renewable energy using machine learning. J. Inf. Optim. Sci. 2019, 40, 521–533. [Google Scholar] [CrossRef]
  53. Nuortimo, K.; Härkönen, J. Opinion mining approach to study media-image of energy production. Implications to public acceptance and market deployment. Renew. Sustain. Energy Rev. 2018, 96, 210–217. [Google Scholar] [CrossRef]
  54. Twitter. Tweepy. Available online: https://www.tweepy.org/ (accessed on 9 January 2020).
  55. Murphy, M. Preprocessing. 2018. Available online: https://pypi.org/project/preprocessing/ (accessed on 24 April 2020).
  56. Khairnar, J.; Kinikar, M. Machine learning algorithms for opinion mining and sentiment classification. Int. J. Sci. Res. Publ. 2013, 3, 1–6. [Google Scholar]
  57. Lan, Z.; Chen, M.; Goodman, S.; Gimpel, K.; Sharma, P.; Soricut, R. Albert: A lite bert for self-supervised learning of language representations. arXiv 2019, arXiv:1909.11942. [Google Scholar]
  58. Yin, D.; Meng, T.; Chang, K.W. SentiBERT: A Transferable Transformer-Based Architecture for Compositional Sentiment Semantics. arXiv 2020, arXiv:2005.04114. [Google Scholar]
  59. Poria, S.; Hazarika, D.; Majumder, N.; Mihalcea, R. Beneath the Tip of the Iceberg: Current Challenges and New Directions in Sentiment Analysis Research. arXiv 2020, arXiv:2005.00357. [Google Scholar] [CrossRef]
  60. Hasan, A.; Moin, S.; Karim, A.; Shamshirband, S. Machine learning-based sentiment analysis for twitter accounts. Math. Comput. Appl. 2018, 23, 11. [Google Scholar] [CrossRef] [Green Version]
  61. Mathew, L.; Bindu, V. A Review of Natural Language Processing Techniques for Sentiment Analysis using Pre-trained Models. In Proceedings of the 2020 Fourth International Conference on Computing Methodologies and Communication (ICCMC), Erode, India, 11–13 March 2020; pp. 340–345. [Google Scholar]
  62. Poria, S.; Cambria, E.; Gelbukh, A. Aspect extraction for opinion mining with a deep convolutional neural network. Knowl. Based Syst. 2016, 108, 42–49. [Google Scholar] [CrossRef]
  63. Vaswani, A.; Shazeer, N.; Parmar, N.; Uszkoreit, J.; Jones, L.; Gomez, A.N.; Kaiser, Ł; Polosukhin, I. Attention is all you need. In Proceedings of the 31st International Conference on Neural Information Processing Systems, Long Beach, CA, USA, 4–9 December 2017. [Google Scholar]
  64. Devlin, J.; Chang, M.W.; Lee, K.; Toutanova, K. Bert: Pre-training of deep bidirectional transformers for language understanding. arXiv 2018, arXiv:1810.04805. [Google Scholar]
  65. Sanh, V.; Debut, L.; Chaumond, J.; Wolf, T. DistilBERT, a distilled version of BERT: Smaller, faster, cheaper and lighter. arXiv 2019, arXiv:1910.01108. [Google Scholar]
  66. Yang, Z.; Dai, Z.; Yang, Y.; Carbonell, J.; Salakhutdinov, R.R.; Le, Q.V. Xlnet: Generalized autoregressive pretraining for language understanding. arXiv 2019, arXiv:1906.08237. [Google Scholar]
  67. Wolf, T.; Debut, L.; Sanh, V.; Chaumond, J.; Delangue, C.; Moi, A.; Cistac, P.; Rault, T.; Louf, R.; Funtowicz, M.; et al. HuggingFace’s Transformers: State-of-the-art Natural Language Processing. arXiv 2019, arXiv:1910.03771. [Google Scholar]
  68. Kingma, D.P.; Ba, J. Adam: A method for stochastic optimization. arXiv 2014, arXiv:1412.6980. [Google Scholar]
  69. Yi, H. Green businesses in a clean energy economy: Analyzing drivers of green business growth in US states. Energy 2014, 68, 922–929. [Google Scholar] [CrossRef]
  70. Herche, W. Solar energy strategies in the US utility market. Renew. Sustain. Energy Rev. 2017, 77, 590–595. [Google Scholar] [CrossRef]
  71. Kim, S.Y. Institutional arrangements and airport solar PV. Energy Policy 2020, 143, 111536. [Google Scholar] [CrossRef]
  72. Kim, J.E.; Tang, T. Preventing early lock-in with technology-specific policy designs: The Renewable Portfolio Standards and diversity in renewable energy technologies. Renew. Sustain. Energy Rev. 2020, 123, 109738. [Google Scholar] [CrossRef]
  73. Yin, H.; Powers, N. Do state renewable portfolio standards promote in-state renewable generation? Energy Policy 2010, 38, 1140–1149. [Google Scholar] [CrossRef]
  74. Proudlove, A.; Lips, B.; Sarkisian, D. The 50 States of Solar: 2019 Policy Review and Q4 2019 Quarterly Report; The North Carolina Clean Energy Center: Raleigh, NC, USA, 2020. [Google Scholar]
  75. NC Clean Energy Technology Center. Database of State Incentives for Renewables & Efficiency. 2019. Available online: https://www.dsireusa.org (accessed on 5 April 2012).
  76. The Solar Foundation. National Solar Jobs Census 2019. 2020. Available online: https://www.SolarJobsCensus.org (accessed on 15 April 2012).
  77. NREL. The National Solar Radiation Database: Solar Irradiance Data. The National Renewable Energy Laboratory. 2019. Available online: https://maps.nrel.gov/nsrdb-viewer (accessed on 20 September 2020).
  78. Center P.R. U.S. Public Views on Climate and Energy. 2019. Available online: https://www.pewresearch.org/science/2019/11/25/u-s-public-views-on-climate-and-energy (accessed on 17 April 2020).
  79. Gustafson, A.; Goldberg, M.H.; Kotcher, J.E.; Rosenthal, S.A.; Maibach, E.W.; Ballew, M.T.; Leiserowitz, A. Republicans and Democrats differ in why they support renewable energy. Energy Policy 2020, 141, 111448. [Google Scholar] [CrossRef]
  80. MIT Election Data and Science Lab U.S. President 1976–2020 2019. Available online: https://dataverse.harvard.edu/dataset.xhtml?persistentId=doi:10.7910/DVN/42MVDX (accessed on 10 February 2021). [CrossRef]
  81. Mueller, A. Wordcloud 1.8.1. 2020. Available online: https://pypi.org/project/wordcloud (accessed on 7 February 2021).
  82. Wojcik, S.; Hughes, A. Sizing Up Twitter Users; The PEW Research Center: Washington, DC, USA, 2019. [Google Scholar]
  83. Potamias, R.A.; Siolas, G.; Stafylopatis, A.G. A Transformer-based approach to Irony and Sarcasm detection. arXiv 2019, arXiv:1911.10401. [Google Scholar] [CrossRef]
  84. Gaonkar, R.; Kwon, H.; Bastan, M.; Balasubramanian, N.; Chambers, N. Modeling Label Semantics for Predicting Emotional Reactions. arXiv 2020, arXiv:2006.05489. [Google Scholar]
  85. Azzouza, N.; Akli-Astouati, K.; Ibrahim, R. Twitterbert: Framework for twitter sentiment analysis based on pre-trained language model representations. In International Conference of Reliable Information and Communication Technology; Springer: Berlin/Heidelberg, Germany, 2019; pp. 428–437. [Google Scholar]
Figure 1. Graphic representation of our model based on Robustly optimized Bidirectional Encoder Representations from Transformers (RoBERTa). The input embeddings are denoted as E, and the final hidden vector is denoted as T. Every input example starts with CLS, a special token. C is the final hidden vector of the special CLS token. Trm is Transformer. Adapted from Devlin et al. [64].
Sustainability 13 02673 g001
Figure 2. The most frequently appearing words in each sentiment category.
Sustainability 13 02673 g002
Figure 3. Spatial patterns in sentiment toward solar energy across the United States.
Sustainability 13 02673 g003
Figure 4. Average sentiment score in each state (n = 266,686; U.S. average sentiment score = 1.778; error bars indicate 95% confidence intervals).
Sustainability 13 02673 g004
Figure 5. Trend of public sentiment toward solar energy from 12 January 2020 to 31 December 2020.
Sustainability 13 02673 g005
Table 1. Sample Tweets for Three Classes.
TweetsSentiment
Solar energy has never been easier and more affordable to install.
Oil is the way of the past.
Clean solar panels have been shown to double their electrical output.
A Solar is where you have to invest.Positive
The only true path to energy independence. Combined with large
scale energy storage energy will be cheaper and more reliable.
Saving money with solar is at your fingertips! Give us a call today
and see how much you could be saving.
The U.S. solar industry adds 5600 jobs in 2019 and now employeesNeutral
over 250,000 workers.
Solar Energy Data for March 2—Current weather Wind: 1.8 mph
Gust: 2.2 mph Energy Produced: 1221 watts
I’ve seen gopher tortoises and red-shouldered hawks rendered
bereft of habitat because of solar panel farms.
Tax credits for solar and wind energy are some of the unrelated
demands, and the bill should NOT be passed with anything related toNegative
solar power or Green New Deal.
Solar is expensive to maintain and return is not what everyone
is shouting about. A big battery was required to stabilize the grid due to unreliable solar power.
Table 2. Descriptive statistics.
VariablesObsMeanSDMinMax(1)(2)(3)(4)(5)(6)(7)(8)(9)
(1) Avg. sentiment score510.9961.64−3.173.801
(2) % Solar generation511.752.910.0014.10.231
(3) RPS511.571.83090.420.101
(4) Net metering5162.09090.470.180.121
(5) Renewable incentives5168.9641.39132170.260.320.160.091
(6) Solar market maturity510.730.70020.510.670.240.180.231
(7) Electricity price5113.874.4410330.380.170.260.170.020.341
(8) Solar radiation514.330.5936−0.200.34−0.14−0.130.030.18−0.111
(9) Median income (log)5111.260.1610.111.60.620.160.490.320.250.460.53−0.371
(10) % Democratic vote510.490.120.260.920.670.380.510.360.380.600.48−0.040.68
Table 3. Explaining public sentiment toward solar energy.
Variables(1)(2)(3)(4)(5)(6)(7)(8)(9)(10)
(1) % Solar0.131 * −0.088
generation(0.068) (0.067)
(2) RPS 0.374 *** 0.092
(0.121) (0.075)
(3) Net metering 0.367 *** 0.211 **
(0.080) (0.079)
(4) Renewable 0.010 ** 0.003
incentives (0.005) (0.004)
(5) Solar market 1.209 *** 0.795 *
maturity (0.268) (0.445)
(6) Electricity 0.141 *** 0.011
price (0.048) (0.042)
(7) Solar −0.572 −0.329
radiation (0.409) (0.329)
(8) Median 6.263 *** 0.899
income (log) (1.235) (1.924)
(9) % Democratic 9.158 ***3.729
vote (1.390)(2.832)
Number of states51515151515151515151
R 2 0.0550.1730.2180.0700.2630.1460.0420.3790.4480.596
*** p < 0.01 , ** p < 0.05 , * p < 0.1 . Robust standard errors are in parentheses.
Publisher’s Note: MDPI stays neutral with regard to jurisdictional claims in published maps and institutional affiliations.

