
Developing an Indicator-Based Framework to Measure Sustainable Tourism in Romania. A Territorial Approach

 , ,
, ,  ,
,  and
and
Abstract
:1. Introduction
2. The National Strategic Actions for the Tourism Sector in Romania
3. Data and Methodology
4. Results
5. Discussions
6. Conclusions
Author Contributions
Funding
Institutional Review Board Statement
Informed Consent Statement
Data Availability Statement
Acknowledgments
Conflicts of Interest
References
- UNWTO (United Nations World Tourism Organization). International Tourism Growth Continues to Outpace the Global Economy. 2020. Available online: https://www.unwto.org/international-tourism-growth-continues-to-outpace-the-economy (accessed on 11 November 2020).
- Gossling, S.; Scott, D.; Hall, C.M. Pandemics, tourism and global change: A rapid assessment of COVID-19. J. Sustain. Tour. 2020. [Google Scholar] [CrossRef]
- Rasoolimanesh, S.M.; Ramakrishna, S.; Hall, C.M.; Esfandiar, K.; Seyfi, S. A systematic scoping review of sustainable tourism indicators in relation to the sustainable development goals. J. Sustain. Tour. 2020, 1–21. [Google Scholar] [CrossRef]
- Alfaro Navarro, J.L.; Andrés Martínez, M.E.; Mondéjar Jiménez, J.A. An approach to measuring sustainable tourism at the local level in Europe. Curr. Issues Tour. 2020, 23, 423–437. [Google Scholar] [CrossRef]
- Streimikiene, D.; Svagzdiene, B.; Jasinskas, E.; Simanavicius, A. Sustainable tourism development and competitiveness: The systematic literature review. Sustain. Dev. 2020, 29, 259–271. [Google Scholar] [CrossRef]
- Haller, A.P.; Butnaru, G.I.; Hârșan, G.D.T.; Ştefănică, M. The relationship between tourism and economic growth in the EU-28. Is there a tendency towards convergence? Econ. Res. Ekon. Istraživanja. 2020, 1–25. [Google Scholar] [CrossRef]
- UNWTO (United Nations World Tourism Organization). Measuring Sustainable Tourism: A Call for Action, Report of the 6th International Conference on Tourism Statistics, Manila. 2017. Available online: https://www.e-unwto.org/doi/pdf/10.18111/9789284418954 (accessed on 16 November 2020).
- UNWTO (United Nations World Tourism Organization). UN Standards for Measuring Tourism. 2020. Available online: https://www.unwto.org/standards/un-standards-for-measuring-tourism (accessed on 5 October 2020).
- Guerreiro, S.; Seguro, P. Sustainable Tourism Indicators. Monitoring Sustainability Performance in the Portuguese Tourism Industry. 2018. Available online: http://15th-tourism-stats-forum.com/pdf/Papers/S2/2_2_Sustainable_tourism_indicators_monitoring_of_sustainability_performance_in_the_tourism_industry_in_Portugal.pdf (accessed on 5 October 2020).
- EUROSTAT. Tourism Statistics/ro. 2020. Available online: https://ec.europa.eu/eurostat/statistics-explained/pdfscache/15707.pdf (accessed on 11 November 2020).
- Smith, V.L.; Eadington, W.R. Tourism Alternatives; University of Pennsylvania Press: Philadelphia, PA, USA, 1992. [Google Scholar]
- Butler, R.W. Sustainable tourism: A state-of-the-art review. Tour. Geogr. 1999, 1, 7–25. [Google Scholar] [CrossRef] [Green Version]
- Craik, J. The cultural limits of tourism in pacific rim countries. In Proceedings of the International Conference on Sustainable Tourism in Islands and Small States, Valletta, Malta, 6 November 1993. [Google Scholar]
- Nelson, J.G.; Butler, R.W.; Wall, G. (Eds.) Tourism and Sustainable Development: Monitoring, Planning, Managing; University of Waterloo: Waterloo, ON, Canada, 1993. [Google Scholar]
- Craik, J. Are there cultural limits to tourism? J. Sustain. Tour. 1995, 3, 87–98. [Google Scholar] [CrossRef]
- Bramwell, B.; Henry, I.; Jackson, G.; van der Straaten, J. A framework for understanding sustainable Tour. Manag. In Sustainable Tourism Management: Principles and Practice; Bramwell, W., Henry, I., Jackson, G., Prat, A.G., Richards, G., van der Straaten, J., Eds.; Tilburg University Press: Tilburg, The Netherlands, 1996; pp. 23–72. [Google Scholar]
- Briguglio, L.; Archer, B.; Jafari, J.; Wall, G. (Eds.) Sustainable Tourism in Islands and Small States: Issues and Policies; Cassell: London, UK, 1996; Volume 1. [Google Scholar]
- Briguglio, L.; Butler, R.; Harrison, D.; Filho, W. (Eds.) Sustainable Tourism in Islands and Small States: Case Studies; Cassell: London, UK, 1996; Volume 2. [Google Scholar]
- Squire, S. Literary tourism and sustainable tourism? Promoting ‘Anne of Green Gables’ in Prince Edward Island. J. Sustain. Tour. 1996, 4, 119–134. [Google Scholar] [CrossRef]
- Murphy, P. Tourism as a community industry. Tour. Manag. 1983, 4, 180–193. [Google Scholar] [CrossRef]
- Murphy, P. Tourism: A Community Approach; Routledge: London, UK, 1985. [Google Scholar]
- Murphy, P. Community driventourismplanning. Tour. Manag. 1988, 9, 96–104. [Google Scholar] [CrossRef]
- Haywood, M. Responsible and responsive tourism planning in the community. Tour. Manag. 1988, 9, 105–118. [Google Scholar] [CrossRef]
- European Commission. European Tourism Indicators System for Sustainable Destination Management. 2016. Available online: https://ec.europa.eu/growth/sectors/tourism/offer/sustainable/indicators_en (accessed on 10 November 2020).
- Manning, E.W. Indicators for the Sustainable Management of Tourism. International Working Group on Indicators of Sustainable Tourism to the Environmental Committee; World Tourism Organization: Madrid, Spain, 1993. [Google Scholar]
- Ludwig, D.; Hilborn, R.; Walters, C. Uncertainty, resource exploitation, and conservation: Lessons from history. Science 1993, 269, 17–36. [Google Scholar] [CrossRef]
- Sharpley, R. Tourism and sustainable development: Exploring the theoretical divide. J. Sustain. Tour. 2000, 8, 1–19. [Google Scholar] [CrossRef]
- Ilieş, A.; Ilieş, D.C.; Tătar, C.; Ilieş, M. Geography of tourism in Romania. In The Geography of Tourism of Central and Eastern European Countries; Springer: Cham, Switzerland, 2017; pp. 329–374. [Google Scholar]
- Ilieş, A.; Wendt, J.; Ilieş, D.; Josan, I.; Herman, G. The Romanian rural architectural heritage from Maramureş Land—Personality, distinctiveness and protection. In Studia Universitatis Babeş-Bolyai, Geographia, No 2; Cluj University Press: Cluj-Napoca, Romania, 2011; pp. 187–196. [Google Scholar]
- Cocean, P. The Land—A typical Geographical Region of Romania. In Revue Roumaine de Geographie, T. 41; Editura Academiei: Bucureşti, Romania, 1997. [Google Scholar]
- Ilieş, M.; Ilieş, A.; Ilieş, G. Tipologia „ţărilor” de pe teritoriul României. In Analele Universităţii din Oradea; Geografie, Editura Universităţii din Oradea: Oradea, Romania, 1998. [Google Scholar]
- Cocean, P.; Ciangă, N. The “Lands” of Romania as Mental Spaces. In Revue Roumaine de Geographie, T. 43–44; Editura Academiei: Bucureşti, Romania, 2000; pp. 199–205. [Google Scholar]
- Cocean, P. “Ţările”. Regiuni Geografice şi Spaţii Mentale; Presa Universitară Clujeană: Cluj-Napoca, Romania, 2011. [Google Scholar]
- Briciu, A.; Briciu, V.A.; Kavoura, A. Evaluating How ‘Smart’Brașov, Romania Can Be Virtually via a Mobile Application for Cultural Tourism. Sustainability 2020, 12, 5324. [Google Scholar] [CrossRef]
- Rădoi, I. European Capital of Culture, Urban Tourism and Cross-Border Cooperation between Romania and Serbia. J. Balk. Near East. Stud. 2020, 22, 547–559. [Google Scholar] [CrossRef]
- Postelnicu, C.; Dabija, D.C. Romanian tourism: Past, present and future in the context of globalization. Ecoforum 2020, 7, 1–13. [Google Scholar]
- Lupu, C.; Padhi, S.S.; Pati, R.K.; Stoleriu, O.M. Tourist choice of heritage sites in Romania: A conjoint choice model of site attributes and variety seeking behavior. J. Herit. Tour. 2020, 16, 1–23. [Google Scholar] [CrossRef]
- Catudan, J.M.J. The Impact of Tourist Arrivals, Physical Infrastructures, and Employment, on Regional Output Growth. Procedia Soc. Behav. Sci. 2016, 219, 175–184. [Google Scholar] [CrossRef] [Green Version]
- Herman, G.V.; Ilieș, D.C.; Dehoorne, O.; Ilieș, A.; Sambou, A.; Caciora, T. Emitter and tourist destination in Romania. Balt. J. Health Phys. Act. 2020, 12, 120–138. [Google Scholar]
- Lequeux-Dincă, A.I.; Preda, M.; Taloş, A.M. Empirical Evidences on Foreign Tourist Demand Perception of Bucharest. Almatourism J. Tour. Cult. Territ. Dev. 2018, 9, 95–116. [Google Scholar] [CrossRef]
- Rusu, R.; Bodocan, V.; Man, T. Urban Sprawl and Its Impact on Urban Tourism in Romania. J. Balk. Near East. Stud. 2020, 22, 521–533. [Google Scholar] [CrossRef]
- Ibănescu, B.C.; Stoleriu, O.M.; Munteanu, A.; Iațu, C. The impact of tourism on sustainable development of rural areas: Evidence from Romania. Sustainability 2018, 10, 3529. [Google Scholar] [CrossRef] [Green Version]
- Iațu, C.; Ibănescu, B.C.; Stoleriu, O.M.; Munteanu, A. The WHS designation—A factor of sustainable tourism growth for Romanian rural areas? Sustainability 2018, 10, 626. [Google Scholar] [CrossRef] [Green Version]
- Cretu, R.C. Analysis of the ecotourist profile In Romania, Hungary and Bulgaria. In Proceedings of the 33rd International Scientific Conference on Economic and Social Development–“Managerial Issues in Modern Business”, Warsaw, Poland, 26–27 September 2018; pp. 404–413. [Google Scholar]
- Nistoreanu, P.; Aluculesei, A.C.; Avram, D. Is Green Marketing a Label for Ecotourism? The Romanian Experience. Information 2020, 11, 389. [Google Scholar] [CrossRef]
- Pascariu, G.C.; Ţigănaşu, R. Tourism and sustainable regional development in Romania and France: An approach from the perspective of new Economic Geography. Contemp. Approaches Chall. Tour. Sustain. 2014, XVI, 1089–1109. [Google Scholar]
- Mazilu, M.; Rabonțu, C.; Marinescu, R. New Products and Strategies for Sustainable Tourism in Romania. J. Tour. Hosp. 2017, 6. [Google Scholar] [CrossRef]
- Mazilu, M. Sustainable tourism of destination, imperative triangle among: Competitiveness, effective management and proper financing. In Sustainable Development—Policy and Urban Development—Tourism, Life Science, Management and Environment Edition; InTechOpen Access Publisher: London, UK, 2012. [Google Scholar]
- Kester, J. Measuring Sustainable Tourism and the SDGS. 2017. Available online: https://unstats.un.org/sdgs/files/meetings/iaeg-sdgs-meeting-06/5.%20UNWTO%20Tourism%20Indicators.pdf (accessed on 15 September 2020).
- Zhang, H.Q.; Fan, D.X.F.; Tse, T.S.M.; King, B. Creating a scale for assessing socially sustainable tourism. J. Sustain. Tour. 2017, 25, 61–78. [Google Scholar] [CrossRef] [Green Version]
- Ministry of Economy, Energy and the Business Environment. Master Plan for the Development of National Tourism 2007–2026. 2007. Available online: https://www.infotravelromania.ro/master_plan_turism/master_plan.pdf (accessed on 15 September 2020).
- Ministry of Economy, Energy and the Business Environment. The National Strategy for the Development of Ecotourism in Romania, 2016–2020. 2015. Available online: http://www.mmediu.ro/app/webroot/uploads/files/2016-06-08_Strategia_nationala_de_dezvoltare_a_ecoturismului_in_Romania_2016%20-%202020.pdf (accessed on 15 September 2020).
- National Institute of Statistics. Population and Housing Census. 2011. Available online: www.insse.ro (accessed on 1 September 2020).
- National Institute of Statistics. Baze de Date Statistice. 2019. Available online: http://statistici.insse.ro:8077/tempo-online/#/pages/tables/insse-table (accessed on 1 September 2020).
- EUROSTAT. Feasibility Study on the Use of Mobile Positioning Data for Tourism Statistics. Consolidated Report Eurostat. 2014. Available online: https://ec.europa.eu/eurostat/documents/747990/6225717/MP-Consolidated-report.pdf/530307ec-0684-4052-87dd-0c02b0b63b73 (accessed on 15 September 2020).
- EUROSTAT. Tourism Statistics. Available online: https://ec.europa.eu/eurostat/statistics-explained/index.php/Tourism_statistic (accessed on 1 September 2020).
- World Bank. Tourism for Development. 2019. Available online: http://documents1.worldbank.org/curated/en/240451562621614728/pdf/Tourism-Diagnostic-Toolkit.pdf (accessed on 1 September 2020).
- Mitchell, G. Problems and fundamentals of sustainable development indicators. Sustain. Dev. 1996, 4, 1–11. [Google Scholar] [CrossRef]
- Bossell, H. Indicators for Sustainable Development: Theory, Method and Application; International Institute for Sustainable Development: Winnipeg, MB, Canada, 1999; p. 138. [Google Scholar]
- Bell, S.; Morse, S. Measuring Sustainability: Learning from Doing; Earthscan Publications: London, UK, 2003; p. 206. [Google Scholar]
- Choi, H.C.; Sirakaya, E. Sustainability indicators for managing community tourism. Tour. Manag. 2006, 27, 1274–1289. [Google Scholar] [CrossRef]
- Lu, J.; Nepal, S.K. Sustainable tourism research: An analysis of papers published in the Journal of Sustainable Tourism. J. Sustain. Tour. 2009, 17, 5–16. [Google Scholar] [CrossRef]
- Pulselli, F.M.; Ciampalini, F.; Tiezzi, E.; Zappia, C. The index of sustainable economic welfare (ISEW) for a local authority: A case study in Italy. Ecol. Econ. 2006, 60, 271–281. [Google Scholar] [CrossRef] [Green Version]
- Penny, Y.; Li, X. Sustainability of Tourism Development in Macao, China. Int. J. Tour. Res. 2013, 15, 52–65. [Google Scholar] [CrossRef]
- Pérez, V.E.; Santoyo, A.H.; Guerrero, F.; León, M.A.; da Silva, C.L.; Caballero, R. Measuring the sustainability of Cuban tourism destinations considering stakeholders’ perceptions. Int. J. Tour. Res. 2017. [Google Scholar] [CrossRef]
- Singh, R.K.; Murty, H.R.; Gupta, S.K.; Dikshit, A.K. An overview of sustainability assessment methodologies. Ecol. Indic. 2009, 9, 189–212. [Google Scholar] [CrossRef]
- United Nations Commission on Sustainable Development (UNCSD). Indicators of Sustainable Development: Guidelines and Methodologies; United Nations Commission on Sustainable Development (UNCSD): New York, NY, USA, 2001. [Google Scholar]
- Organization for Economic Cooperation and Development (OECD). Sustainable Development. Overview of Sustainable Development Indicators Used by National and International Agencies, SG/SD 5; Organization for Economic Cooperation and Development (OECD): Paris, France, 2002. [Google Scholar]
- Organization for Economic Cooperation and Development (OECD). Environmental Performance Reviews; Organization for Economic Cooperation and Development (OECD): Paris, France, 2005. [Google Scholar]
- Organization for Economic Cooperation and Development (OECD). Handbook on Constructing Composite Indicators. Methodology and User Guide; Organization for Economic Cooperation and Development (OECD): Paris, France, 2008. [Google Scholar]
- Van Woerden, J.; Singh, A.; Demkine, V. Core Set of UNEP GEO Indicators Among Global Environmental Indices, Indicators, and Data. Sustain. Indic. Sci. Assess. 2007, 67, 343. [Google Scholar]
- UNWTO (United Nations World Tourism Organization). Indicators of Sustainable Development for Tourism Destinations. A Guidebook; World Tourism Organization: Madrid, Spain, 2004. [Google Scholar]
- Fernández, J.I.P.; Rivero, M.S. Measuring tourism sustainability: Proposal for a composite index. Tour. Econ. 2009, 15, 277–296. [Google Scholar] [CrossRef] [Green Version]
- Yunis, E. ‘El marco internacional de la gestión sostenible del turismo: La visión de la Organización Mundial del Turismo’, A Distancia, Monográfico. Tur. Sostenibilidad. 2003, 21, 16–21. [Google Scholar]
- Roberts, S.; Tribe, J. Sustainability indicators for small tourism enterprises—An exploratory perspective. J. Sustain. Tour. 2008, 16, 575–594. [Google Scholar] [CrossRef]
- Tanguay, G.A.; Rajaonson, J.; Therrien, M.-C. Sustainable tourism indicators: Selection criteria for policy implementation and scientific recognition. J. Sustain. Tour. 2013, 21, 862–879. [Google Scholar] [CrossRef] [Green Version]
- Blancas, F.J.; Lozano-Oyola, M.; González, M. A European Sustainable Tourism Labels proposal using a composite indicator. Environ. Impact Assess. Rev. 2015, 54, 39–54. [Google Scholar] [CrossRef]
- Céron, J.P.; Dubois, G. Les indicateurs du tourisme durable. Un outil à manier avec discernement. Cahiers Espaces. 2000, 67, 30–46. [Google Scholar]
- Mayer, A.L. Strengths and weaknesses of common sustainability indices for multidimensional systems. Environ. Int. 2008, 34, 277–291. [Google Scholar] [CrossRef]
- Ecological Indicators. 2012. Available online: https://www.sciencedirect.com/journal/ecological-indicators (accessed on 1 September 2020).
- Salvati, L.; Carlucci, M. A composite index of sustainable development at the local scale: Italy as a case study. Ecol. Indic. 2014, 43, 162–171. [Google Scholar] [CrossRef]
- Schuschny, A.; Soto, H. Guía Metodológica. Diseño de Indicadores Compuestos de Desarrollo Sostenible; Naciones Unidas: Santiago, Chile, 2009. [Google Scholar]
- Castro, J.M. Indicadores de Desarrollo Sostenible Urbano. Una Aplicacion para Andalucıa [Indicators of Urban Sustainable Development. An Application for Andalucıa]; Instituto de Estadıstica de Andalucıa: Sevilla, Spain, 2005. [Google Scholar]
- Torres-Delgado, A.; Saarinen, J. Using indicators to assess sustainable tourism development: A review. Tour. Geogr. 2014, 16, 31–47. [Google Scholar] [CrossRef]
- Sharpe, A. (Ed.) Literature review of frameworks for macro-indicators. Ottawa: Centre for the Study of Living Standards. 2004. Available online: http://www.csls.ca/reports/LitRevMacroindicators.pdf (accessed on 3 December 2020).
- Blancas, F.J.; Lozano-Oyola, M.; González, M.; Caballero, R. A dynamic sustainable tourism evaluation using multiple benchmarks. J. Clean. Prod. 2018, 174, 1190–1203. [Google Scholar] [CrossRef]
- Caramani, D. The Measurement of Territorial Homogeneity: A Test on Comparative Electoral Data since 1832; RSC No. 2002/26; MZES Universität Mannheim: Mannheim, Germany, 2002. [Google Scholar]
- Victora, C.G.; Black, R.E.; Boerma, J.T.; Bryce, J. Measuring impact in the Millennium Development Goal era and beyond: A new approach to large-scale effectiveness evaluations. Lancet 2011, 377, 85–95. [Google Scholar] [CrossRef]
- Michalek, J.; Zarnekow, N. Application of the rural development index to analysis of rural regions in Poland and Slovakia. Soc. Indic. Res. 2012, 105, 1–37. [Google Scholar] [CrossRef]
- European Commission. European Tourism Indicator System Toolkit for Sustainable Destinations; European Union: Brussels, Belgium, 2013. [Google Scholar]
- Ianoş, I. Determinarea similarităţii dintre mărimile geografice. Lucr. Semin. Geogr. Dimitrie Cantemir 1981, 1, 24–30. [Google Scholar]
- Mitrică, B.; Mocanu, I.; Dumitraşcu, M.; Grigorescu, I. Socio-Economic Disparities in the Development of the Romania’s Border Areas. Soc. Indic. Res. 2017, 134, 899–916. [Google Scholar] [CrossRef]
- Mitrică, B.; Şerban, P.; Mocanu, I.; Grigorescu, I.; Damian, N.; Dumitraşcu, M. Social development and regional disparities in the rural areas of Romania. Focus on the social disadvantaged areas. Soc. Indic. Res. 2020, 152, 67–89. [Google Scholar] [CrossRef]
- Abdi, H.; Williams, L.J. Principal Component Analysis Wiley Interdisciplinary. Rev. Comput. Stat. 2010, 2, 433–459. [Google Scholar] [CrossRef]
- Cattell, R.B. The scree test for the number of factors. Multivar. Behav. Res. 1966, 1, 245–276. [Google Scholar] [CrossRef] [PubMed]
- Jolliffe, I.T. Principal Component Analysis; Springer: New York, NY, USA, 2002. [Google Scholar]
- Bruynooghe, M. Novel methods for automatic classification of numerous taxonomic data. Stat. Anal. Données. 1977, 2, 24–42. [Google Scholar]
- Benzécri, J.-P. Construction of a Hierarchical Ascendant Classification by searching in chain of reciprocal nearest neighbors. Cah. L’analyse Données. 1982, 7, 209–218. [Google Scholar]
- Şerban, P.R.; Tălângă, C. Is social resilience an economic structure issue or just the ability of communities to cope with external stress? J. Urban Reg. Anal. 2015, 7, 59–68. [Google Scholar]
- Mitrică, B.; Damian, N.; Mocanu, I.; Şerban, P.; Săgeată, R. Technical-urbanistic infrastructure in the Romanian Danube Valley. Urban vs. Rural territorial disparities. Geogr. Pannonica 2016, 20, 242–253. [Google Scholar] [CrossRef] [Green Version]
- Glăvan, V.; Necşuliu, G. Tourism. Potential and Uses. In Romania: Space, Society, Environment; Bălteanu, D., Badea, L., Buza, M., Niculescu, G., Popescu, C., Dumitraşcu, M., Eds.; Academiei Române: Bucureşti, Romania, 2006; pp. 309–322. [Google Scholar]
- OECD. OECD Tourism Trends and Policies 2020. 2020. Available online: https://www.oecd-ilibrary.org/urban-rural-and-regional-development/oecd-tourism-trends-and-policies-2020_721999bd-en (accessed on 12 January 2021).
- EUROSTAT. Tourism Statistics. 2020. Available online: https://ec.europa.eu/eurostat/statistics-explained/index.php/Tourism_statistics#Bed_places_in_the_EU27:_Italy_and_France_predominate (accessed on 21 September 2020).
- Mitrică, B.; Persu, M.; Mocanu, I.; Şerban, P.; Grigorescu, I.; Damian, N. Changes in the Dynamics and Demographic Structure of the Romanian Rural Population: An Overview of the Post-communist Period. In Three Decades of Transformation in the East-Central European Countryside; Jerzy, B., Ed.; Springer: Berlin/Heidelberg, Germany, 2019; pp. 191–215. [Google Scholar] [CrossRef]


| Description (i), Data Sources (ii) and Measurement Unit (iii) | Acronyms | Influence of Indicators on STI | Expression of Influence | |
|---|---|---|---|---|
| 1.Natural tourism resources | (i) Complex index depending on the position on relief units, the presence of special elements of geomorphology, vegetation, fauna or hydrology and the degree of landscape attractiveness.; (ii) Ministry of Public Works, Development and Administration; (iii) unit. | NAT-TOUR-RES | If ↑ NAT-TOUR-RES, then STI ↑ | + |
| 2.Anthropic tourism resources | (i) Complex index depending on the existence of historical monuments of national interest, museums and public collections, folk art and tradition, entertainment institutions, serial cultural events; (ii) Ministry of Public Works, Development and Administration; (iii) unit. | ANTH-TOUR-RES | If ↑ NAT-TOUR-RES, then STI ↑ | + |
| 3. Relative number of accommodations | (i) Number of tourist accommodations per 100 inhabitants; (ii) NIS, TEMPOnline time series; (iii) no./100 inh. | ACCOMM-NO | If ↑ ACCOMM-NO, then STI ↑ | + |
| 4. Tourism intensity | (i) Number of tourists per km2 (ii) NIS, TEMPOnline time series; (iii) tourists/km2 | TOUR-INT | If ↑ TOUR-INT, then STI ↑ | + |
| 5. Tourism employment | (i) share of population employed in tourism out of the economically active population; (ii) NIS, Census; (iii) % | TOUR-EMPL | If ↑ TOUR-EMPL, then STI ↑ | + |
| 6. Yearly accommodation occupancy | (i) Average yearly occupancy rate of the accommodation units; (ii) NIS, TEMPOnline time series; (iii) %. | ACCOMM-OCCUP | If ↑ ACCOMM-OCCUP, then STI ↑ | + |
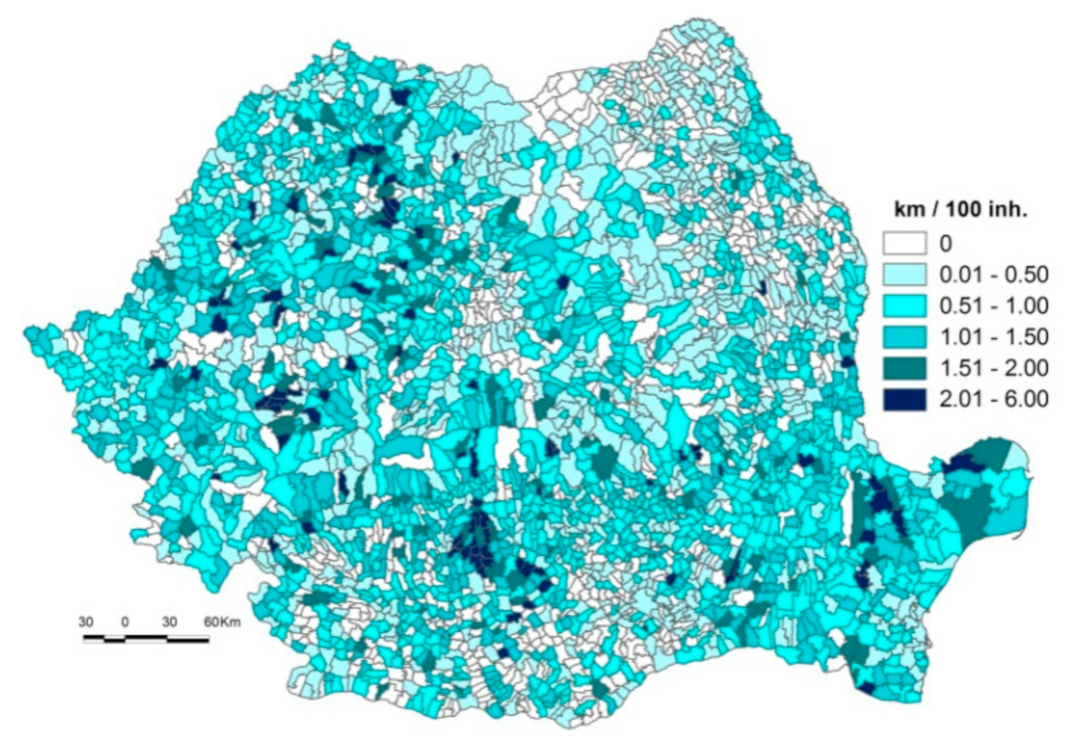
| 7. Drinking water | (i) Total length of drinking water supply network; (ii) NIS, TEMPOnline time series; (iii) km/100 inh. | WATER | If ↑ WATER, then STI ↑ | + |
| 8. Natural gas | (i) Total length of natural gas network (ii) NIS, TEMPOnline time series; (iii) km/100 inh. | NAT_GAS | If ↑ NAT-GAS, then STI ↑ | + |
| 9. Population density | (i) Number of inhabitants per administrative area (ii) NIS, TEMPOnline time series; (iii) inh/km2. | POP-DENS | If ↑ POP-DENS, then STI ↑ | + |
| 10. Population Aging Index | (i) Number of elderly persons (aged 65 and over) per young persons (under 15 years old); ii) NIS, TEMPOnline time series; (iii) unit. | POP-AGING | If ↑ POP-AGING, then STI ↓ | - |
| 11. Road accessibility | (i) The accessibility to the TEN-T core and comprehensiveness (gradient), combined with the accessibility to different non-TEN-T roads (motorway, European, National, County) (ii) Ministry of Public Works, Development and Administration; (iii) unit. | ACCESS | If ↑ ACCESS, then VULN ↑ | + |
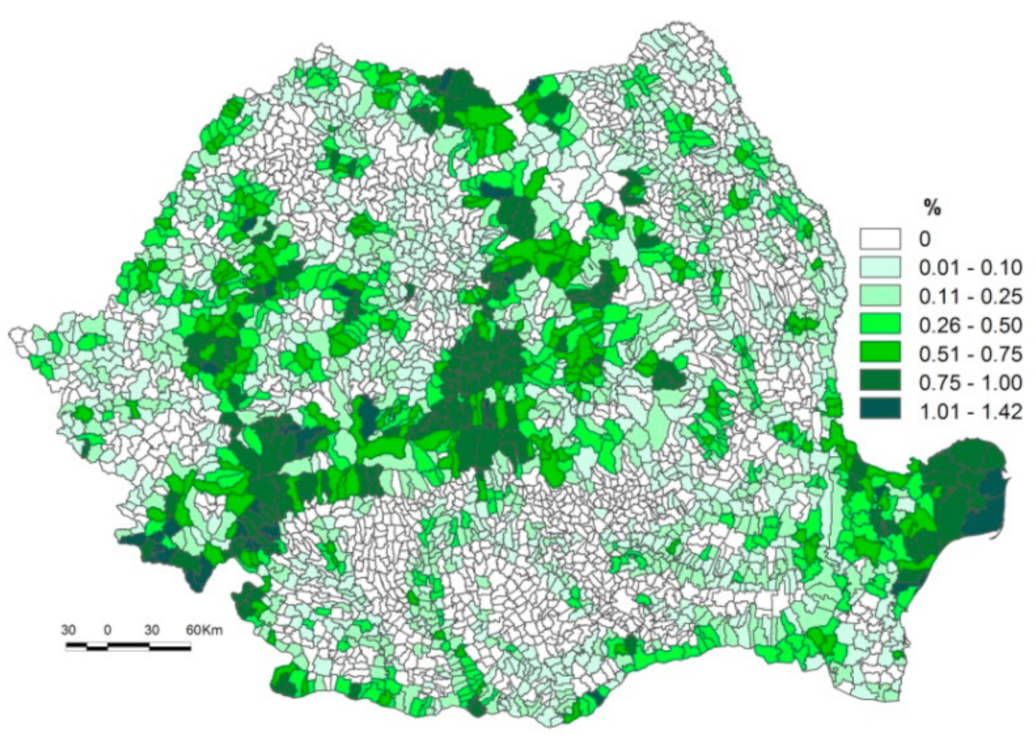
| 12. Protected areas | (i) share of protected areas in relation to administrative areas (ii) NIS, TEMPOnline time series, Ministry of Environment; (iii) % | PROT-AREA | If ↑ PROT-AREA, then STI ↑ | + |
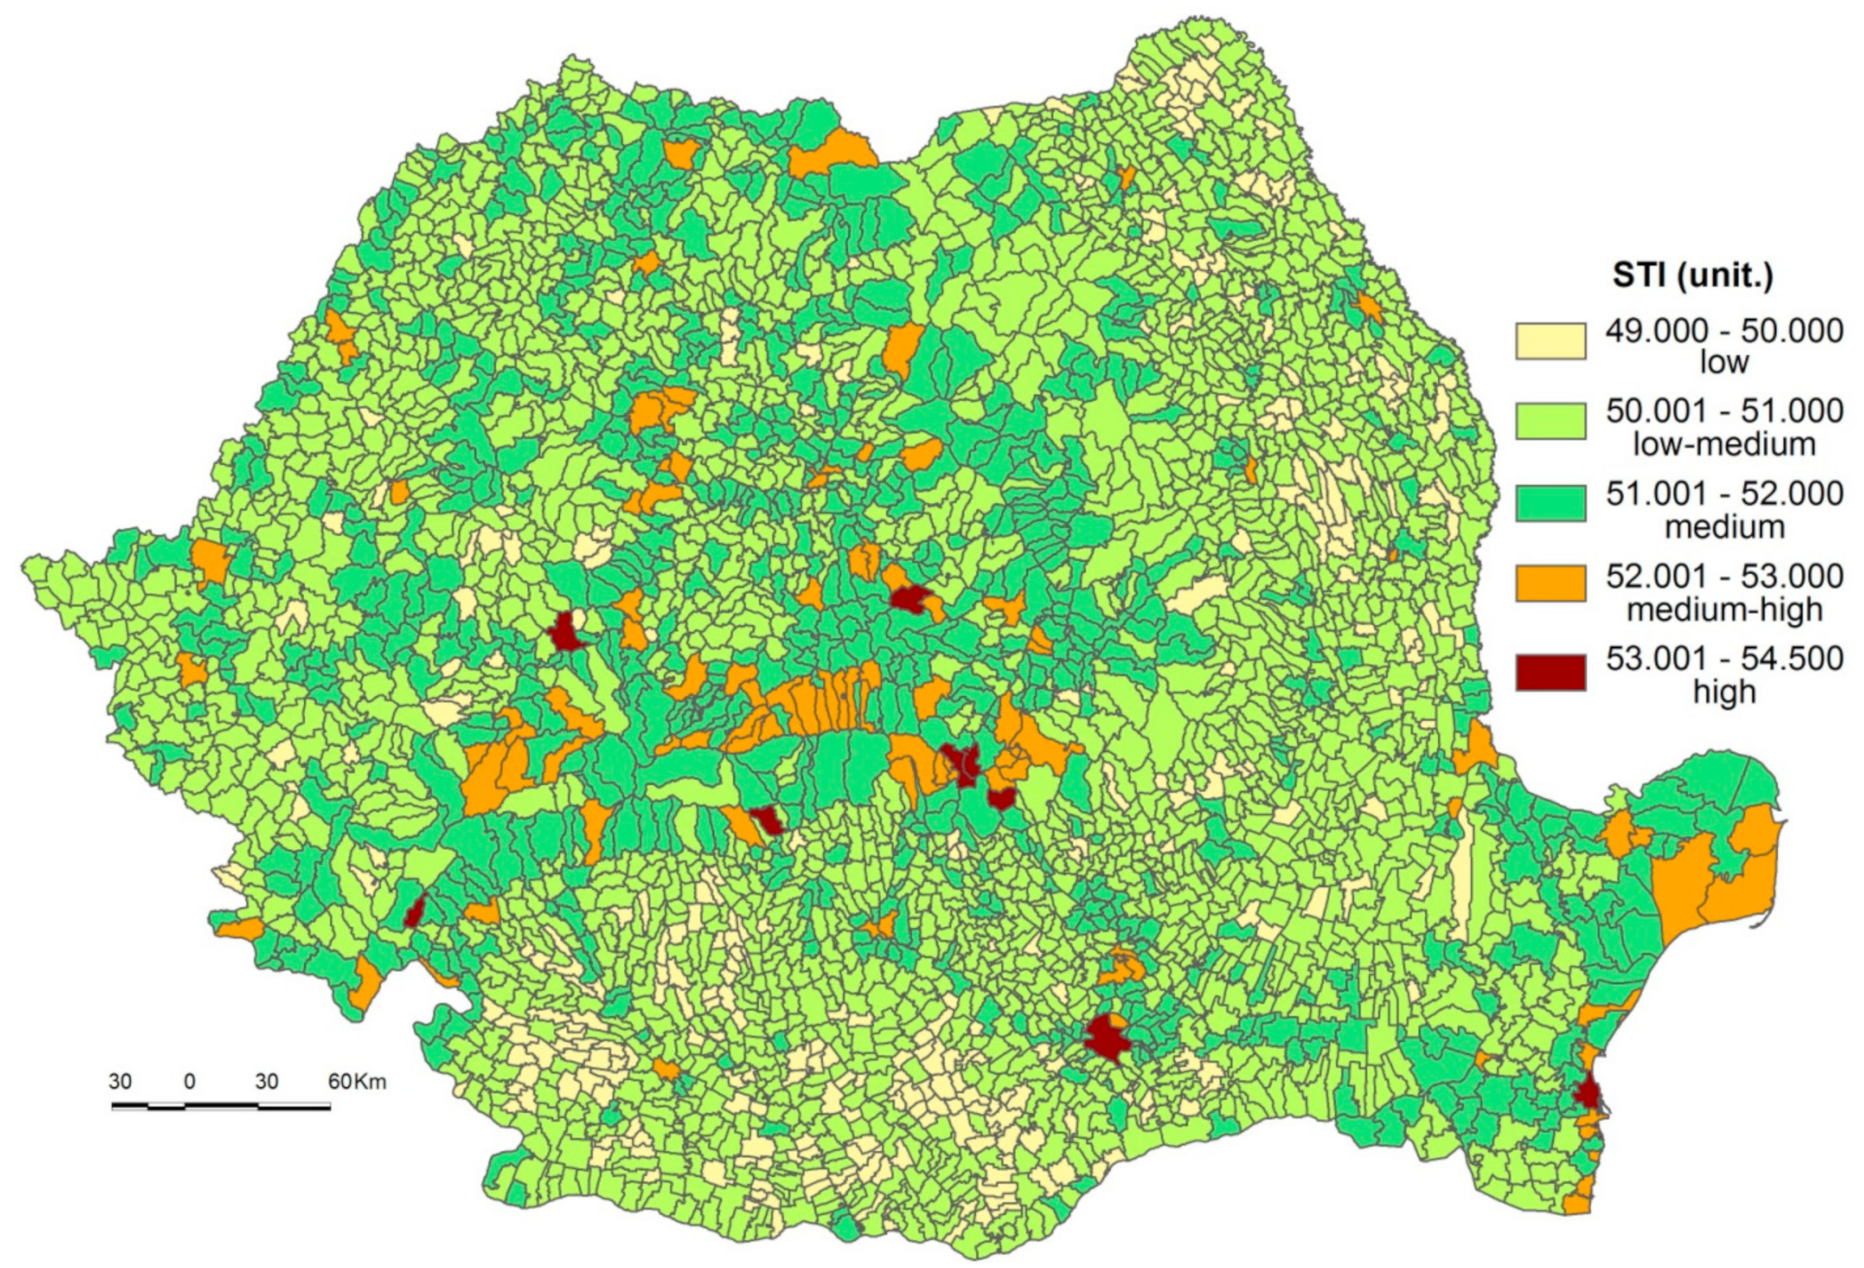
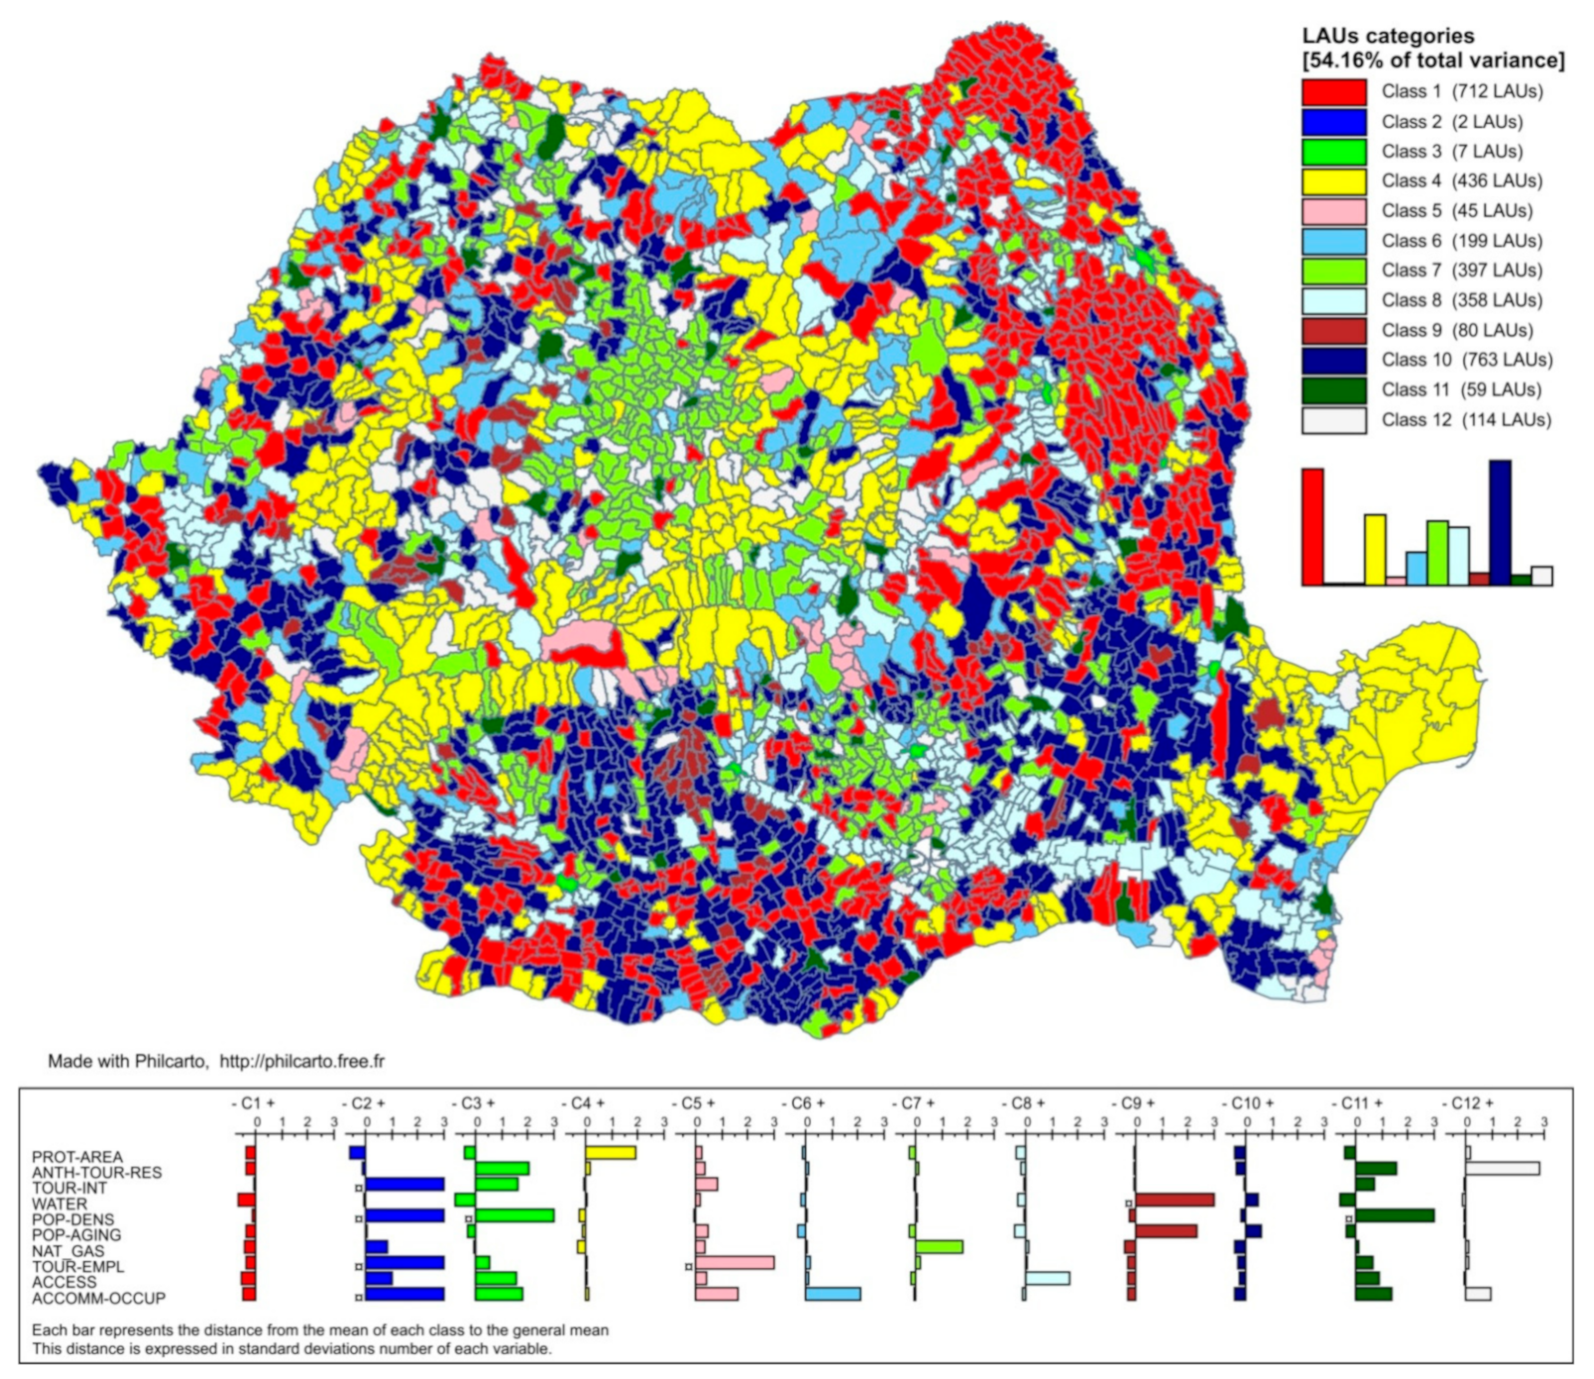
| STI (Units) | STI Degrees | No. of Urban LAU | No. of Rural LAU | Corresponding to the Types of LAUs (HAC Method) |
|---|---|---|---|---|
| 53,001–54,500 | High | 8 | 3 | 1 LAU in each of classes 11 and 12, and 9 LAUs in class 5 |
| 52,001–53,000 | Medium-high | 42 | 51 | Almost half of these LAUs are assigned to class 4, followed by classes 5, 1, 9 and 11 |
| 51,001–52,000 | Medium | 151 | 594 | The majority of these LAUs are included in classes 4 and 8, followed by classes 7, 14 and 10 |
| 50,001–51,000 | Low-medium | 119 | 1,912 | In the north-eastern part of the country, these LAUs are included in class 1; in the south-western and western parts, those from class 10 are predominant; other LAUs are included in classes 6 and 7 |
| 49,000–50,000 | Low | - | 301 | The majority are lying in the south-western, south and north-eastern parts, where they correlate with class 1 in Dolj County and with class 10 in other counties of this part of the country; in the north-east, the LAUs are included in class 1 |
| INDICATORS | National Average | LAUs Below the Average, No. (%) |
|---|---|---|
| ANTH-TOUR-RES | 5.05 | 1881 (59.1%) |
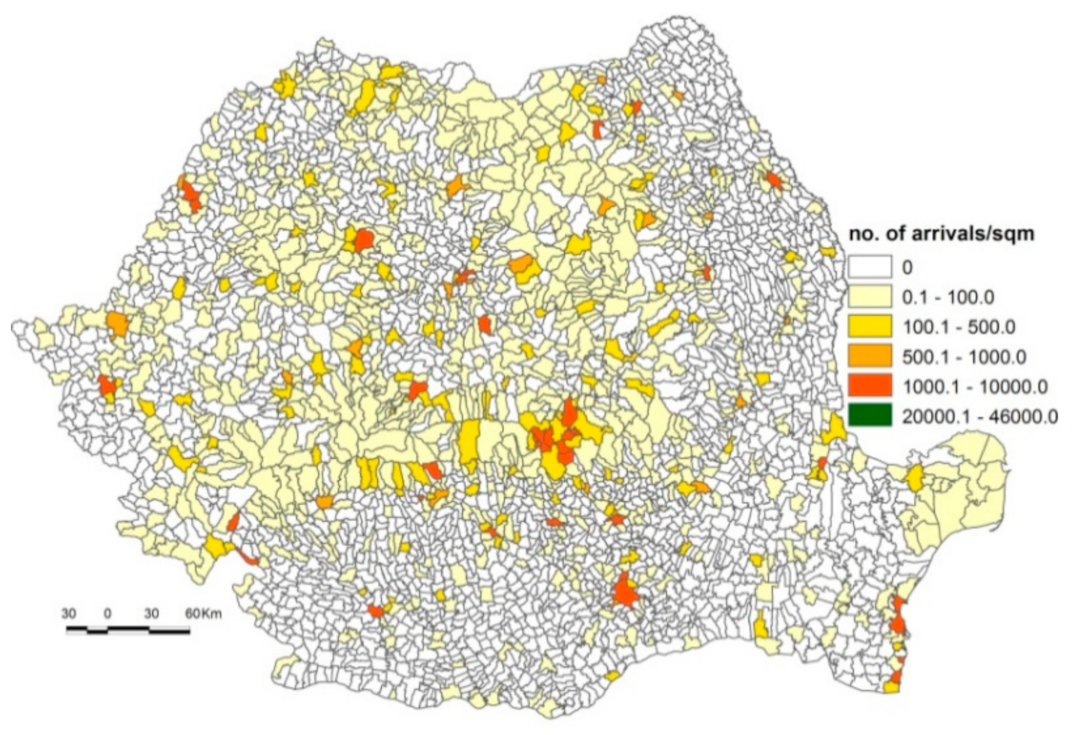
| TOUR-INT | 55.4 tourists/km2 | 2904 (91.3%) |
| TOUR-EMPL | 1.92% | 2635 (82.8%) |
| ACCOMM-OCCUP | 38.98% | 3072 (96.6%) |
| WATER | 0.38 km/100 inh. | 1241 (39.0%) |
| NAT_GAS | 0.02 km/100 inh. | 2311 (72.5%) |
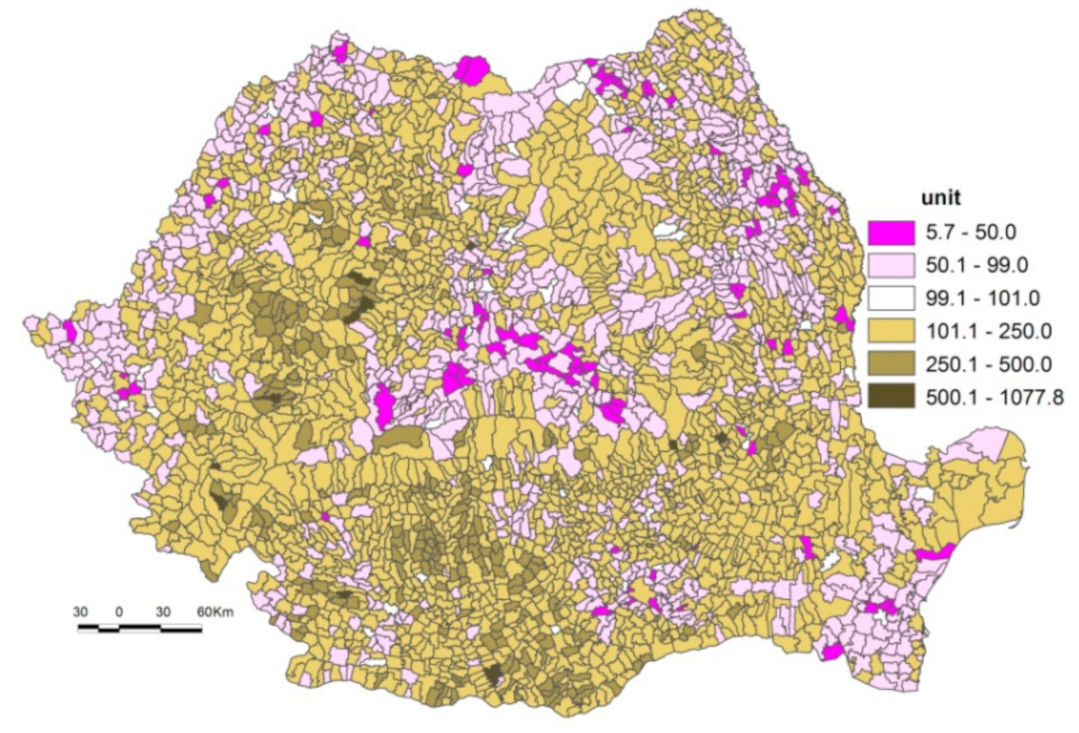
| POP-DENS | 93.1 inh./km2 | 2486 (78.1%) |
| POP-AGING | 112.2% | 1320 (41.5%) |
| ACCESS | 1.9 | 1386 (43.6%) |
| PROT-AREA | 0.16% | 1390 (43.7%) |
Publisher’s Note: MDPI stays neutral with regard to jurisdictional claims in published maps and institutional affiliations. |
© 2021 by the authors. Licensee MDPI, Basel, Switzerland. This article is an open access article distributed under the terms and conditions of the Creative Commons Attribution (CC BY) license (http://creativecommons.org/licenses/by/4.0/).
Share and Cite
Mitrică, B.; Şerban, P.-R.; Mocanu, I.; Damian, N.; Grigorescu, I.; Dumitraşcu, M.; Dumitrică, C. Developing an Indicator-Based Framework to Measure Sustainable Tourism in Romania. A Territorial Approach. Sustainability 2021, 13, 2649. https://doi.org/10.3390/su13052649
Mitrică B, Şerban P-R, Mocanu I, Damian N, Grigorescu I, Dumitraşcu M, Dumitrică C. Developing an Indicator-Based Framework to Measure Sustainable Tourism in Romania. A Territorial Approach. Sustainability. 2021; 13(5):2649. https://doi.org/10.3390/su13052649
Chicago/Turabian StyleMitrică, Bianca, Paul-Răzvan Şerban, Irena Mocanu, Nicoleta Damian, Ines Grigorescu, Monica Dumitraşcu, and Cristina Dumitrică. 2021. "Developing an Indicator-Based Framework to Measure Sustainable Tourism in Romania. A Territorial Approach" Sustainability 13, no. 5: 2649. https://doi.org/10.3390/su13052649
APA StyleMitrică, B., Şerban, P.-R., Mocanu, I., Damian, N., Grigorescu, I., Dumitraşcu, M., & Dumitrică, C. (2021). Developing an Indicator-Based Framework to Measure Sustainable Tourism in Romania. A Territorial Approach. Sustainability, 13(5), 2649. https://doi.org/10.3390/su13052649