Abstract
In disaster management, evacuation modeling is considered a useful visual tool to disaster managers for reviewing current evacuation strategies, estimating the ability of shelters to accommodate all evacuees, and developing evacuation route planning. Though there are several existing studies on evacuation modeling in the case of an earthquake, research that integrates road blockades into evacuation simulations is quite limited. From that viewpoint, this research aims to develop evacuation modeling with consideration of road blockades to simulate how residents move to evacuation centers (hereafter, shelters) through urban areas following an earthquake occurrence. The research also determines difficulties that residents may encounter under earthquake conditions, compared with normal conditions, corresponding to considering or not considering road blockades, respectively, such as having no access to shelters, taking longer routes instead of shortest routes, and so on. Debris from damaged buildings in an urban area is assumed as the main source of debris that would cause a road blockade. The model is applied to a case study of the Daitoku school district in Kanazawa city. According to simulated results, due to road blockades, occupants of many damaged buildings did not have access to shelters, and a lot of evacuees needed to move to shelters with longer routes instead of taking the shortest routes. Furthermore, the research results show the possibility of considering road blockades for improving current evacuation modeling and making evacuation simulations more realistic.
1. Introduction
“A mega-disaster will result in an enormous number of evacuees staying in evacuation centers for a significant long time”; this quote was taken from a lesson learned from the Great East Japan Earthquake 2011 [1]. As reported from that event, more than 470,000 people were evacuated to more than 2400 shelters and the region faced difficulties with goods deliveries to affected areas because of damaged roads [1]. Experiences from past earthquakes show that road blockades caused by debris from damaged buildings in urban areas prevented evacuees from moving to shelters. Therefore, in earthquake-prone countries like Japan, because “large earthquakes can happen anywhere at any time” [2], estimating the impact of a potential earthquake as well as shelter capacity, which refers to the number of evacuees that can be accommodated, is necessary and important for disaster damage mitigation. Accordingly, many evacuation models [3,4,5,6,7,8,9,10,11,12] have been developed and are useful tools for disaster managers for reviewing current evacuation strategies and estimating whether shelters can provide accommodation for all evacuees. However, evacuation models that integrate road blockades are limited in the literature. Since the current evacuation models do not consider road blockades, which means all obstacles on the roads leading to the shelters are ignored, these models cannot realistically simulate residents’ evacuation to shelters.
To date, several studies have focused on developing evacuation models in case of an earthquake [3,4,5,6,7,8,9,10,11,12]. These researchers have followed different approaches for simulating residents’ evacuation to shelters, such as network analysis for choosing the nearest shelter based on road networks [7,8,9,11], agent-based models that represent evacuees’ behaviors for choosing shelters [3,6], vehicle routing problems that simulate residents’ evacuation from local shelters to regional shelters [4] and route choice models based on available evacuation route sets (distance to available routes, length of available routes, level of congestion in available routes and the capacity of available exits) for simulating route choice behavior of pedestrians during an evacuation [5]. Umma and Luc [10] considered additional variables such as road congestion, number of evacuees based on their income, ethnicity, ownership, and age for calculating the number of evacuees and simulating residents’ evacuation. Ye et al. [12] used a distance-based function to help evacuees choose the best evacuation route from their home to evacuation shelters. However, these studies did not consider road blockades in the simulations. Therefore, they could not reflect the risks residents encounter during earthquakes in real life, such as not being able to find routes to main shelters. Moreover, they were also limited in their ability to support disaster managers in identifying portions of the road network as having high potential for loss connectivity caused by debris from damaged buildings, as well as evacuation route planning. Although Ertugay et al. [13] considered road blockades for estimating accessibility to shelters, the authors only examined main roads for evacuation routes and assumed travel by car for their accessibility assessment, and they did not calculate the number of evacuees at each shelter from the evacuation simulation nor estimate the shelter capacity.
Several studies have shown that road blockades, which are caused by damaged buildings, become obstacles for emergency activities, such as evacuation and rescue, in urban areas [7,14,15,16,17,18,19,20]. Goncalo et al. [21] pointed out that debris from damaged buildings are major inaccessibility sources in urban areas, while they accounted for 91% of road blockades in the 1995 Kobe earthquake [15]. Therefore, several methods were developed for identifying road blockades, with most considering the length of debris and road width as important factors [7,14,15,16,17,18,19].
From the above discussion, this research aims to develop an evacuation model that considers locations of road blockades as input data for simulating residents’ evacuation to main accommodation shelters (Kyotenhinanbasho in Japanese, hereafter, main shelters) following earthquakes using network analysis. Debris from damaged buildings is assumed to be the main source of road blockage. The buildings in this research include houses, apartments, houses with shops, apartments with shops, and houses with workplaces—the five main types of buildings in Japan [9]. Different from Ertugay et al. [13], the present study considers all roads in the case study for simulating evacuation from residents’ buildings to main shelters and estimated shelter capacity based on simulated results of the number of evacuees and planned capacity at each shelter. Apart from debris length, dependent on the damaged building’s height [16], and distance from these buildings to the road center, this study examines relative locations of these buildings (a single damaged building along a road and opposite/nearly opposite buildings along a road) for identifying a road blockade. Although Mizuta [15] showed some examples of how a single collapsed house and opposite collapsed houses could cause road blockades, the author assumed a debris length of 3 m for all houses.
Given the above viewpoints, considering road blockades in evacuation modeling plays a key role in improving current evacuation simulation. Therefore, the proposed simulation is more realistic, allows the residents to choose the best possible unblocked routes, and helps local governments and disaster managers to identify safe evacuation routes as well as routes with high potential to be blocked due to an earthquake. Moreover, the proposed evacuation simulation in this research, with considering road blockades, could contribute to the field of model development for evacuation planning.
The rest of this paper is organized as follows. In the next section, the reasons for choosing the Daitoku primary school district (hereafter, school district) as a case study and a brief introduction of the area are presented. Then, methodologies for identifying road blockades and evacuation simulation design are outlined in the next section. Simulated results on locations of road blockades and accessibility to main shelters are represented in the results and discussion section. Finally, we conclude this article and discuss possible future research.
2. Methodology
This research used results on seismic intensity prediction, forecasts of damaged buildings, and evacuees in Kanazawa City [9] as input data for the evacuation simulation. In more detail, the conventional method proposed by the National Research Institute for Earthquake Science and Disaster Prevention was applied to calculate seismic intensity and building damage was predicted based on the vulnerability function, which indicated a relationship between the ratio of damaged buildings according to different structural types, construction periods, and seismic intensity. The evacuee numbers, then, were forecast by considering the number of damaged buildings and the number of residents in those buildings [9]. In the present study, a method for road blockade prediction was presented by considering the relative locations of damaged buildings, distances between roadside building walls and the road center, and debris length from damaged buildings. Finally, evacuation simulations with and without considering road blockades were conducted to examine accessibility to shelters as well as shelter capacity. Figure 1 presents the flowchart of road blockade prediction and evacuation simulation with considering road blockades.
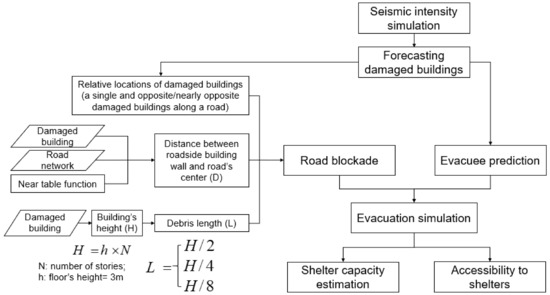
Figure 1.
Flowchart representing proposed methods for road blockade prediction and evacuation simulation when considering road blockade.
2.1. Study Area
Daitoku school district is one of 62 school districts in Kanazawa City, Ishikawa prefecture, Japan (Figure 2). In this area, the numbers of damaged buildings and evacuees (Table 1) are predicted to be the highest among school districts according to a report on shelter capacity estimation [22] and Nguyen et al. [9]. Two main earthquake evacuation shelters exist in the area, Daitoku and Kibikino primary schools, along with several emergency shelters [9], which are parks in the case study. Notably, according to Nguyen et al. [9], Daitoku school district may be subjected to an earthquake with a Japan Meteorological Agency intensity of 6 (shindo 6 in Japanese).
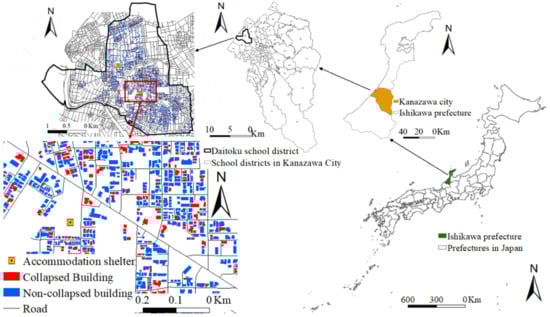
Figure 2.
Case study of Daitoku school district located in Kanazawa City, Ishikawa prefecture, Japan.

Table 1.
Predicted number of each kind of damaged building and evacuees in Daitoku school district [9,22].
In this research, building data include building type (house, apartment, house with a shop, apartment with a shop, and house with workplace), the number of stories, structural types (wood, reinforced concrete, steel, light-gauge steel), construction year, and building area [9]. An example of building information is presented in Figure 3.
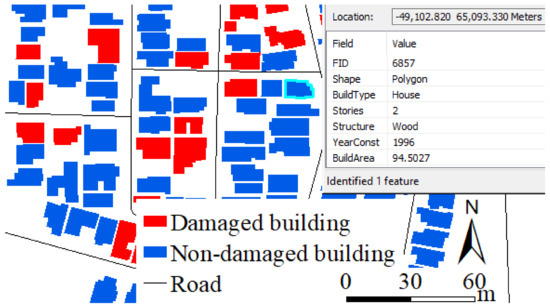
Figure 3.
An example of building information including building type, number of stories, structural type, construction year, area, location coordinates.
2.2. Data Collection
Most necessary data were derived from the Kanazawa local government, which included road networks and locations of main shelters, and the Daitoku school district. Moreover, data on damaged buildings—the most important data in this research—were collected from a report on shelter capacity estimation [19] and Nguyen et al. [9], while data on the location of road blockages were derived from Nguyen et al. [7]. Therefore, we assumed that we knew a distribution of damaged buildings as well as road blockages in Daitoku school district. All data, then, were processed in ArcGIS software for simulation. Detailed information about the type, source, attribute, and application of these data is presented in Table 2.
Table 2.
Collected data.
2.3. Method for Road Blockage Prediction
This research applied a method for identifying road blockades proposed by Nguyen et al. [7] that considered relative locations of damaged buildings, debris length, and distances from these buildings to the road center as main sources of information for road blockades in urban areas. The two relative locations included a single damaged building along a road and opposite or nearly opposite damaged buildings along a road. A road blockade, then, was identified by comparing the debris length of a damaged building with the distance from a roadside building wall to the road center.
In this research, the distance between a roadside building wall and the road center was calculated as the nearest distance from a damaged building to the road’s center line using the ‘near table’ function in the ArcGIS software. In reality, longer debris length indicates a higher probability that a road will be blocked. Furthermore, a greater number of road blockades means more residents will be affected. Therefore, we considered three cases of different debris lengths to present the impact of debris length on road blockades. The debris length was assumed as a dependent value of a building’s height and was equal to one-half, one-fourth, and one-eighth in each of the three proposed cases [16]. The formulas for calculating debris length are shown as Equations (1)–(3) [16].
L is the debris length of the damaged building (m); H is the height of the damaged building (m).
The first case with L = H/2 indicates the maximum value of debris length that results in the highest number of road blockades. The second and third cases showed medium and minimum debris length, respectively.
Moreover, for each type of relative location of damaged buildings, we utilized a separated method for identifying road blockades using simple functions in ArcGIS software, as represented in the following sections.
2.3.1. A Road Blockade Caused by Debris from a Single Damaged Building along a Road
As represented in Figure 4, a road blockade will occur if the debris length of the damaged building is more than or equal to two times the distance between the roadside building’s wall and the road’s center (Equation (4)). This case can be seen in real life when the road is narrow and adjacent to damaged buildings or the damaged buildings are tall.
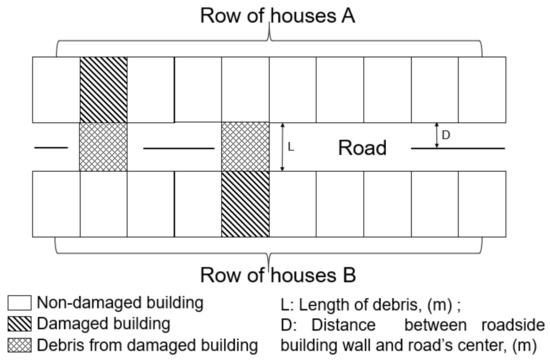
Figure 4.
Road blockade caused by debris from a damaged building along a road.
L is the debris length of the damaged building (m); D is the distance between roadside building wall and the road’s center.
The locations of road blockades can be detected based on the calculation results on the length of debris L and the distance between the roadside building’s wall and the road’s center, D. Again, all calculation processes were conducted using ArcGIS software.
2.3.2. A Road Blockade Caused by Debris from Opposite or Nearly Opposite Damaged Buildings along a Road
Figure 5 shows examples of relative locations of opposite or nearly opposite damaged buildings that can cause a road blockade after an earthquake. Concerning these damaged buildings, a road blockade occurs if the total debris length from the two damaged buildings is more than or equal to two times the distance between the roadside building’s wall and the road’s center (Equation (5)).
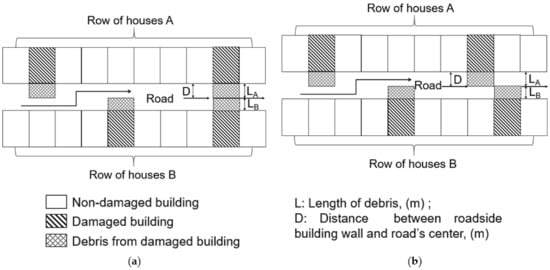
Figure 5.
Road blockade caused by debris from opposite (a) or nearly opposite (b) damaged buildings along a road.
Because it is difficult to identify which buildings are opposite or nearly opposite each other, we utilized the “buffer” function to identify a road blockade. Each damaged building would create a buffer zone equal to the debris length of that damaged building. From that viewpoint, if the buffer zones of opposite or nearly opposite damaged buildings overlay or nearly overlay each other, the intersection of the two buffer zones and the road will become a location of a road blockade (Figure 6).
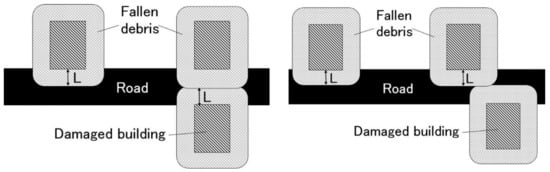
Figure 6.
An example of road blockade detection by using the buffer function. The buffer zone was created based on the debris length of damaged buildings.
2.4. Evacuation Simulation
After an earthquake, residents must be aware of the location of the main shelters in their school districts to which they are required to evacuate. According to the current policy on earthquake evacuation strategy, as well as a 2015 hearing with the Director of the Disaster Prevention Division in Kanazawa City, residents must first proceed to the nearest main shelters located in their school districts for evacuation. Further accommodation shelters in the same school district are made available for utilization if the capacity of the main shelters is exceeded.
This research conducted an evacuation simulation considering predicted locations of road blockades using network analysis in ArcGIS software. In the simulation, residents will go to the nearest main shelters based on the road network. If a road blockade occurs on the nearest route to the main shelters, residents must choose another route without a road blockade. The simulated results will show the number of evacuees at each main shelter, distances evacuees traveled to shelters, as well as highlight damaged buildings having no access to main shelters. Furthermore, this research also conducted a simulation that did not consider road blockades to compare the two conditions—with and without road blockades—to determine the difficulties earthquake evacuees face in comparison with a normal condition.
2.5. Shelter Capacity Estimation
Shelter capacity risk was estimated by considering the ratio between the number of simulated evacuees and the planned capacity of the main shelter [9,11,23]. The ratio indicates whether each main shelter has sufficient space to accommodate the number of evacuees remaining after the earthquake. If the ratio is equal to or less than 1, shelter capacity is sufficient; if the ratio exceeds 1, shelter capacity is insufficient. In this research, the number of evacuees in each main shelter was derived from the results of the abovementioned evacuation simulation, while planned capacity was calculated by dividing the planned area of each shelter by a ‘necessary living area per capita’ for evacuation living [9,11,23]. The values for necessary living area per capita differ among prefectures and cities in Japan as well as among countries in the world and range from 1.62 m2 to 4 m2 [1,9,11,23]. In Kanazawa City, this allowance is set at 3 m2 per evacuee [24]. We, therefore, assumed that each evacuee required a minimum of 3 m2 of space for accommodation in the main shelters to comply with the policy proposed by the local government of Kanazawa City.
3. Results and Discussion
According to the results, there were 166, 81, and 20 locations of road blockades in the three cases (Figure 7, Figure 8 and Figure 9 respectively), while the numbers of damaged buildings having no access to main shelters due to road blockades were 81, 20, and 9 (represented in Table 3 [7]). In this simulation, the damaged buildings were considered as ones having no access to main shelters if they are located between two locations of road blockage in the same road segment or located in a blind alley with a location of a road blockage. Furthermore, road segments with locations of road blockades were identified (Figure 10, Figure 11 and Figure 12). The results highlight longer debris length means a greater number of road blockades. Moreover, a greater number of road blockades indicates a higher probability that a road will be completely blocked.
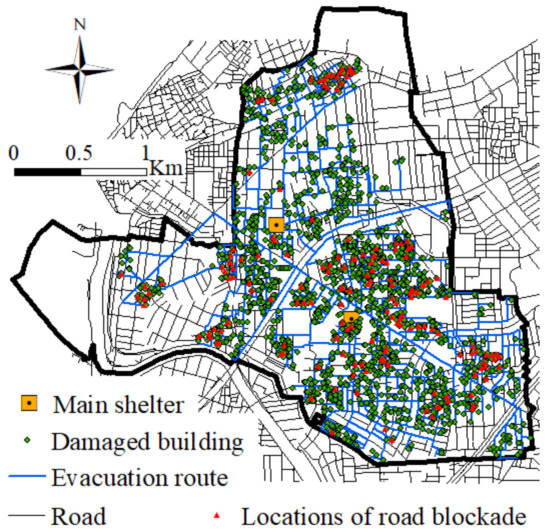
Figure 7.
Locations of road blockades in Case 1 with L = H/2.
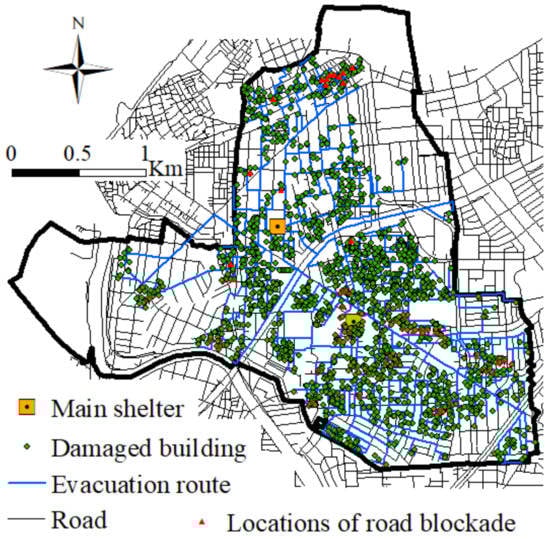
Figure 8.
Locations of road blockades in Case 2 with L = H/4.
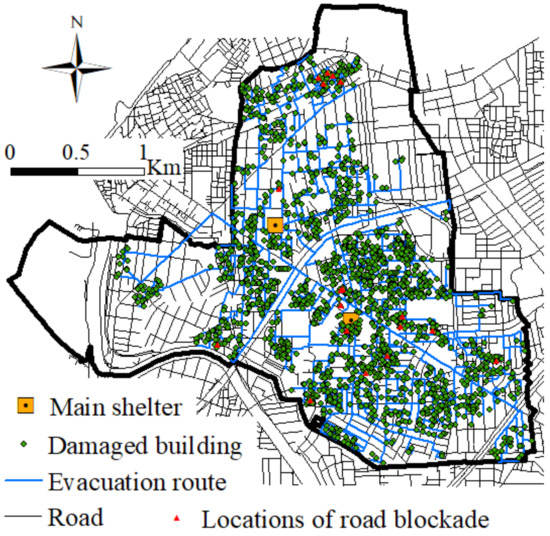
Figure 9.
Locations of road blockades in Case 3 with L = H/8.
Table 3.
Number of locations of road blockades and number of damaged buildings which do not have access to main shelters according to three cases of different debris lengths.
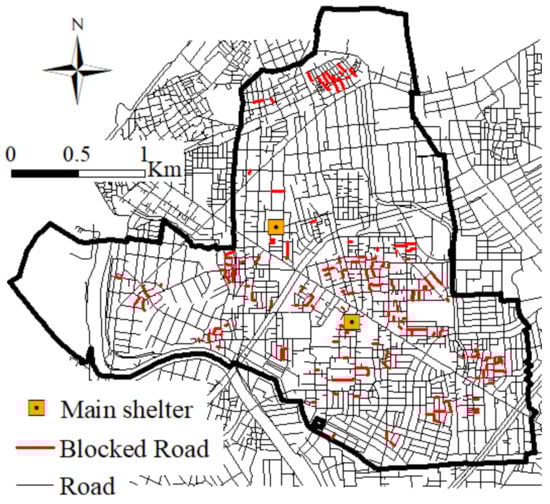
Figure 10.
Blocked roads in Case 1 with L = H/2.
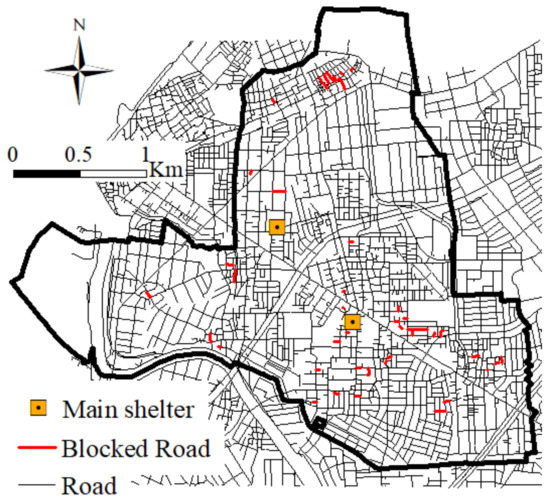
Figure 11.
Blocked roads in Case 2 with L = H/4.
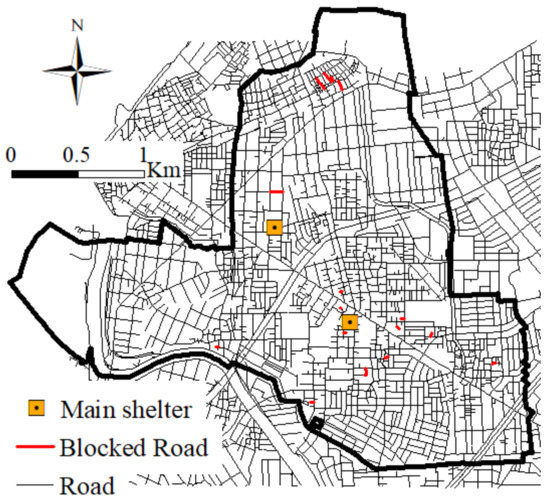
Figure 12.
Blocked roads in Case 3 with L = H/8.
Based on simulated results of evacuation distance that evacuees have travelled, four distance categories (0–500 m, 500–1000 m, 1000–2000 m, and over 2000 m) were considered to examine accessibility from evacuees’ houses to main shelters under earthquake and normal conditions. According to the results, the number of evacuees who had to travel less than 500 m to the main shelter decreased under the earthquake condition compared with the normal condition. In the earthquake condition, more locations of road blockades meant fewer evacuees. There are several reasons for these observations. Firstly, due to road blockades, many residents have to choose longer routes without road blockades instead of the shortest route to reach the main shelters (Figure 13). Secondly, many evacuees do not have access to main shelters (Figure 14) and more road blockades mean more people from damaged buildings do not have access to main shelters. In distance categories of 500–1000 m and 1000–2000 m, the number of evacuees increased under the earthquake condition compared with the normal condition, as well as in three varied cases of earthquake condition. Finally, the percentage of evacuees living in a distance category of over 2000 m did not change much across all conditions and cases. Figure 15; Figure 16 present the percentages of damaged buildings and evacuees according to the four distance categories.
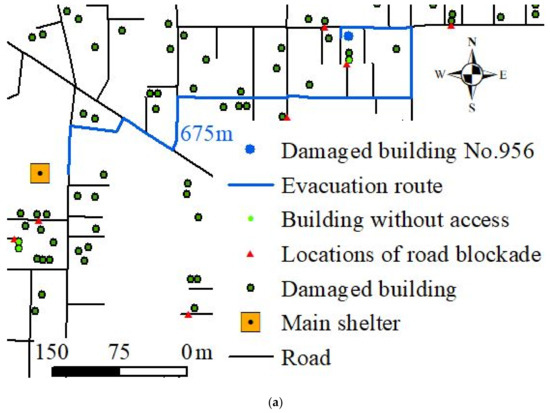
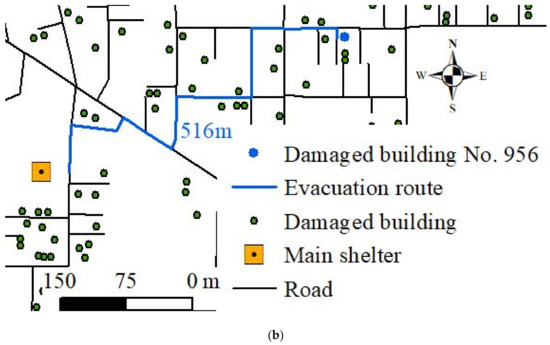
Figure 13.
Evacuation route from damaged building No. 956 to a shelter under earthquake (a) and normal conditions (b).
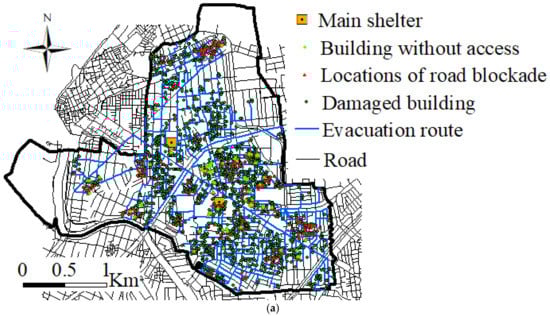
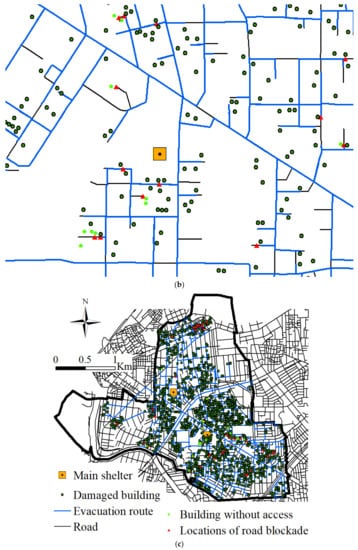
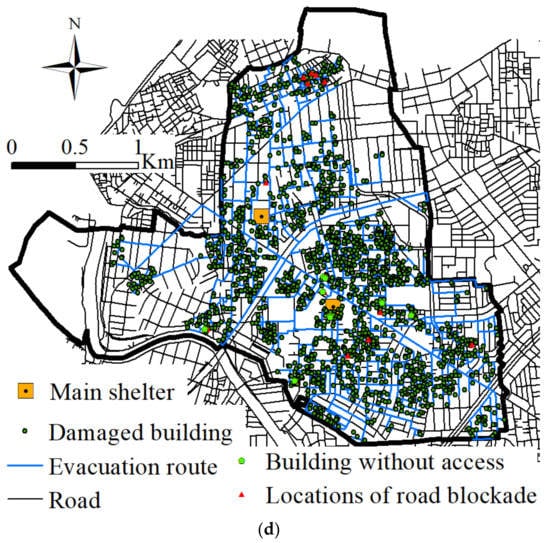
Figure 14.
Locations of road blockades (red triangles) and buildings having no access to shelters (light green dots) in three cases: L = H/2 (a); L = H/4 (c); and L = H/8 (d). Due to road blockades, some buildings have no access to main shelters (b).
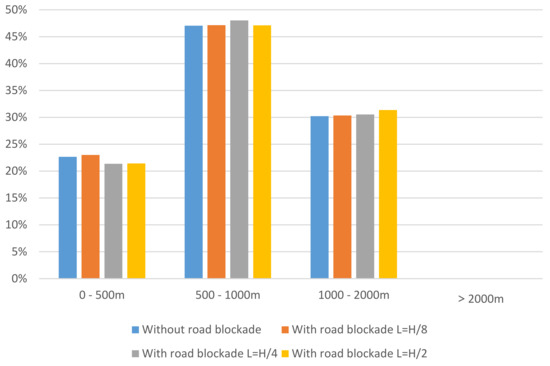
Figure 15.
Percentages of damaged buildings at each distance category under earthquake conditions (with considering road blockades) and in normal conditions (without considering road blockades).
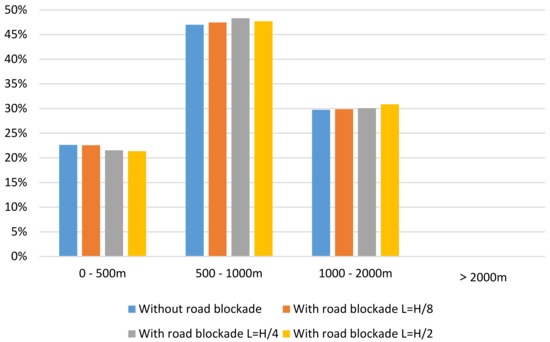
Figure 16.
Percentages of evacuees at each distance category under earthquake conditions (with considering road blockades) and in normal conditions (without considering road blockades).
From the above analysis, many residents encounter road blockades caused by debris from damaged buildings during an earthquake, which means they cannot find a route to the main shelters or must travel longer distances to shelters.
Furthermore, results of the numbers of evacuees at each main shelter, which are represented in Table 4, show that because some damaged buildings do not have access to main shelters due to road blockades, the number of evacuees at main shelters under an earthquake condition is less than that in a normal condition. Moreover, under an earthquake condition, a greater number of damaged buildings that do not have access to main shelters means there are fewer evacuees at main shelters. Along with a decrease of evacuees at main shelters, a ratio between the number of evacuees and planned capacity also decreased (Table 4 and Figure 17). The ratio between the number of evacuees and planned capacity at each main shelter shows that the number of evacuees at Daitoku primary school is over the planned capacity under an earthquake condition as well as a normal condition, which indicates this shelter’s capacity is insufficient. Kibikino primary school’s capacity is sufficient because the number of evacuees is less than the planned capacity. Therefore, excess evacuees at Daitoku primary school can go to Kibikino primary school for evacuation.
Table 4.
Results on the number of evacuees and the ratio of simulated evacuees and planned capacity at each main shelter with and without considering road blockades as well as in different cases of debris length.
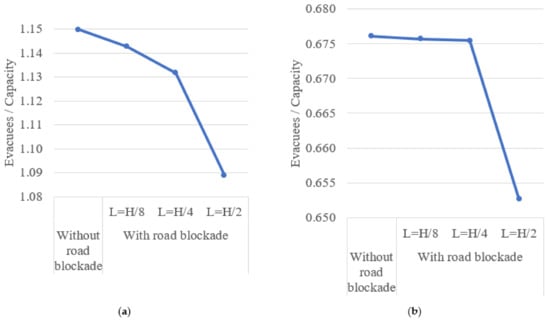
Figure 17.
The ratio between simulated evacuees and planned capacity at two main shelters in Daitoku school district: Daitoku primary school (a) and Kibikino primary school (b).
4. Conclusions
This research integrated road blockades caused by debris from damaged buildings into evacuation modeling for simulating residents’ evacuation to main shelters and estimating the accessibility as well as shelter capacity, both of which have not been included in previous literature. Furthermore, this research also highlighted difficulties that residents encounter under earthquake conditions compared with normal conditions when considering road blockades, such as needing to travel a longer route and having no access to shelters. The research results showed many residents of damaged buildings could not access shelters and this was exacerbated by an increase in the number of road blockades. Moreover, an increase in road blockades also meant many residents had to travel longer distances to evacuation shelters. Since residents of many damaged buildings did not have access to main shelters, the ratio between simulated evacuees and planned capacity at main shelters also decreased under earthquake conditions compared with a normal condition. Therefore, a decrease in road blockades is very necessary to mitigate these difficulties by planning a short-term strategy to reinforce vulnerable buildings and a long-term strategy to construct stronger buildings, especially houses, the most damaged buildings due to their popularity, wooden construction, and early construction period in this study. Moreover, based on the difference between earthquake and normal conditions, the proposed model considering road blockades can reflect what happens in real life after an earthquake. In other words, considering road blockades is important and could improve current evacuation models by making them more realistic under earthquake conditions. Therefore, the proposed model may become a useful tool for supporting disaster managers in reviewing current evacuation shelter planning as well as thinking of evacuation route planning.
Although the proposed model showed advantages over previous models, there are also limitations to this model. First, only road blockades caused by debris from damaged buildings were considered as obstacles that prevent residents from moving to evacuation shelters. Second, the model did not consider a case of tsunami occurrence following the earthquake occurrence, although the case study is near the West Sea of Japan and may be affected by a tsunami. This case will cause more danger to residents’ life and make shelter evacuation more difficult because some roads may be blocked by water and other debris different from those of damaged buildings. Moreover, the residents have to evacuate immediately comparing with the case of earthquake occurrence only. Therefore, for further research, an evacuation modeling in case of the effect of earthquake and tsunami and investigation on more sources causing road blockades, such as ground failure, landslides should be conducted.
Author Contributions
Z.-j.S. and D.-T.N. conceptualized the main research purpose of the paper. M.-H.T. and K.S. prepared the data, tables, and figures. All authors have read and agreed to the published version of the manuscript.
Funding
This work was funded by JSPS KAKENHI; Grant-in-Aid for Scientific Research (C) Grant Numbers 20K03138, 19K04750, 18K04523.
Institutional Review Board Statement
Not applicable.
Informed Consent Statement
Not applicable.
Data Availability Statement
The data presented in this study are available on request from the corresponding author.
Conflicts of Interest
The authors declare no conflict of interest.
References
- Ranghieri, F.; Ishiwatari, M. Learning from Megadisasters–Lessons from the Great East Japanese Earthquake; Evacuation Center Management; The World Bank: Washington, DC, USA, 2014; Chapter 18; pp. 155–159. [Google Scholar]
- Nakanishi, H. Lessons in Managing Disasters from Kumamoto. East Asia Forum. 2016. Available online: http://www.eastasiaforum.org/2016/06/15/lessons-in-managing-disasters-from-kumamoto/ (accessed on 14 February 2016).
- Gabriele, B.; Marco, D.; Enrico, Q.; Luca, S. An agent-based model for earthquake pedestrians’ evacuation simulation in urban scenarios. Transp. Res. Procedias 2014, 2, 255–263. [Google Scholar] [CrossRef]
- Elham, P.; Mahmoud, R.D.; Parham, P.; Mir, A.M. Dynamic evacuation routing plan after an earthquake. Nat. Hazards Rev. 2015, 16, 04015006. [Google Scholar] [CrossRef]
- Han, Y.B.; Liu, H.; Moore, P. Extended route choice model based on available evacuation route set and its application in crowd evacuation simulation. Simul. Model. Pract. Theory 2017, 75, 1–16. [Google Scholar] [CrossRef]
- Marco, D.; Luca, S.; Enrico, Q.; Gabriele, B. Agent-based model for earthquake pedestrians’ evacuation in urban outdoor scenarios: Behavioural patterns definition and evacuation paths choice. Saf. Sci. 2014, 62, 450–465. [Google Scholar] [CrossRef]
- Nguyen, D.T.; Shen, Z.J. Estimating road blockade caused by earthquake damaged buildings’ debris using GIS–A case study of Daitoku school district. In Proceedings of the International Joint Workshop on Spatial Planning for Disaster Prevention and Sustainable Development, Kanazawa City, Japan, 5–7 December 2016. [Google Scholar]
- Nguyen, D.T.; Shen, Z.J.; Sugihara, K. Comparative study on going to evacuation shelters in school districts and the nearest shelter in the city-A case study of Kanazawa city, Japan. Disaster Adv. 2017, 10, 21–30. [Google Scholar]
- Nguyen, D.T.; Shen, Z.J.; Honda, K.; Sugihara, K.; Nishino, T.; Truong, M.H. A GIS-based model for integrating risk estimations of residential building damage and shelter capacity in the case of earthquakes. Nat. Hazards Rev. 2020, 21, 04019016. [Google Scholar] [CrossRef]
- Umma, T.; Luc, C. Development of evacuation models for moderate seismic zones: A case study of Montreal. Int. J. Disaster Risk Reduct. 2016, 16, 167–179. [Google Scholar] [CrossRef]
- Xu, W.; Norio, O.; Michinori, H.; Yukiko, T. A Model Analysis Approach for Reassessment of the Public Shelter Plan Focusing both on Accessibility and Accommodation Capacity for Residents-Case Study of Nagata Ward in Kobe City, Japan. J. Nat. Disaster Sci. 2008, 28, 85–90. [Google Scholar] [CrossRef][Green Version]
- Ye, M.W.; Wang, J.; Huang, J.; Xu, S.Y.; Chen, Z.L. Methodology and its application for community-scale evacuation planning against earthquake disaster. Nat. Hazards 2012, 61, 881–892. [Google Scholar] [CrossRef]
- Ertugay, K.; Argyroudis, S.; Duzgun, H.S. Accessibility modelling in earthquake case considering road closure probabilities: A case study of health and shelter service accessibility in Thessaloniki, Greece. Int. J. Disaster Risk Reduct. 2016, 17, 49–66. [Google Scholar] [CrossRef]
- Anastassiadis, A.J.; Argyroudis, S.A. Seismic vulnerability analysis in urban systems and road networks. Application to the city of Thessaloniki, Greece. Int. J. Sustain. Dev. Plan. 2007, 2, 287–301. [Google Scholar] [CrossRef]
- Mizuta, T. Development of earthquake risk assessment system using GIS for snow country. In Proceedings of the 15th World Conference on Earthquake Engineering, Lisbon, Portugal, 24–28 September 2012. [Google Scholar]
- Nishino, T.; Tanaka, T.; Hokugo, A. An evaluation method for the urban post-earthquake fire risk considering multiple scenarios of fire spread and evacuation. Fire Saf. J. 2012, 54, 167–180. [Google Scholar] [CrossRef]
- Pitilakis, K.; Anastasiadis, A.; Kakderi, K.; Alexoudi, M.; Argyroudis, S. The role of soil and site conditions in the vulnerability and risk assessment of lifelines and infrastructures. The case of Thessaloniki (Greece). In Proceedings of the International Conference of Recent Advances in Geotechnical Engineering and Soil Dynamics, San Diego, CA, USA, 24–29 May 2010. [Google Scholar]
- Costa, C.; Figueiredo, R.; Silva, V.; Bazzurro, P. Application of open tools and datasets probabilistic modeling of road traffic disruptions due to earthquake damage. Earthq. Eng. Struct. Dyn. 2020, 49, 1236–1255. [Google Scholar] [CrossRef]
- Argyroudis, S.; Selva, J.; Gehl, P.; Pitilakis, K. System seismic risk assessment of road networks considering interactions with the built environment. Comput. -Aided Civ. Infrastruct. Eng. 2015, 30, 524–540. [Google Scholar] [CrossRef]
- El-Maissi, A.M.; Argyroudis, S.A.; Nazri, F.M. Seismic vulnerability assessment methodology for roadway assets and networks: A state-of-the-art review. Sustainability 2021, 13, 61. [Google Scholar] [CrossRef]
- Goncalo, C.; Carlos, O.; Monica, A.F.; Francisco, S. Assessing urban road network seismic vulnerability: An integrated approach. In Proceedings of the 15th World Conference on Earthquake Engineering, Lisbon, Portugal, 24–28 September 2012. [Google Scholar]
- Urban Planning laboratory, Kanazawa University (UPLKU), Japan. Report on Shelter Capacity and Accessibility Estimation during the Emergence Stage of Rescue and Relief in Kanazawa City; Kanazawa University: Kanazawa, Japan, 2015. (In Japanese) [Google Scholar]
- Chou, J.S.; Ou, Y.C.; Cheng, M.Y.; Cheng, M.Y.; Lee, C.M. Emergency shelter capacity estimation by earthquake damage analysis. Nat. Hazards 2013, 65, 2031–2061. [Google Scholar] [CrossRef]
- Kanazawa City Homepage. Accommodation Shelter Capacity. Available online: http://www4.city.kanazawa.lg.jp/data/open/cnt/3/14047/1/244s-4.pdf (accessed on 14 February 2015). (In Japanese).


Publisher’s Note: MDPI stays neutral with regard to jurisdictional claims in published maps and institutional affiliations. |
© 2021 by the authors. Licensee MDPI, Basel, Switzerland. This article is an open access article distributed under the terms and conditions of the Creative Commons Attribution (CC BY) license (http://creativecommons.org/licenses/by/4.0/).